 Open Access Article
An electrochemical method for measuring magnetic flux density
Haiying Dongab,
Xin Liab,
Xinhe Xuab and
Zhanpeng Lu *ab
*ab
aInstitute of Materials, School of Materials Science and Engineering, Shanghai University, Shanghai 200072, China. E-mail: zplu@t.shu.edu.cn
bState Key Laboratory for Advanced Special Steels, Shanghai 200072, China
First published on 16th March 2023
Abstract
A magneto-electrochemical method is designed and validated for measuring magnetic flux density. This method is based on the correlation of the change of open circuit potential to the flux density of an applied magnetic field. Electrochemical systems with iron in ferric solutions are selected for demonstrating the validity of the proposed methods. Magnetic flux density can be measured with this method by voltmeter without using a Tesla meter.
1. Introduction
Magnetism has been studied and explored for a long time.1–3 In 1600, Gilbert's book “De Magnete” initiated magnetism as a scientific academic field. In the early 19th century, a series of milestone discoveries led to the formation of the modern magnetic theory. In the 1860s, Maxwell integrated the equations of classical electricity and magnetism to Maxwell's equations, and developed Maxwell's electromagnetic field theory that unified electrical, magnetic, and optical theories. From the concepts of physics, the field that transfers the magnetic force between objects is considered as the definition of the magnetic field. Magnetic fields are reflected in all aspects of the world and life, and have been found in various applications such as large-scale entertainment and leisure equipment, traffic workpieces, aerospace workpieces, medical equipment and other undertakings.4 Magnetic flux density (MFD, represented by symbol B) is one of the important parameters for the quantitative characterization of magnetic field. The measurement of MFD is crucial for scientific research and engineering applications. There are many physical-based methods for measuring MFD, such as the rotating and vibrating coils and the fluxmetric method including flux meter coils, the flux-ball, the ballistic galvanometer, and electronic integratiors.5,6 The measurements of magnetic flux density (MFD) are based on some principles such as Faraday's law of electromagnetic induction, Hall effect, magnetoresistance effect, magnetic resonance, magneto-optic Kerr effect, magnetostrictive effect, magnetic quantum tunneling effect, and superconductivity effect.5 Based on these theories and methods, many devices and equipment have been developed to measure MFD.Representing all instruments for measuring MFD, magnetometers can be divided into two main types, one type for time-independent magnetic field such as constant magnetic field and the other type for time-dependent magnetic field such as alternating magnetic field. According to the principles, magnetometers for constant magnetic field7–11 include fluxgate magnetometer, Hall sensor, anisotropic magneto-resistive sensor (AMR), giant magneto impedance (GMI), nuclear magnetic resonance field meter, etc. Magnetometers for measuring alternating magnetic field12–16 include the superconducting quantum interference device (SQUID), induction coil magnetometer, etc. These magnetometers mentioned above have their advantages and some limitations.
Fluxgate magnetometer is designed based on the Faraday's law of electromagnetic induction and has the characteristics of simple, small, low power consumption, high sensitivity with the target magnetic field ranging from 1 pT to 10 nT. Generally, the volume of fluxgate magnetometer is large and its response speed is slow. Fluxgate magnetometer is suitable for measuring constant magnetic field or slowly changing weak magnetic field. It has been widely used for industrial detection, geomagnetic measurement, navigation system, military engineering.17,18 Hall sensor is small and has fast response speed but has low sensitivity.19–22 AMR has the advantages of noncontact operation, easy maintenance, and robustness to contamination23,24 and they are much more sensitive than any semiconductor sensor,25 which is usually used to measure MFD of 0.2 mT to 2.5 mT. SQUID uses the principle of Josephson effect to measure the magnetic field. SQUID has been used for measuring alternating magnetic field with high sensitivity via its response to the change of MFD. SQUID has been widely used in scanning SQUID microscopy, medical diagnostics and quantum computing.26–28
These methods for measurement of magnetic flux density require Gauss meter, thus it is more complex for measuring the MFD than potential. If there is method to measure the MFD by potentiometer, it will make the measurement for MFD more convenient and can be applied to more fields.
The electrochemical parameters in the electrochemical system are influenced by the magnetic field and a lot of research has been studied widely before, likely the open circuit potential of iron or other metals in aqueous solutions would shift under magnetic field.29–35 Due to the modulation of magnetic field on electrode kinetics, mass transport, and deposition morphologies, its effects on electrochemical reactions have been formulated by five external forces acting on active substances, namely magnetic gradient force, Lorentz force, paramagnetic force, magnetic damping force and electrokinetic shear stress.35 Among them, magnetohydrodynamic (MHD) effect36–39 and magnetic field gradient force effect (MFGF)36,40,41 have been used to interpret the mechanism of the influence of magnetic field on electrochemical behaviors of corrodible metals in aqueous solutions. Some electrochemical parameters of a specific electrochemical system will be affected by the MFD and these effects are related to MFD. For instance, Lu et al. studied the relationship of the magnetic field with the open circuit potential as well as the cathodic diffusion current and gave relevant electrochemical kinetics explanations.32 These works enlighten us on the possibility of obtaining a standard curve by designing a suitable system and measuring the changes of specific electrochemical parameters to MFD of the applied magnetic fields. Then, the unknown MFD can be obtained by the measured changes of the electrochemical parameter based on the standard curves.
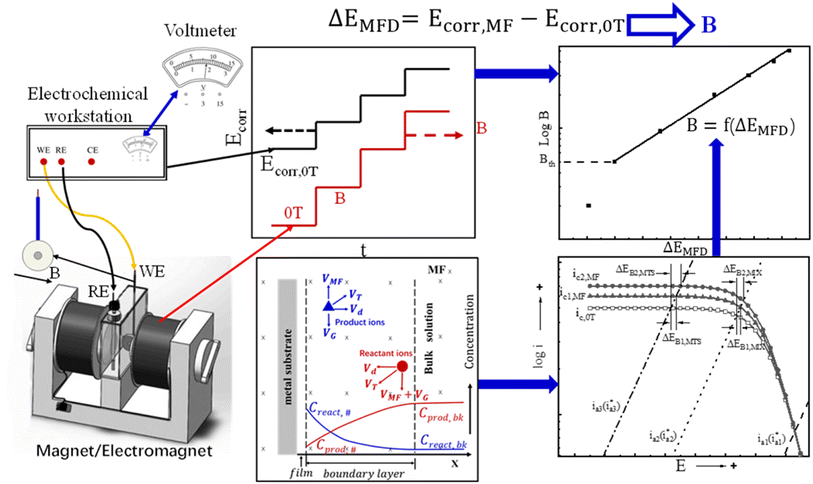
Based on the magneto-electrochemical theory and the previous experimental investigation on the effect of magnetic field on corrosion behavior of iron in various corrosive solutions,29–33 an electrochemical method is designed and validated here for measuring MFD by correlating the change of open circuit potential to the magnitude of MFD, which is defines as ΔEMFD, as shown in eqn (1). The motivation of this design is to establish a novel and convenient method to measure magnetic flux density using a voltmeter instead of a Tesla meter. This method is inspired by the previous research results on the magnetic field effect on electrochemical corrosion: the open circuit potential of iron in the solutions containing ionic cathodic depolarizers shifts significantly in the noble direction after the application of magnetic field, and the value of the potential shift increases with the increase of magnetic flux density. According to the reverse thinking, if the correlation standard curve between the potential shift of iron and the magnetic flux density of the applied magnetic field is established, then the numerical value of the magnetic flux density can be determined by measuring the change of the open circuit potential of iron caused by any magnetic flux density. This test does not require magnetic measurements, and only potential measurements are necessary.
| ΔEMFD = Ecorr,MFD − Ecorr,0T | (1) |
The schematic diagram is shown in Fig. 1. During the electrochemical test, the electrochemical sample and the magnetic field are placed vertically and horizontally respectively. The direction of MFD is parallel to the working surface of sample. The values of ΔEMFD after applying magnetic field at various flux densities are recorded, and the ΔEMFD vs. B standard curves can be established. According to these standard curves, a specific MFD can be measured by its corresponding ΔEMFD. The objective of this work is to establish the standard relationship curve between the magnetic flux density and the change of open circuit potential induced by magnetic field for the working electrode in specific solutions, represented by B = f(ΔEMFD) function. The value of an unknown magnetic flux density B can be determined by putting the measured ΔEMFD into the standard B = f(ΔEMFD) curve. Various standard B = f(ΔEMFD) curves are obtained for validating the proposed method in this work. In Fig. 1, the electrochemical workstation used in this work is simply used here as a voltmeter with high input resistance and data-log system for measuring and recording the open circuit potential and its response to the magnetic field of various flux densities. According to the developed method, MFD can be quantitatively measured simply by a voltmeter.
2. Experimental methods
The electrochemical tests were carried out in a two-electrode electrochemical system consisting of working electrode and reference electrode. The reference electrode was saturated calomel electrode (SCE) and the working electrode was industrial pure iron with a purity of 99.5%. The working surface was circular with 5 mm in diameter and exposed to the test solutions. Other non-working surfaces are sealed with epoxy resin insulators. The working electrode surface was at first ground with abrasive paper up to 1500 # grit and fine-polished with metallographic sandpaper of W5, then rinsed in ethanol and acetone in turn before the electrochemical measurements. The iron-working electrode surface was placed vertically. The magnetic field generated by an electromagnet was placed horizontally. The direction of magnetic flux density was parallel to the working electrode surface. The magnetic flux intensities were adjusted to 0.02 T, 0.05 T, 0.1 T, 0.2 T, 0.3 T, 0.4 T and 0.5 T. The test solutions were X mol L−1 Fe2(SO4)3 solutions (X = 0.04, 0.08, 0.12, 0.16) and Y mol L−1 FeCl3 solutions (Y = 0.08, 0.16, 0.24, 0.32) prepared with analytical grade Fe2(SO4)3 or FeCl3 as the sources of ferric ions as well as deionized water. The approach proposed in this work for measuring magnetic flux density is based on the shift of the open circuit potential of the working electrode as the response to the applied magnetic field, according to the mixed potential theory in the fundamental electrode kinetics.42 The principle of designing the working electrode/solution system is: the rate-determining step for the anodic reaction on the working electrode should be electron-transfer step, and the rate of the cathodic reaction on the working electrode should be purely or partly controlled by mass-transport step. Under these conditions, applying a magnetic field would modify the mass transport of the cathodic depolarizers from the bulk solution to the electrode interface therefore change the cathodic reaction rate. The open circuit potential would shift after applying magnetic field, and the magnitude of this shift is dependent on the magnetic flux density. By establishing the calibration equation correlating the shift of open circuit potential to the magnetic flux density, the unknown magnetic flux density can be determined by the measurement of the shift of open circuit potential. Any corrosion system with the anodic reaction rate determined by electron transfer step as well as the cathodic reaction rate partly or fully determined by mass transport step of ionic depolarizers can be used for achieving the objective of this manuscript. Electrochemical systems with iron in solutions with ferric ions such as FeCl3 and Fe2(SO4)3 in the solutions or in the solutions with dichromate ions14,15 have been found to meet the above requirements.The working electrode was initially immersed in a Fe2(SO4)3 or FeCl3 solution containing ferric ions as depolarizers. The magnetic field was imposed quickly after the open circuit potential reached a steady or quasi-steady value under 0 T, and then observing and recording the change of open circuit potential due to the magnetic field. The magnetic field was applied to the electrochemical system at various magnetic flux densities via a stepwise ascending mode. The open circuit potential was recorded and the steady state or quasi-steady state under each MFD was used in constructing the B–ΔEMFD diagram.
According to the measured open circuit potential under various MFD, B (logarithmic scale) vs. ΔEMFD (X-axis) curve was generated and linearly fitted. ΔEMFD is expressed by eqn (1). According to the standard curves by linear fitting, the value of MFD can be determined according to the change of open circuit potential by magnetic field, as represented by ΔEMFD.
3. Results
3.1 The open circuit potential under various MFDs
The values of Ecorr for iron in Fe2(SO4)3 and FeCl3 solutions with or without magnetic fields were obtained and summarized in Fig. 2 and 3. Under 0 T, Ecorr became stable after a period of immersion in Fe2(SO4)3 and FeCl3 solutions. The time required for the working electrode to reach a steady state or quasi-steady state was shorter with increasing Fe3+ concentration under 0 T. The transient change of Ecorr after imposing the magnetic field could be seen from the recorded Ecorr vs. time curves. Ecorr shifted to the noble direction quickly after applying the magnetic field, decreased subsequently, and finally reached a steady or quasi-steady value. The response of Ecorr to magnetic field was very rapid. The change of Ecorr induced by magnetic field increased with increasing MFD.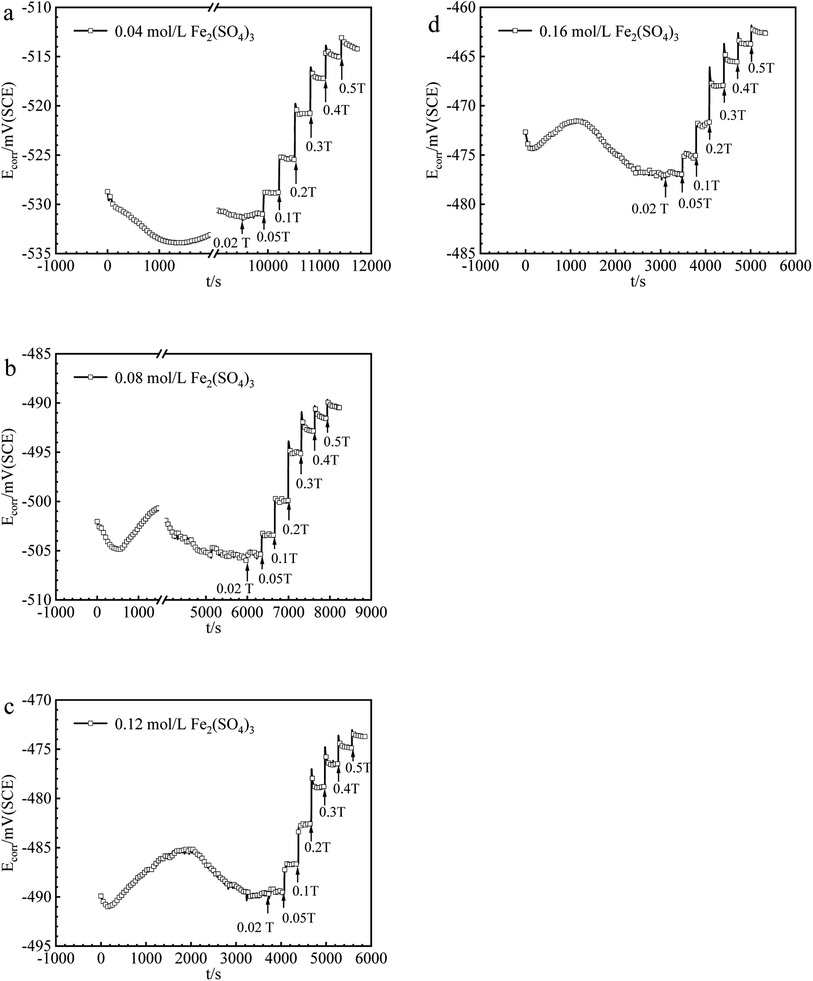 | ||
| Fig. 2 The values of Ecorr for iron in (a) 0.04, (b) 0.08, (c) 0.12, (d) 0.16 mol per L Fe2(SO4)3 solutions under various MFDs. | ||
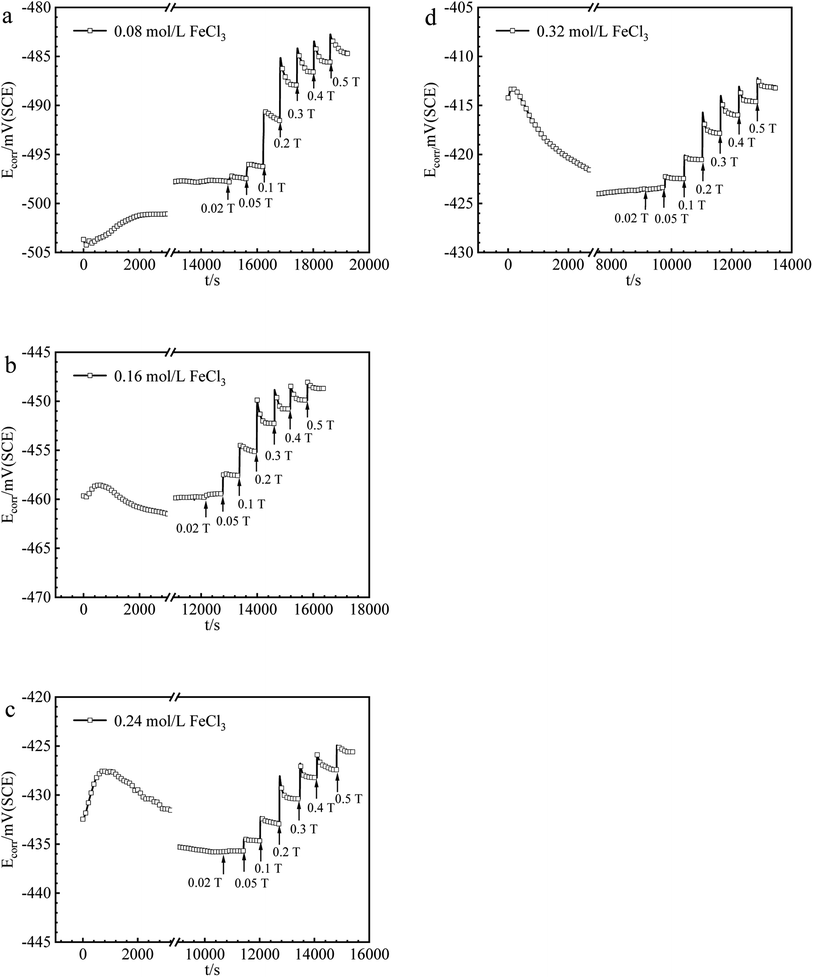 | ||
| Fig. 3 The values of Ecorr for iron in (a) 0.08, (b) 0.16, (c) 0.24, (d) 0.32 mol per L FeCl3 solutions under various MFDs. | ||
3.2 ΔEMFD induced by various MFDs
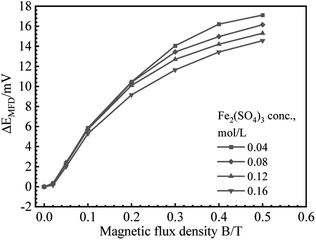
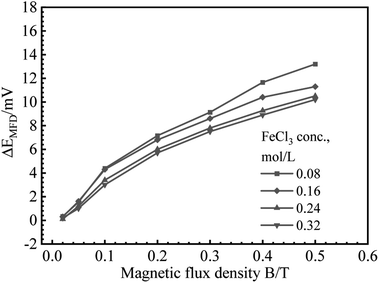
B vs. ΔEMFD curves are summarized in Fig. 4 and 5. In the range of MFD from 0.02 T to 0.5 T, the change of Ecorr increases with the increase of MFD in Fe2(SO4)3 or FeCl3 solutions. The increasing amplitude of the change of Ecorr induced by magnetic field shows a trend of first increasing and then decreasing. For each solution in this paper, the increasing amplitude of Ecorr induced by magnetic field of 0.2 T was the biggest. The response of Ecorr to magnetic field was more obvious with the increase of magnetic field. Whether in Fe2(SO4)3 or FeCl3 solutions, the change of Ecorr was more sensitive to the MFD in low concentration solution.3.3 Cathodic polarization curves under 0 T and 0.4 T
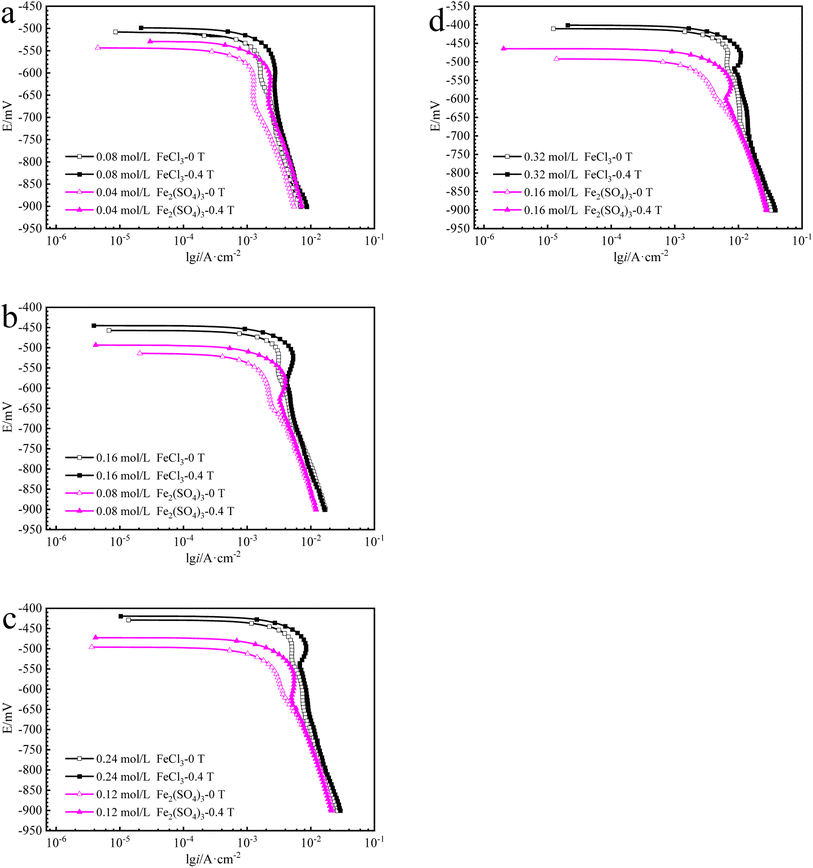
The cathodic polarization curves for iron in Fe2(SO4)3 and FeCl3 solutions are summarized in Fig. 6. The cathode current density platform with diffusion control characteristics appears in the solution with lower ferric ions of 0.08 mol L−1. And the diffusion control characteristics also appear in the solution with other ferric ions concentration, but the current density platform is not obvious. Under 0 T or 0.4 T, the limiting current density for iron in a Fe2(SO4)3 solution was lower than that in the FeCl3 solution for the same nominal ferric ion concentration of 0.08 mol L−1, as shown in Fig. 6a. Similar trends were found in other solutions of other nominal ferric concentrations under 0 T. The enhancement factor of cathodic limiting current density by magnetic field is expressed by eqn (2). For the nominal ferric concentration of 0.08 mol L−1, there are δMFD = 1.67 in 0.08 mol per L FeCl3 solution and δMFD = 1.83 in 0.04 mol per L Fe2(SO4)3 solution, and similar trends were observed in solutions with other nominal concentrations of ferric ions.
 | (2) |
 under magnetic field.
4. Discussion
As schematically shown in Fig. 1, for iron in ferric sulfate or ferric chloride solutions, it is assumed that the rate of anodic reaction rate is completely controlled by the charge-transfer step (ETS), the variation of anodic reaction induced by magnetic field can be ignored. Then the effect of magnetic field on Ecorr would be dependent only on the type of rate controlling step for the cathodic reaction under the open circuit state.If the cathodic reaction rate under the open circuit state is absolutely controlled by ETS, ΔEMFD can be expressed by eqn (3). ic@ia1 is used to represent the coupling of the cathodic reaction line ic and anodic reaction ia1. Other combinations of cathodic and anodic reactions follow this definition.
| (ΔEMFD)ic@ia1 = 0 | (3) |
If the cathodic reaction rate is absolutely controlled by mass transport step (MTS), ΔEMFD can be expressed by eqn (4).
 | (4) |
If charge-transfer step ETS and mass transport step MTS both participate in controlling the cathodic reaction rate, which is defined as mixed type control, which is defined as mixed type control, then analytical form of ΔEMFD would not be simple. By considering eqn (3) and (4), there is,
 | (5) |
The form of  would be complex. If taking the proposed formulation by Aaboubi et al.39 for the limiting current density, there are
  and
and  where mb and mc are constants. Linear (ΔEMFD)ic@ia3 vs. log
![[thin space (1/6-em)]](https://www.rsc.org/images/entities/char_2009.gif) B relationship is expected, as schematically shown in Fig. 1. It is not intended to solve (ΔEMFD)ic@ia2 analytically here, while the approximate form of (ΔEMFD)ic@ia2 can be deduced to be close to (ΔEMFD)ic@ia3. Based on these theories, the measured Ecorr or ΔEMFD data as function of B are analyzed by linear fit of the experimental data in Fig. 4 and 5. The fitting results of for B vs. ΔEMFD curves (exclude the first point) are summarized in Fig. 7 and 8, exhibiting quasi-linear relationship between log
B relationship is expected, as schematically shown in Fig. 1. It is not intended to solve (ΔEMFD)ic@ia2 analytically here, while the approximate form of (ΔEMFD)ic@ia2 can be deduced to be close to (ΔEMFD)ic@ia3. Based on these theories, the measured Ecorr or ΔEMFD data as function of B are analyzed by linear fit of the experimental data in Fig. 4 and 5. The fitting results of for B vs. ΔEMFD curves (exclude the first point) are summarized in Fig. 7 and 8, exhibiting quasi-linear relationship between log![[thin space (1/6-em)]](https://www.rsc.org/images/entities/char_2009.gif) B and ΔEMFD for all the experimental data by excluding the first point at B = 0.02 T. The relationship can be expressed by:
B and ΔEMFD for all the experimental data by excluding the first point at B = 0.02 T. The relationship can be expressed by:
log![[thin space (1/6-em)]](https://www.rsc.org/images/entities/char_2009.gif) B = m × EMFD + n B = m × EMFD + n
| (6) |
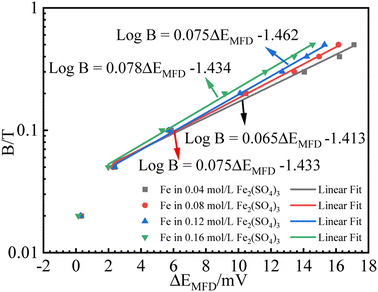 | ||
| Fig. 7 Fitting results for B (logarithmic scale) vs. ΔEMFD curve for iron in Fe2(SO4)3 solutions with various ferric ion concentrations. | ||
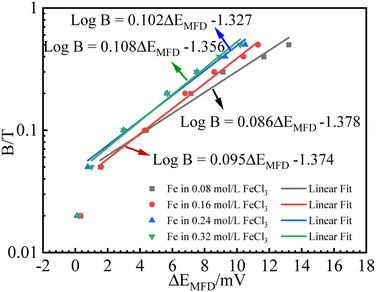 | ||
| Fig. 8 Fitting results for B (logarithmic scale) vs. ΔEMFD curve for iron in FeCl3 solutions with various ferric ion concentrations. | ||
The first point clearly deviates from the log![[thin space (1/6-em)]](https://www.rsc.org/images/entities/char_2009.gif) B vs. ΔEMFD linear line obtained by the fitting formula. In other words, this method of measuring the MFD by electrochemical method is feasible when the magnetic field strength is greater than 0.05 T in this paper. The goodness of fit in terms of R for various data sets are also summarized in Fig. 7 and 8. The values of R from the fitted data without the first point are higher than 0.98, showing the validity of the fitting relationship. The deviation between the experimental data at low B and the fitted linear line log
B vs. ΔEMFD linear line obtained by the fitting formula. In other words, this method of measuring the MFD by electrochemical method is feasible when the magnetic field strength is greater than 0.05 T in this paper. The goodness of fit in terms of R for various data sets are also summarized in Fig. 7 and 8. The values of R from the fitted data without the first point are higher than 0.98, showing the validity of the fitting relationship. The deviation between the experimental data at low B and the fitted linear line log![[thin space (1/6-em)]](https://www.rsc.org/images/entities/char_2009.gif) B − ΔEMFD would come from the fundamental electrode kinetics at a “micro-magnetic polarisation”, somehow similar to the micro-weak-strong polarization theory in the fundamentals of electrochemistry. For the same concentration of Fe3+, R is higher for Fe2(SO4)3 solution than that in FeCl3 solution. Whether in Fe2(SO4)3 or FeCl3 solutions, m increases with the increases of Fe3+ concentration, indicating that ΔEMFD is more sensitive to B if the concentration of Fe3+ is low in the solution. For the same concentration of Fe3+, m is lower in Fe2(SO4)3 solution than in FeCl3 solution. If the cathodic reaction rate is fully controlled by mass transport step at open circuit potential, for the solution with the same nominal concentration of ferric ions, the limiting cathodic current is not the same and the
B − ΔEMFD would come from the fundamental electrode kinetics at a “micro-magnetic polarisation”, somehow similar to the micro-weak-strong polarization theory in the fundamentals of electrochemistry. For the same concentration of Fe3+, R is higher for Fe2(SO4)3 solution than that in FeCl3 solution. Whether in Fe2(SO4)3 or FeCl3 solutions, m increases with the increases of Fe3+ concentration, indicating that ΔEMFD is more sensitive to B if the concentration of Fe3+ is low in the solution. For the same concentration of Fe3+, m is lower in Fe2(SO4)3 solution than in FeCl3 solution. If the cathodic reaction rate is fully controlled by mass transport step at open circuit potential, for the solution with the same nominal concentration of ferric ions, the limiting cathodic current is not the same and the  ratio is different. Assuming that the open circuit state is mainly determined by the cathodic reaction rate in various solutions, according to eqn (4), ΔEMFD increases with increasing
  ratio. For the electrochemical systems with the cathodic reaction rate controlled by both the mass transport step and the electron transfer step, the value of ΔEMFD is lower than the calculated value by eqn (4), while the dependence of ΔEMFD on the type of solution or the ferric concentration is consistent with eqn (4). ΔEMFD in FeCl3 solution is less than that in the Fe2(SO4)3 solution, and the slope m is higher in FeCl3 solution than in Fe2(SO4)3 solution if the ferric ion concentration is the same.
Based on the experimental data in Fig. 2–5, the parameters in the fitting equation, eqn (5), can be obtained. Then, the unknown magnetic flux density in the range of 0.05 T to 0.5 T can be obtained by the suggested method through the measurement of ΔEMFD. It is noted that the parameters for fitting are related to the type of solution and the concentration of the reactive species. For the measurement systems with iron in Fe2(SO4)3 solutions in the present work, 1 mV increase of ΔEMFD corresponds to 16–20% increase of B, namely, 1.6–2.0% increase of B would be able to be indicated by 0.1 mV increase of ΔEMFD. For iron in FeCl3 solutions in the present work, 1 mV increase of ΔEMFD corresponds to 22–28% increase of B, namely, 2.2–2.8% increase of B would be able to be detected by 0.1 mV increase of ΔEMFD.
Conclusions
A novel electrochemical method has been developed for measuring magnetic flux density, as an alternative way of magnetic measurements without using tesla meter.(1) The change of open circuit potential for iron in Fe2(SO4)3 or FeCl3 solutions induced by magnetic field can be used to determine the magnetic flux density.
(2) The linear relationship for log![[thin space (1/6-em)]](https://www.rsc.org/images/entities/char_2009.gif) B vs. ΔEMFD has been used in the fitting equation for the standard curves. The electrochemical method has been validated for measuring the magnetic flux density in the range from 0.05 T to 0.5 T in this work.
B vs. ΔEMFD has been used in the fitting equation for the standard curves. The electrochemical method has been validated for measuring the magnetic flux density in the range from 0.05 T to 0.5 T in this work.
(3) The fitting parameters for the standard curve are related to the type of solution as well as the concentration.
(4) About 2% change of magnetic flux density in the range of 0.05 T to 0.5 T can be detected by the proposed electrochemical methods, supposing that the configuration of the system remains to be the same for the measurement conditions.
Conflicts of interest
No conflict of interest exits in the submission of this manuscript.Acknowledgements
This work has been supported by Natural Science Foundation of China (NSFC) No. 52271060 and 51571138.References
- R. S. Elliott. Electromagnetics: history, theory, and applications. IEEE Press, 1993 Search PubMed.
- K. H. J. Buschow and F. R. De Boer, Physics of Magnetism and Magnetic Materials, Springer-Verlag New York Inc, 2013 Search PubMed.
- R. S. Elliott, Antennas & Propagation Society International Symposium IEEE, 1988, vol. 6, pp. 6–18 Search PubMed.
- J. D. Kraus and D. A. Fleisch, Electromagnetics with Applications, McGraw-Hill, 1999 Search PubMed.
- H. Zijlstra, Experimental Methods in Magnetism. John Wiley & Sons, Inc: New York, 1967 Search PubMed.
- S. Tumanski, Handbook of Magnetic Measurements, CRC Press Inc, 2011 Search PubMed.
- Z. X. Chen and J. J. Lu, Mine Warfare & Ship Self-Defence, 2011, 19, 1–4 Search PubMed.
- S. M. Lim and J. S. Park, J. Electr. Eng. Technol., 2019, 14, 377–383 CrossRef.
- J. Lee, Y. Oh and S. Oh, Sens, 2020, 20, 5285 CrossRef PubMed.
- D. Jurman, M. Jankovec and R. Kamnik, Sens. Actuators, A, 2007, 138, 411–420 CrossRef CAS.
- M. Vopálenský, A. Platil and P. Kašpar, Sens. Actuators, A, 2005, 123, 303–307 CrossRef.
- M. Kocan, Fusion Eng. Des., 2017, 123, 936 CrossRef CAS.
- V. Zhukova, A. Zhukov, K. L. Garcia, V. Kraposhin and A. Prokoshin, Sens. Actuators, A, 2003, 106, 225–229 CrossRef CAS.
- S. L. Zhang, G. F. Zhang, Y. L. Wang, M. Liu, H. Li, Y. Qiu, J. Zeng, X. Y. Kong and X. M. Xie, Chin. Phys. B, 2013, 22, 128501 CrossRef.
- H. Dong, Y. L. Wang, S. L. Zhang, Y. Sun and X. M. Xie, Supercond. Sci. Technol., 2008, 21, 115009 CrossRef.
- M. Schmelz, R. Stolz, V. Zakosarenko, T. Schoenau, A. Anders, L. Fritzsch, M. Mueck and H. G. Meyer, Supercond. Sci. Technol., 2011, 24, 065009 CrossRef.
- J. Zeng, Y. Zhang, M. Mueck, H. J. Krause, A. I. Braginski, X. Y. Kong, X. M. Xie, A. Offenhaeusser and M. Jiang, Appl. Phys. Lett., 2013, 103, 042601 CrossRef.
- F. Kaluza, A. Gruger and H. Gruger, Sens. Actuators, A, 2003, 106, 48–51 CrossRef CAS.
- B. Andò, S. Baglio, A. R. Bulsara and C. Trigona, Sens. Actuators, A, 2009, 151, 145–153 CrossRef.
- R. S. Popovic, Z. Randjelovic and D. Manic, Sens. Actuators, A, 2001, 91, 46–50 CrossRef CAS.
- A. Girgin, M. Bilmez, H. Y. Amin and T. C. Karalar, Microelectron. J., 2019, 90, 12–18 CrossRef CAS.
- S. Q. Mo, R. S. Wei, Z. Q. Zeng and M. H. He, Microelectron. J., 2021, 113, 105067 CrossRef.
- J. Jezný and M. Čurilla, Am. J. Mech. Eng., 2013, 1, 231–235 Search PubMed.
- M. H. Kang, B. W. Choi, K. C. Koh, J. H. Lee and G. T. Park, Sens. Actuators, A, 2005, 118, 278–284 CrossRef CAS.
- H. Hauser, P. L. Fulmek, P. Haumer, M. Vopalensky and P. Ripka, Sens. Actuators, A, 2003, 106, 121–125 CrossRef CAS.
- S. Wissberg, M. Ronen, Z. Oren, D. Gerber and B. Kalisky, Sci. Rep., 2020, 10, 1573 CrossRef CAS PubMed.
- S. J. Lee, K. Jeong, J. H. Shim, H. J. Lee, S. Min, H. Chae, S. K. Namgoong and K. Kim, Sci. Rep., 2019, 9, 12422 CrossRef PubMed.
- F. Arute, K. Arya, R. Babbush, D. Bacon and J. C. Bardin, Nature, 2019, 574, 505–510 CrossRef CAS PubMed.
- Z. P. Lu, D. L. Huang, W. Yang and G. Z. Zhao, J. Chin. Soc. Corros. Prot., 2000, 20, 230–236 CAS.
- Z. P. Lu, D. L. Huang and W. Yang, Corros. Prot., 2002, 23, 185–189 CAS.
- F. M. F. Rhen, G. Hinds and J. M. D. Coey, Electrochem. Commun., 2004, 6, 413–416 CrossRef CAS.
- Z. P. Lu, D. L. Huang and W. Yang, Corros. Sci., 2005, 47, 1471–1492 CrossRef CAS.
- Z. P. Lu and W. Yang, Corros. Sci., 2008, 50, 510–522 CrossRef CAS.
- R. Sueptitz, K. Tschulik, M. Uhlemann, A. Gebert and L. Schultz, Electrochim. Acta, 2010, 55, 5200–5203 CrossRef CAS.
- M. Waskaas and Y. I. Kharkats, J. Electroanal. Chem., 2001, 502, 51–57 CrossRef CAS.
- G. Hinds, J. M. D. Coey and M. E. G. Lyons, Electrochem. Commun., 2001, 3, 215–218 CrossRef CAS.
- L. M. A. Monzon and J. M. D. Coey, Electrochem. Commun., 2014, 42, 38–41 CrossRef CAS.
- T. Z. Fahidy, J. Appl. Electrochem., 1983, 13, 553–563 CrossRef CAS.
- O. Aaboubi, J. P. Chopart, J. Douglade, A. Olivier, C. Gabrielli and B. Tribollet, J. Electrochem. Soc., 1990, 137, 1796–1804 CrossRef CAS.
- L. M. A. Monzon and J. M. D. Coey, Electrochem. Commun., 2014, 42, 42–45 CrossRef CAS.
- S. R. Ragsdale, K. M. Grant and H. S. White, J. Am. Chem. Soc., 1998, 120, 13461–13468 CrossRef CAS.
- C. Wagner and W. Traud, Corrosion, 2006, 62, 277–314 CrossRef.
| This journal is © The Royal Society of Chemistry 2023 |

