 Open Access Article
Computational study of the interaction of the psychoactive amphetamine with 1,2-indanedione and 1,8-diazafluoren-9-one as fingerprinting reagents†
Divya Bhikharee a,
Lydia Rhyman
 a and
Ponnadurai Ramasami
 *ab
*ab
aComputational Chemistry Group, Department of Chemistry, Faculty of Science, University of Mauritius, Réduit 80837, Mauritius. E-mail: p.ramasami@uom.ac.mu
bDepartment of Chemistry, University of South Africa, Private Bag X6, Florida, 1710, South Africa
First published on 30th January 2023
Abstract
In this study, we used computational methods to investigate the interaction of amphetamine (AMP) with 1,2-indanedione (IND) and 1,8-diazafluoren-9-one (DFO) so as to understand whether AMP can be detected in latent fingerprints using either of these reagents. The results show that the binding energies of AMP with IND and DFO were enhanced by the presence of amino acid from −9.29 to −12.35 kcal mol−1 and −7.98 to −10.65 kcal mol−1, respectively. The physical origins of these interactions could be better understood by symmetry-adapted perturbation theory. The excited state properties of the binding structures with IND demonstrate distinguishable absorption peaks in the UV-vis spectra but zero fluorescence. Furthermore, the UV-vis spectra of the possible reaction products between AMP and the reagents reveal absorption peaks in the visible spectrum. Therefore, we could predict that reaction of AMP with IND would be observable by a reddish colour while with DFO, a colour change to violet is expected. To conclude, the reagents IND and DFO may be used to detect AMP by UV-vis spectroscopy and if their reactions are allowed, the reagents may then act as a potentially rapid, affordable and easy colorimetric test for AMP in latent fingerprints without destruction of the fingerprint sample.
1 Introduction
Psychoactive substances, more commonly known as drugs of abuse, are substances that affect mental health. The major drugs of abuse classified by the United Nations Office on Drugs and Crime (UNODC) include cocaine, cannabis, opioids, and amphetamines (AMPs). AMPs are the second most common drugs of abuse1 with a rise of 309% for seizures from the year 2018 to the year 2019 as per the world drug report 2021.2 This increase in drug availability presents a serious threat to human health, family harmony, and social stability.1 Hence, in accordance with the sustainable development goals (SDGs), detection of drugs is essential to protect the society from the drug scourge.3Various detection methods and sensors for detecting AMP in matrices such as oral fluids, blood, and urine are commercially available.4 Several researchers have investigated the possibility of detection of drugs in latent fingerprint5–11 as the latter is unique to an individual, hence, the presence of drug in the fingermark can be considered as strong evidence in drug cases.12 Another advantage of the latent fingerprint is that it is non-invasive as compared to matrices such as blood. It is thus a preferred sampling matrix in point of care analysis13,14 and has been proposed for roadside testing of drugs.11 AMP can be detected in fingermarks using fluorescent probes,15,16 time-of-flight secondary ion mass spectrometry,17 lateral flow detection15 and infrared spectral imaging.18 These methods are less effective in the presence of powder mixtures in the sample or in the presence of enough fluorescent nanoparticles. In addition, mass spectrometry method is destructive and requires different sample preparation for each target analyte.18 In order to overcome these limitations, there is a need for novel drug detection methods to improve portability, affordability, detection times and limits as well as methods which do not destroy the latent fingerprint samples.
Novel drug detection methods for instance, fluorescent films made of o-carborane derivative of perylene bisimide derivatives (PBI-CB) are capable to detect the drugs AMPs, magu (a combination of AMP and caffeine),19 caffeine, phenobarbital and ketamine.20 To support the experimental results, density functional theory (DFT) using the B3LYP/6-31G(d) method revealed that the drugs are suitable quenchers, as their energies of the HOMO orbitals are higher than that of PBI-CB. These differences ensure the hole of the fluorophore after excitation can accept an electron from the drug molecule resulting in the observed fluorescence quenching. In addition, DFT studies enabled the prediction of many potential sensors for AMP from the low binding energies which prove that the sensors are effective for detection of the drug.21–26 Excited states properties of the drugs and sensors obtained by time-dependent DFT (TD-DFT) helps to explain the fluorescent possibility and provides UV-vis spectra which can be used as guidance for future experimental works on the specific sensors.26–28
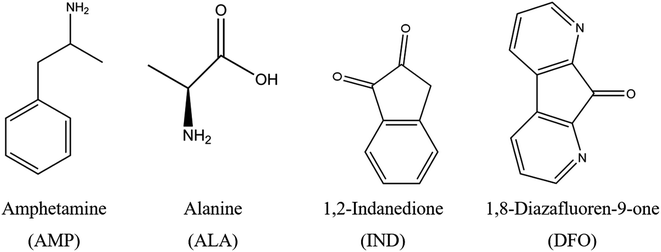
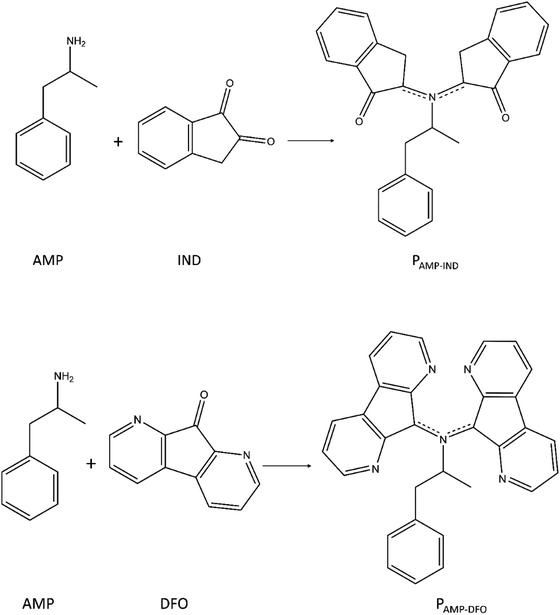
In this study, we used computational methods to analyse the possible use of fingerprinting reagents (FRs) to detect AMP. The FRs namely 1,2-indanedione (IND) and 1,8-diazafluoren-9-one (DFO), as illustrated in Fig. 1, enable the detection of latent fingerprints on porous surfaces such as paper.29,30 These FRs react with amino acids in latent fingerprints to form a product which fluoresces under light at specific wavelengths, thereby enabling efficient visualisation of the fingerprint-ridge details. However, the presence of drugs in latent fingerprints and their influence on IND and DFO have not been analysed to date. These reagents may thus be studied as a potential sensor for AMP since it has the benefit of being affordable and not destroying the latent fingerprint samples compared to mass spectrometry.18
Hence, the aim of this study was to use computational methods to investigate the binding effect of AMP on IND and DFO and to identify their subsequent possible detection by UV-vis spectroscopy and fluorescence. In addition, besides AMP, amino acids are also present in the latent fingerprint sample and they may interfere with the detection of the drug. To account for interferences by amino acids, we explored the binding of alanine (ALA) with AMP, IND and DFO as well as their resulting UV-vis and fluorescence spectra. ALA was chosen since it is among the most abundant amino acids in latent fingerprints31 and it was also considered in previous studies.30,32–34 At a temperature of 100 °C or 160 °C, ALA reacts with IND or DFO to form a product which is responsible for fluorescent detection of latent fingerprints.29 AMP present in the sample may also react with IND or DFO under similar conditions. Thus, we also studied the possible reaction products (RPs) of AMP and the FRs as well as their effect on UV-vis and fluorescence.
2 Computational methodologies
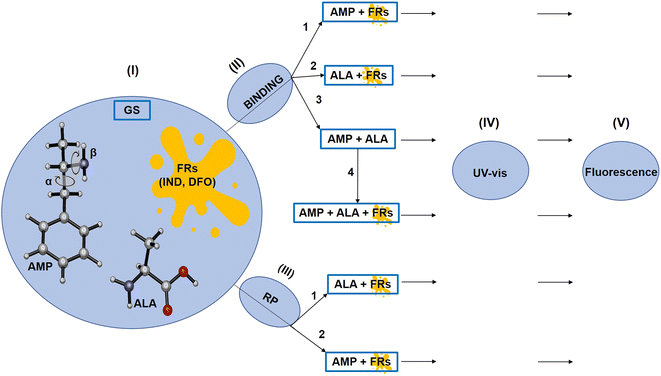
The overall procedure followed throughout this article is illustrated in Scheme 1. Firstly, the ground state structures of the FRs, ALA and AMP were optimised. The most stable conformer of AMP was identified by a conformational search performed by varying the dihedral angles along the α and β axes independently,35,36 by 10 steps with increment of 20°, using the B3LYP/6-31G(d,p) method.36 The α axis represents the C–C bond while and β axis represents the C–N bond. We then examined the binding possibilities of AMP with the FRs and ALA following which, we used the symmetry-adapted perturbation theory (SAPT) approach to check which of the principal physical contributions mainly influence the interaction energies. SAPT also helps to understand the nature of interactions that is not possible experimentally.27 In addition, the possible reaction products (RPs) between AMP and the FRs were investigated according to the known RPs between ALA and the FRs.33,34The resulting RPs and binding complexes were subjected to UV-vis spectra simulations in order to verify whether the interactions between AMP and IND or DFO provide significant changes that could be practically employed during the detection of AMP. Furthermore, the UV-vis and fluorescence spectra of RPs of ALA and AMP with FRs were analysed.
All the geometry optimisations and binding energy evaluations were performed in the gas phase by the B3LYP-D3/6-31G(d,p)37,38 method. The Grimme's D3 dispersion correction was shown to increase the accuracy of non-covalent interactions.27,38–41 The optimised structures were thereafter confirmed to be real minima by performing frequency calculations using the same method. All structures showed positive force constants for all the normal modes of vibration. The frequencies were then used to evaluate the thermal (T = 298 K) vibrational corrections to the enthalpies and Gibbs free energies within the harmonic oscillator approximation and the zero-point vibrational energy (ZPE). The ZPE was included with the total energy in calculations of the binding energy (Eb) which was evaluated by:
| Eb = E(AMP + FR) − E(AMP) − E(FR) + E(BSSE) | (1) |
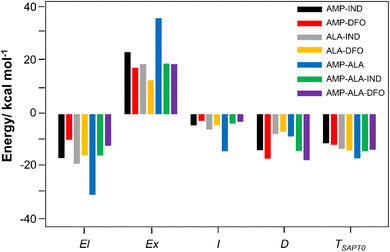
In addition, to better understand the interaction between AMP and the FR, we analysed the decomposition of interaction energy by single-point computations using SAPT. SAPT is a method to calculate non-covalent interactions and the computations were run on the PSI4 program.43,44 The SAPT0![[thin space (1/6-em)]](https://www.rsc.org/images/entities/char_2009.gif) 45,46 approach was considered along with the jun-cc-pVDZ47 basis set since Tomić and coworkers27 confirmed this method is accurate to model AMP precursor ephedrine binding with fullerene sensor. SAPT0 is the simplest and most inexpensive SAPT method that essentially treats the monomers at the Hartree–Fock level and appends explicit dispersion terms obtained from second-order perturbation theory to the electrostatic, exchange, and induction terms from HF dimer treatment.48 SAPT0 does not consider intramolecular correlations but a second order intermolecular interaction which is accurate enough to explain the non-covalent interaction in a dimer.
45,46 approach was considered along with the jun-cc-pVDZ47 basis set since Tomić and coworkers27 confirmed this method is accurate to model AMP precursor ephedrine binding with fullerene sensor. SAPT0 is the simplest and most inexpensive SAPT method that essentially treats the monomers at the Hartree–Fock level and appends explicit dispersion terms obtained from second-order perturbation theory to the electrostatic, exchange, and induction terms from HF dimer treatment.48 SAPT0 does not consider intramolecular correlations but a second order intermolecular interaction which is accurate enough to explain the non-covalent interaction in a dimer.
We performed non-covalent interaction (NCI) analysis of the binding structures, using the Multiwfn program,49–51 to characterise the presence of hydrogen bonds. The NCI plots, which are shown in the ESI in Fig. S9,† enable visualisation of non-covalent interactions between molecular fragments as real-space surfaces. The λ2 symbol represents the interaction type within the NCI framework. For attractive interactions, λ2 is negative, van der Waals interactions have their λ2 values close to zero while steric repulsions have positive λ2 values. The molecules were visualised in 3D using the Visual Molecular Dynamics program.52 The Gnuplot 4.2![[thin space (1/6-em)]](https://www.rsc.org/images/entities/char_2009.gif) 53 program and Ghostscript54 interpreter were used to generate the 2D plots.
53 program and Ghostscript54 interpreter were used to generate the 2D plots.
Subsequently, all the species were subjected to TD-DFT computations so as to obtain excited state properties as well as the UV-vis and fluorescence spectra. The long range-corrected CAM-B3LYP55 functional was utilised as more reliable results are obtained compared to pure B3LYP functional. The 6-31+G(d,p) basis set was employed as the diffuse function enhances the results of binding molecules.27 The TD-DFT as well as DFT computations were performed using the Gaussian16![[thin space (1/6-em)]](https://www.rsc.org/images/entities/char_2009.gif) 56 program running on SEAGrid.57–60 The GaussView 6
56 program running on SEAGrid.57–60 The GaussView 6![[thin space (1/6-em)]](https://www.rsc.org/images/entities/char_2009.gif) 61 program was used to visualise the results and draw the structures. The figures in this article were generated using CYLview62 while the spectra were simulated using Multiwfn.51
61 program was used to visualise the results and draw the structures. The figures in this article were generated using CYLview62 while the spectra were simulated using Multiwfn.51
3 Results and discussion
3.1 Optimised geometries
Given that AMP is a relatively large molecule with several rotatable bonds, a conformational search was performed in order to obtain the most stable conformer. The results of the conformational of AMP search are presented in the ESI (Fig. S1†). The relative stabilities of each conformer are in agreement with those presented by Brause et al.35 and Bruni et al.36 The most stable conformer of AMP is in agreement with the experimental solid-state structure36 and hence, was used for further computations like in similar studies whereby the authors investigated the interaction of AMP with potential sensors.22,24,26,63,64Subsequently, we used the optimised geometries of AMP, ALA, IND and DFO to generate their respective molecular electrostatic potential surface (MEP) maps. These maps as shown in Fig. 2 depict the variable charged areas and the deficient and rich electron sites of each molecule. The red regions indicate the minimum electrostatic potential (rich electron density) with a negative electrostatic potential; while the blue regions show the highest electrostatic potential.65 These data can be used as a guide to determine how the molecules interact with one another hence is useful to analyse binding interactions.
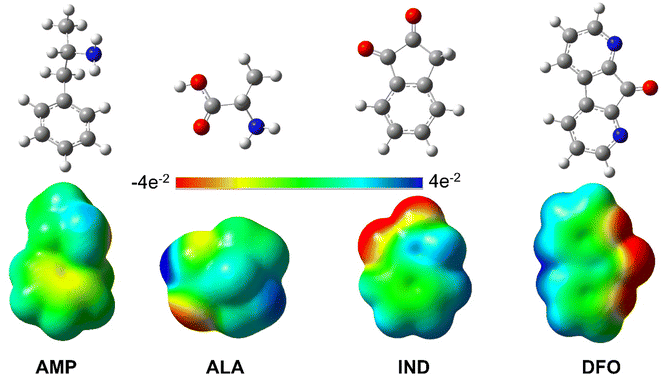 | ||
| Fig. 2 Optimised structures and MEP maps of AMP, ALA, IND and DFO with the colour scale −4e−2 to 4e−2. | ||
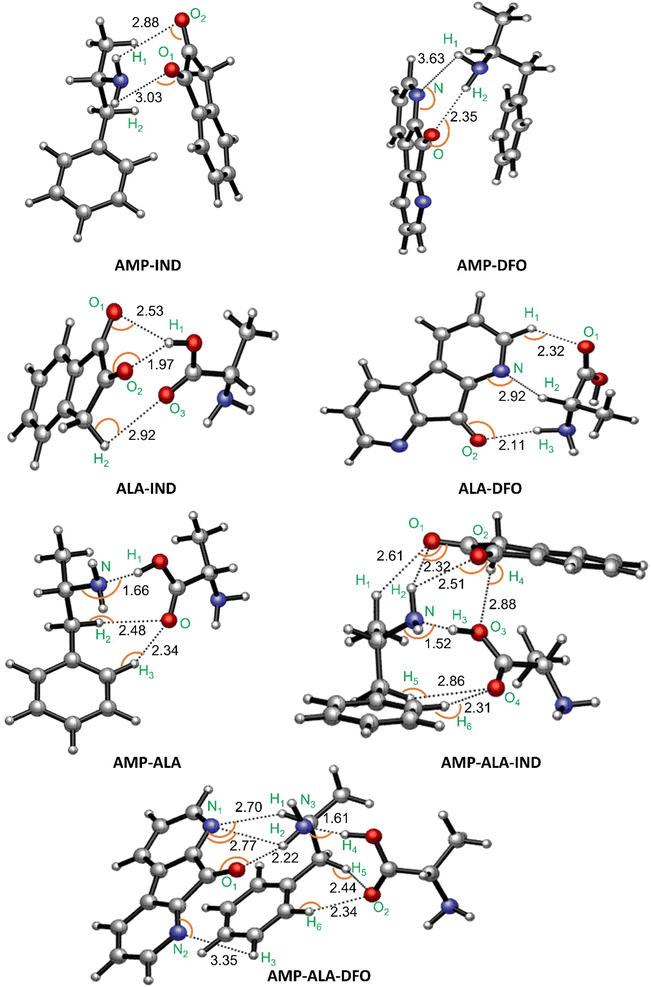 | ||
| Fig. 3 Binding structures with indicated intermolecular hydrogen bonds in Å and interaction angles indicated by the orange curves (the respective angles are given in Table S1†). | ||
| Structure | Eb/kcal mol−1 | ΔG/kcal mol−1 | ΔH/kcal mol−1 |
|---|---|---|---|
| AMP-IND | −9.29 | −0.49 | −13.25 |
| AMP-DFO | −7.98 | −0.73 | −12.01 |
| ALA-IND | −10.84 | 5.37 | −6.12 |
| ALA-DFO | −12.40 | 2.17 | −8.49 |
| AMP-ALA | −14.94 | −0.69 | −12.06 |
| AMP-ALA-IND | −12.35 | −3.94 | −17.17 |
| AMP-ALA-DFO | −10.65 | −3.09 | −14.35 |
We first discuss the results for AMP-FRs (AMP-IND and AMP-DFO) and ALA-FRs (ALA-IND and ALA-DFO) in order to compare the individual interactions of each species with the FRs. The results show that both AMP and ALA form hydrogen bonds with the FRs. However, AMP is observed to form only two bonds with the FRs as compared to ALA which shows tridentate interactions with the FRs. The lowest bond distances of the latter intermolecular interactions are 1.97 Å in ALA-IND and 2.11 Å in ALA-DFO compared to those for AMP-IND and AMP-DFO which are 2.88 Å and 2.35 Å, respectively. These differences in number and lengths of intermolecular bonds are reflected in the binding energies in Table 1. That is, AMP-IND and AMP-DFO having lower number of intermolecular bonds with longer bond distances, have lower binding energies (−9.29 and −7.98 kcal mol−1 respectively) compared to ALA-IND (−10.84 kcal mol−1) and ALA-DFO (−12.40 kcal mol−1). Despite of this, the ΔG values for the ALA-FRs are positive indicating that the interactions are not feasible at 298.15 K. Therefore, it can be predicted that the ALA present in a fingerprint sample will not interact with the FRs while a sample of AMP will bind with the FRs.
We also monitored the possible interactions between AMP and ALA since a fingerprint sample containing AMP will also contain ALA. The binding structure is given in Fig. 3 referred to as “AMP-ALA”. AMP-ALA has higher binding energy (−14.94 kcal mol−1) as well as stronger hydrogen bonds with its minimum bond distance being 1.66 Å compared to AMP-FRs and ALA-FRs as discussed above. Subsequently, we investigated the interactions between this AMP-ALA binding structure with the FRs. The resulting highest binding structures are AMP-ALA-IND and AMP-ALA-DFO as depicted in Fig. 3. In general, the hydrogen bonds between AMP and ALA are observed to have decreased upon binding with the FRs especially for the N–H bond which shows a decrease in bond length from 1.66 Å in AMP-ALA to 1.52 Å and 1.61 Å in AMP-ALA-IND and AMP-ALA-DFO respectively. The bond distances of intermolecular bonds between AMP and the FRs also show a decrease when bound to ALA. The minimum bond distance between AMP and IND decreases from 2.88 Å to 2.32 Å in AMP-ALA-IND while with DFO, a decrease from 2.35 Å to 2.22 Å is noted.
In addition, it can be observed that ALA binding to AMP has lowered the energy required to interact with the FRs. That is, ALA-AMP interacts stronger with the FRs as compared to only ALA or AMP. The Eb of AMP with IND has decreased from −9.29 to −12.35 kcal mol−1 when bound to ALA while the Eb of AMP with DFO has decreased from −7.98 to −10.65 kcal mol−1. These binding energies as well as the ΔG and ΔH values are in agreement with literature on potential sensors to detect AMP.22,24,26,64,66
3.2 SAPT
To gain better insights on the interactions between AMP and the FRs, SAPT energy have been computed. SAPT provides a decomposition of the interaction energy into physically meaningful components of electrostatic (El), exchange (Ex), induction (I) and London dispersion (D) contributions.67 El forces can be either attractive or repulsive interactions between charged molecules. Ex contributions are repulsive; I is due to polarisation of electric fields while D components is the result of interaction between electrons of the dimer molecules. I and D values are usually smaller than El and Ex but they are always attractive. Repulsive forces are identified as positive values while attractive interaction are negative values.The individual components are plotted in Fig. 4 and summarised in Table S3 in the ESI.† The results reveal that the interaction energy typically has the most significant contributions from the El and Ex repulsion terms with the repulsive Ex term outweighing the attractive El term. Notably, the exceptionally high binding affinity of AMP-ALA can be attributed to its strong El component in addition to the Ex contribution. The El component for AMP-ALA is −30.26 kcal mol−1, which is comparable to the Ex component of 35.87 kcal mol−1. However, only for AMP-DFO and AMP-ALA-DFO, the interactions are mainly due to the dispersion component. The D components are −16.69 kcal mol−1 and −17.19 kcal mol−1 for AMP-DFO and AMP-ALA-DFO, respectively. In addition, the total interaction energy (TSAPT0) values given in Table S3† are comparable to the binding energies, Eb, in Table 1 with a correlation coefficient R2 value of 0.9.
3.3 Optical properties
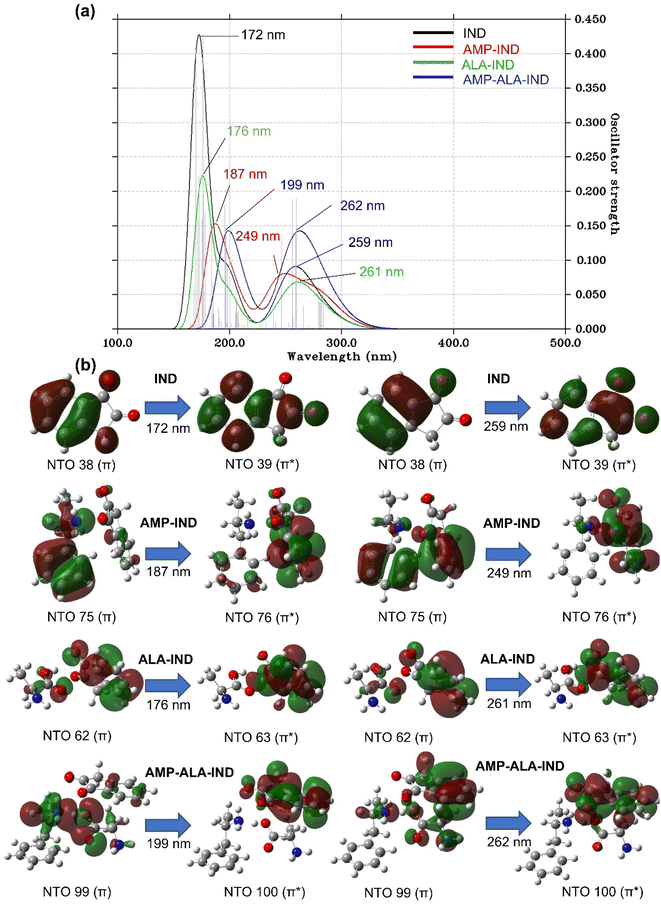
The UV-vis spectrum of IND (Fig. 5(a)) exhibits two distinct absorption peaks at λmax of 172 and 259 nm at f values of 0.43 and 0.19, respectively. The peaks are theoretically assigned to NTO 38 and 39 having mainly π → π* character. In the presence of AMP, the heights of the absorption peaks are lowered to f values of 0.15 and 0.14 and a notable shift in λmax is observed. The first absorption peak of AMP-IND is located at the λmax of 187 nm, which represents a red-shift of 15 nm. However, the shift of the second absorption peak located at the λmax of 249 nm, shows a blue-shift of 10 nm. The computational results indicate that shifts of the absorption peaks can be easily noticed and employed for the detection of AMP. In the absence of AMP, ALA-IND have absorption peaks at 176 and 261 nm which are red-shifts of only 4 and 1 nm respectively compared to IND. Otherwise, AMP-ALA-IND demonstrates more red-shifted peaks at 199 and 262 nm with similar heights of 0.14 compared to IND, AMP-IND and ALA-IND. The first absorption peak at 199 nm is a significant red-shift of 27 nm while the second peak at 262 nm is a red-shift of 3 nm. The latter peak has an excitation energy of 4.79 eV which is significantly less energy than the other structures. In fact, in the binding structures AMP-IND, ALA-IND and AMP-ALA-IND, the absorption peaks correspond to π → π* electron transitions from AMP and ALA towards the virtual orbitals of IND.
Similarly, the spectra for DFO compared to AMP and ALA binding to DFO structures are presented in Fig. S10(a).† The UV-vis spectrum of DFO exhibits two distinct absorption peaks at λmax of 218 and 267 nm as well as a shoulder peak at 189 nm in agreement with literature.69 This shoulder peak is absent in the binding structures. AMP-DFO displays absorption peaks at 219 and 268 nm which are red-shifts of only 1 nm compared to the DFO peak. The small shifts may not be distinguished experimentally while the peak heights are lower with f values of 0.18 and 0.55 compared to DFO (0.81 and 0.19). With ALA, the absorption peaks of AMP-ALA-DFO are at λmax of 222 and 271 nm which can be better distinguished with red-shifts of 4 nm as well as the notably lowered f of 0.37 compared to DFO having f of 0.81. The first absorption peaks for the DFO binding to AMP and ALA structures can be characterised by π → π* involving intramolecular transitions in DFO while the second peaks involve electron transitions from AMP or ALA to DFO as observed in Fig. S10(b).†
| Structure | λemi/nm | f | Eflu/eV |
|---|---|---|---|
| AMP | 240 | 0.0022 | 5.17 |
| ALA | 372 | 0.0015 | 3.33 |
| AMP-ALA | 239 | 0.0033 | 5.18 |
| IND | 507 | 0 | 2.44 |
| AMP-IND | 513 | 0 | 2.42 |
| ALA-IND | 507 | 0.0001 | 2.44 |
| AMP-ALA-IND | 500 | 0 | 2.48 |
| DFO | 456 | 0 | 2.72 |
| AMP-DFO | 338 | 0 | 3.67 |
| ALA-DFO | 433 | 0 | 2.86 |
| AMP-ALA-DFO | 337 | 0 | 3.68 |
The FRs and the binding structures namely AMP-IND, AMP-ALA-IND, AMP-DFO, ALA-DFO and AMP-ALA-DFO have their value of oscillator strength, f, equal zero. This implies that the mentioned structures will not fluoresce. In addition, the negligible f value of 0.0001 for ALA-IND predicts that no emission exists. However, AMP on its own fluoresce at a wavelength of 240 nm. Despite this, since AMP is predicted to bind with the FRs, we conclude that AMP cannot be detected using IND or DFO by fluorescence.
3.4 Reaction products
ALA present in latent fingerprints react with IND or DFO at a temperature of 100 °C or 160 °C. It is the reaction product formed, which fluoresces to reveal the fingerprint details.29 ALA reacts with IND to form a pink product, which we will refer to as PALA-IND while the reaction between ALA and DFO yields a reddish product (PALA-DFO) under normal light.29 The presence of AMP in the latent fingerprint sample may also react with IND and DFO at the same temperatures. We hereby study the possible reaction products of AMP-IND (PAMP-IND) and AMP-DFO (PAMP-DFO) and their effect on UV-vis spectra as well as on fluorescence.We investigated the possible products which may form due to the reaction of the FRs with ALA according to the reaction between ninhydrin and an amine.70 In the scheme presented by Sudalaimani et al.70 only the end product due to reaction between the amines and ninhydrin were studied. Ninhydrin reacts with ALA in a similar reaction pathway as IND and DFO to form end-products which are responsible for fluorescent detection of fingerprints. Hence, we studied the possible end-products of reaction between AMP and IND (PAMP-IND) and AMP and DFO (PAMP-DFO) according to the reaction in Fig. 6. The optimised geometries of these RPs are presented in the ESI (Fig. S11 and S12).† The most stable optimised structures were considered to analyse their optical properties.
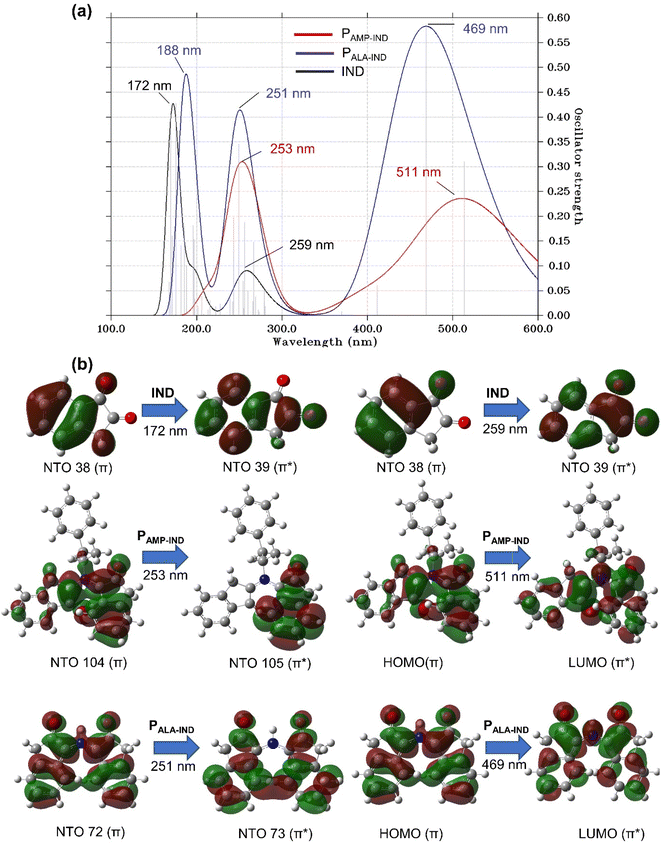
Absorption properties. The UV-vis spectra of IND, DFO and their reaction products with AMP and ALA were simulated using the TD-DFT/CAM-B3LYP/6-31+G(d,p) method. The spectra involving IND and DFO are illustrated in Fig. 7(a) and S16(a)† respectively. The absorption peaks can be explained by the significant MO assignments and as observed in Table S4,† only the absorption peaks in the visible spectrum, that is, having λmax higher than 380 nm, occur due the electron transition from the highest occupied molecular orbital (HOMO) to the lowest unoccupied molecular orbital (LUMO). For the other absorption peaks in the UV spectra, the character of electronic states results from simultaneous non-negligible contributions of multiple MO pair which is why NTOs were calculated as visualised in Fig. 7(b) and S16(b).†
The UV-vis spectra of PALA-IND, illustrated in Fig. 7(a), has three distinct absorption peaks with heights higher than the two peaks of IND. The first peak is located at a λmax of 188 nm, which is a red-shift of 16 nm compared to the first peak of IND while the second peak at a λmax of 251 nm, is a blue-shift of 8 nm. The third absorption peak at 469 nm is in agreement with experimental literature in which the results showed that PALA-IND is well excited in the visible spectrum of 420 to 510 nm.34,71 The experimentally observed pink colour can also be confirmed by the peak at λmax of 469 nm absorbing in the blue region of the visible spectrum which occurs due to the transition from the HOMO to LUMO orbitals. Conversely, the UV-vis spectra of PAMP-IND reveals two distinct absorption peaks. The heights of the peaks are lower and show red-shifts when compared to the peaks of PALA-IND. The first peak of PAMP-IND located at a λmax of 253 nm with f = 0.20, is a shift of 2 nm while the second peak located at 511 nm having f = 0.31, is a significant shift of 42 nm. In fact, the latter peak of PAMP-IND absorbs light in the green region of the visible spectrum hence, PAMP-IND is theoretically predicted to be perceived as a reddish colour under normal light. The notable colour change and red-shifts of the absorption peaks of PALA-IND and PAMP-IND compared to IND can be explained by major electron transition from the HOMO to LUMO characterised by π → π* excitation. These computational results indicate that in addition to the noticeable shifts of the absorption peaks and the predicted colour change, IND can be employed for the detection of AMP without interference by ALA.
Likewise for the second reagent DFO, the UV-vis spectra of its reaction products with ALA and AMP are analysed. The UV-vis spectra of PALA-DFO, illustrated in Fig. S13(a),† has two distinct absorption peaks and a shoulder peak being red-shifts compared to the absorption peaks of DFO. The shoulder peak is located at a λmax of 233 nm, which is a shift of 44 nm. The first peak at 257 nm is a shift of 39 nm while the second peak at a λmax of 472 nm, is a significant shift of 205 nm. The absorption peaks as well as the experimentally observed reddish colour are in agreement with literature.72 The reddish colour is confirmed by to π → π* excitation from the HOMO to LUMO orbitals of the peak at λmax of 472 nm which corresponds absorption of the green colour wavelength in the visible spectrum.
The UV-vis spectra of PAMP-DFO, presented in Fig. S13(a),† reveals two distinct absorption peaks and a shoulder peak. The heights of the peaks are lower with f of 0.45 and show red-shifts when compared to the peaks of PALA-DFO (f = 0.90). The first peak located at a wavelength of 260 nm, is a shift of 3 nm while the second peak located at 568 nm is a significant shift of 42 nm. The shoulder peak at 319 nm is a shift of 86 nm. The peak at λmax of 568 nm corresponds to absorption in the yellow region in the visible spectrum occurring due to π → π* excitation from the HOMO to LUMO orbitals. PAMP-DFO is therefore predicted to be perceived as a violet colour under normal light. These computational results indicate that shifts of the absorption peaks could be easily noticed in addition to the predicted colour, hence, DFO can be employed for colorimetric or UV-vis detection of AMP without interference by ALA.
Fluorescence properties of reaction products. The fluorescence spectra obtained for both PALA-IND and PALA-DFO, in the ESI,† are in agreement with literature.29,72–74 However, PAMP-IND as well as PAMP-DFO reveal absence of fluorescence. This can be explained by comparing the structural features of the ground and excited states of the reaction products (ESI†). For PALA-IND and PALA-DFO, the torsion angles increase from Φ = 22° and −23° to Φ = 30° and −33° upon excitation, respectively while for PAMP-IND (Φ = −93° to −37°) and PAMP-DFO (Φ = −32° to 0.5°), the ground state geometries tend to planarity in the excited state. Hence, the fluorescence of PALA-IND and PALA-DFO can be attributed to the increase in torsion angle upon excitation while absence of fluorescence for PAMP-IND and PAMP-DFO is due to reduction of torsion angle. We, therefore, conclude that the presence of AMP in a fingerprint does not affect its fluorescence detection by IND and DFO.
4 Conclusions
The interaction and excited state properties of AMP with IND and DFO was investigated to predict the detection of AMP by UV-vis and fluorescence when using either of these reagents. We used the DFT B3LYP-D3/6-31G(d,p) method to compute the binding interactions between AMP and the FRs as well as with ALA which is present in latent fingerprints. The results showed that AMP have low binding energies of −9.29 with IND and −7.98 kcal mol−1 with DFO. These binding energies were enhanced to −12.35 and −10.65 kcal mol−1, respectively in the presence of ALA. These binding energies are similar to those of AMP binding to other potential drugs in literature.22,64Subsequently, we computed the excited state properties of these binding structures using the TD-DFT method. The UV-vis spectra simulated show that the absorption peaks of AMP binding to IND show shifts of more than 5 nm. Therefore, it can be predicted that IND can be used to detect AMP by UV-vis spectroscopy. However, detection of AMP using DFO may not be possible since the shifts in absorption peaks compared to DFO were less than 5 nm and hence may not be distinguishable experimentally. The fluorescence results nevertheless indicate zero fluorescence for binding of both reagents with AMP.
Fluorescence detection of fingerprints is due to the product of the reaction between ALA and the FRs. Hence, we also investigated the possible reaction products between AMP and the FRs. The UV-vis spectra simulated reveal large shift in the absorption peaks as well as peaks in the visible spectrum. The colours of the products were thus predicted according to the simulated and experimentally observable colour changes of PALA-IND and PALA-DFO. The colours of PAMP-IND and PAMP-DFO would potentially be reddish and violet, respectively. Therefore, IND and DFO may act as a colorimetric test to detect AMP if the reaction is enabled.
Our findings are helpful for experimentalists and forensic analysts to enable the detection of AMP in fingerprints by using FRs. The FRs IND and DFO do not destroy the sample as they are widely used for fingerprint detection and identifying drugs in a fingerprint using affordable and available reagents would be beneficial financially as well as strong proofs in drug cases.
As future work, the formation of the coloured reaction products between AMP and the FRs needs to be investigated. In addition, experimental work will provide information on the analysis time and accuracy of this method which is a step towards better detection of drugs and hence, deterring the rise in drug abuse and trafficking.
Conflicts of interest
There are no conflicts to declare.Acknowledgements
The authors acknowledge Dr Pooja Goddard from Loughborough University for useful discussions as well as the facilities provided by the University of Mauritius. This work used the Extreme Science and Engineering Discovery Environment (XSEDE), which is supported by National Science Foundation grant number OCI-1053575.References
- E. Stockings, L. T. Tran, T. Santo, A. Peacock, S. Larney, D. Santomauro, M. Farrell and L. Degenhardt, Addiction, 2019, 114, 1738–1750 CrossRef PubMed.
- World Drug Report 2021, United Nations publication, Sales No. E.21.XI.8, 2021 Search PubMed.
- THE 17 GOALS | Sustainable Development, https://sdgs.un.org/goals, (accessed 22 February 2022) Search PubMed.
- A. M. Dragan, M. Parrilla, B. Feier, R. Oprean, C. Cristea and K. De Wael, TrAC, Trends Anal. Chem., 2021, 145, 116447 CrossRef CAS.
- M. Jang, C. Costa, J. Bunch, B. Gibson, M. Ismail, V. Palitsin, R. Webb, M. Hudson and M. J. Bailey, Sci. Rep., 2020, 10, 1–7 CrossRef PubMed.
- K. Li, W. Qin, F. Li, X. Zhao, B. Jiang, K. Wang, S. Deng, C. Fan and D. Li, Angew. Chem., Int. Ed., 2013, 52, 11542–11545 CrossRef CAS PubMed.
- R. T. S. Darwish, M. A. M. El Demellawy, H. M. A. E. S. Megahed, D. N. Younan and W. S. A. E. R. Kholeif, Egypt. J. Forensic Sci. Appl. Toxicol., 2017, 17, 73–91 CrossRef.
- J. Czerwinska, M. Jang, C. Costa, M. C. Parkin, C. George, A. T. Kicman, M. J. Bailey, P. I. Dargan and V. Abbate, Analyst, 2020, 145, 3038–3048 RSC.
- K. L. Fowble and R. A. Musah, Forensic Chem., 2019, 15, 100173 CrossRef CAS.
- G. Groeneveld, M. De Puit, S. Bleay, R. Bradshaw and S. Francese, Sci. Rep., 2015, 5, 1–13 Search PubMed.
- E. Brunelle, B. Thibodeau, A. Shoemaker and J. Halámek, ACS Sens., 2019, 4, 3318–3324 CrossRef CAS PubMed.
- M. J. Bailey, R. Bradshaw, S. Francese, T. L. Salter, C. Costa, M. Ismail, R. P. Webb, I. Bosman, K. Wolff and M. de Puit, Analyst, 2015, 140, 6254–6259 RSC.
- C. Pollard, C. Sievers, P. G. Royall and K. Wolff, J. Anal. Toxicol., 2020, 1–8 Search PubMed.
- C. Pollard, C. Sievers, P. G. Royall and K. Wolff, J. Anal. Toxicol., 2022, 46, 47–54 CrossRef CAS PubMed.
- M. Hudson, T. Stuchinskaya, S. Ramma, J. Patel, C. Sievers, S. Goetz, S. Hines, E. Menzies and D. A. Russell, J. Anal. Toxicol., 2019, 43, 88–95 CrossRef CAS PubMed.
- J. Zhou, G. Zhao, W. Lu, L. Zhan and G. Han, Nano, 2019, 14, 1950026 CrossRef CAS.
- M. I. Szynkowska, K. Czerski, J. Rogowski, T. Paryjczak and A. Parczewski, Forensic Sci. Int., 2009, 184, e24–e26 CrossRef CAS PubMed.
- P. H. R. Ng, S. Walker, M. Tahtouh and B. Reedy, Anal. Bioanal. Chem., 2009, 394, 2039–2048 CrossRef CAS PubMed.
- H. Yi, J. E. Mantell, R. Wu, Z. Lu, J. Zeng and Y. Wan, Psychol. Heal. Med., 2010, 15, 172–187 CrossRef PubMed.
- K. Liu, C. Shang, Z. Wang, Y. Qi, R. Miao, K. Liu, T. Liu and Y. Fang, Nat. Commun., 2018, 9, 1695 CrossRef PubMed.
- S. Bashiri, E. Vessally, A. Bekhradnia, A. Hosseinian and L. Edjlali, Vacuum, 2017, 136, 156–162 CrossRef CAS.
- A. R. Moosavi-zare, M. Abdolmaleki, H. Goudarziafshar and H. Soleymanabadi, Inorg. Chem. Commun., 2018, 91, 95–101 CrossRef CAS.
- H. R. A. El-Mageed and M. A. A. Ibrahim, J. Mol. Liq., 2021, 326, 115297 CrossRef CAS.
- X. Li, X. Jiao, H. Li and M. Derakhshandeh, Appl. Biochem. Biotechnol., 2021, 193, 3528–3539 CrossRef CAS PubMed.
- M. M. R. Nayini, H. Sayadian, N. Razavipour and M. Rezazade, Inorg. Chem. Commun., 2020, 121, 108237 CrossRef CAS.
- E. Alipour, S. Maleki, N. Razavipour, N. Hajali and S. Jahani, J. Mol. Model., 2021, 27, 169 CrossRef CAS PubMed.
- B. T. Tomić, C. S. Abraham, S. Pelemiš, S. J. Armaković and S. Armaković, Phys. Chem. Chem. Phys., 2019, 21, 23329–23337 RSC.
- S. Armaković, S. J. Armaković, B. T. Tomić, R. R. Pillai and C. Y. Panicker, Comput. Theor. Chem., 2018, 1124, 39–50 CrossRef.
- S. Bleay, V. Sears, R. Downham, H. Bandey, A. Gibson, V. Bowman, L. Fitzgerald, T. Ciuksza, J. Ramadani and C. Selway, Fingerprint Source Book v2.0, 2nd edn, 2018 Search PubMed.
- V. D'Elia, S. Materazzi, G. Iuliano and L. Niola, Forensic Sci. Int., 2015, 254, 205–214 CrossRef PubMed.
- R. S. Croxton, S. M. Bleay and M. De Puit, Fingerprint Dev. Tech., 2018, 35–68 CAS.
- N. D. K. Petraco, G. Proni, J. J. Jackiw and A. M. Sapse, J. Forensic Sci., 2006, 51, 1267–1275 CrossRef CAS PubMed.
- D. Wilkinson, Forensic Sci. Int., 2000, 109, 87–103 CrossRef CAS PubMed.
- X. Spindler, R. Shimmon, C. Roux and C. Lennard, Forensic Sci. Int., 2011, 212, 150–157 CrossRef CAS PubMed.
- R. Brause, H. Fricke, M. Gerhards, R. Weinkauf and K. Kleinermanns, Chem. Phys., 2006, 327, 43–53 CrossRef CAS.
- A. T. Bruni, P. O. M. de Carvalho, C. H. P. Rodrigues and V. B. P. Leite, Forensic Chem., 2018, 9, 21–34 CrossRef CAS.
- A. D. Becke, J. Chem. Phys., 1998, 98, 5648 CrossRef.
- S. Grimme, S. Ehrlich and L. Goerigk, J. Comput. Chem., 2011, 32, 1456–1465 CrossRef CAS PubMed.
- V. Nardini, V. Palaretti, L. G. Dias and G. V. J. Da Silva, Molecules, 2019, 24, 1–21 CrossRef PubMed.
- S. Grimme, A. Hansen, J. G. Brandenburg and C. Bannwarth, Chem. Rev., 2016, 116, 5105–5154 CrossRef CAS PubMed.
- M. Becucci, F. Mazzoni, G. Pietraperzia, J. Řezáč, D. Natchigallová and P. Hobza, Phys. Chem. Chem. Phys., 2017, 19, 22749–22758 RSC.
- S. F. Boys and F. Bernardi, Mol. Phys., 1970, 19, 553–566 CrossRef CAS.
- R. M. Parrish, L. A. Burns, D. G. A. Smith, A. C. Simmonett, A. E. DePrince, E. G. Hohenstein, U. Bozkaya, A. Y. Sokolov, R. Di Remigio, R. M. Richard, J. F. Gonthier, A. M. James, H. R. McAlexander, A. Kumar, M. Saitow, X. Wang, B. P. Pritchard, P. Verma, H. F. Schaefer, K. Patkowski, R. A. King, E. F. Valeev, F. A. Evangelista, J. M. Turney, T. D. Crawford and C. D. Sherrill, J. Chem. Theory Comput., 2017, 13, 3185–3197 CrossRef CAS PubMed.
- J. M. Turney, A. C. Simmonett, R. M. Parrish, E. G. Hohenstein, F. A. Evangelista, J. T. Fermann, B. J. Mintz, L. A. Burns, J. J. Wilke, M. L. Abrams, N. J. Russ, M. L. Leininger, C. L. Janssen, E. T. Seidl, W. D. Allen, H. F. Schaefer, R. A. King, E. F. Valeev, C. D. Sherrill and T. D. Crawford, Wiley Interdiscip. Rev.: Comput. Mol. Sci., 2012, 2, 556–565 CAS.
- E. G. Hohenstein, R. M. Parrish, C. D. Sherrill, J. M. Turney and H. F. Schaefer, J. Chem. Phys., 2011, 135, 174107 CrossRef PubMed.
- E. G. Hohenstein and C. D. Sherrill, J. Chem. Phys., 2010, 132, 184111 CrossRef.
- E. Papajak, J. Zheng, X. Xu, H. R. Leverentz and D. G. Truhlar, J. Chem. Theory Comput., 2011, 7, 3027–3034 CrossRef CAS PubMed.
- H. Lambert, N. Mohan and T. C. Lee, Phys. Chem. Chem. Phys., 2019, 21, 14521–14529 RSC.
- A. Otero-De-La-Roza, E. R. Johnson and J. Contreras-García, Phys. Chem. Chem. Phys., 2012, 14, 12165–12172 RSC.
- E. R. Johnson, S. Keinan, P. Mori-Sánchez, J. Contreras-García, A. J. Cohen and W. Yang, J. Am. Chem. Soc., 2010, 132, 6498–6506 CrossRef CAS PubMed.
- T. Lu and F. Chen, J. Comput. Chem., 2012, 33, 580–592 CrossRef CAS PubMed.
- W. Humphrey, A. Dalke and K. Schulten, J. Mol. Graphics, 1996, 14, 33–38 CrossRef CAS PubMed.
- T. Williams and C. Kelley, Gnuplot Version 4.2 An Interactive plotting program, 2007, http://www.gnuplot.info/ Search PubMed.
- Ghostscript, Version 9.53.3, http://www.artifex.com Search PubMed.
- T. Yanai, D. P. Tew and N. C. Handy, Chem. Phys. Lett., 2004, 393, 51–57 CrossRef CAS.
- M. J. Frisch, G. W. Trucks, H. B. Schlegel, G. E. Scuseria, M. A. Robb, J. R. Cheeseman, G. Scalmani, V. Barone, G. A. Petersson, H. Nakatsuji, X. Li, M. Caricato, A. V. Marenich, J. Bloino, B. G. Janesko, R. Gomperts, B. Mennucci, H. P. Hratchian, J. V. Ortiz, A. F. Izmaylov, J. L. Sonnenberg, D. Williams-Young, F. Ding, F. Lipparini, F. Egidi, J. Goings, B. Peng, A. Petrone, T. Henderson, D. Ranasinghe, V. G. Zakrzewski, J. Gao, N. Rega, G. Zheng, W. Liang, M. Hada, M. Ehara, K. Toyota, R. Fukuda, J. Hasegawa, M. Ishida, T. Nakajima, Y. Honda, O. Kitao, H. Nakai, T. Vreven, K. Throssell, J. A. Montgomery Jr, J. E. Peralta, F. Ogliaro, M. J. Bearpark, J. J. Heyd, E. N. Brothers, K. N. Kudin, V. N. Staroverov, T. A. Keith, R. Kobayashi, J. Normand, K. Raghavachari, A. P. Rendell, J. C. Burant, S. S. Iyengar, J. Tomasi, M. Cossi, J. M. Millam, M. Klene, C. Adamo, R. Cammi, J. W. Ochterski, R. L. Martin, K. Morokuma, O. Farkas, J. B. Foresman and D. J. Fox, Gaussian 16, Revision B.01, Wallingford CT, 2016 Search PubMed.
- R. Dooley, K. Milfeld, C. Guiang, S. Pamidighantam and G. Allen, J. Grid Comput., 2006, 4, 195–208 CrossRef.
- K. Milfeld, C. Guiang, S. Pamidighantam and J. Giuliani, in Proceedings of the 2005 Linux Clusters, The HPC revolution, 2005 Search PubMed.
- N. Shen, Y. Fan and S. Pamidighantam, J. Comput. Sci., 2014, 5, 576–589 CrossRef.
- S. Pamidighantam, S. Nakandala, E. Abeysinghe, C. Wimalasena, S. R. Yodage, S. Marru and M. Pierce, Procedia Comput. Sci., 2016, 80, 1927–1939 CrossRef.
- R. Dennington, T. A. Keith and J. M. Millam, GaussView, Version 6, 2016 Search PubMed.
- C. Y. Legault, CYLview 1.0b, Université de Sherbrooke, 2009 Search PubMed.
- M. Sabzehzari, M. Ajamgard and H. R. Shamlouei, Struct. Chem., 2019, 30, 1853–1857 CrossRef CAS.
- H. Ma, Y. Hou, H. Fang and A. Sarkar, J. Comput. Electron., 2021, 20, 1065–1071 CrossRef CAS.
- N. S. Babu, Mater. Adv., 2022, 3, 3526–3535 RSC.
- Y. Yang, A. Sun and M. Eslami, Phys. E, 2021, 125, 114411 CrossRef CAS.
- Z. S. D. Toa, J. C. Dean and G. D. Scholes, J. Photochem. Photobiol., B, 2019, 190, 110–117 CrossRef CAS PubMed.
- R. B. Alnoman, E. Nabil, S. Parveen, M. Hagar and M. Zakaria, RSC Adv., 2022, 12, 11420–11435 RSC.
- A. Lewkowicz, K. Baranowska, P. Bojarski and M. Józefowicz, J. Mol. Liq., 2019, 285, 754–765 CrossRef CAS.
- S. Sudalaimani, A. Esokkiya, S. Hansda, C. Suresh, P. Tamilarasan and K. Giribabu, Food Anal. Methods, 2020, 13, 629–636 CrossRef.
- I. M. Alaoui, T. Troxler and M. M. Jouillie, J. Forensic Identif., 2012, 62, 1–13 Search PubMed.
- L. M. Hunnisett, P. F. Kelly, S. Bleay, F. Plasser, R. King, B. McMurchie and P. Goddard, J. Chem. Phys., 2021, 154, 1–5 CrossRef PubMed.
- I. Mekkaoui Alaoui and J. Halamek, J. Forensic Sci., 2019, 64, 1495–1499 CrossRef CAS PubMed.
- J. Dutta, S. A. Ramakrishna and I. Mekkaoui Alaoui, Forensic Sci. Int., 2013, 228, 32–37 CrossRef CAS PubMed.
Footnote |
| † Electronic supplementary information (ESI) available. See DOI: https://doi.org/10.1039/d2ra07044h |
| This journal is © The Royal Society of Chemistry 2023 |

