 Open Access Article
Tailor-designed binary Ni–Cu nano dendrites decorated 3D-carbon felts for efficient glycerol electrooxidation
Mohamed E. Ghaith a,
Muhammad G. Abd El-Moghny
 *a,
Gumaa A. El-Nagar*ab,
Hafsa H. Alalawya,
Mohamed E. El-Shakrea and
Mohamed S. El-Deab
 *a
*a
aChemistry Department, Faculty of Science, Cairo University, Cairo, Egypt. E-mail: elnagar087@yahoo.com; mugamal@cu.edu.eg; msaada@cu.edu.eg
bHelmholtz-Zentrum Berlin für Materialien und Energie, Berlin, Germany
First published on 4th January 2023
Abstract
Herein, 3D-Carbon Felt (CF) are decorated with nickel–copper (Ni–Cu@CF) bimetallic nanostructures through either sequential or co-electrodeposition tactics. Their catalytic activity towards glycerol electrooxidation is investigated by employing cyclic voltammetry (CV) and linear sweep voltammetry LSV. The morphology and composition of the various Ni–Cu@CF are investigated using X-ray diffraction (XRD) and field emission scanning electron microscopy (FE-SEM) together with various electrochemical measurements (e.g., CV, chronoamperometry, LSV). The co-deposition of Ni–Cu shows a dendritic-like structure with higher electrocatalytic activity towards glycerol electrooxidation compared to the monometallic counterparts. Interestingly, the best electrode (NiCu@CF Ni particles as the top layer) prepared by sequential electrodeposition shows 1.6-fold higher glycerol oxidation activity, manifested in oxidation current, compared to Ni-coated CF due to Ni particles covering the surface of dendritic copper uniformly. Thus, the surface concentration of Ni is increased and at the same time a synergistic effect occurs between Ni and Cu by the simple addition of Cu which reinforces the surface concentration of Ni from 3.4 × 10⁻⁸ to 1.1 × 10⁻⁷ mol cm−2.
1. Introduction
Direct alcohol fuel cells (e.g., methanol fuel cells) have advantages over traditional hydrogen fuel cells including better safety, high energy density, and easy handling and storing. Despite the aforementioned advantages of methanol fuel cells, they still suffer some drawbacks including high toxicity, high volatility, and poor stability of their commercial Pt-based electrodes, which is attributed to their rapid poisoning with in situ generated CO-like intermediates.1–8Glycerol seems to be a promising fuel candidate for liquid fuel cells, due to its unique features including non-volatility, lower toxicity, high boiling point, high theoretical energy density (6.4 kW h L−1), and low cost since it is a by-product of the conversion of triglyceride into biodiesel (2 million ton introduced into the market per year).9–13 Additionally, the glycerol can be oxidized into highly valuable products such as dihydroxyacetone, tartaric acid, mesoxalate, glycolic acid, and dihydroxyacetone, which can be used in many industrial fields including drug delivery, complexing agents for heavy metals, polymer synthesis, and medical applications.5,10,14–17
Nonprecious metal-based materials (e.g., Co, Fe, Cu, Ni, and their alloys) have been considered as promising cheap alternative fuel cell electrodes for the costly, poor performance noble metal-based electrodes (i.e., Pt and Pd)18–21 Among them, Ni-based catalysts are the most promising non-platinum electrocatalysts attributing to their satisfied catalytic efficiency (with respect to activity and stability) towards the oxidation of various organic compounds including methanol,22–25 ethanol,26–28 glycerol17,21,29–37 urea,38,39 glucose,40 etc. Many researchers have reported on improving the electrocatalytic performance of Ni electrocatalysts in direct glycerol fuel cells (DGFCs) by alloying it with second metal including Cu, Fe, Co, etc.20,21,41,42 For instance, El-Nagar et al.43 investigated the glycerol electrooxidation at Ni-doped electrodeposited copper foams via the dynamic hydrogen bubbles technique. B. Habibi et al.41 studied electrooxidation of glycerol at Cu–Co alloys. Both have observed that the addition of Co or Cu to Ni improved its electrocatalytic activity and stability toward glycerol electrooxidation. Oliveira et al.20 showed that Ni bimetallic and trimetallic surfaces (e.g., NiCo, NiFe and NiCoFe) exhibited better activity and stability for glycerol electrocatalysis attributing to the formation of metal oxides and hydroxides.
In this study, Cu is selected to modify Ni attributing to similar lattice parameters (a = 3.616 for Cu and 3.523 for Ni) allowing a wide range of Ni–Cu compositions with superior physical and chemical properties together with better electrocatalytic performance.41,44,45 Cu has a lower glycerol electrooxidation onset potential than Ni and can selectively electro-oxidize glycerol towards a highly valuable product (dihydroxyacetone).46 However, Cu suffers low stability and high charge transfer resistance as compared to Ni. Thus, herein, Cu is added to Ni to gain the advantages of both metals and minimize their disadvantages.
3D Carbon Felt (CF) is used as a substrate for the electrodeposited NiCu nanostructures attributing to its good stability, high specific surface area, low cost, corrosion resistance, high conductivity, and large potential window.47 Besides, its electrochemical activity can be enhanced by several simple and fast methods (acid treatment, electrochemical treatment, plasma treatment, and thermal treatment).4,48 Mohamed E. Ghaith et al.4 investigated the impact of electrooxidation of CF either in 1 M sulfuric acid or 1 M sodium hydroxide at different potentials on the performance of the electrodeposition of Ni particles towards glycerol electrooxidation. The pretreatments in either acidic or alkaline improved the catalytic activity of the electrodeposited Ni nanoparticles by 2.5 times compared to non-pretreated decorated carbon felt.
Herein, commercial-available 3D-carbon felt has been decorated with Ni–Cu bimetallic nanostructures via two different electrodeposition strategies, i.e., co-electrodeposition and sequential electrodeposition of Cu and Ni. Various electrodeposition conditions including deposition bath composition, the amount and the order of the electro-deposited catalyst have been optimized with an aim to maximize its efficiency towards glycerol electro-oxidation in alkaline medium.
2. Experimental
2.1. Materials
All the used chemicals are of analytical grade and were used as received without further purification. All the solutions were prepared using second distilled water. Sodium hydroxide (NaOH), nickel sulfate hexahydrate (NiSO4·6H2O, 99.999%), and CuSO4 anhydrous (99.999%) were purchased from Sigma-Aldrich.2.2. Electrode preparation
Before use of commercial carbon felt cleaned by ultrasonication in ethanol for 10 min then rinsed by water then activated as the previous published paper4 then decorated with bimetallic Ni–Cu particles via two different electrodeposition protocols as described below:![[thin space (1/6-em)]](https://www.rsc.org/images/entities/char_2009.gif) :
:![[thin space (1/6-em)]](https://www.rsc.org/images/entities/char_2009.gif) Ni ratios and fixed total concentration (4 mM). The obtained electrodes have given a general symbol NiXCuY@CF, where X and Y are the ratios of Ni and Cu in the electrodeposition bath, respectively.
Ni ratios and fixed total concentration (4 mM). The obtained electrodes have given a general symbol NiXCuY@CF, where X and Y are the ratios of Ni and Cu in the electrodeposition bath, respectively.Next, all the as-prepared electrodes were activated in 0.2 M NaOH for 40 cycles from 0.0 to 0.7 V with a potential scan rate of 200 mV s−1 followed by 2 cycles in the same electrolyte with a lower potential scan rate (10 mV s−1). During the preparation of all electrodes, no hydrogen evolution is noticed which means the hydrogen evolution can be ignored. So, we assume the deposition efficiency is 100%.
2.3. Material and electrochemical characterizations
3. Results and discussion
3.1. Material characterization
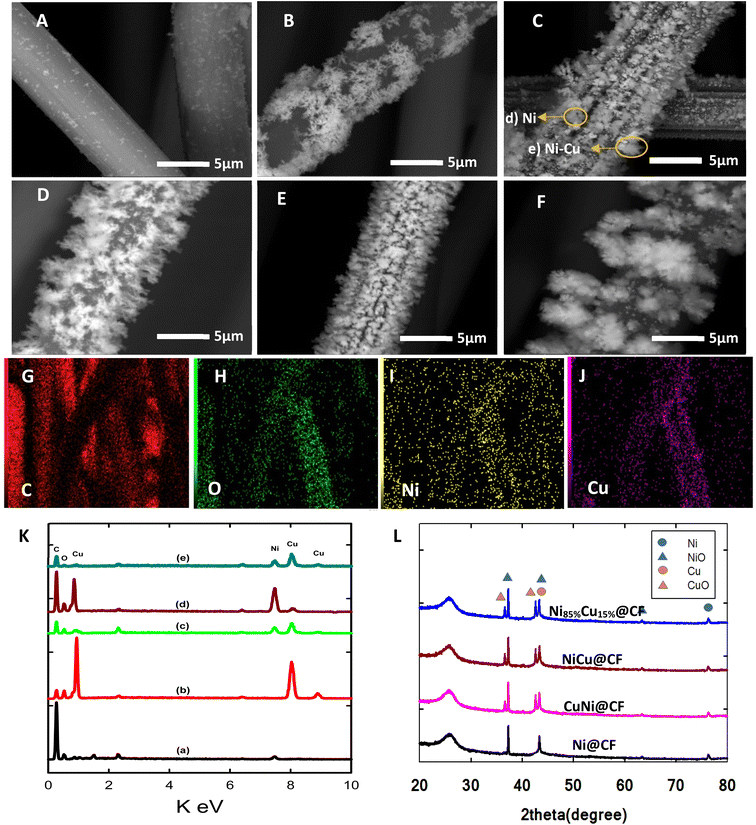
The morphology and the bulk composition of the sequentially and co-electrodeposited Cu–Ni bimetallic nanostructures were first examined by SEM-EDX to investigate the effect of used electrodeposition protocols on the shape and composition of the obtained bimetallic surfaces.Fig. 1(A–F) shows the SEM images of Ni@CF (Fig. 1A), Cu@CF (Fig. 1B), Ni85%Cu15%@CF (Fig. 1C), NiCu@CF (Fig. 1D), Ni50%Cu50%@CF (Fig. 1E), and Ni25%Cu75%@CF (Fig. 1F). As seen in this figure, while Ni@CF exhibited irregular shape-like-structure un-homogenously distributed over carbon felts, Cu@CF showed a horizontal dendritic-like structure at some positions and quite better distribution over the entire CF. On the other hand, NiCu@CF (prepared by sequential deposition approach) shows homogeneously distributed Ni particles covering the distributed vertical dendrites which is evidenced from the spot and mapping EDX of NiCu@CF at (Fig. 1K(c) and (G–J)) in which the intensity of Ni and Cu are comparable to each other. While Ni85%Cu15%@CF (synthesized by co-electrodeposition strategy) electrode shows bad Ni cover to the well-distributed dendrites which is evidenced from the spot EDX of Ni85%Cu15%@CF at two spots (Fig. 1K(d and e)) in which d spot contained mainly Ni and e spot contained both Ni and Cu hence higher electrochemically active surface sites are expected for NiCu@CF electrode compared with all other electrodes, see forward Fig. 2 and 5E.
It was quite hard to estimate the average particle size using the SEM technique, thus we used Image J software to estimate the average particle size of the modified CF with bimetallic Cu and Ni with various Cu/Ni ratios. SEM images, as shown in Fig. 1(A–F), are used to estimate the average particle size. It's clear that by increasing the percent of Cu in the bath the average particle size also increased due to increasing the length of the dendritic structure.
Fig. 1K shows the respective EDX analyses for the above-mentioned electrodes. Ni@CF electrode exhibits peaks for carbon (from the CF substrate), oxygen (from CF and deposited oxygenated metal particles), and Ni elements. While the Cu@CF electrode shows peaks for carbon, oxygen, and Cu elements. On the other hand, the bimetallic decorated CF electrodes (e.g., NiCu@CF, and Ni85%Cu15%@CF) show peaks for carbon, oxygen, nickel, and copper, ensuring the successful co-electrodeposition of both Cu and Ni particles atop of the CF. It is important to mention here that in the co-deposition technique, the electro-deposition of Cu is faster than Ni (thermodynamically). So, reducing the Cu concentration in the deposition bath makes the Ni content increase which reflects a higher ability to oxidize glycerol because Ni is more active than Cu as can be seen in Fig. 3B and 4B as well as the uniform distribution of the Ni and Cu is confirmed by the mapping EDX analysis for NiCu@CF electrode as depicted from Fig. 1(G and L).
The crystallographic orientations of the as-prepared electrodes were further investigated using XRD, as shown in Fig. 1H. It presents the XRD patterns of Ni@CF, NiCu@CF (Ni top layer), CuNi@CF (Cu top layer), and Ni85%Cu15%@CF electrodes. All the electrodes exhibited broad peaks at 2θ around 25°, and 43° attributed to the CF support.49 On the other hand, all the electrodes exhibited an additional 4 diffraction peaks which could be attributed to cubic Ni, NiO, and CuO which matched with their reference codes (01-070-1849, 01-073-1519, and 01-078-0428). Table 1 shows the change in lattice constant  where aexp lattice constant, d interplanar spacing and hkl Miller indices, lattice volume (lattice volume = (aexp)3), and average crystal size calculated from Scherrer equation for all the prepared catalysts.41,50,51 As can be seen in Table 1, the addition of Cu to Ni causes increase in each of lattice constant, lattice volume, and crystal size due to the ionic radius of Cu, which is equal to 0.73 Å, is larger than the ionic radius of Ni which is equal to 0.69 Å.51
| Factor | Composition | Ni@CF | NiCu@CF | CuNi@CF | Ni85Cu15@CF |
|---|---|---|---|---|---|
| Lattice constant (Å) | NiO | 4.155 | 4.156 | 4.157 | 4.162 |
| CuO | — | 4.242 | 4.241 | 4.240 | |
| Ni | 3.528 | 3.528 | 3.529 | 3.530 | |
| Lattice volume (Å3) | NiO | 71.743 | 71.809 | 71.823 | 72.101 |
| CuO | — | 76.327 | 76.273 | 76.225 | |
| Ni | 43.898 | 43.912 | 43.950 | 43.987 | |
| Crystal size (nm) | NiO | 37.8 | 38.1 | 38.9 | 40 |
| CuO | — | 51.0 | 50.9 | 50.0 | |
| Ni | 24.1 | 24.1 | 25.0 | 26.5 |
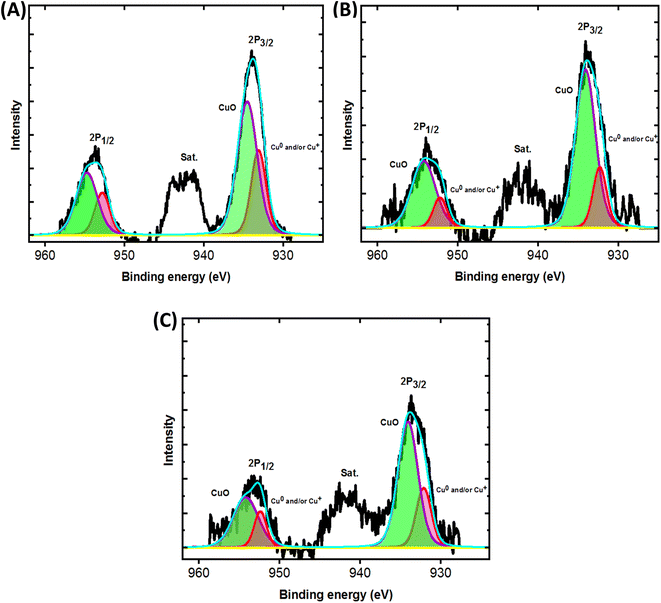
Furthermore, XPS was used to acquire more information about composition of the surface and oxidation state of the electrodeposited Cu. Fig. 2 shows high resolution XPS Cu 2p for Cu@CF, NiCu@CF and Ni85%Cu15%@CF electrodes. The oxidation state of Cu in the aforementioned electrodes is found to be (0 and/or +1 and +2) according to XPS analysis (deconvoluted peaks) where, the bands at the binding energies 932.7 eV and 952.7 eV are corresponding to Cu0 and/or Cu1+ and at the binding energies 934.4 eV and 954.7 eV are attributed to Cu2+ that also confirmed by the presence of the satellite peaks as displayed in Fig. 2. Additionally, the Cu 2p peaks are shifted to lower binding energies in the presence of Ni (NiCu@CF and Ni85%Cu15%@CF) by ∼0.4 eV which suggests the interaction between Ni and Cu particles consequently better activity of the prepared catalysts observed as can be seen in the Fig. 3.
3.2. Glycerol electrooxidation
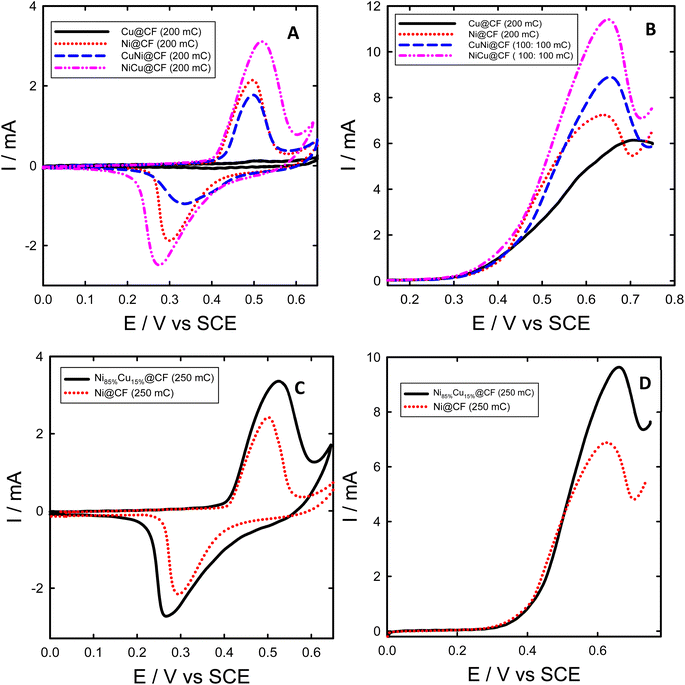
CV technique was used to study electrochemical behavior and the performance of the as-prepared electrodes towards glycerol electrooxidation, as displayed in Fig. 3. Fig. 3(A and C) shows characteristic CVs obtained for Ni@CF, Cu@CF, NiCu@CF, CuNi@CF, and Ni85%Cu15%@CF electrodes in 0.2 M NaOH solution. As seen in Fig. 3(A and C), all the studied electrodes except the Cu@CF exhibited a redox peak couple at around 0.5 V vs. SCE which is attributed to the β-Ni(OH)2/β-NiOOH transformation.21,41,52 Indeed, Cu@CF did not show any noticeable features under the measuring conditions. In the case of electrodes consisting of Ni and Cu, during the forward scan firstly Ni is converted to Ni(OH)2 at lower potential and by raising the potential, the surface became a mixture of NiOOH and (Cu(OH)2 or CuO) where the later one can also be converted to Cu(III).41Interestingly, NiCu@CF and Ni85%Cu15%@CF electrodes showed stronger β-Ni(OH)2/β-NiOOH transformation peaks compared to Ni@CF electrode of the same loadings (60.81 and 76.02 μg), where 1.5 and 1.4 times higher β-Ni(OH)2/β-NiOOH peak intensities were obtained for NiCu@CF and Ni85%Cu15%@CF electrodes, respectively, suggesting much higher active surface concentration of Ni in the binary Cu–Ni electrodes. In other words, the bimetallic Cu–Ni decorated CF electrodes have higher Ni active surface sites compared to the decorated CF with pure Ni particles, despite their large average particle size. This increase of the surface-active sites could be attributed to the bimetallic dendrite-like structure as demonstrated from their respective SEM images (see Fig. 1(A–F)).
We estimated the surface concentration (Γ) of all electrodes using the following equation (eqn (1)):52
| Γ = Q/nFA | (1) |
![[thin space (1/6-em)]](https://www.rsc.org/images/entities/char_2009.gif) 500 C mol−1), and A is the geometrical surface area of the working electrode (cm2).32 The Γ was found to be 34, 12, 63, and 112 nmol cm−2 for Ni@CF, CuNi@CF, Ni85%Cu15%@CF, and NiCu@CF electrodes at the same Ni loading 60.8 μg, respectively. It is clear that further modification of Ni with Cu (sequential or co-deposition approach) resulted in a significant increase in the active surface species and NiCu@CF is the best electrode compared with the other electrodes which raise Γ by about 3.3 times over than Ni@CF electrode that may be due to the uniform homogeneous distribution of the Ni on the surface of the dendritic Cu (using sequential deposition technique).
500 C mol−1), and A is the geometrical surface area of the working electrode (cm2).32 The Γ was found to be 34, 12, 63, and 112 nmol cm−2 for Ni@CF, CuNi@CF, Ni85%Cu15%@CF, and NiCu@CF electrodes at the same Ni loading 60.8 μg, respectively. It is clear that further modification of Ni with Cu (sequential or co-deposition approach) resulted in a significant increase in the active surface species and NiCu@CF is the best electrode compared with the other electrodes which raise Γ by about 3.3 times over than Ni@CF electrode that may be due to the uniform homogeneous distribution of the Ni on the surface of the dendritic Cu (using sequential deposition technique).
Electrocatalytic activity of Ni@CF, Cu@CF, CuNi@CF, Ni85%Cu15%@CF, and NiCu@CF electrodes were examined in 0.2 M NaOH solution containing 8 mM glycerol and the data is presented in Fig. 3. As obviously seen in Fig. 3(B and D), both NiCu@CF and Ni85%Cu15%@CF electrodes showed superior activity for glycerol oxidation compared to the Ni@CF, and pure Cu@CF electrodes. These enhancements are demonstrated by the large increase of the obtained glycerol oxidation peak current at the bimetallic electrodes compared to the single metal modified electrodes which increased by about 1.6 and 1.4 times in case of NiCu@CF and Ni85%Cu15%@CF respectively over than Ni@CF. This might be attributed to their unique dendritic-like structures providing more surface-active sites. By subtract the peak current of Ni oxidation in 0.2 M NaOH solution from the peak current of glycerol oxidation which obtained at the same potential scan rate (10 mV s−1), we can figure out that enhancement in oxidation currents of glycerol is due to the increase of the oxidation peak of Ni or due to the synergistic effect between Ni and Cu particles in the dendritic-like structures. The enhancement after subtracting is found to be in the same ratios obtained previously that means the enhancement is due to the synergistic effect between Ni and Cu particles which is in agreement with the XPS analysis.
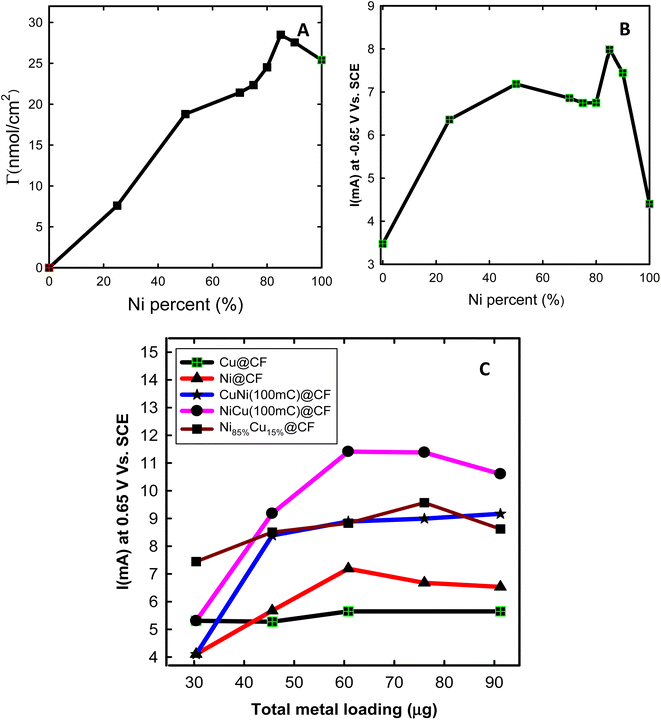
3.3. Optimization of the electrodeposition parameters
Different deposition parameters (e.g., Cu![[thin space (1/6-em)]](https://www.rsc.org/images/entities/char_2009.gif) :
:![[thin space (1/6-em)]](https://www.rsc.org/images/entities/char_2009.gif) Ni ratio, loadings, etc.) have been optimized to prepare electrodes with the highest possible performance for glycerol electrooxidation.
Ni ratio, loadings, etc.) have been optimized to prepare electrodes with the highest possible performance for glycerol electrooxidation.
3.4. Catalyst stability
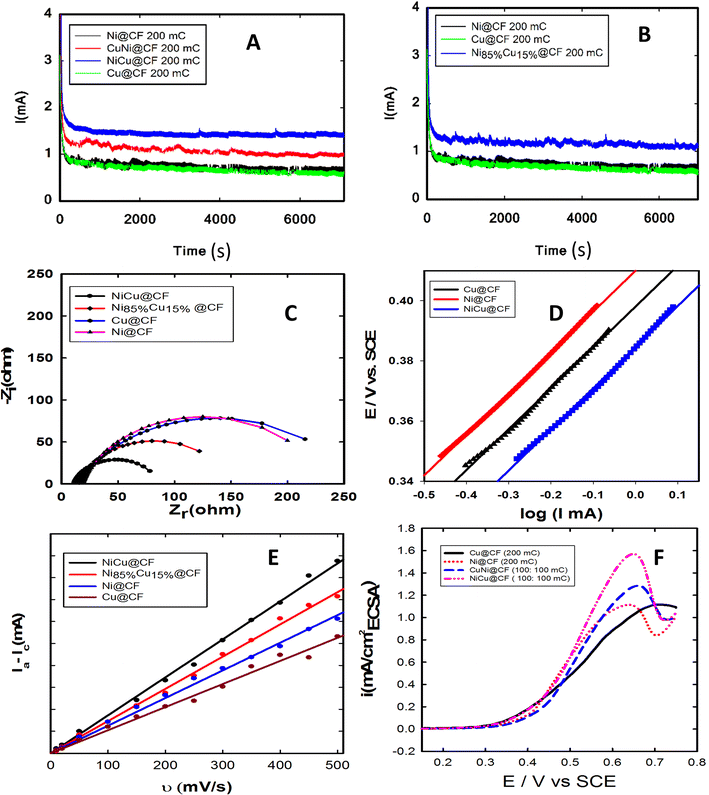
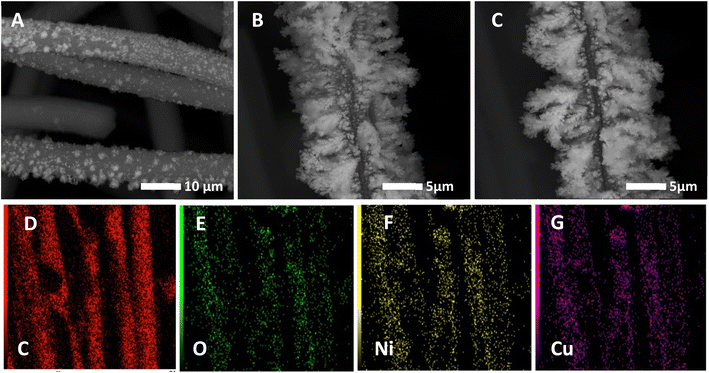
Catalyst stability is one of the most important issues of fuel cell technology, thus the long-term stability of the optimized electrodes was next investigated via recording their chronoamperometric responses at 0.6 V for 2 h as shown in Fig. 5. As seen in this figure, all the investigated electrodes showed good stability under the measuring conditions. NiCu@CF and Ni85%Cu15%@CF electrodes supported higher oxidation currents with the lowest activity loss rates compared to the single metal modified CF electrodes. Clearly, Ni@CF and Cu@CF electrodes lost ∼30 and 26%, respectively, from their initial performance after only 950 s while NiCu@CF and Ni85%Cu15%@CF lost only 8.5 and 8.9%, respectively, from their initial activities. Additionally, our prepared catalysts show better activity towards glycerol electrooxidation than most recent published papers, as compared in Table 2. SEM and mapping-EDX as can be seen from Fig. 6 are performed to figure out the structure and morphological stability for the best electrode (NiCu@CF) after 2 h of continuous operation. Fig. 6A–C shows three different points on the CF substrate to reveal that the dendritic morphology is still present and at the same time from the corresponding-colored mapping EDX Fig. 6D–G, it is clear that Ni and Cu are homogeneously distributed on the surface of the CF after long-term stability.| Catalyst | [Glycerol] mol L−1 | [NaOH] mol L−1 | I (A g−1) at 1.6 V vs. RHE | Scan rate (mV s−1) | Ref. |
|---|---|---|---|---|---|
| a (CCE) carbon ceramic electrode.b (SW) applying sinusoidal wave. | |||||
| CoNi@C | 0.1 | 0.1 | 0.063 | 50 | 20 |
| FeNi@C | 0.1 | 0.1 | 0.052 | 50 | 20 |
| FeCoNi@C | 0.1 | 0.1 | 0.065 | 50 | 20 |
| Ni@(CCE)b | 0.1 | 1.0 | 24.372 | 50 | 41 |
| NiCu@CCE | 0.1 | 1.0 | 43.871 | 50 | 41 |
| NiCo@CCE | 0.1 | 1.0 | 116.990 | 50 | 41 |
| Porous Cu/Cu2O | 0.1 | 0.1 | 6.6 at 1.5 V | 10 | 56 |
| 20 mM Ni doped porous Cu/Cu2O | 0.1 | 0.1 | 6.423 | 10 | 57 |
| Ni wire | 0.1 | 1 M KOH | 0.47 | 50 | 21 |
| Ni wire/SWa | 0.1 | 1 M KOH | 1.5 | 50 | 21 |
| Ni90%Bi10% | 0.1 | 1 M KOH | 360 | 50 | 58 |
| NiCu@CF | 0.008 | 0.2 | 140.892 | 10 | This work |
| Ni85%Cu15%@CF | 0.008 | 0.2 | 118.695 | 10 | |
3.5. Electrochemical impedance spectroscopy (EIS) studies
The EIS was next measured to figure out the best prepared catalyst toward glycerol electro-oxidation. Nyquist plots of NiCu@CF, CuNi@CF, Ni@CF, Ni85%Cu15%@CF, and Cu@CF electrodes measured in 0.2 M NaOH solution containing 8 mM glycerol at 0.4 V vs. SCE displayed in Fig. 5C. As shown in Fig. 5C, the order of the charge transfer resistance (Rct) is found to be NiCu@CF < Ni85%Cu15%@CF < Ni@CF < Cu@CF, suggesting that NiCu@CF is the best electrode which reduces Rct from 214.2 Ohm in case of Ni@CF electrode to 75.5 Ohm. So, it has the faster glycerol electrooxidation kinetics at the bimetallic surfaces which may be due to Ni particles covering the surface of dendritic copper homogeneously. Thus, the surface concentration of Ni is increased and at the same time the synergistic effect occurs between Ni and Cu. The obtained results were fitted using Randles equivalent circuit.3.6. Tafel plots
Tafel plots were measured for Ni@CF, Cu@CF and NiCu@CF in 0.2 M NaOH solution containing 8 mM glycerol at potential scan rate of 10 mV s−1, data are displayed in Fig. 5D which allow to investigate the effect of addition of Cu on the kinetics of glycerol electrooxidation. Tafel slopes for Ni@CF, Cu@CF, and NiCu@CF were found to be 136, 135 and 132 mV dec−1. The nominal similarity in Tafel slopes indicates that all the prepared electrodes have the same rate determining steps. Furthermore, the exchange current density (i0) is estimated to be 0.27, 0.30, and 0.48 nA m−2 for Ni@CF, Cu@CF and NiCu@CF electrodes, respectively, which further support the facile kinetics of the glycerol electrooxidation at NiCu@CF electrode.3.7. Electrochemical active surface area (ECSA)
To figure out the enhancement in the activity simply due to increase in the number of active sites or by the action of the intrinsic activity. The intrinsic activity of the prepared electrodes can be revealed from electrochemical active surface area (ECSA) normalization, see Fig. 5(E and F).53–55 To estimate the ECSA, the relation between the capacitive non-faradaic current density with the potential scan rate was used to estimate the ECSA using eqn (2) (ref. 54) for Ni@CF, Cu@CF, Ni85%Cu15%@CF, and NiCu@CF, see Fig. 5E.
 | (2) |
 , Ia is the anodic current and Ic is the cathodic current while Cs is the specific surface area equal to 0.04 mF cm−2 in NaOH. The estimated ECSA found to be in order of NiCu@CF > Ni85%Cu15%@CF > Ni@CF > Cu@CF thus it is believed that NiCu@CF has the better electro-catalytic activity towards glycerol electrooxidation. Moreover, NiCu@CF (sequential deposited) has the highest redox charge peak which further supports its catalytic activity as depicted from Fig. 3 and that in agreement with the idea of the better cover of Ni on the dendritic Cu which creates a large number of active sites. Also, Fig. 5F shows that after normalization the obtained current by ECSA, NiCu@CF is the best electrode. Thus, it is believed that the enhancement in the activity returns to the increase in the number of active sites as well as small increase in the intrinsic activity.
4. Conclusion
A novel catalyst was prepared by Cu metal insertion to Ni using sequential electrodeposition in which reverse deposition' order of Ni and Cu was investigated and at the same time different ratios of Ni and Cu in the deposition bath were investigated (co-deposition). In case of the sequential electrodeposition, the presence of Ni on the outermost layer (NiCu@CF electrode) was found to boost the performance by ∼1.6 times higher than that at Ni@CF electrode with stability loss of only 8.5% after ∼2 h of continuous operation as well as reducing the onset potential by about 63 mV. In case of the co-deposition, great enhancement in the activity and stability is achieved when the Ni to Cu ratio is equal to 85![[thin space (1/6-em)]](https://www.rsc.org/images/entities/char_2009.gif) :
:![[thin space (1/6-em)]](https://www.rsc.org/images/entities/char_2009.gif) 15%. The electrocatalytic activity was ∼1.4 times higher than that at Ni@CF electrode with a stability loss of only 8.9%. So, the electrode prepared via sequential deposition technique was found to be better than that prepared by the co-deposition one. This may be due to Ni particles covering the surface of dendritic copper in a uniform manner, in case of sequential technique. Thus, the surface concentration of Ni is increased from 34 to 63, and 112 nmol cm−2 for Ni@CF, Ni85%Cu15%@CF, and NiCu@CF electrodes, respectively, and a synergistic effect occurs between Ni and Cu. At the same time, electrode kinetics was enhanced towards glycerol electrooxidation which reduces the charge transfer resistance from 214.2 to 75.5, and 134.9 Ohm for Ni@CF, NiCu@CF, and Ni85%Cu15%@CF electrodes, respectively.
15%. The electrocatalytic activity was ∼1.4 times higher than that at Ni@CF electrode with a stability loss of only 8.9%. So, the electrode prepared via sequential deposition technique was found to be better than that prepared by the co-deposition one. This may be due to Ni particles covering the surface of dendritic copper in a uniform manner, in case of sequential technique. Thus, the surface concentration of Ni is increased from 34 to 63, and 112 nmol cm−2 for Ni@CF, Ni85%Cu15%@CF, and NiCu@CF electrodes, respectively, and a synergistic effect occurs between Ni and Cu. At the same time, electrode kinetics was enhanced towards glycerol electrooxidation which reduces the charge transfer resistance from 214.2 to 75.5, and 134.9 Ohm for Ni@CF, NiCu@CF, and Ni85%Cu15%@CF electrodes, respectively.
Conflicts of interest
There are no conflicts to declare.References
- W. Tokarz, G. Lota, E. Frackowiak, P. Piela and A. Czerwinski, Electrochim. Acta, 2013, 98, 94–103 CrossRef CAS
.
- J. R. C. Salgado, A. Anson, I. Tacchini, M. F. Montemor, E. R. Gonzalez, V. Paganin, M. A. Salvador, P. Ferreira, F. M. L. Figueiredo and M. G. S. Ferreira, Int. J. Hydrogen Energy, 2012, 38, 910–920 CrossRef
.
- M. S. Kim, B. Fang, N. K. Chaudhari, M. Song, T. S. Bae and J. S. Yu, Electrochim. Acta, 2010, 55, 4543–4550 CrossRef CAS
.
- M. E. Ghaith, G. A. El-Nagar, M. G. Abd El-Moghny, H. H. Alalawy, M. E. El-Shakre and M. S. El-Deab, Int. J. Hydrogen Energy, 2020, 45, 9658–9668 CrossRef CAS
.
- B. C. Ong, S. K. Kamarudin and S. Basri, Int. J. Hydrogen Energy, 2017, 42, 10142–10157 CrossRef CAS
.
- M. S. Lashkenari, M. Ghorbani, N. Silakhori and H. Karimi-Maleh, Mater. Chem. Phys., 2021, 262, 124290 CrossRef CAS
.
- C. Qiu, R. Shang, Y. Xie, Y. Bu, C. Li and H. Ma, Mater. Chem. Phys., 2010, 120, 323–330 CrossRef CAS
.
- G. Li, B. Shi, Y. Gong, Y. Zhang, X. Wang, M. Guo and X. Lyu, Mater. Chem. Phys., 2020, 243, 122570 CrossRef CAS
.
- R. Ciriminna, C. Pina, M. Rossi and M. Pagliaro, Eur. J. Lipid Sci. Technol., 2014, 1–22 Search PubMed
.
- C. A. G. Quispe, C. J. R. Coronado and J. A. Carvalho, Renewable Sustainable Energy Rev., 2013, 27, 475–493 CrossRef CAS
.
- B. T. X. Lam, M. Chiku, E. Higuchi and H. Inoue, Adv. Nanopart., 2016, 05, 60–66 CrossRef CAS
.
- A. N. Geraldes, D. F. Da Silva, L. G. D. A. E Silva, E. V. Spinacé, A. O. Neto and M. C. Dos Santos, J. Power Sources, 2015, 293, 823–830 CrossRef CAS
.
- H. H. Abdelhady, H. A. Elazab, E. M. Ewais, M. Saber and M. S. El-Deab, Fuel, 2020, 261, 116481 CrossRef CAS
.
- Z. Zhang, L. Xin, J. Qi, D. J. Chadderdon and W. Li, Appl. Catal., B, 2013, 136–137, 29–39 CrossRef CAS
.
- A. Ashok and A. Kumar, Int. J. Hydrogen Energy, 2020, 46, 4788–4797 CrossRef
.
- C. Liu, M. Hirohara, T. Maekawa, R. Chang, T. Hayashi and C. Y. Chiang, Appl. Catal., B, 2020, 265, 118543 CrossRef CAS
.
- M. Simões, S. Baranton and C. Coutanceau, Appl. Catal., B, 2010, 93, 354–362 CrossRef
.
- V. L. Oliveira, C. Morais, K. Servat, T. W. Napporn, P. Olivi, K. B. Kokoh and G. Tremiliosi-Filho, Electrocatalysis, 2015, 6, 447–454 CrossRef CAS
.
- V. L. Oliveira, C. Morais, K. Servat, T. W. Napporn, G. Tremiliosi-Filho and K. B. Kokoh, J. Electroanal. Chem., 2013, 703, 56–62 CrossRef CAS
.
- V. L. Oliveira, C. Morais, K. Servat, T. W. Napporn, G. Tremiliosi-Filho and K. B. Kokoh, Electrochim. Acta, 2014, 117, 255–262 CrossRef CAS
.
- M. S. E. Houache, E. Cossar, S. Ntais and E. A. Baranova, J. Power Sources, 2018, 375, 310–319 CrossRef CAS
.
- Y. Wang, Y. Wang, J. Zang, L. Dong, H. Pan and Y. Yuan, Electrochim. Acta, 2013, 113, 583–590 CrossRef CAS
.
- Z. Qi, H. Geng, X. Wang, C. Zhao, H. Ji, C. Zhang, J. Xu and Z. Zhang, J. Power Sources, 2011, 196, 5823–5828 CrossRef CAS
.
- Y. Zhao, L. Fan, J. Ren and B. Hong, Int. J. Hydrogen Energy, 2014, 39, 4544–4557 CrossRef CAS
.
- A. Papaderakis, N. Pliatsikas, C. Prochaska, K. M. Papazisi, S. P. Balomenou, D. Tsiplakides, P. Patsalas and S. Sotiropoulos, Front. Chem., 2014, 2, 1–11 CAS
.
- D. Soundararajan, J. H. Park, K. H. Kim and J. M. Ko, Curr. Appl. Phys., 2012, 12, 854–859 CrossRef
.
- Y. Hong, H. J. Kim, H. J. Lee, J. Kim and S. Il Choi, Front. Chem., 2019, 7, 1–9 CrossRef
.
- S. Chemchoub, L. Oularbi, A. El Attar, S. A. Younssi, F. Bentiss, C. Jama and M. El Rhazi, Mater. Chem. Phys., 2020, 250, 123009 CrossRef CAS
.
- M. R. Rizk and M. G. Abd El-Moghny, Int. J. Hydrogen Energy, 2021, 46, 645–655 CrossRef CAS
.
- M. R. Rizk, M. G. Abd El-Moghny, A. Mazhar, M. S. El-Deab and B. E. El-Anadouli, Sustainable Energy Fuels, 2021, 5, 986–994 RSC
.
- M. Rizk, M. Abd El-Moghny and M. El-Deab, J. Electrochem. Soc., 2020, 167, 114505 CrossRef CAS
.
- Y. Kang, W. Wang, Y. Pu, J. Li, D. Chai and Z. Lei, Chem. Eng. J., 2017, 308, 419–427 CrossRef CAS
.
- R. M. A. Tehrani and S. Ab Ghani, Electrochim. Acta, 2012, 70, 153–157 CrossRef CAS
.
- S. Lee, H. J. Kim, S. M. Choi, M. H. Seo and W. B. Kim, Appl. Catal., A, 2012, 429–430, 39–47 CrossRef CAS
.
- M. Kapkowski, P. Bartczak, M. Korzec, R. Sitko, J. Szade, K. Balin, J. Lelątko and J. Polanski, J. Catal., 2014, 319, 110–118 CrossRef CAS
.
- Y. Z. Su, Q. Z. Xu, Q. S. Zhong, C. J. Zhang, S. T. Shi and C. W. Xu, Mater. Res. Bull., 2015, 64, 301–305 CrossRef CAS
.
- A. Y. Tsivadze, M. R. Tarasevich, V. A. Bogdanovskaya and M. R. Ehrenburg, Dokl. Chem., 2008, 419, 54–56 CrossRef CAS
.
- E. Lohrasbi and M. Asgari, Adv. Anal. Chem., 2015, 5, 9–18 Search PubMed
.
- M. A. Goda, M. G. Abd El-Moghny and M. S. El-Deab, J. Electrochem. Soc., 2020, 167, 064522 CrossRef CAS
.
- A. M. Ahmed, S. Y. Sayed, G. A. El-Nagar, W. M. Morsi, M. S. El-Deab and B. E. El-Anadouli, J. Electroanal. Chem., 2019, 835, 313–323 CrossRef CAS
.
- B. Habibi and N. Delnavaz, RSC Adv., 2016, 6, 31797–31806 RSC
.
- M. R. Rizk, M. G. Abd El-Moghny, H. H. Abdelhady, W. M. Ragheb, A. H. Mohamed, H. F. Fouad, M. Mohsen, A. S. Kamel and M. S. El-Deab, Int. J. Hydrogen Energy, 2022, 47, 32145–32157 CrossRef CAS
.
- G. A. El-Nagar, I. Derr, T. Kottakkat and C. Roth, ECS Trans., 2017, 80, 1013–1022 CrossRef CAS
.
- I. Danaee, M. Jafarian, F. Forouzandeh, F. Gobal and M. G. Mahjani, Int. J. Hydrogen Energy, 2008, 33, 4367–4376 CrossRef CAS
.
- I. Danaee, M. Jafarian, F. Forouzandeh, F. Gobal and M. G. Mahjani, Int. J. Hydrogen Energy, 2009, 34, 859–869 CrossRef CAS
.
- C. Liu, M. Hirohara, T. Maekawa, R. Chang, T. Hayashi and C. Y. Chiang, Appl. Catal., B, 2020, 265, 118543 CrossRef CAS
.
- A. M. Abdelrahim, M. G. A. El-moghny, M. E. El-shakre and M. S. El-deab, J. Energy Storage, 2023, 57, 106218 CrossRef
.
- A. M. Abdelrahim, M. G. Abd El-Moghny, M. E. El-Shakre and M. S. El-Deab, Electrochim. Acta, 2023, 440, 141726 CrossRef CAS
.
- M. S. El-Deab, G. A. El-Nagar, A. M. Mohammad and B. E. El-Anadouli, J. Power Sources, 2015, 286, 504–509 CrossRef CAS
.
- N. Benipal, J. Qi, Q. Liu and W. Li, Appl. Catal., B, 2017, 210, 121–130 CrossRef CAS
.
- S. K. Kumar, N. Murali, D. Parajuli, A. Ramakrishna, P. S. V. Rao and M. P. Rao, Solid State Technol., 2020, 63, 4069–4077 Search PubMed
.
- M. M. Saleh, A. M. Ghonim and B. E. El-Anadouli, Int. J. Biosens. Bioelectron., 2017, 2, 45–53 Search PubMed
.
- S. Nitopi, E. Bertheussen, S. B. Scott, X. Liu, A. K. Engstfeld, S. Horch, B. Seger, I. E. L. Stephens, K. Chan, C. Hahn, J. K. Nørskov, T. F. Jaramillo and I. Chorkendorff, Chem. Rev., 2019, 119, 7610–7672 CrossRef CAS PubMed
.
- I. O. Baibars, M. G. Abd El-Moghny and M. S. El-Deab, J. Environ. Chem. Eng., 2022, 10, 2 Search PubMed
.
- F. Dionigi, J. Zhu, Z. Zeng, T. Merzdorf, H. Sarodnik, M. Gliech, L. Pan, W. X. Li, J. Greeley and P. Strasser, Angew. Chem., Int. Ed., 2021, 60, 14446–14457 CrossRef CAS PubMed
.
- M. R. Rizk, M. G. Abd El-Moghny and M. S. El-Deab, J. Electrochem. Soc., 2020, 167, 114505 CrossRef CAS
.
- M. R. Rizk, M. G. Abd El-Moghny, G. A. El-Nagar, A. A. Mazhar and M. S. El-Deab, ChemElectroChem, 2020, 7, 951–958 CrossRef CAS
.
- M. S. E. Houache, K. Hughes, R. Safari, G. A. Botton and E. A. Baranova, ACS Appl. Mater. Interfaces, 2020, 12, 15095–15107 CrossRef CAS PubMed
.
| This journal is © The Royal Society of Chemistry 2023 |

