DOI:
10.1039/D2RA06500B
(Paper)
RSC Adv., 2023,
13, 4361-4375
Degradation of ciprofloxacin by a constitutive g-C3N4/BiOCl heterojunction under a persulfate system
Received
15th October 2022
, Accepted 9th January 2023
First published on 2nd February 2023
Abstract
Ciprofloxacin (CIP) is a third-generation quinolone antimicrobial with broad-spectrum antimicrobial activity, and is not fully metabolized in the human body, resulting in more than 70% of CIP being excreted into water as a prodrug. In this study, g-C3N4/BiOCl heterojunction structure composites were prepared to study the degradation effect of ciprofloxacin (CIP) under photocatalytic conditions. The results showed that CIP at 10 mg L−1 was best degraded after 90 min at 0.3 g L−1 g-C3N4/BiOCl-2, pH of 5.8 and PS dosing of 1 mM. The quenching experiments and electron spin resonance spectroscopy (ESR) confirmed that ˙OH, ˙SO4− and h+ played a major role. After the photocatalytic degradation of this reaction system, the biological toxicity of CIP was effectively controlled. This material is stable and the CIP removal rate remained above 80% after four cycles of experiments.
1. Introduction
Photocatalytic technology can exploit solar irradiation to recognize photocatalytic H2 production, H2O2 production, NO purification and reduction of CO2 for solar energy conversion.1 Additionally, substantial efforts have also been focused on the reduction of heavy metal cations such as Cr(VI), degradation of organic pollutants, bacterial inactivation, and dye degradation, which furnished several approaches for the remediation of pollutants.2 Photocatalysts are the core of photocatalytic technology, and play a significant role in harvesting light and driving the reaction.3 Therefore, the exploration of extremely effective semiconductor-based photocatalysts is essential for the evolution of photocatalytic green technology. Generally, conventional semiconductor photocatalysts have some following disadvantages: (i) a quick recombination rate of photoinduced electron (e−) and hole (h+) pairs and (ii) few reactive sites on the catalyst surface, which are the major factors limiting their photocatalytic activities. Consequently, diverse strategies and methods have been developed to solve the aforementioned issues. The modified strategies include co-catalyst loading, elemental doping, fabrication of heterojunctions, nanostructure design and formation of composites, which are beneficial for enhancing the photocatalytic activities.4,5 Noble metals such as Au, Ag, Pt, and Pd are usually used as co-catalysts.6,7 Nevertheless, their high cost and low availability restrict their usage. Therefore, investigating cheap and potent co-catalysts to substitute noble metals is greatly desirable for photocatalytic applications. Currently, several 2D semiconductor photocatalysts such as metal oxides,8,9 metal phosphides,10 and graphitic carbon nitride (g-C3N4 (ref. 11)) have been recognized to enhance photocatalytic activity by virtue of their non-toxic nature, long-lasting durability, enormous surface area, and appropriate band gap. Therefore, various strategies have been implemented to reduce the limitations of these 2D semiconductor materials such as doping, morphology modulation, and construction of heterojunctions.
The widespread research in the field of photocatalysis still suffers from some restrictions such as low photoconversion efficiency and fast electron–hole recombination, thus limiting practical applications. As such, the development of innovative photocatalysts with greater solar light harvesting is greatly needed. Although many semiconductors have been explored in this regard, g-C3N4 has emerged strongly as the most suitable and cost-effective, with suitable band gap and band alignment in the field of photocatalysis.12 The organic polymer graphitic carbon nitride (g-C3N4) in its nanostructured form with easy preparation, low cost, extraordinary stability, suitable band gap had been regarded as one of the most auspicious next generation visible-light-responsive metal-free photocatalysts in the field of environmental pollution abatement and hydrogen evolution.13,14 But still its applications are constrained due to its low surface area, inadequate light absorption, grain boundary effect and fast recombination of electron–hole pairs. To overcome such limitations various approaches like band gap engineering, morphological modifications, introduction of porosity, heterojunction designing, composite formation, cationic/anionic doping has been introduced. Despite all the advantages it is still challenging to achieve the photocatalytic performance because of its specific surface area and high photo excitons recombination rate.15
In this respect, construction of Z-scheme based photocatalytic system is the best way to improve the charge separation efficiency as well as easy charge migration at the interface.16–18 The fabrication of g-C3N4-based Z-scheme heteronanostructures with an appropriate semiconductor having suitable band alignment holds a significant position in this field.19 Until now an efficient g-C3N4 based Z-scheme type heterostructure photocatalyst, effective under solar light is yet to be established for the practical application. Layered structure semiconductor materials have attracted much attention due to their layered structures, with high layer charge density along with two-dimensional interlayer spaces of flexible height, which create a streamlined path for electron transport. Bismuth chloride oxide (BiOCl) has the advantages of good stability, non-toxicity and stable chemical properties, and is a non-toxic white crystalline powder with a typical layered structure inside the photocatalyst.20,21 In this study, BiOCl photocatalysts were prepared by hydrothermal synthesis, and g-C3N4/BiOCl heterojunction structure composites were prepared by combining g-C3N4 and BiOCl in order to change the catalytic activity of BiOCl. It showed strong photocatalytic activity for the degradation of the CIP under simulated visible light conditions. Its structure, morphology, specific surface area, visible light absorption capacity and other properties have been fully investigated. The photocatalytic performance of g-C3N4/BiOCl composites was tested by combining photocatalysis with advanced oxidation to remove ciprofloxacin from water. The results showed that the photocatalytic activity of g-C3N4/BiOCl heterojunction was significantly higher than that of single g-C3N4.22,23 In addition, the prepared g-C3N4/BiOCl heterostructure can be used as an effective photocatalyst for CIP degradation, and its mechanism is discussed in detail.24,25
2. Materials and methods
2.1 Chemicals and materials
Ciprofloxacin (analytical pure) Maclean Biochemical Technology Co., Ltd; urea (analytical pure) Sinopharm Group Chemical Reagent Co. (analytical purity) Tianjin Guangfu Fine Chemical Research Institute. In this study, all solutions were prepared with deionized water.
2.2 Preparation and characterization of g-C3N4/BiOCl
The g-C3N4/BiOCl was synthesized by hydrothermal synthesis and high-temperature calcination. 20 g of urea was first calcined in a muffle furnace for 4 h. The prepared g-C3N4 (the mass ratio of g-C3N4 to Bi atoms was 10%, 30%, 60% and 90%) and bismuth nitrate pentahydrate were dissolved in mannitol, and then 2 mmol of potassium chloride was added and stirred for 60 min until all the reagents were dissolved. The solution was then transferred to a 100 mL Teflon-lined autoclave with a reaction temperature set to 160 °C and a heating time of 3 h. After the reaction kettle was cooled to room temperature, the suspension was washed by centrifugation with deionized water and anhydrous ethanol for three times, and then dried at 80 °C for 12 h. The dried material was ground to a particle-free yellow powder, which is g-C3N4/BiOCl. The composite catalysts were named according to the doping amount of g-C3N4 from low to high as: g-C3N4/BiOCl-1, g-C3N4/BiOCl-2, g-C3N4/BiOCl-3 and g-C3N4/BiOCl-4 (abbreviations: CN/BOC-1, CN/BOC-2, CN/BOC-3 and CN/BOC-4).
The glass instruments used in this study were manufactured by Chongzhou Shu Glass Scientific Instruments Co. Scanning electron microscope (SEM, FEI S-4800, USA); PL-X300D xenon lamp light source (Beijing Princeton Technology Co., Ltd); X-ray diffractometer (Bruker D8 Advance, Germany); UV-visible spectrophotometer (DR6000, Hash Company, USA); transmission electron microscope (JEOL 2100, Japan); X-ray photoelectron energy spectrometer (Thermo Fisher Nexsa, UK).
2.3 Photocatalytic degradation of ciprofloxacin
Ciprofloxacin (CIP 10 mg) solid powder was dissolved in deionized water (1 L) to form a CIP target reaction solution of 10 mg L−1. Different amounts of photocatalysts were added to the CIP reaction solution with an initial concentration of 10 mg L−1. In order to reach the equilibrium state of adsorption–desorption between the catalyst and the CIP solution, a dark adsorption reaction was first performed for 45 min. The solution was irradiated for 90 min under a 300 W xenon lamp (PL-X300D xenon lamp was used to simulate visible light), and the solution samples were taken at 15 min intervals and then filtered through 0.22 μm organic filter membrane, and the absorbance values of the solution samples were measured by UV spectrophotometer. The CIP solution after photocatalytic reaction was taken for different time periods and its absorbance value was measured by UV-vis spectrophotometer, and its removal rate was calculated by eqn (1):| | |
η (%) = (A0 − At)/A0 × 100%
| (1) |
where: “η” is the removal rate of CIP; A0 is the initial absorbance value of the sample; At is the absorbance value of the sample at time t.
2.4 Detection of the active species
To investigate the main reactive substance present in the reaction system, ˙OH, h+, ˙SO4− and ˙O2− were measured in the CN/BOC/PS system under visible light using an Electron Paramagnetic Resonance (EPR) spectrometer (Bruker EMX PLUS model) ˙O2−. The test conditions were: resonance frequency of 9.82 GHz; central magnetic field of 3500 G; scan width of 100 G; energy of 6.33 mW; and scan time of 30 s. 5,5-Dimethyl-1-pyrroline-N-oxide (DMPO) was used as the trapping agent.
2.5 Biotoxicity measurement of ciprofloxacin
The changes in bioacute toxicity of ciprofloxacin solution before and after its degradation were investigated by Lumistox300 analyzer using the luminescent bacterium Vibrio fischeri (lyophilized). A bottle of bacterial recovery solution was taken out of the freezer at −18 °C and restored to room temperature by 5–10 min; then a bottle of lyophilized luminescent bacteria (Vibrio fischeri) was taken out of the freezer, 1 mL of recovery solution that had been restored to room temperature was quickly extracted and injected into the lyophilized bacteria, shaken for 1–3 min to fully integrate the bacteria with the recovery solution, and waited for the bacteria to recover make a bacterial suspension. After 30 minutes of incubation, the luminescence of the bacteria was recorded. The formula of luminescence inhibition rate is shown in eqn (2).| | |
Inhibition rate = (C0 − C30/C0) × 100%
| (2) |
where: C0 is the luminescence intensity of the blank solution (RLU), C30 is the luminescence intensity of the sample at 30 min (RLU).
3. Results and discussion
3.1 The crystal phase and structural characteristics of g-C3N4/BiOCl
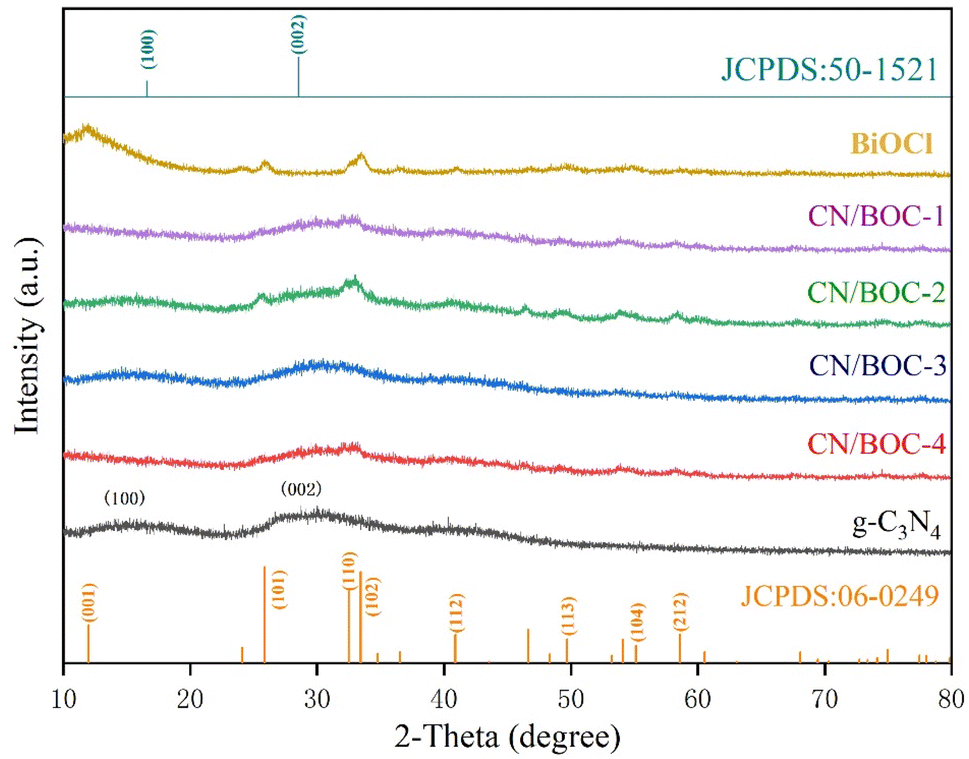
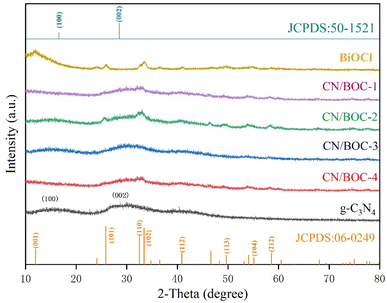
The X-ray diffraction (XRD) patterns of g-C3N4, BiOCl, CN/BOC-1, CN/BOC-2, CN/BOC-3 and CN/BOC-4 can be observed in Fig. 1, and the diffraction peaks of pure BiOCl catalyst samples are located at 2θ = 12.0°, 25.8°, 32.5°, 33.6°, 41.0° and 49.7°. These characteristic diffraction peaks correspond to (001), (101), (110), (102), (112) and (113) crystal planes respectively, which are consistent with the crystal structure of BiOCl, and the measured diffraction peaks are consistent with the BiOCl standard card (JCPDS no. 06-0249), thus proving the good crystallinity of the BiOCl catalyst sample.26 Except for the BiOCl diffraction peaks, the pure g-C3N4 diffraction peaks are located at 2θ = 12.9° and 27.4°, corresponding to the (100) and (002) crystal planes, respectively, which are basically consistent with the g-C3N4 standard card (JCPDS no. 50-1512).27 Among them, the diffraction peak located at 2θ = 12.9° corresponding to the (100) crystal plane belongs to the periodic array of tri-s-triazine in the plane of carbon nitride.28 The diffraction peak at 2θ = 27.4° corresponding to the (002) crystal plane belongs to the interplanar superposition of the conjugated aromatic system.29,30 In the CN/BOC heterojunction, the characteristic peaks of g-C3N4 and BiOCl phases existed simultaneously without obvious hetero peaks of other phases, indicating that the structures of g-C3N4 and BiOCl were not destroyed during the formation of the heterojunction. g-C3N4 has been successfully loaded onto the BiOCl catalyst, and it can be seen in the figure that the (110) diffraction peak of BiOCl is the strongest in the CN/BOC-2 sample in the CN/BOC hybrid system, indicating the best crystallization of BiOCl at this ratio.
 |
| | Fig. 1 XRD pattern of g-C3N4, BiOCl and g-C3N4/BiOCl photocatalyst. | |
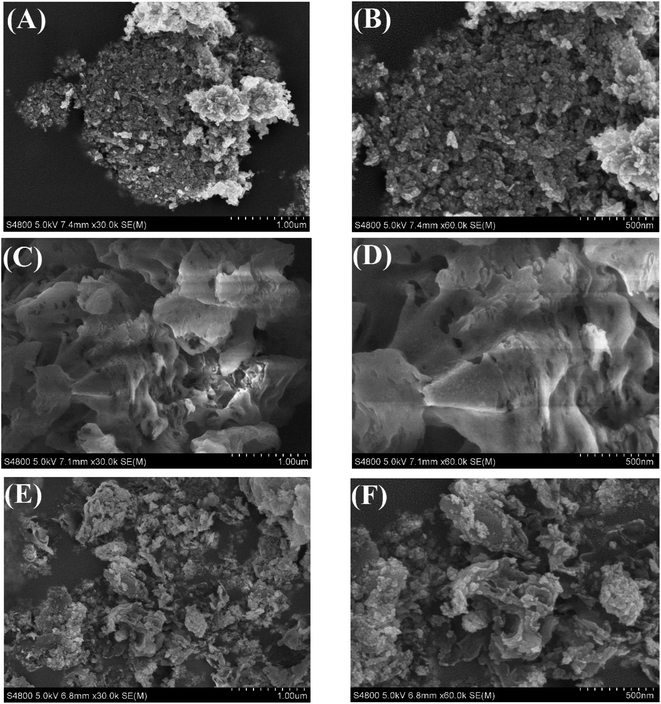
The scanning electron microscope (SEM) images of BiOCl, g-C3N4 and CN/BOC-2 are shown in Fig. 2(A–F), respectively. The BiOCl catalyst samples showed a pancake structure (Fig. 2(A and B)), and the agglomerates were stacked together to form an irregular shape; g-C3N4 catalyst sample with loose structure Fig. 2(C and D) and uneven surface; it was observed that a large amount of BiOCl in the form of round cake was uniformly dispersed on the surface of g-C3N4, indicating that most of the BiOCl had been successfully loaded on the surface of g-C3N4, and the morphology of CN/BOC-2 composite was shown in Fig. 2(E and F), thus indicating that g-C3N4 and BiOCl. The heterogeneous structure was formed between g-C3N4 and BiOCl.
 |
| | Fig. 2 SEM image of BiOCl, g-C3N4 and g-C3N4/BiOCl-2. | |
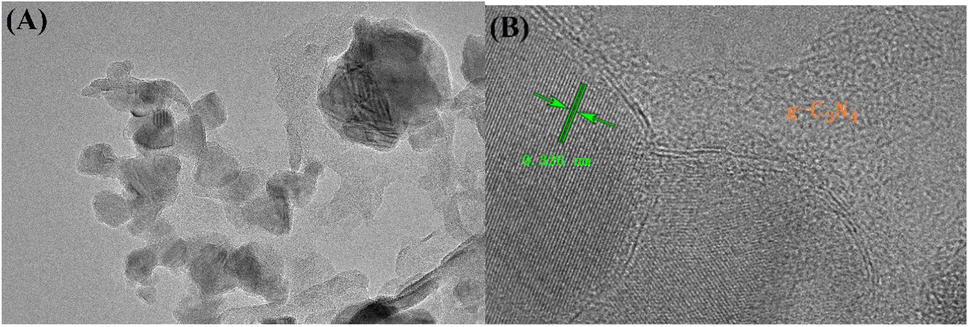
The TEM analysis of the catalyst CN/BOC-2 is shown in Fig. 3. It is obvious that a large amount of BiOCl is uniformly dispersed on the surface of g-C3N4 catalyst, which is favorable to the formation of heterojunction structure, the g-C3N4 catalyst can provide a larger specific surface area and more active sites, thus improving the activity of the composite catalyst. The TEM image shows that 0.362 nm corresponds to the (110) crystal plane of the BiOCl catalyst,31 the two photocatalysts are tightly wrapped together and form a heterogeneous structure.32 These results further demonstrate that the formation of CN/BOC-2 and the formation of heterojunctions between the two catalysts are beneficial to improve the photocatalytic performance and further extend the photoresponse range.
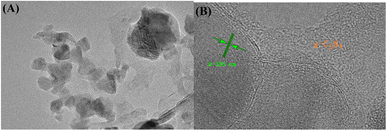 |
| | Fig. 3 TEM image of g-C3N4/BiOCl-2. | |
The presence of C, N, O, Bi, Cl elements in CN/BOC-2 in EDS and EDS-mapping patterns (Fig. 4) is consistent with the elemental composition of the composite CN/BOC-2, indicating that the g-C3N4 catalyst sample was indeed successfully loaded into the structure of the BiOCl catalyst sample. The energy distribution surface scanning analysis (EDS-mapping) of the CN/BOC-2 catalyst sample was carried out, and Fig. 4(B–G) shows the scanned images of each element, and the elements of C, N, O, Bi and Cl did not appear to be agglomerated, and all the elements were uniformly distributed on the CN/BOC-2 composite catalyst, which further proved that the composite was successfully prepared.
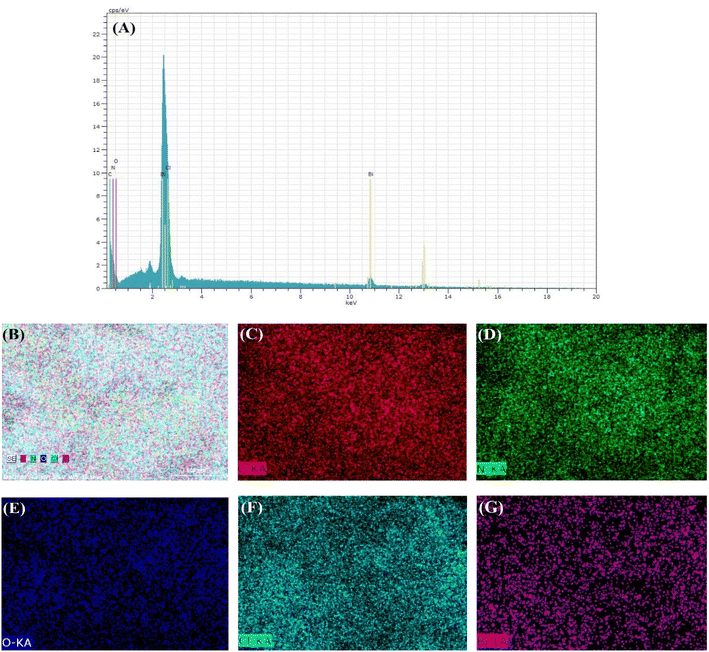 |
| | Fig. 4 EDS image of CN/BOC-2. | |
3.2 BET analysis
To further understand the characterization of the pore structure, the pore size distribution and BET specific surface area were obtained. Fig. 5(A) shows the nitrogen adsorption/desorption of the three catalysts, g-C3N4, BiOCl and CN/BOC-2. According to the IUPAC classification, these isotherms exhibit a class IV mixture, and Fig. 5(B) illustrates that the porous network of the samples consists of mesopores (2 nm < diameter < 50 nm).33 Each catalyst sample has a distinct adsorption hysteresis loop, indicating that all three catalyst samples are mesoporous materials. g-C3N4 shows an H2-type hysteresis loop with a wide pore size distribution, and BiOCl, CN/BOC-2 shows an H3-type hysteresis phenomenon. The adsorption of nitrogen was in the order of g-C3N4 < CN/BOC-2 < BiOCl, and the prepared material CN/BOC-2 had pore distribution at both 5 mm and 16 mm, and the highest specific surface area of CN/BOC-2 was 66.318 m2 g−1. The increase of specific surface area can provide more active sites and further improve the activity and catalytic reaction rate of the catalyst. The specific surface area was obtained from the isotherms by the BET (Brunauer–Emmett–Teller) method and the pore size distribution was obtained by the DFT method using the nitrogen adsorption–desorption isotherms of g-C3N4, BiOCl, CN/BOC-2, and the results are shown in Table 1.
 |
| | Fig. 5 Nitrogen adsorption isotherm (A) and pore diameter distribution curve of g-C3N4-BiOCl and g-C3N4/BiOCl-2 (B). | |
Table 1 BET and average pore size of different catalysts
| Name of catalyst |
BET (m2 g−1) |
Pore size (nm) |
Pore volume (cm3 g−1) |
| g-C3N4 catalyst |
53.589 |
5.012 |
0.140 |
| BiOCl catalyst |
63.814 |
16.707 |
0.203 |
| CN/BOC-2 composite catalyst |
66.318 |
13.131 |
0.190 |
3.3 XPS analysis
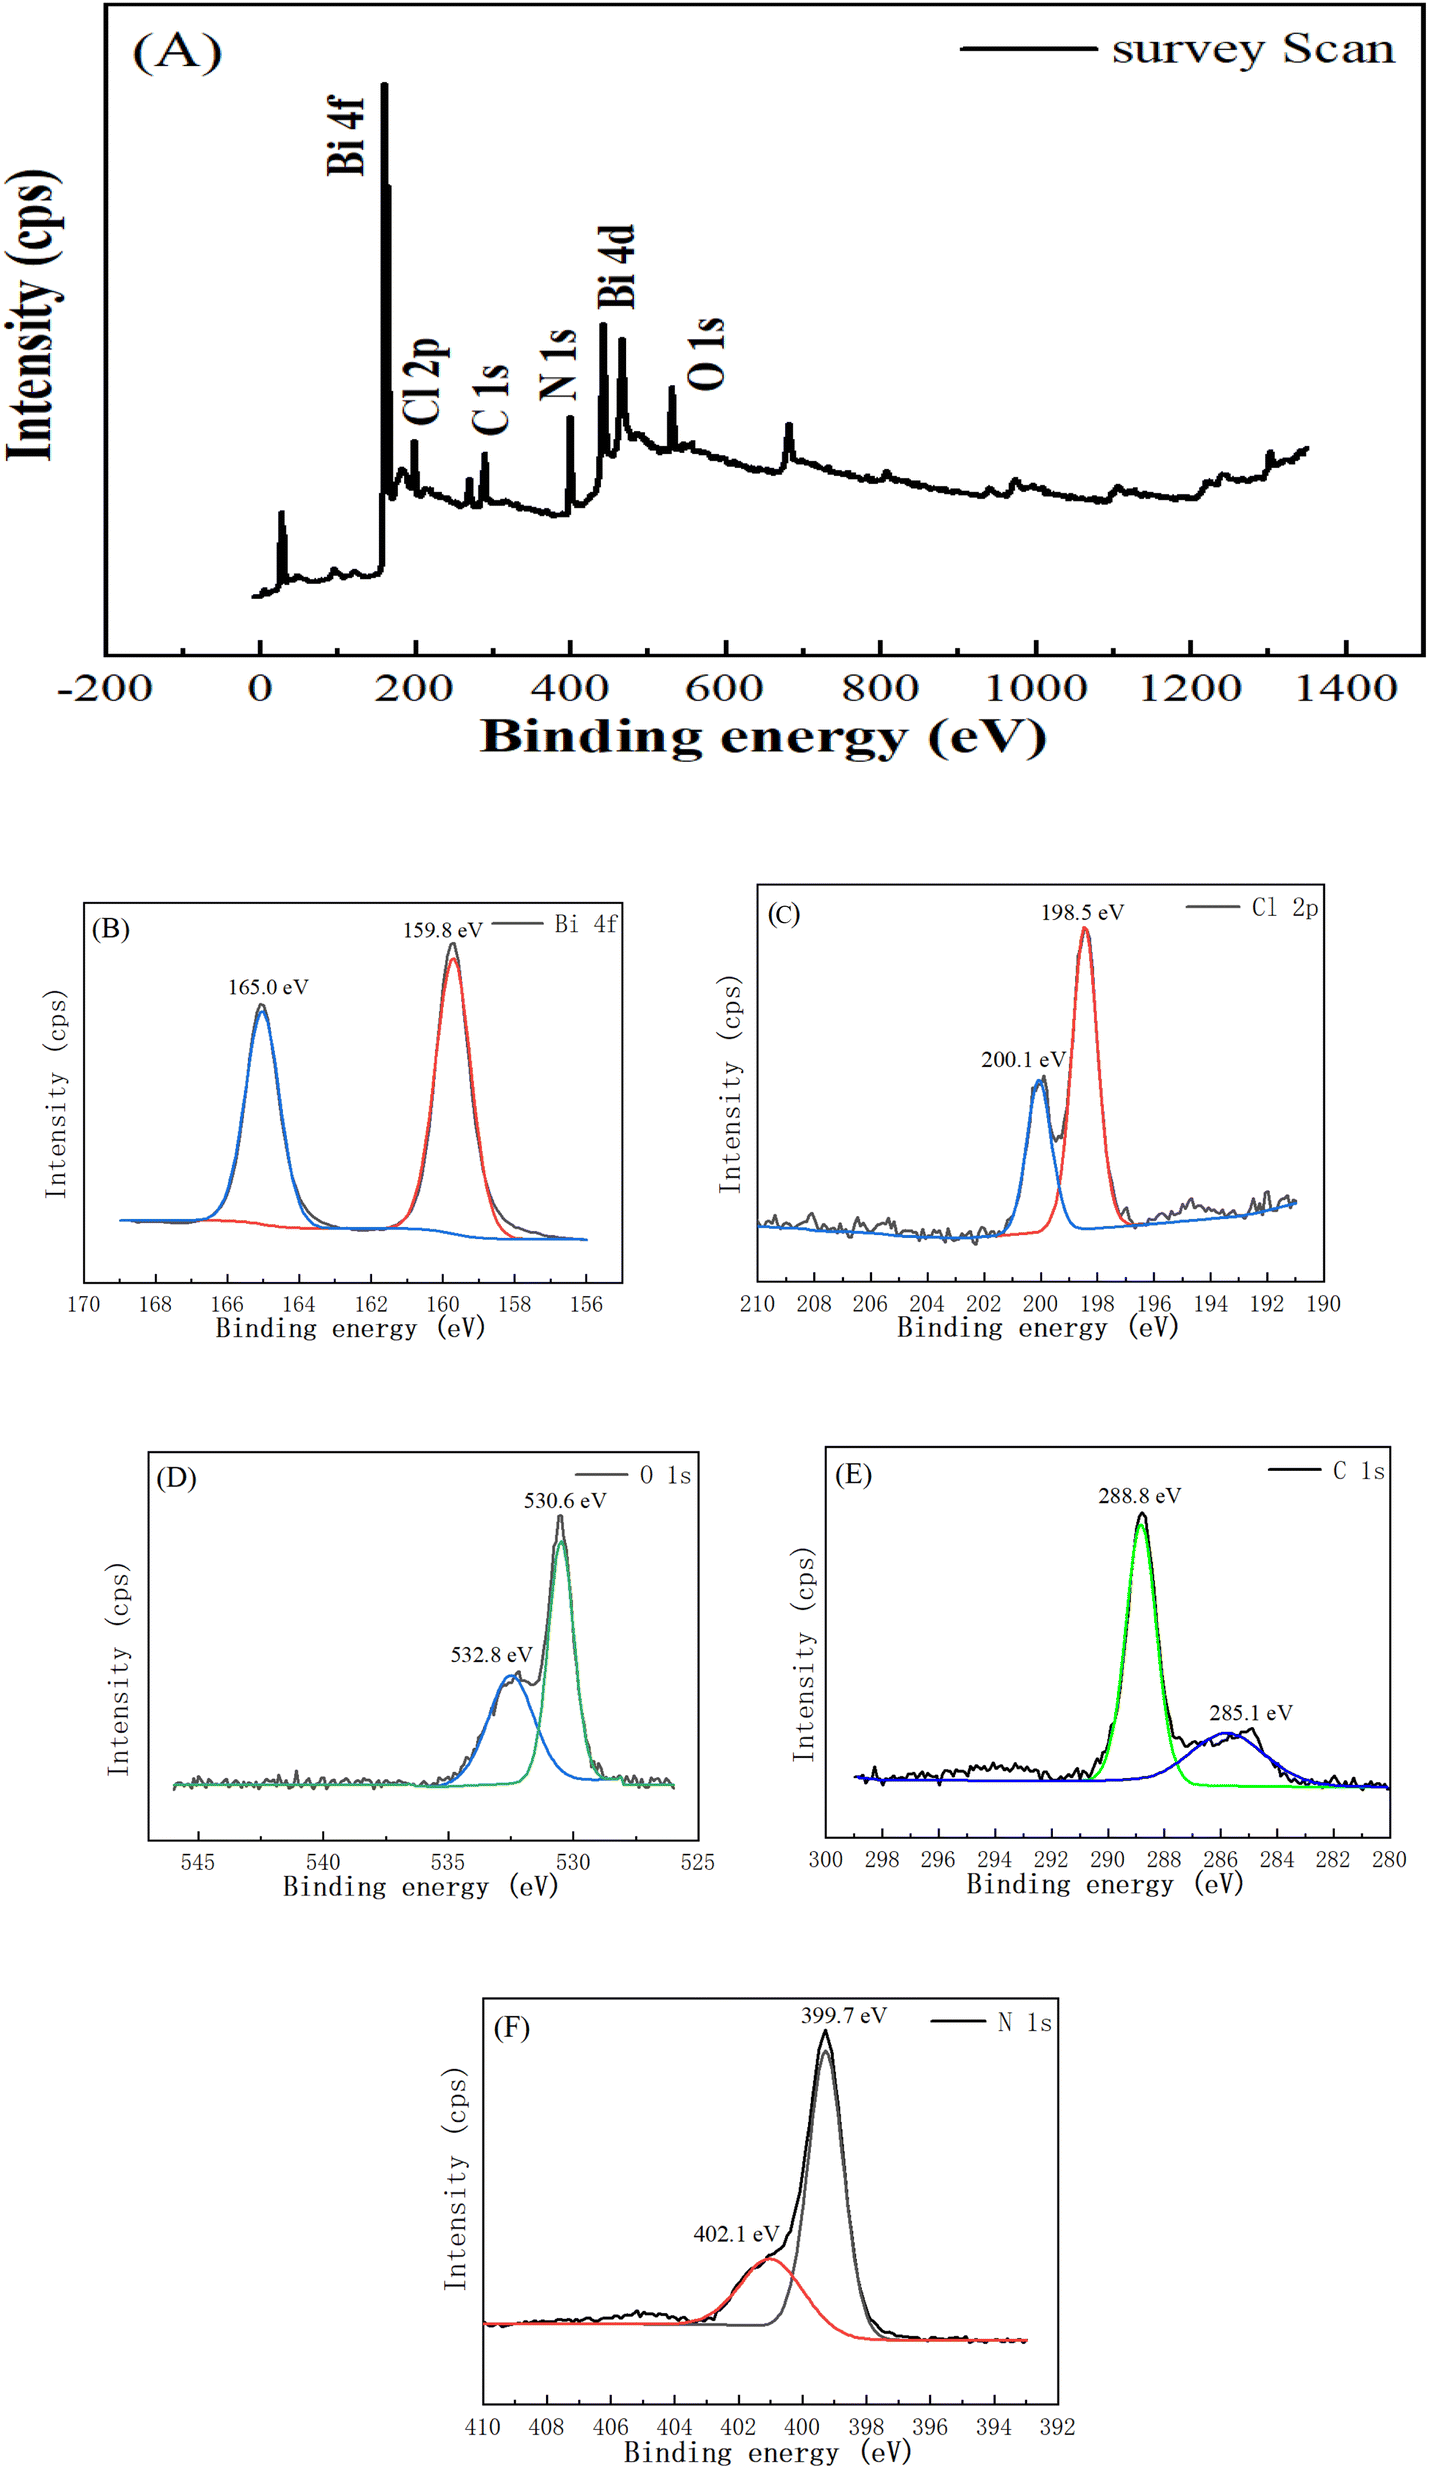
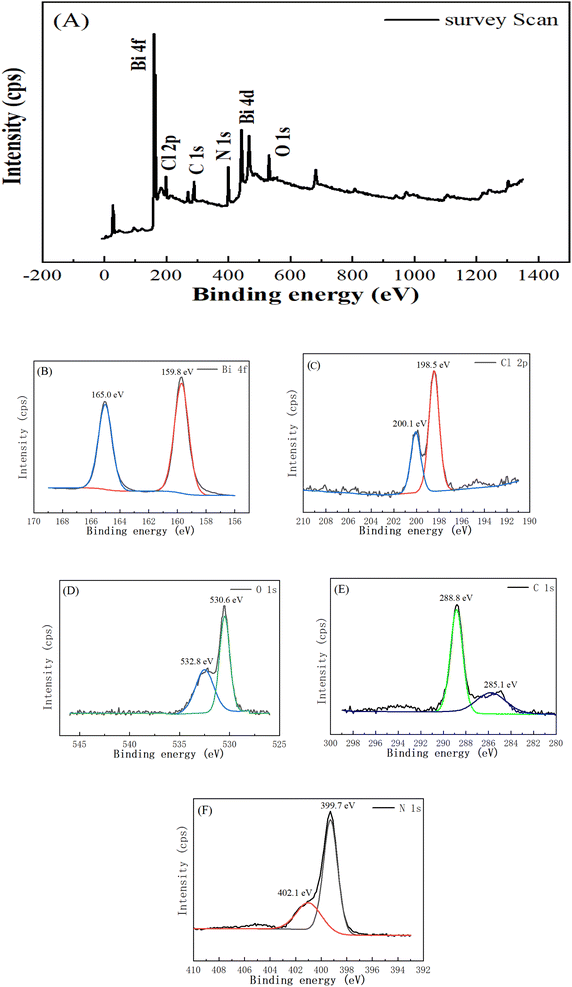
The chemical state and elemental information of the synthesized CN/BOC-2 composites were investigated by X-ray photoelectron spectroscopy (XPS).34 To explain the electron transfer between g-C3N4 and BiOCl in CN/BOC-2, the binding energies of the CN/BOC-2 composites were compared with those of the two parent materials.35,36 In pure g-C3N4, the C 1s peaks are located at 284.8 eV and 288.1 eV, the first absorption peak is the sp2 carbon in the g-C3N4 and benzoic acid rings, and the second absorption peak is attributed to the sp2 hybridized carbon in the N-containing aromatic ring (N–C![[double bond, length as m-dash]](https://www.rsc.org/images/entities/char_e001.gif) N).37 In the CN/BOC-2 composite, it is evident that the binding energy of C 1s is red-shifted from 284.8 eV to 285.1 eV, corresponding to the g-C3N4 of g-C3N4 and the sp2 carbon in the benzoic acid ring, and the other peak is located at 288.8 eV, corresponding to the N–CN bond shifted from 288.1 eV. Fig. 6(A) shows the XPS survey scans of the CN/BOC-2 catalyst sample as a representative sample. Bi 4f, Cl 2p, O 1s, C 1s and N 1s peaks were obtained at 160.08 eV, 199.08 eV, 531.8 eV, 286.1 eV and 400.1 eV, respectively, in the probe scans, and the Bi 4f, Cl 2p, O 1s, C 1s and N 1s peaks were further characterized with narrow scans.
N).37 In the CN/BOC-2 composite, it is evident that the binding energy of C 1s is red-shifted from 284.8 eV to 285.1 eV, corresponding to the g-C3N4 of g-C3N4 and the sp2 carbon in the benzoic acid ring, and the other peak is located at 288.8 eV, corresponding to the N–CN bond shifted from 288.1 eV. Fig. 6(A) shows the XPS survey scans of the CN/BOC-2 catalyst sample as a representative sample. Bi 4f, Cl 2p, O 1s, C 1s and N 1s peaks were obtained at 160.08 eV, 199.08 eV, 531.8 eV, 286.1 eV and 400.1 eV, respectively, in the probe scans, and the Bi 4f, Cl 2p, O 1s, C 1s and N 1s peaks were further characterized with narrow scans.
 |
| | Fig. 6 XPS spectrum of CN/BiOCl-2 (A) survey scan; (B) Bi 4f; (C) Cl 2p; (D) O 1s; (E) C 1s; (F) N 1s. | |
The two characteristic peaks at 164.9 and 159.6 eV belong to Bi 4f5/2 and 4f7/2, respectively, which are characteristic peaks of Bi3+ in BiOCl. As shown in Fig. 6(B), the Bi 4f5/2 characteristic peak of Bi3+ is red-shifted from 164.9 eV to 165.0 eV and the Bi 4f7/2 characteristic peak is red-shifted from 159.6 eV to 159.8 eV.38 The peaks located at 198.7 eV which correspond to Cl 2p2/3 for Cl− and at 199.3 eV for Cl 2p1/2, respectively. As shown in Fig. 6(C), the Cl 2p2/3 characteristic peak of Cl− is red-shifted from 198.7 eV to 198.5 eV, and the Cl 2p1/2 characteristic peak is red-shifted from 199.3 eV to 200.1 eV.38 The O 1s peaks at 531.3 eV and 533.1 eV are seen in Fig. 6(D), which belong to surface hydroxyl groups and adsorbed water,39–41 respectively, while the peak of CN/BOC-2 at 530.6 eV is related to the Bi–O binding energy, and the peak at 532.8 eV is explained by the C–O bond. As seen in Fig. 6(F), the N 1s XPS spectrum of g-C3N4 appears at 399.5 eV due to the sp2 hybridized aromatic nitrogen (CN–C) bound to the carbon atom, while the second peak at 403.1 eV belongs to the tertiary nitrogen (N–C3).42,43 In the CN/BOC-2 composite, the binding energy of the sp2 hybridized (CN–C) bond is located at 399.7 eV, while the tertiary nitrogen (N–C3) is red-shifted from 403.1 to 402.1 eV. The synthesized sample CN/BOC-2 composite containing both g-C3N4 and BiOCl was verified from the XPS pattern.
3.4 UV-vis DRS analysis
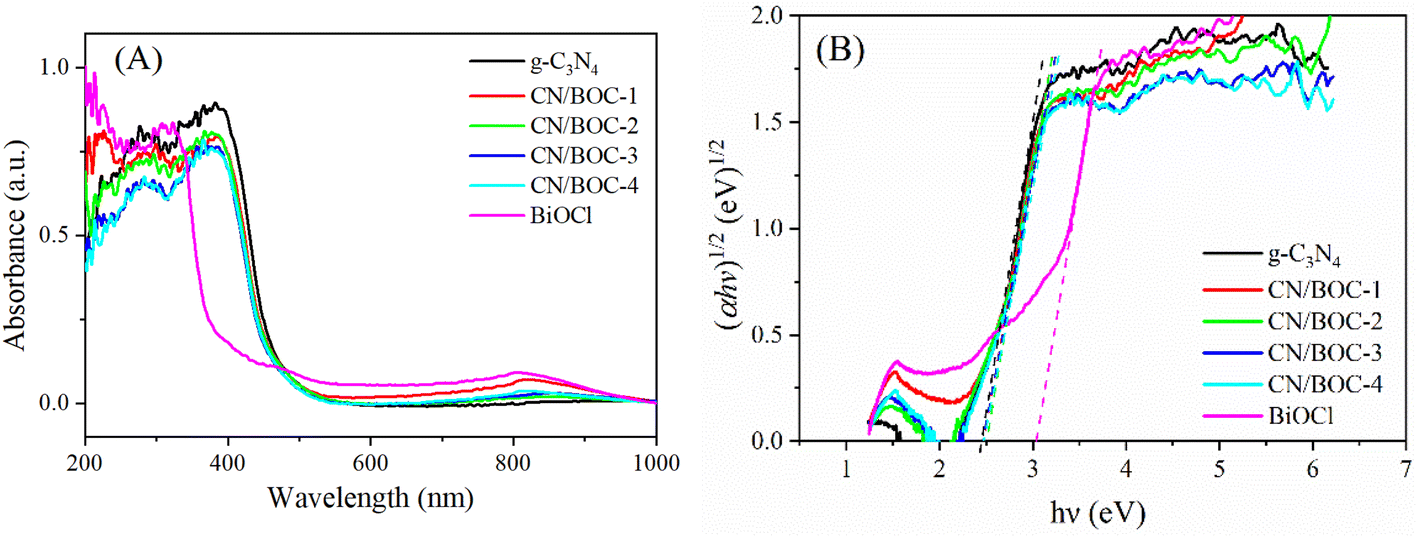
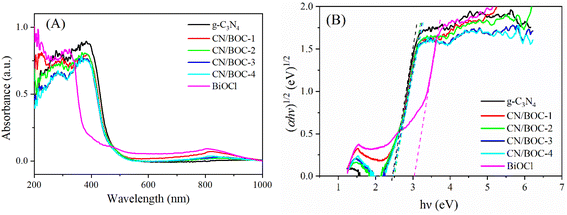
Fig. 7(A) shows the UV-vis DRS spectra of the prepared samples, BiOCl mainly absorbs UV light at wavelengths below 370 nm, and Fig. 7(B) shows that the band gap of BiOCl is 3.02 eV. And the absorption edge of g-C3N4 is located around 500 nm,48 the band gap energy was 2.46 eV. When g-C3N4 was compounded with BiOCl, the CN/BOC absorption edge was located at 480 nm due to the strong interaction of the tight chemical bonding interface between BiOCl and g-C3N4 nanosheets, and CN/BOC-1, CN/BOC-2, CN/BOC-3 and CN/BOC-4 catalyst samples had significantly broader absorption region in the 350–440 nm region. The band gap energy of CN/BOC composite catalyst samples was 2.47 eV, indicating that the absorption region of CN/BOC composite catalyst samples extended to the visible region and exhibited lower band gap energy, which could better utilize the visible light effectively and was beneficial to the improvement of photocatalytic activity.
 |
| | Fig. 7 (A) The UV-vis DRS spectra of prepared catalysts. (B) Band gap energy of the catalyst sample being produced. | |
Photoluminescence spectroscopy could be used as one of the preliminary characterizing tool in order to elucidate the optical features of the semiconducting material which gives valuable information about separation, migration and recombination process of the photogenerated excitons. In general, the peak intensity is directly proportional to electron–hole recombination process i.e. intense peak implies faster recombination and vice versa.44 A strong and sharp luminescence band encountered at 460 nm for pristine CN which can be ascribed to band–band PL phenomenon originating from n–π* transition of lone pair electrons over N-atom.45,46 BiOCl showed a strong emission peak with high intensity at approximate 420 and 440 nm, with the increase of BiOCl introduction in CN network, the intensity of emission spectra can be reduced gradually, indicating that the introduction of moderate amounts of BiOCl in CN network can effectively inhibit the recombination of photoexcited electron–hole pairs for the formation of CN/BOC-2 Z heterojunction.
From the plotted PL data, it can be noticed that CN/BOC-2 exhibits extremely low intense spectrum as compared to other composites and also parent materials. So, it can be concluded that heterojunction formation between BiOCl and CN followed by sensitization with BiOCl helps in slowing down the recombination process and accelerating the migration of excitons within the system. From the above discussion it was concluded that out of all the synthesized samples CN/BOC-2 is found to be a better photocatalyst which are well matched with our EIS and photocatalytic performance.
3.5 Photoelectric performance analysis
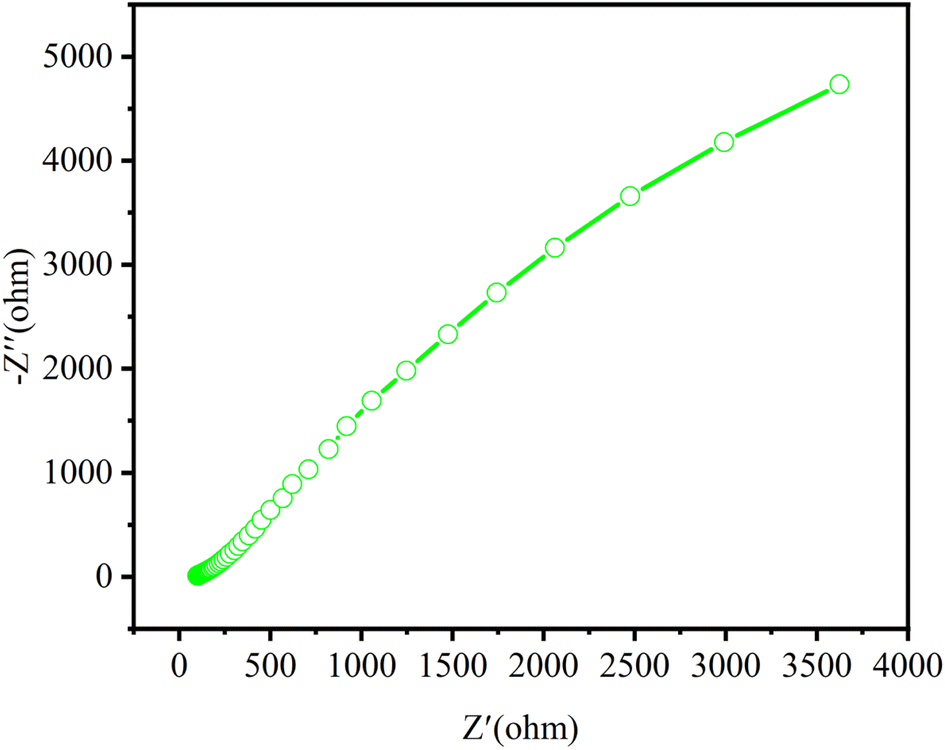
EIS analysis helps to examine the separation of e−–h+ pairs even in the presence of light.47 EIS measurements of the various prepared photocatalysts were performed under visible light irradiation to examine the charge transportation efficiency at the corresponding electrode/electrolyte interface. Generally, the semicircular part (lower frequency) in EIS is assigned to electron transfer resistance (Rct) and constant phase at the electrode/electrolyte interface.48 The smallest radius in the Nyquist plot explains the lowest electron-transfer resistance and largest interfacial charge transportation at the electrode facet.49 The bigger diameters observed for parent materials g-C3N4 and BiOCl imply the poor electrical conductivity and may inhibit the electron transfer.50,51
As shown in the Fig. 8, Nyquist diagram of CN/BOC composite material, it can be compared that the composite shows a smaller arc radius than the parent material, indicating a decrease in charge transfer resistance. This clearly indicates that the addition of BiOCl to g-C3N4 through heterostructure can effectively reduce the interface resistance. After the formation of the heterostructure, the contact area between BiOCl and g-C3N4 increases and the interfacial charge transfer is faster, which is because the heterostructure of CN/BOC promotes the separation and transfer of photogenerated electron–hole pairs.
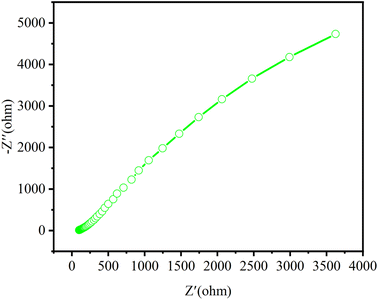 |
| | Fig. 8 Nyquist diagram of CN/BOC composites. | |
The improved photo catalytic performance of the composite photocatalyst was investigated by linear sweep voltammetry studies. The onset photocurrent potentials were −1.0 mV for neat g-C3N4 composites. The onset potentials at the current density of −0.04 mA cm−2 for BiOCl was −2.16 V. According to the above test, it can be concluded that the photocurrent potential of the composite catalyst is lower than that of the parent material, that the introduction of BiOCl in g-C3N4 is very conducive to improve the photocatalytic performance.
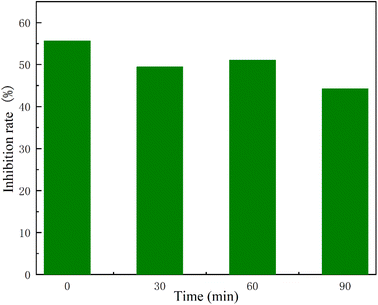
3.6 Biotoxicity analysis
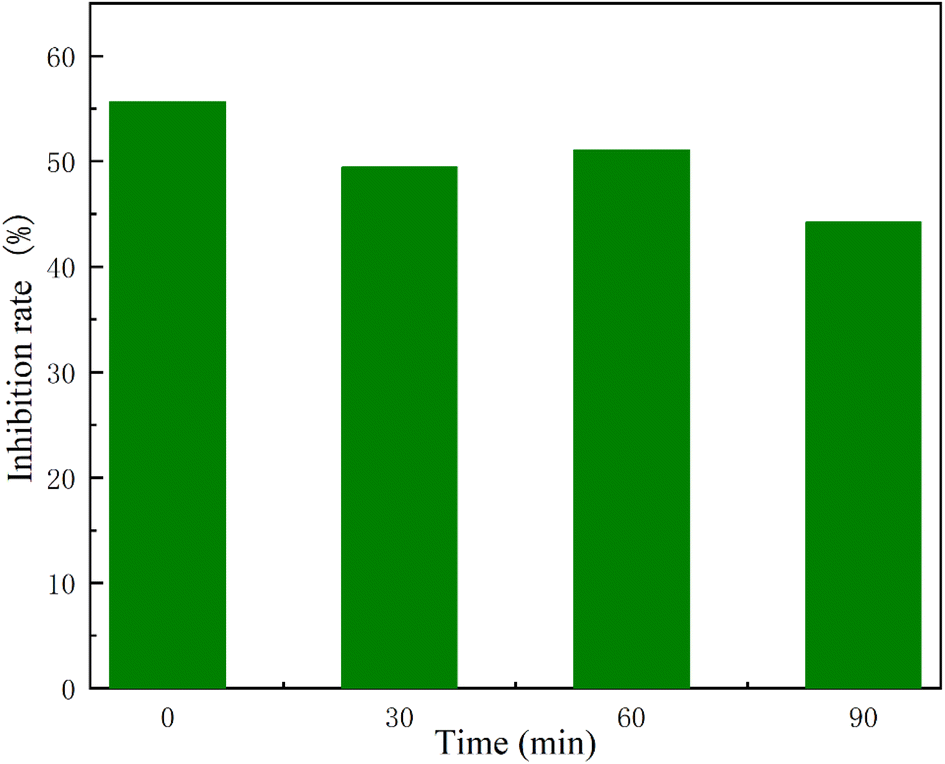
The process of degradation of ciprofloxacin in produces some by-products that may be more biotoxic than the original ciprofloxacin. In this study, Vibrio fischeri will be used to investigate its toxicity, and the luminescence inhibition of 10 mg L−1 ciprofloxacin at 0, 30, 60, and 90 min will be assessed by the inhibition rate of the luminescent bacteria.
The changes in the biotoxicity of CIP degradation are shown in Fig. 8. 10 mg L−1 ciprofloxacin had a more pronounced toxicity at the zero moment, indicating that this concentration of CIP has a high antibacterial activity. After 60 min of adsorption, the inhibition rate of CIP gradually decreased, indicating that the decline of luminescent bacteria was caused by the adsorption of CIP. When the reaction time proceeded to 90 min, the relative inhibition rate of ciprofloxacin decreased from 55.67% to 44.21%. This indicates that CIP did not produce greater toxicity in the degradation of Vis/CN/BOC-2/PS system as shown in Fig. 9. The toxicity present after degradation was the toxicity of the degraded intermediate product residues.
 |
| | Fig. 9 Acute biological toxicity of CIP degradation by Vis/CN/BOC-2/PS system. | |
3.7 Degradation of ciprofloxacin in different reaction systems
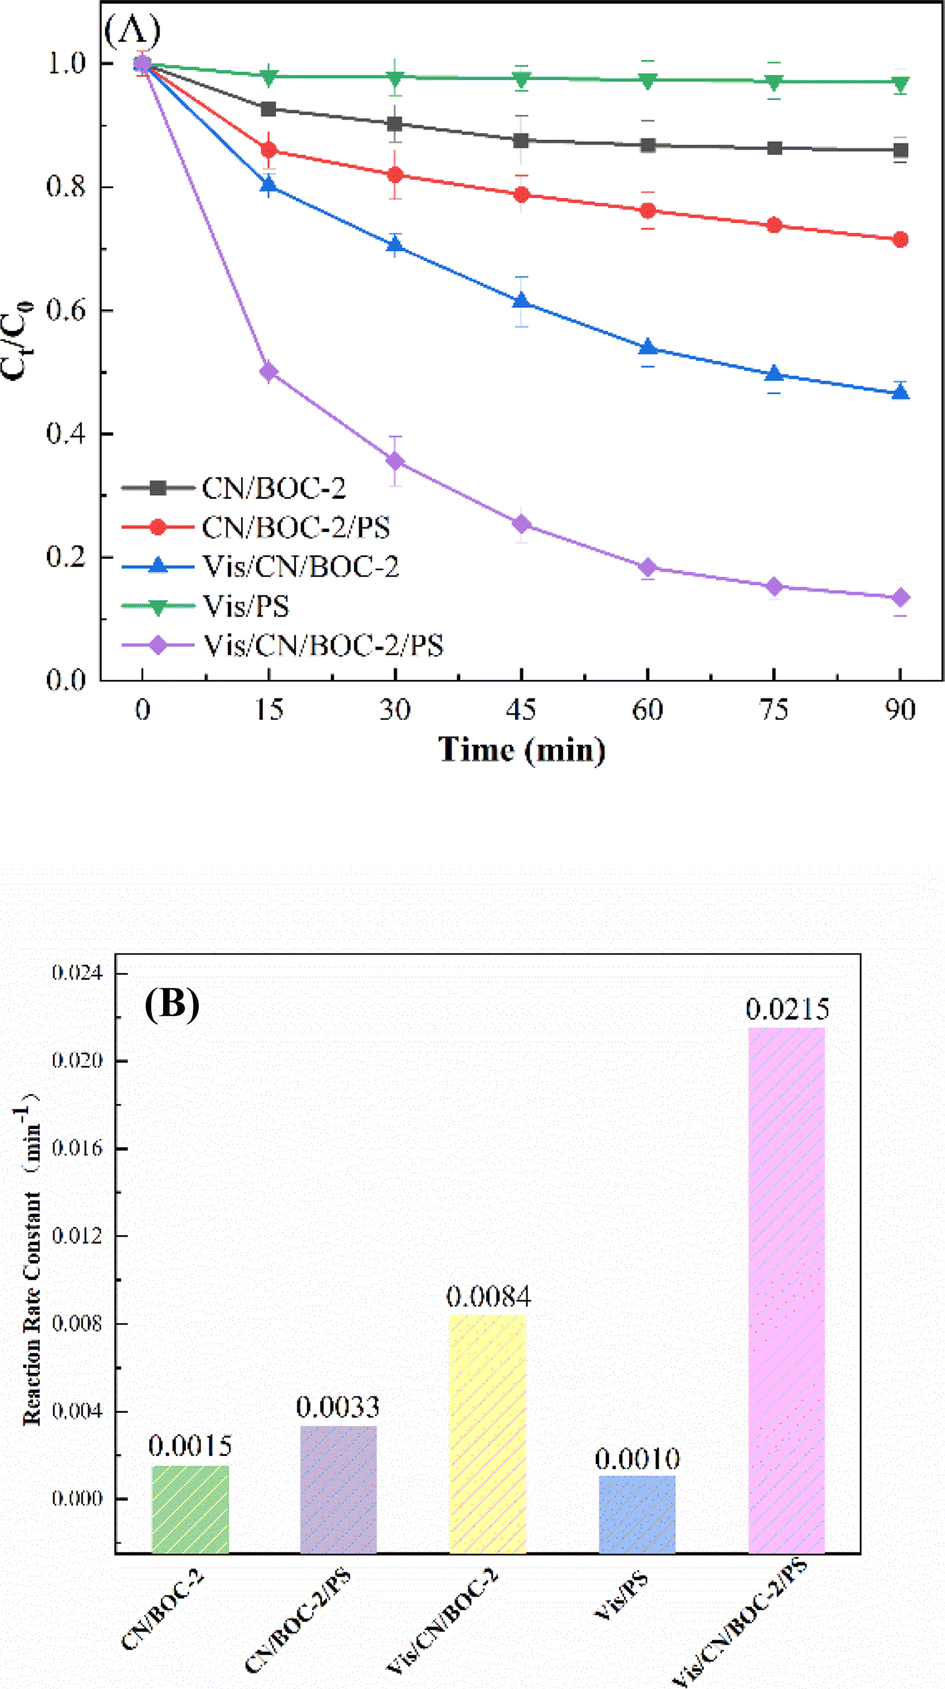
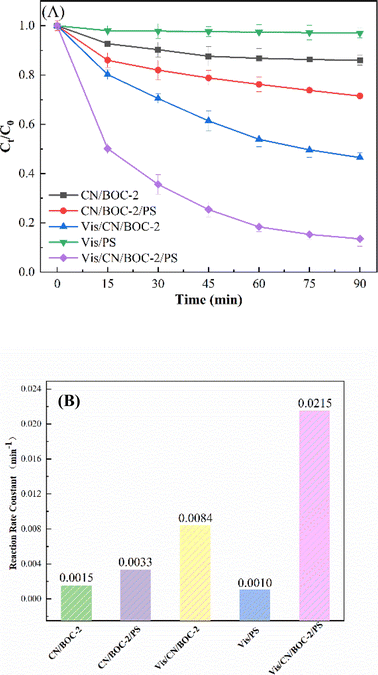
Fig. 10(A) shows the degradation efficiency of CIP in different reaction systems. The results showed that the removal efficiency of CN/BOC-2 and PS remained at 9.6–53.5% under simulated visible light conditions for 90 min, and the removal efficiency of Vis/CN/BOC-2/PS system could reach 86.5% under simulated visible light irradiation for 90 min, which shows that the use of CN/BOC-2 or PS alone has a better effect on CIP removal than that of Vis/CN/BOC-2/PS. The CIP removal by CN/BOC-2 or PS alone was better than that by Vis/CN/BOC-2/PS. The photocatalytic rates of CN/BOC-2 and CN/BOC-2/PS were 12.3% and 28.5% under dark reaction conditions, which were attributed to the heterojunction constructed by the composite catalyst CN/BOC-2, which broadened the visible light absorption range and improved the separation of electron–hole pairs, and the CN/BOC-2 composite photocatalyst could effectively activate the persulfate, thus improving the CIP removal rate. The CN/BOC-2 composite photocatalyst can effectively activate the peroxynitrite, thus improving the removal rate of CIP.
 |
| | Fig. 10 Degradation effect of CIP by different systems (A); reaction rate (B). | |
The reaction rate constants of different systems CN/BOC-2, CN/BOC-2/PS, Vis/CN/BOC-2, Vis/PS and Vis/CN/BOC-2/PS were 0.0015, 0.0033, 0.0084, 0.0010 and 0.0215 min−1, respectively, as shown in Fig. 10(B). The degradation rate constant of CIP was increased by 2.56 times with the addition of persulfate to CN/BOC-2 photocatalyst, which can effectively activate persulfate and thus increase the degradation rate of CIP. Compared with the single catalyst BiOCl, g-C3N4 and the composite catalysts CN/BOC-1, CN/BOC-3 and CN/BOC-4, the reaction rates of activated persulfate systems all showed different degrees of improvement, indicating that the CN/BOC-2/PS system performed best in improving the degradation rate of CIP. Compared with other studies (Table 2), we obtained high removal efficiency of Vis/CN/BOC-2/PS system in a shorter period of time.
Table 2 Degradation performance of ciprofloxacin in different reaction systems
| CIP initial concentration |
Photocatalysts |
Reaction conditions |
Time |
Removal efficiency |
Reference |
| 30 μm |
— |
2 mM PS, 60 °C, initial pH of solution 2 |
3 h |
92% |
49 |
| 10 mg L−1 |
FeTiO3/ZnO |
1 g L−1 photocatalyst, UV-visible, pH 7 |
180 min |
100% |
50 |
| 10 mg L−1 |
rGO/Ag3PO4/PANI |
0.4 g L−1 photocatalysts, UV-visible |
15 min |
86.2% |
51 |
| 10 mg L−1 |
Bi2S3/BiOBr |
0.5 g L−1 photocatalysts, UV-visible |
180 min |
≈80% |
52 |
| 10 mg L−1 |
CuS/BiVO4 |
1 g L−1 photocatalyst, visible light irradiation |
90 min |
86.5% |
53 |
| 10 mg L−1 |
Cu2+/g-C3N4 |
0.1 g L−1 photocatalyst, Cu2+ concentration set to 0.8 mg L−1, pH is 6 |
60 min |
64.1% |
54 |
| 10 mg L−1 |
Vis/CN/BOC-2 |
0.3 g L−1 photocatalyst, 1 mM PS, pH is 5.8 |
90 min |
86.5% |
This work |
3.8 Study of CIP degradation by BiOCl/PS, g-C3N4/PS and CN/BOC/PS
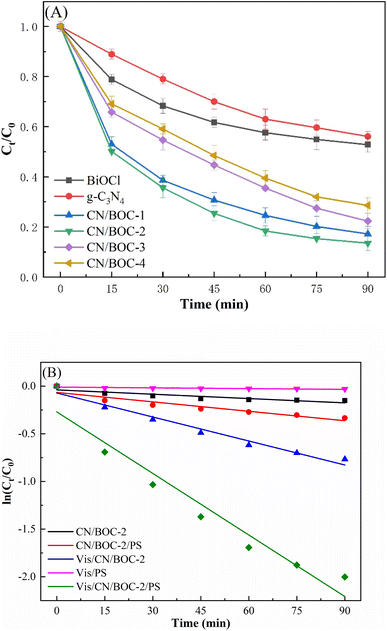
The composite of g-C3N4 and BiOCl catalysts will form a heterogeneous structure affecting the forbidden bandwidth, changing the response range of the photocatalyst in visible light, achieving the ability to absorb different ranges of visible light, thus affecting the catalytic activity of the photocatalyst. g-C3N4 doping ratio has a large effect on the degradation of CIP, and in order to determine the optimal g-C3N4 doping ratio, single as well as composite catalysts were carried out. In order to determine the optimal g-C3N4 doping ratio, photodegradation experiments were carried out for both single and composite catalysts. The conditions of photocatalytic experiments were: initial CIP concentration of 10 mg L−1, catalyst dosage of 0.3 g L−1, PS of 1 mM, pH value of 5.8, and temperature of 25 ± 2 °C. The degradation effect and kinetics of CIP degradation by photocatalyst are shown in Fig. 11.
 |
| | Fig. 11 Degradation effect of CIP in BiOCl/PS, g-C3N4/PS and CN/BOC/PS systems (A) first-order kinetic (B). | |
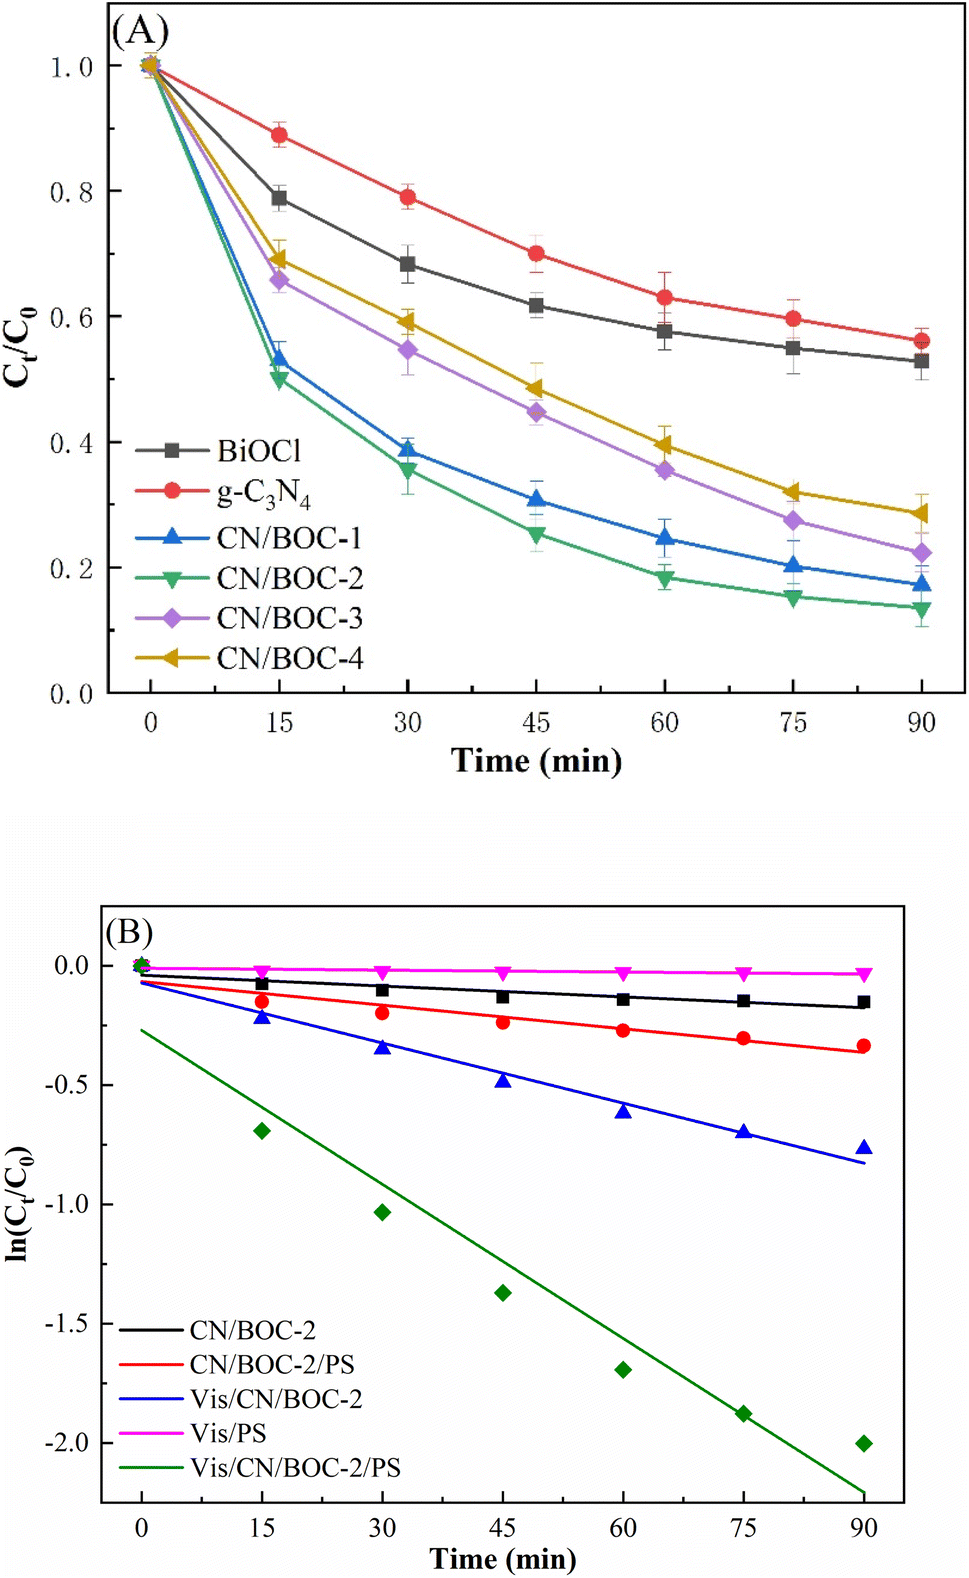
As shown in Fig. 11(A), the removal rates of CIP by BOC and g-C3N4 were 47.2% and 43.9%, and the removal rates of CIP by CN/BOC-1, CN/BOC-2, CN/BOC-3 and CN/BOC-4 were 82.8%, 86.5%, 77.6% and 71.4% with the increase of g-C3N4 doping ratio, respectively. The results showed that g-C3N4 compounded in BiOCl changed the degradation activity of BiOCl catalyst, and the removal of CIP was the first to increase and then decrease with the increase of doping ratio, but the degradation effect of both compound photocatalysts was higher than that of single BiOCl and g-C3N4 catalysts for CIP. Among them, CN/BOC-2 has the best degradation effect, with 86.5% removal of CIP within 90 min. As the doping amount of g-C3N4 exceeded the optimal doping ratio, there was not enough BiOCl to receive electrons from g-C3N4 due to the high doping concentration of g-C3N4, making the hole–electron separation energy rate poor; on the contrary, if the doping amount of g-C3N4 was insufficient, the composite catalyst CN/BOC could not provide enough photogenerated electrons, resulting in a part of the persulfate not being activation, which affects the removal effect of CIP. Therefore, the doping ratio of g-C3N4 has an important effect on the activation of peroxynitrite for CIP degradation, and too high or too low doping ratio will reduce the effective separation of electron–hole pairs, thus decreasing the degradation effect of CIP.
As shown in Fig. 11(B), there is a linear relationship between the photocatalytic reaction time and CIP degradation rate, which is basically consistent with the quasi-level kinetic equation. According to the Langmuir–H kinetic model, the quasi-level kinetic equations and R2 values of the six photocatalysts for CIP degradation were obtained in Table 3, where R2 values represent the degree of correlation, and the closer the R2 value is to 1, the more the degradation data of photocatalytic experiments are consistent with the quasi-level kinetic equations. There is a good correlation between CIP degradation rate and reaction time. As shown in the table, the degradation rate constant of CN/BOC-2/PS for CIP was 0.0215 min−1, which showed different degree of improvement compared with the single catalysts BiOCl, g-C3N4 and the composite catalysts CN/BOC-1, CN/BOC-3 and CN/BOC-4 activated persulfate system, indicating that the CN/BOC-2/PS system was more effective in improving the degradation of CIP. The CN/BOC-2/PS system showed the best performance in terms of improving the degradation rate of CIP.
Table 3 Dynamics equation of catalyst/PS system with different doping ratio
| Catalyst/PS |
Pseudo-first order reaction kinetics |
R2 |
| BiOCl/PS |
y = 0.0067t + 0.1120 |
0.951 |
| g-C3N4/PS |
y = 0.0066t + 0.0284 |
0.990 |
| CN/BOC-1/PS |
y = 0.0182t + 0.2551 |
0.970 |
| CN/BOC-2/PS |
y = 0.0215t + 0.2696 |
0.972 |
| CN/BOC-3/PS |
y = 0.0160t + 0.0942 |
0.994 |
| CN/BOC-4/PS |
y = 0.0136t + 0.0953 |
0.991 |
3.9 Influencing factors of photocatalytic degradation
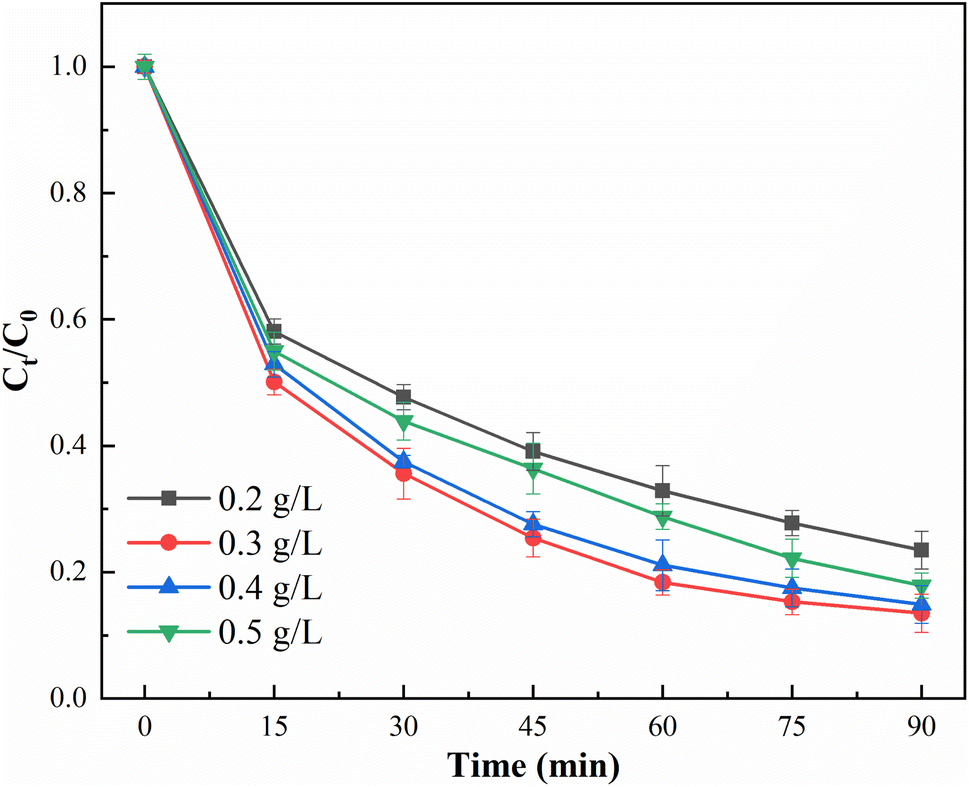
3.9.1 CN/BOC-2 dosage. In the CN/BOC-2/PS system, the dose of CN/BOC-2 affected the removal of ciprofloxacin, as shown in Fig. 12, when the dose of CN/BOC-2 increased from 0.2 g L−1 to 0.5 g L−1, the removal rate of CIP showed a trend of increasing and then decreasing, and the removal rates of CIP were 76.5%, 86.5%, 85.1% and 82.1%. As the dosage of CN/BOC-2 photocatalyst increased, more electron–hole pairs were provided to stimulate the activation of persulfate, which further improved the CIP removal rate. When the dosage was increased to 0.3 g L−1, the CIP removal efficiency reached more than 86% within 90 min, but when the dosage was increased to more than 0.4 g L−1, the CIP removal efficiency decreased to less than 82–85% within 90 min. The total amount of ˙SO4−, the active substance generated by the photocatalyst, reached the maximum limit, so the photocatalytic electrons beyond the maximum limit could not effectively activate the persulfate to participate in the reaction, and thus the CN/BOC-2 of 0.3 g L−1 was selected as the optimum concentration for the experiment.
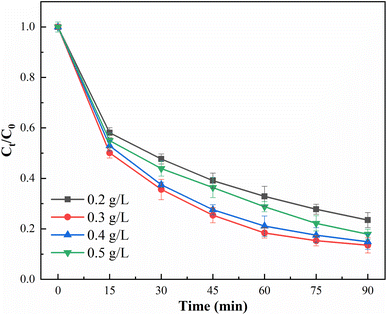 |
| | Fig. 12 Degradation effect of CIP by different dosages of CN/BOC-2. | |
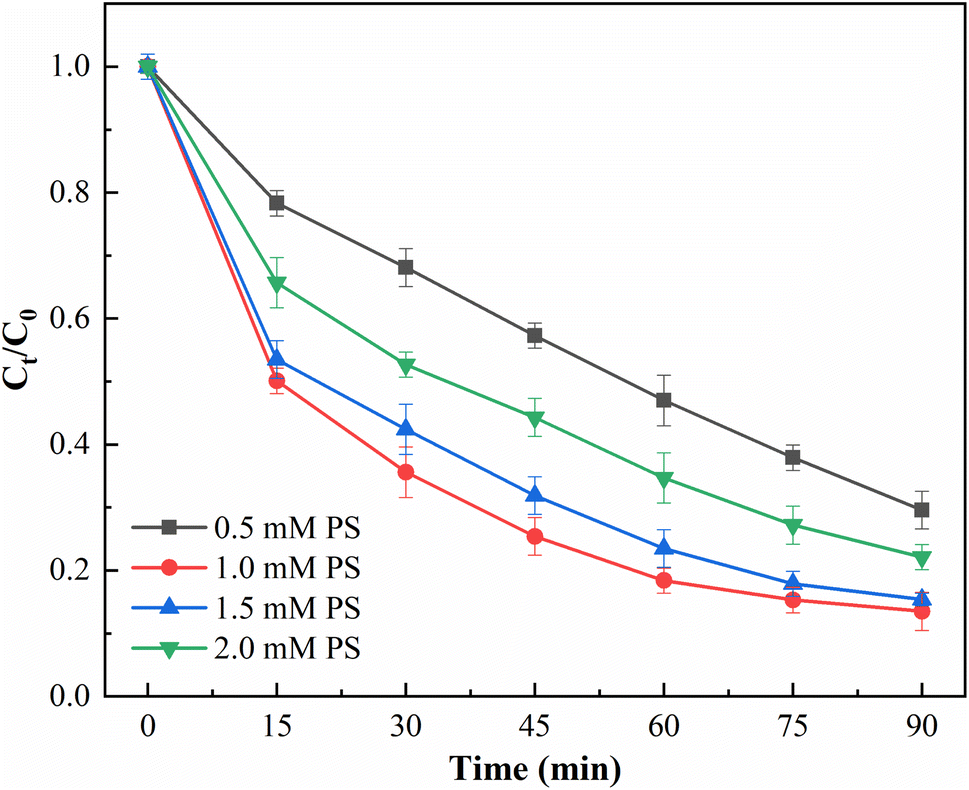
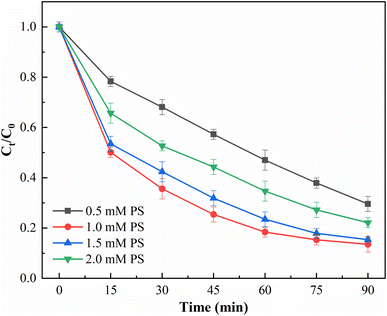
3.9.2 Persulfate concentration. PS as an oxidant in the CN/BOC-2/PS system was correlated with the number of sulfate radicals. The effect of PS concentration on CIP degradation was investigated as shown in Fig. 13. The conditions of photocatalytic experiments were: initial CIP concentration of 10 mg L−1, catalyst dosing of 0.3 g L−1, pH value of 5.8, and temperature of 25 ± 2 °C. When the PS concentration increased from 1.0 mmol L−1 to 10.0 mmol L−1, the CIP removal rate was 70.4%, 86.5%, 84.6% and 77.9%, and the effect of persulfate on CIP removal increased and then decreased with the increase of persulfate concentration. This indicates that when the amount of persulfate was added, there was not enough photocatalyst in the reaction system to generate ˙SO4− to activate the persulfate, thus affecting the degradation effect of CIP. On the other hand, the reaction between the inactivated sulfate and sulfate radicals formed sulfate ions, which lost the oxidation ability and thus reduced the CIP removal rate.| | |
S2O82− + ˙SO4− → SO42− + ˙S2O8−
| (3) |
 |
| | Fig. 13 Degradation effect of CIP with different PS concentration. | |
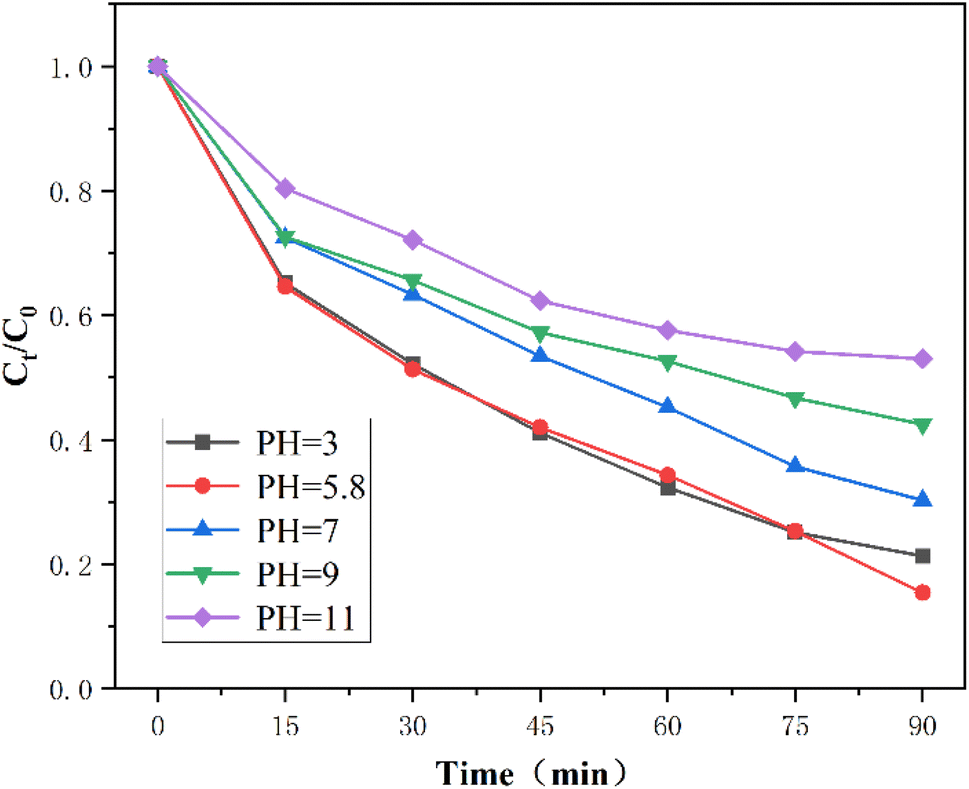
3.9.3 Solution initial pH. In addition to the above influencing conditions, solution pH is one of the most important factors in the adsorption process, and the effect of the initial pH of the solution on the degradation effect of CIP in the whole degradation system. It is well known that CIP is an amphoteric compound and exists in positive ionic form when the solution pH < 6.1, in ionic form at 6.1 < pH < 8.7 and in negative ionic form at pH > 8.7. The conditions for the photocatalytic experiments were: initial CIP concentration of 10 mg L−1, catalyst dosage of 0.3 g L−1, persulfate concentration of 1 mM, and temperature of 25 ± 2 °C.The effect of initial pH of the solution on the degradation of CIP is shown in Fig. 13. The pH range was chosen to be 3.0–11, with pH = 3, 5.8, 7, 9 and 11, where pH = 5.8 was the pH of the ciprofloxacin solution itself without acid–base adjustment, and the initial pH was determined by the effect on the CIP removal effect under different pH conditions. In when the initial pH was from 3 to 5.8, there was an increase in CIP removal efficiency within 90 min, and when the initial pH was 9 or 11, the removal efficiency of CIP decreased sharply. When the pH was lower than 6, the persulfate became more stable under acidic conditions and the reaction was able to be activated into more sulfate radicals, which promoted the degradation of CIP; when the pH was >7, the reaction under alkaline conditions, the sulfate could be converted into hydroxyl radicals, which had a lower redox potential and weaker oxidation capacity compared with sulfate, which also led to the removal rate was reduced by the reaction eqn (4) and (5) (Fig. 14). Therefore, it was chosen not to adjust the pH value in the whole experimental reaction system and allowed to decompose CIP under natural pH conditions.
| | |
˙SO4− + ˙OH → SO42− + ˙OH
| (4) |
| | |
˙SO4− + H2O → SO42− + ˙OH + H+
| (5) |
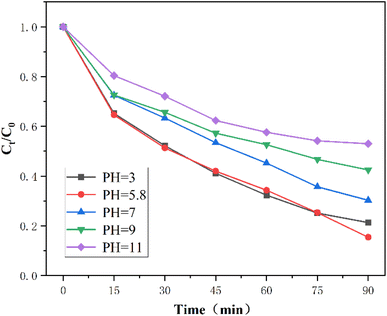 |
| | Fig. 14 Degradation effect of CIP by at different PH values. | |
3.10 Stability and reusability of CN/BOC-2
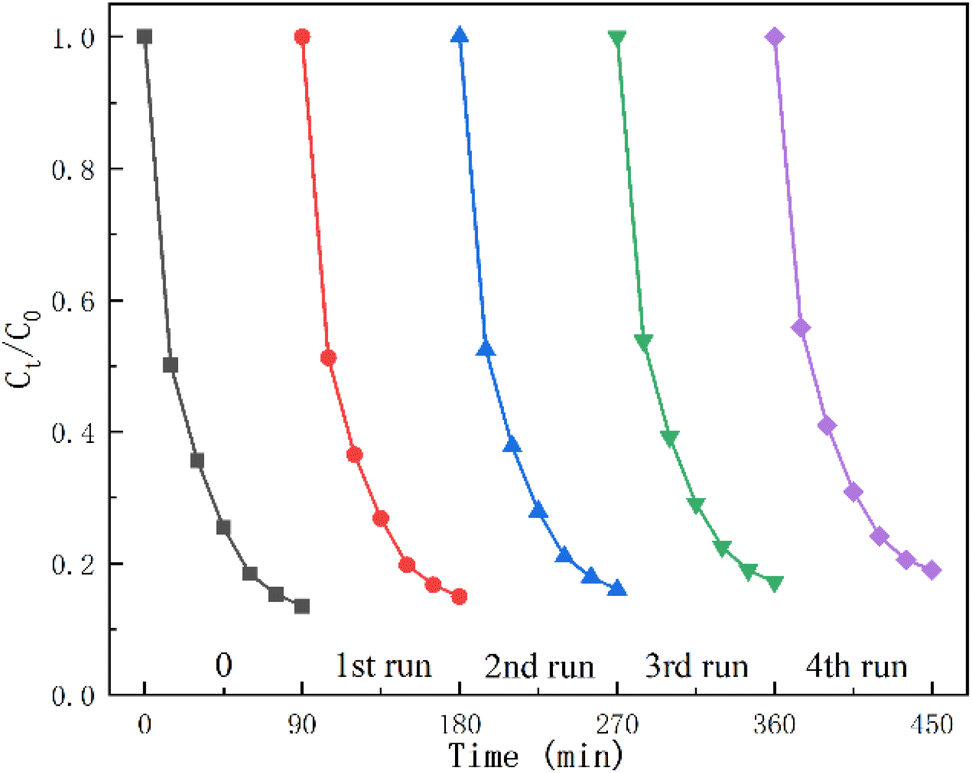
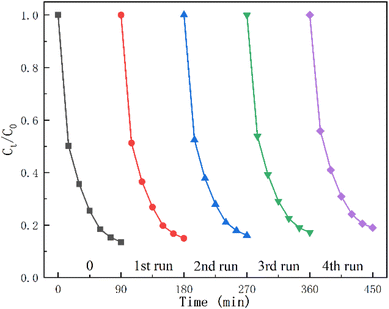
The regeneration capacity of CN/BOC-2 was investigated by regeneration experiments. As shown in Fig. 15, after the degradation of CIP, CN/BOC-2 was filtered, washed and dried to recover, and the removal rate of CIP could still reach 80% after four cycles of degradation for 90 min. The removal efficiency of ciprofloxacin did not change significantly with the increase of regeneration times, which indicated that the CN/BOC-2 catalyst still showed good catalytic performance after four cycles of regeneration.
 |
| | Fig. 15 Degradation effect of CIP by CN/BOC-2 catalyst cycle. | |
3.11 The roles of the active species in ciprofloxacin degradation
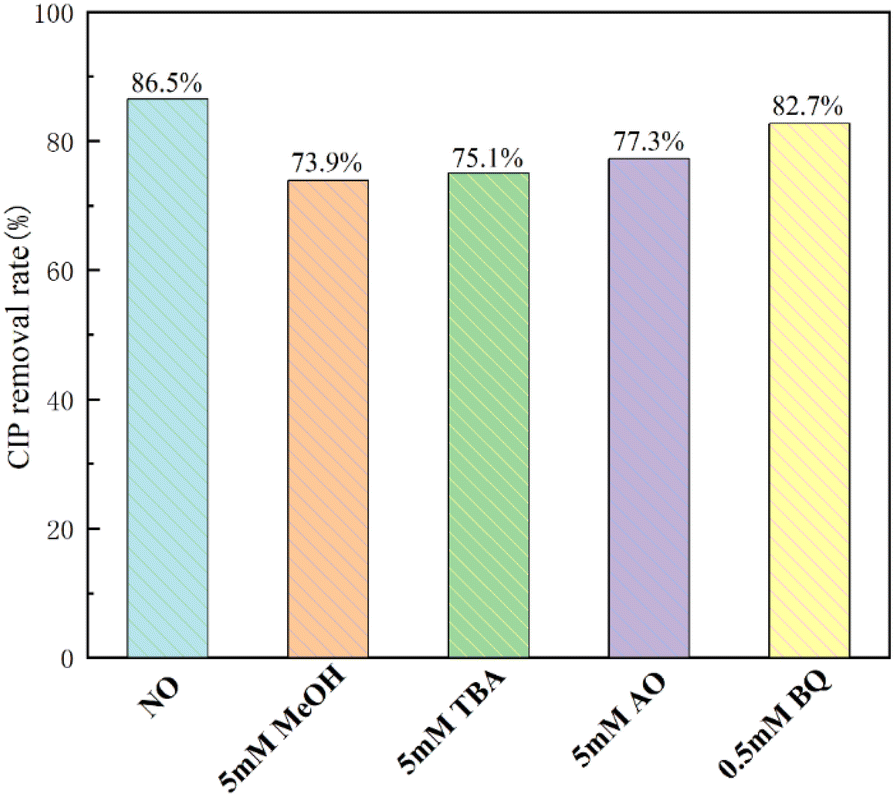
To explore the photodegradation mechanism of CN/BOC-2 composites, the main reactive species generated during photodegradation were identified by radical trapping experiments. In the reactive species experiments, methanol (MeOH) trapped both ˙OH and ˙SO4−, tert-butanol (TBA) trapped hydroxyl radicals (˙OH), ammonium oxalate (AO) trapped vacancies (h+), and p-benzoquinone (BQ) captures superoxide anion radicals (˙O2−).53,55 Tert-Butanol, ammonium oxalate and methanol were all effective in capturing h+, ˙OH− and ˙SO4−, and all three had an inhibitory effect on CIP degradation when the initial solution pH was 5.8 (Fig. 16), while the effect of methanol was somewhat stronger compared to tert-butanol and ammonium oxalate, and the decrease in CIP degradation rate reflected the extent of involvement of the active species. The results showed that the photocatalytic degradation rate of CIP was 86.5% without the addition of any radical trapping agent, and decreased from 86.5% to 73.9%, 75.1%, and 77.3% with the addition of methanol, ammonium oxalate, and tert-butanol. The addition of BQ to the photodegradation system had only a minor effect on the photocatalytic efficiency of CN/BOC-2 by 3.8%, indicating that ˙O2− was not the main active species. These results suggest that ˙OH, h+ and ˙SO4− are the main active species for CIP degradation in the CN/BOC-2/PS system.
 |
| | Fig. 16 Capture diagram of active species for degradation of CIP in Vis/CN/BOC-2/PS system. | |
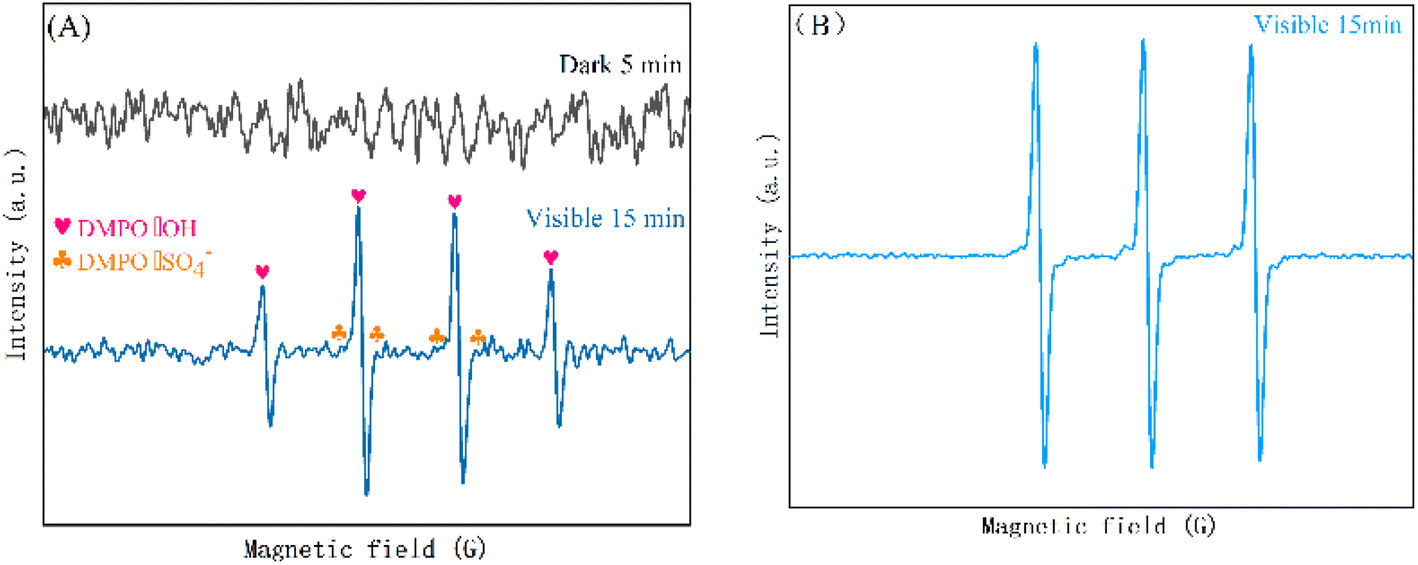
To further identify the active species, ESR spin-trapping techniques for 5,5-dimethyl-1-pyrroline-N-oxide (DMPO) were also employed to test the results shown in Fig. 16(A and B). A specific quadruplet state spectrum with an intensity ratio of about 1![[thin space (1/6-em)]](https://www.rsc.org/images/entities/char_2009.gif) :2:2:1 was measured (Fig. 17(A)), which is characteristic of DMPO–˙OH, the spin adduct, and an intense signal of DMPO–˙OH, indicating the formation of ˙OH−. The EPR spectrum shows a higher signal intensity of ˙OH− than ˙SO4− signal intensity, and the characteristic signal peak of h+ appeared in the EPR spectrum after 15 min of light exposure as shown in Fig. 17(B). This indicates that the dominant role of ˙OH− in the reaction system is stronger than that of ˙SO42−, which is consistent with the results of the radical trapping experiments.
:2:2:1 was measured (Fig. 17(A)), which is characteristic of DMPO–˙OH, the spin adduct, and an intense signal of DMPO–˙OH, indicating the formation of ˙OH−. The EPR spectrum shows a higher signal intensity of ˙OH− than ˙SO4− signal intensity, and the characteristic signal peak of h+ appeared in the EPR spectrum after 15 min of light exposure as shown in Fig. 17(B). This indicates that the dominant role of ˙OH− in the reaction system is stronger than that of ˙SO42−, which is consistent with the results of the radical trapping experiments.
 |
| | Fig. 17 EPR spectra DMPO–˙OH and DMPO–˙SO4− (A) and DMPO–h+ (B). | |
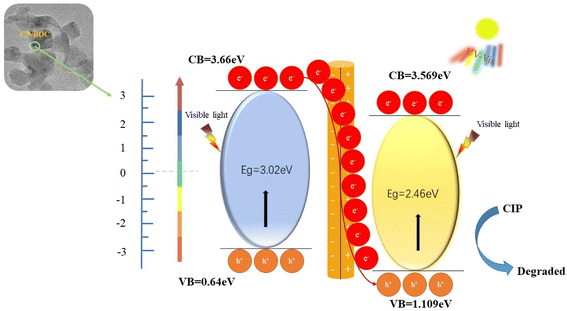
The possible photocatalytic mechanism of the Vis/CN/BOC-2/PS system was inferred from radical trapping experiments and EPR analysis. In simulated visible light, both BiOCl and g-C3N4 photocatalysts could be excited by visible light, and a Z-type heterostructure was formed in the CN/BOC-2 composite.52 The electrons in the conduction band of BiOCl were transferred to the valence band of g-C3N4 and generated h+.53 The electron activation PS on the conduction band of BiOCl produces ˙SO4−, which then reacts with water to produce ˙OH−. The reaction process is shown in eqn (6)–(9).
| | |
CN/BOC-2 + hv → h+ + e−
| (6) |
| | |
e− + S2O82− → SO42− + ˙SO42−
| (7) |
| | |
˙SO4− + H2O → ˙OH + SO42−
| (8) |
| | |
h+,˙SO4− ,˙OH + CIP → CO2 + H2O + …
| (9) |
The M–S plots of g-C3N4 samples were investigated at 500 Hz frequency to understand conductor type and band alignment. On the basis of the Experimental section and Results and discussion section, the band alignment structure and mechanism related to photogenerated carrier charge separation and transfer process in CN/BOC-2 are demonstrated in Fig. 18, respectively. The band gap of CN/BOC-2 was measured by means of UV-vis DR spectral analysis applied to Kubelka–Munk transformation (3.02 and 2.46 eV).
| | |
ECB = X − Ee − 0.5Eg
| (10) |
 |
| | Fig. 18 Schematic representation of proposed charge transfer mechanism. | |
When exposed to light, BiOCl and g-C3N4 were excited and generated electron–hole pairs.54 The electrons moved from the valence band to the conduction band. During the fallback process, the electrons from BiOCl preferentially moved to the valence band of g-C3N4 and recombined with its holes. This effectively prevented the electron–hole recombination in BiOCl and improved its hole utilization.55 These holes decomposed the CIP molecules owing to their strong oxidizing ability.
4. Conclusions
In this paper, a new CN/BOC composite photocatalyst material was prepared by high-temperature roasting and hydrothermal synthesis, and the photodegradation of organic pollutants CIP in water under visible light irradiation was investigated. Compared with single g-C3N4, BiOCl, CN/BOC has better photocatalytic activity. g-C3N4 doping composite effectively improves the forbidden bandwidth of BiOCl photocatalyst, which is beneficial to reduce the electron–hole complexation rate and can effectively improve the ability of the composite catalyst to activate peroxynitrite. The reaction rate constant of Vis/CN/BOC-2/PS system (Kobs) was 0.0084, which was significantly higher than that of CN/BOC-2, CN/BOC-2/PS, Vis/CN/BOC-2 and Vis/PS systems, and the removal rate remained above 80% after four cycles, indicating that CN/BOC-2 still maintained a good stability. Meanwhile, the photocatalytic degradation mechanism of CIP was investigated by combining scavenger experiments and electron spin resonance technique, and it was found that the presence of ˙OH, h+ and ˙SO4− in the visible light photocatalytic process could rapidly destroy the piperazine and quinolone rings and achieve the rapid removal of the antibacterial activity of CIP. The optimal concentrations of CN/BOC-2 and PS were 0.3 g L−1 and 1 mM, respectively, and the degradation rate of CIP was more than 86% under these conditions. Moreover, the biotoxicity of the reaction solution decreased from 55.67% to 44.21% after 90 min of degradation. In this study, the rapid degradation of CIP under visible light conditions provides a simple method for the construction of composite photocatalysts, and is expected to be applied in practical applications.
Author contributions
Yingzi Lin: methodology, writing—review, funding acqui-sition. Yu Wang: formal analysis, writing—original draft, editing. Chunyan Shi: review & editing. Dongyan Zhang: writing—original draft, data curation. Gen Liu: conceptualization. Lei Chen: supervision. Baoling Yuan: formal analysis. Ao Hou: project administration, supervision. Deqiang Zou: conceptualization. Xiaochen Liu: supervision. Qingyu Zhang: writing—review & editing.
Conflicts of interest
The authors declare no competing financial interest.
Acknowledgements
Our work was supported by the National Natural Science Foundation of China (Grant No. 51778267), the National Water Pollution Control and Treatment Science and Technology Major Project (No. 2012ZX07408001), the Jilin Province Science and Technology Department Project (No. 20190201113JC), the Jilin Provincial Department of Ecology and Environment Project (No. 2019-15).
References
- S. P. Tripathy, S. Subudhi, A. Ray, P. Behera, A. Bhaumik and K. Parida, Langmuir, 2022, 38, 1766–1780 CrossRef CAS PubMed.
- S. Acharya, S. Mansingh and K. M. Parida, Inorg. Chem. Front., 2017, 4, 1022–1032 RSC.
- L. Biswal, S. Nayak and K. Parida, Catal. Sci. Technol., 2021, 11, 1222–1248 RSC.
- J. Zheng, X. Cui, Q. Yang, Q. Ren, Y. Yang and H. Xing, Chem. Eng. J., 2018, 354, 1075–1082 CrossRef CAS.
- M. Reza Gholipour, C.-T. Dinh, F. Béland and T.-O. Do, Nanoscale, 2015, 7, 8187–8208 RSC.
- G. Zhang, Z.-A. Lan, L. Lin, S. Lin and X. Wang, Chem. Sci., 2016, 7, 3062–3066 RSC.
- R. C. Pawar, S. Kang, S. H. Ahn and C. S. Lee, RSC Adv., 2015, 5, 24281–24292 RSC.
- L. Wang and T. Sasaki, Chem. Rev., 2014, 114, 9455–9486 CrossRef CAS PubMed.
- X. Wang, M. Sun, M. Murugananthan, Y. Zhang and L. Zhang, Appl. Catal., B, 2020, 260, 118205 CrossRef CAS.
- D. Zeng, W.-J. Ong, H. Zheng, M. Wu, Y. Chen, D.-L. Peng and M.-Y. Han, J. Mater. Chem. A, 2017, 5, 16171–16178 RSC.
- D. Zeng, W. Xu, W.-J. Ong, J. Xu, H. Ren, Y. Chen, H. Zheng and D.-L. Peng, Appl. Catal., B, 2018, 221, 47–55 CrossRef CAS.
- B. P. Mishra and K. Parida, J. Mater. Chem. A, 2021, 9, 10039–10080 RSC.
- L. Acharya, B. P. Mishra, S. P. Pattnaik, R. Acharya and K. Parida, New J. Chem., 2022, 46, 3493–3503 RSC.
- S. Patnaik, D. P. Sahoo and K. Parida, Carbon, 2021, 172, 682–711 CrossRef CAS.
- P. Behera, A. Ray, S. P. Tripathy, L. Acharya, S. Subudhi and K. Parida, J. Photochem. Photobiol., A, 2023, 436, 114415 CrossRef CAS.
- Y. Zhang, L. Pei, Z. Zheng, Y. Yuan, T. Xie, J. Yang, S. Chen, J. Wang, E. R. Waclawik and H. Zhu, J. Mater. Chem. A, 2015, 3, 18045–18052 RSC.
- M. Ebihara, T. Ikeda, S. Okunaka, H. Tokudome, K. Domen and K. Katayama, Nat. Commun., 2021, 12, 3716 CrossRef CAS PubMed.
- P. Zhou, J. Yu and M. Jaroniec, Adv. Mater., 2014, 26, 4920–4935 CrossRef CAS PubMed.
- S. Nayak, J. Mater. Chem. A, 2015, 3, 18622–18635 RSC.
- J. Jiang, K. Zhao, X. Xiao and L. Zhang, J. Am. Chem. Soc., 2012, 134, 4473–4476 CrossRef CAS PubMed.
- X. Li, R. Zhao and X. Gao, Part. Sci. Technol., 2019, 37, 521–527 CrossRef CAS.
- H. Yu, D. Ge, Y. Wang, S. Zhu, X. Wang, M. Huo and Y. Lu, J. Alloys Compd., 2019, 786, 155–162 CrossRef CAS.
- J. Cao, B. Xu, H. Lin, B. Luo and S. Chen, Catal. Commun., 2012, 26, 204–208 CrossRef CAS.
- M. Du, S. Zhang, Z. Xing, Z. Li, J. Yin, J. Zou, Q. Zhu and W. Zhou, Langmuir, 2019, 35, 7887–7895 CrossRef CAS PubMed.
- Q. Zhang, G. Li, J. Bai, R. He and C. Li, Mater. Res. Bull., 2019, 117, 9–17 CrossRef CAS.
- M. Hojamberdiev, Z. C. Kadirova, E. Zahedi, D. Onna, M. Claudia Marchi, G. Zhu, N. Matsushita, M. Hasegawa, S. Aldabe Bilmes and K. Okada, Arabian J. Chem., 2020, 13, 2844–2857 CrossRef CAS.
- Y. Wu, J. Ward-Bond, D. Li, S. Zhang, J. Shi and Z. Jiang, ACS Catal., 2018, 8, 5664–5674 CrossRef CAS.
- Y. Tan, Z. Shu, J. Zhou, T. Li, W. Wang and Z. Zhao, Appl. Catal., B, 2018, 230, 260–268 CrossRef CAS.
- X. Dong, Z. Sun, X. Zhang, C. Li and S. Zheng, J. Taiwan Inst. Chem. Eng., 2018, 84, 203–211 CrossRef CAS.
- S. Bellamkonda and G. Ranga Rao, Catal. Today, 2019, 321–322, 18–25 CrossRef CAS.
- Z. Zhou, H. Xu, D. Li, Z. Zou and D. Xia, Chem. Phys. Lett., 2019, 736, 136805 CrossRef CAS.
- Y. Chen, F. Wang, Y. Cao, F. Zhang, Y. Zou, Z. Huang, L. Ye and Y. Zhou, ACS Appl. Energy Mater., 2020, 3, 4610–4618 CrossRef CAS.
- K. S. W. Sing, Pure Appl. Chem., 1985, 57, 603–619 CrossRef CAS.
- L. Acharya, S. Nayak, S. P. Pattnaik, R. Acharya and K. Parida, J. Colloid Interface Sci., 2020, 566, 211–223 CrossRef CAS PubMed.
- M. Sun, R. Gao, B. Wang, J. Li, Z. Zhang, G. Bai, X. Yan, Y. Li and L. Chen, New J. Chem., 2022, 46, 13260–13268 RSC.
- F. M. Cadan, C. Ribeiro and E. B. Azevedo, Appl. Surf. Sci., 2021, 537, 147904 CrossRef CAS.
- W. Hou, C. Deng, H. Xu, D. Li, Z. Zou, H. Xia and D. Xia, ChemistrySelect, 2020, 5, 2767–2777 CrossRef CAS.
- T. Jia, J. Li, F. Long, F. Fu, J. Zhao, Z. Deng, X. Wang and Y. Zhang, Crystals, 2017, 7, 266 CrossRef.
- B. Zhu, P. Xia, Y. Li, W. Ho and J. Yu, Appl. Surf. Sci., 2017, 391, 175–183 CrossRef CAS.
- F. Dong, Y. Sun, L. Wu, M. Fu and Z. Wu, Catal. Sci. Technol., 2012, 2, 1332 RSC.
- A. S. Lim and A. Atrens, Appl. Phys. A, 1990, 51, 411–418 CrossRef.
- H. Ma, J. Liu, S. Zuo, Y. Yu, W. Liu, Y. Wang and B. Li, ChemistrySelect, 2021, 6, 10097–10104 CrossRef CAS.
- X. Zhang, D. An, D. Feng, F. Liang, Z. Chen, W. Liu, Z. Yang and M. Xian, Appl. Surf. Sci., 2019, 476, 706–715 CrossRef CAS.
- S. Mansingh, R. Acharya, S. Martha and K. M. Parida, Phys. Chem. Chem. Phys., 2018, 20, 9872–9885 RSC.
- S. Patnaik, K. K. Das, A. Mohanty and K. Parida, Catal. Today, 2018, 315, 52–66 CrossRef CAS.
- K. K. Das, S. Patnaik, S. Mansingh, A. Behera, A. Mohanty, C. Acharya and K. M. Parida, J. Colloid Interface Sci., 2020, 561, 551–567 CrossRef CAS PubMed.
- L. Acharya, G. Swain, B. P. Mishra, R. Acharya and K. Parida, ACS Appl. Energy Mater., 2022, 5, 2838–2852 CrossRef CAS.
- X. H. Xia, J. P. Tu, Y. Q. Zhang, Y. J. Mai, X. L. Wang, C. D. Gu and X. B. Zhao, J. Phys. Chem. C, 2011, 115, 22662–22668 CrossRef CAS.
- D. P. Sahoo, K. K. Das, S. Patnaik and K. Parida, Inorg. Chem. Front., 2020, 7, 3695–3717 RSC.
- R.-L. Huang, W.-Q. Huang, D.-F. Li, L.-L. Ma, A. Pan, W. Hu, X. Fan and G.-F. Huang, J. Phys. D: Appl. Phys., 2018, 51, 135501 CrossRef.
- X. Gao, W. Peng, G. Tang, Q. Guo and Y. Luo, J. Alloys Compd., 2018, 757, 455–465 CrossRef CAS.
- J. Li, Y. Wan, Y. Li, G. Yao and B. Lai, Appl. Catal., B, 2019, 256, 117782 CrossRef CAS.
- S. Xing, W. Li, B. Liu, Y. Wu and Y. Gao, Chem. Eng. J., 2020, 382, 122837 CrossRef CAS.
- S. Nayak, G. Swain and K. Parida, ACS Appl. Mater. Interfaces, 2019, 11, 20923–20942 CrossRef CAS PubMed.
- B. P. Mishra, L. Acharya, S. Subudhi and K. Parida, Int. J. Hydrogen Energy, 2022, 47, 32107–32120 CrossRef CAS.
|
| This journal is © The Royal Society of Chemistry 2023 |
Click here to see how this site uses Cookies. View our privacy policy here. 
 Open Access Article
 This Open Access Article is licensed under a Creative Commons Attribution-Non Commercial 3.0 Unported Licence
 *ab,
Yu Wangb,
Chunyan Shib,
Dongyan Zhangb,
Gen Liub,
Lei Chenb,
Baoling Yuanb,
Ao Houb,
Deqiang Zoub,
Xiaochen Liub and
Qingyu Zhangb
*ab,
Yu Wangb,
Chunyan Shib,
Dongyan Zhangb,
Gen Liub,
Lei Chenb,
Baoling Yuanb,
Ao Houb,
Deqiang Zoub,
Xiaochen Liub and
Qingyu Zhangb