
 Open Access Article
 This Open Access Article is licensed under a
 Creative Commons Attribution 3.0 Unported Licence
Carrier density tuning in CuS nanoparticles and thin films by Zn doping via ion exchange
Amaresh
Shukla
a,
Shouqi
Shao
b,
Sadie
Carter-Searjeant
a,
Sarah
Haigh
 b,
David
Richards
a,
Mark
Green
*a and
Anatoly V.
Zayats
*a
b,
David
Richards
a,
Mark
Green
*a and
Anatoly V.
Zayats
*a
aDepartment of Physics and London Centre for Nanotechnology, King's College London, Strand, London WC2R 2LS, UK. E-mail: a.zayats@kcl.ac.uk; mark.a.green@kcl.ac.uk
bDepartment of Materials, University of Manchester, Oxford Road, Manchester M13 9PL, UK
First published on 24th January 2023
Abstract
Copper sulphide (covellite) nanoplatelets have recently emerged as a plasmonic platform in the near-infrared with ultrafast nonlinear optical properties. Here we demonstrate that the free-carrier density in CuS, which is an order of magnitude lower than in traditional plasmonic metals, can be further tuned by chemical doping. Using ion exchange to replace Cu with an increasing content of Zn in the nanoparticles, the free-hole density can be lowered, resulting in a long-wavelength shift of the localised plasmon resonances from 1250 nm to 1750 nm. The proposed approach provides new opportunities for tuning the plasmonic response of covellite nanocrystals as well as the carrier relaxation time which decreases for lower free-carrier densities.
Plasmonic nanoparticles and nanostructures are widely used in bio- and chemical sensing, enhanced spectroscopies, nonlinear optics, as well as photochemistry and photocatalysis.1–7 These applications rely on pronounced localised surface plasmon (LSP) resonances and associated field localisation and enhancement effects, which depend on the free-carrier concentration. For noble metals, tuning the LSP can be achieved through size and shape control of the nanoparticles.8,9 The free-electrons density is very high (n ≈ 6 × 1028 m−3) in these materials which makes them most suitable for plasmonic applications in the visible spectral range. Nontraditional plasmonic materials have recently been extensively studied, such as metal nitrides and oxides and strongly doped semiconductors,10–13 in order to overcome the above spectral limitations of typical plasmonic metals by shifting their LSP towards the infrared range.
Dopant-induced tuning of the plasmon resonance has been achieved in metal oxide nanoparticles, where the post addition of p-type dopant metal ions resulted in varying the free-carrier concentration and hence the plasma frequency.14 The control over a dopant radial distribution in metal oxide nanoparticles may also result in the variation of the plasmonic response when a core–shell geometry is formed.15
Copper monosulfide (CuS) is a naturally occurring layered chalcogenide with a free-carrier concentration of n ≈ 3 × 1027 m−3,16 which is an order of magnitude smaller than in noble metals, such as Au or Ag, making CuSan excellent candidate for plasmonic applications in the near-infrared. The anisotropic nature of the crystal lattice means that CuS nanoplatelets support a variety of LSP resonances in and around the second biological spectral window (1000 nm–1300 nm) and close to the optical communication wavelength range.16 The LSP wavelength of CuS nanocrystals can be tuned in the usual way through their size and shape,17–20 as well as by controlling crystal structure21 and chemical tuning.22 The low free-carrier density in vacancy doped copper chalcogenides is favorable for LSP control23via electrochemical charging/dischaging or chemical doping as has been shown for some other materials like Cu2−xSe or indium oxide.24,25 CuS has a partially filled valence band, making it p-type plasmonic material due to the holes related to the 3p and 3s orbitals of S and 3d orbitals of Cu.26 This opens up an opportunity to control the hole concentration in CuS by exchanging Cu ions with other suitable cations, thereby controlling the position of the LSP resonance.
Cation exchange in Cu2−xS nanoparticles occurs at high reaction temperatures with the Cu cations being replaced by another cation diffusing in the interstitial sites.27,28 This process has been used to transform Cu4SnS4 to Cu2ZnSnS4 nanoparticles29 and also to transform Cu2S nanocrystals to CuInS and CuInZnS nanocrystals by exchanging cations with (In3+) and (Zn2+).30 The prime objective of these and similar works was to create new nanoparticles with a required photoluminescence spectrum. However, there has been not much attempt to control the plasmonic properties of chalcogenide nanocrystals via cation exchange, focused on modifying the resulting carrier density. The recent report described the chemical doping of CuS nanoplatelets by the addition of Sb during synthesis, with the dopants located near the surface of the particles. The obtained LSP was tuneable in the range from ca. 650 nm to ca. 2100 nm by the addition of varying amounts of Sb.31
In this work, we use the ion interchange mechanism to modify the free-hole density in CuS nanocrystals replacing Cu-cation with Zn, in order to enable a widely tuneable LSP platform. The resulting Zn-doped CuS nanoparticles exhibit LSP resonances that depend on the doping, shifting from 1250 nm to 1750 nm with increasing Zn doping, as the hole concentration decreases. Thin films of these nanoparticles exhibit optical properties consistent with the observed plasma frequency changes. The control over a free-carrier density was also favorable for tuning the relaxation time of hot-carriers in nanocrystals,32 required for optimisation of this nanomaterial in photochemical and nonlinear optical applications.
Results and discussion
Synthesis of doped CuS nanoparticles
CuS nanocrystals were first synthesized using the well established hot injection procedure.33 In brief, 0.5 mmol of CuCl dissolved in 20 ml of octadecene, 6 mmol of oleylamine and 1 mmol of oleic acid was steadily heated while stirring under a nitrogen atmosphere, to 190 °C and then brought down to 180 °C at which point 2 ml of 1 M of sulphur solution in oleylamine at 50 °C was injected and then maintained at 180 °C for 10 min. The contents were then cooled down to room temperature.A Zn precursor solution (1 M) was prepared by dissolving zinc diethylthiodicarbamate in 10 ml octadecene and maintained at 70 °C in nitrogen atmosphere under stirring. The precursor was injected into the CuS solution under stirring at room temperature and under a nitrogen atmosphere. The contents were then steadily heated and aliquots taken at defined temperatures points (90 °C, 120 °C, 150 °C, 180 °C, and 230 °C). Ethanol was added to the samples and centrifuged at 4500 rpm for 5 min. The precipitates were washed with methanol and dissolved in chloroform. Repetitive cycles of precipitation (by adding an equal volume of ethanol and centrifuging at 4500 rpm for 5 min) and washing were performed and then finally the samples were dissolved in chloroform.
In this way, CuS![[thin space (1/6-em)]](https://www.rsc.org/images/entities/char_2009.gif) :Zn nanoparticle samples with different concentrations of Zn were obtained from the base CuS nanoparticles. For comparison, original CuS nanoparticles were treated at the same temperatures and conditions but without the Zn precursor present in order to evaluate potential modifications of the nanoparticles due to the temperature. For detailed structural characterisation, we chose to examine the samples obtained at 90 °C and 230 °C.
:Zn nanoparticle samples with different concentrations of Zn were obtained from the base CuS nanoparticles. For comparison, original CuS nanoparticles were treated at the same temperatures and conditions but without the Zn precursor present in order to evaluate potential modifications of the nanoparticles due to the temperature. For detailed structural characterisation, we chose to examine the samples obtained at 90 °C and 230 °C.
Structural characterization
Fig. 1 shows the scanning transmission electron microscopy (STEM) images of the synthesized nanocrystals, performed using a Titan ChemiSTEM operated at 200 kV with a probe convergence angle of 18 mrad and a high angle annular dark field (HAADF) collection inner angle of 54 mrad. The hexagonal lattice structure is evident from both bright field (BF) and HAADF STEM images and is characteristic of covellite lattice,34 which is further confirmed by matching HAADF-STEM simulations performed with the QSTEM package.35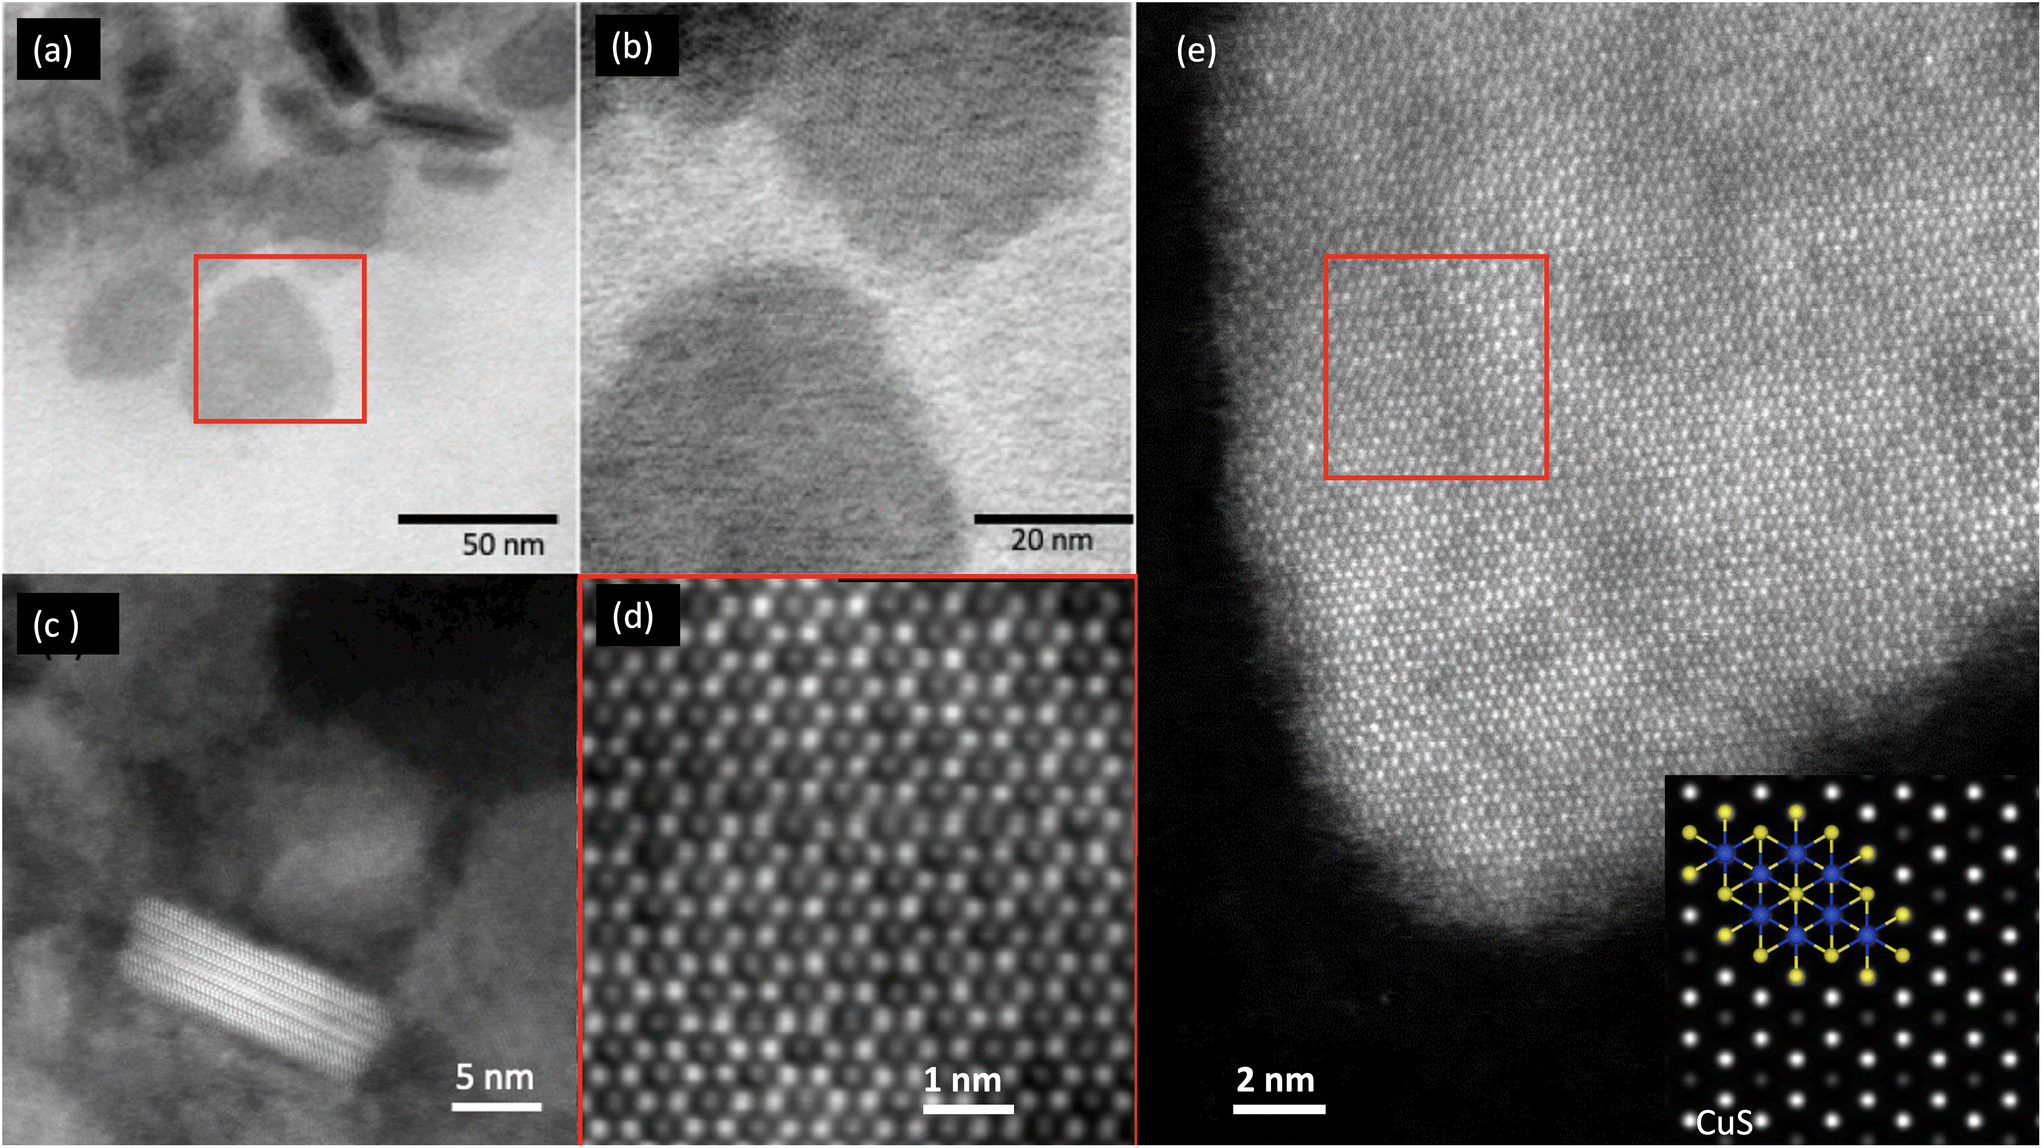 | ||
| Fig. 1 (a) STEM image and (b) its zoomed area of pure single crystalline CuS nanoparticles with diameters of ∼50 nm and thickness of ∼5 nm. (c) The side view of a nanopaticle in (a). (d and e) High-resolution images of a nanoparticle crystal lattice: (d) is a zoom in (e) as indicated by a red square. Inset in (e) shows the HAADF-STEM simulations for a hexagonal lattice of CuS. | ||
Energy dispersive X-ray spectroscopy (EDXS) was performed on the Titan SREM using the Super-X EDXS system (collection angle 0.7 srad) and quantified using the Cliff Lorimer analysis without absorption correction (Fig. 2). STEM-EDXS elemental quantification (Table 1) of the CuS:Zn samples obtained at both the lowest (90 °C) and highest temperature (230 °C) all showed Cu and Zn as well as the expected S content consistent with the single crystal lattice structure (∼48 at% at 90 °C and ∼46 at% at 230 °C). The Cu:Zn content for individual particles was ∼1:1 for samples obtained at 90 °C but showed large variation at 230 °C (from 1:4 to 3:2). The 230 °C particles appear to have no nonuniform compositional variations, whereas the 90 °C particles have a Zn rich surface layer. High-angle annular diffraction field (HAADF) STEM measurements (Fig. 2) and the EDX quantifications for the CuS:Zn samples obtained at both lowest (90 °C) and highest (230 °C) temperatures show the presence of Cu, Zn and S, all in significant proportions. At the same time, no shell structure around the nanoparticles is observed. (Such an outer ZnS shell over the original CuS nanoparticles might influence the LSP resonance.) Although the zinc dithiocarbamate was added to the reaction after the formation of the CuS particles, the deposition of the precursor did not result in a CuS/ZnS core/shell structure, rather cationic exchange appears to have occurred, resulting in what we term a CuS:Zn material. A Zn rich surface is observed for particle 6 (Fig. 1) – possibly resulting from faster ion exchange at a stacking fault (Fig. 2(g–m) and Table 1).
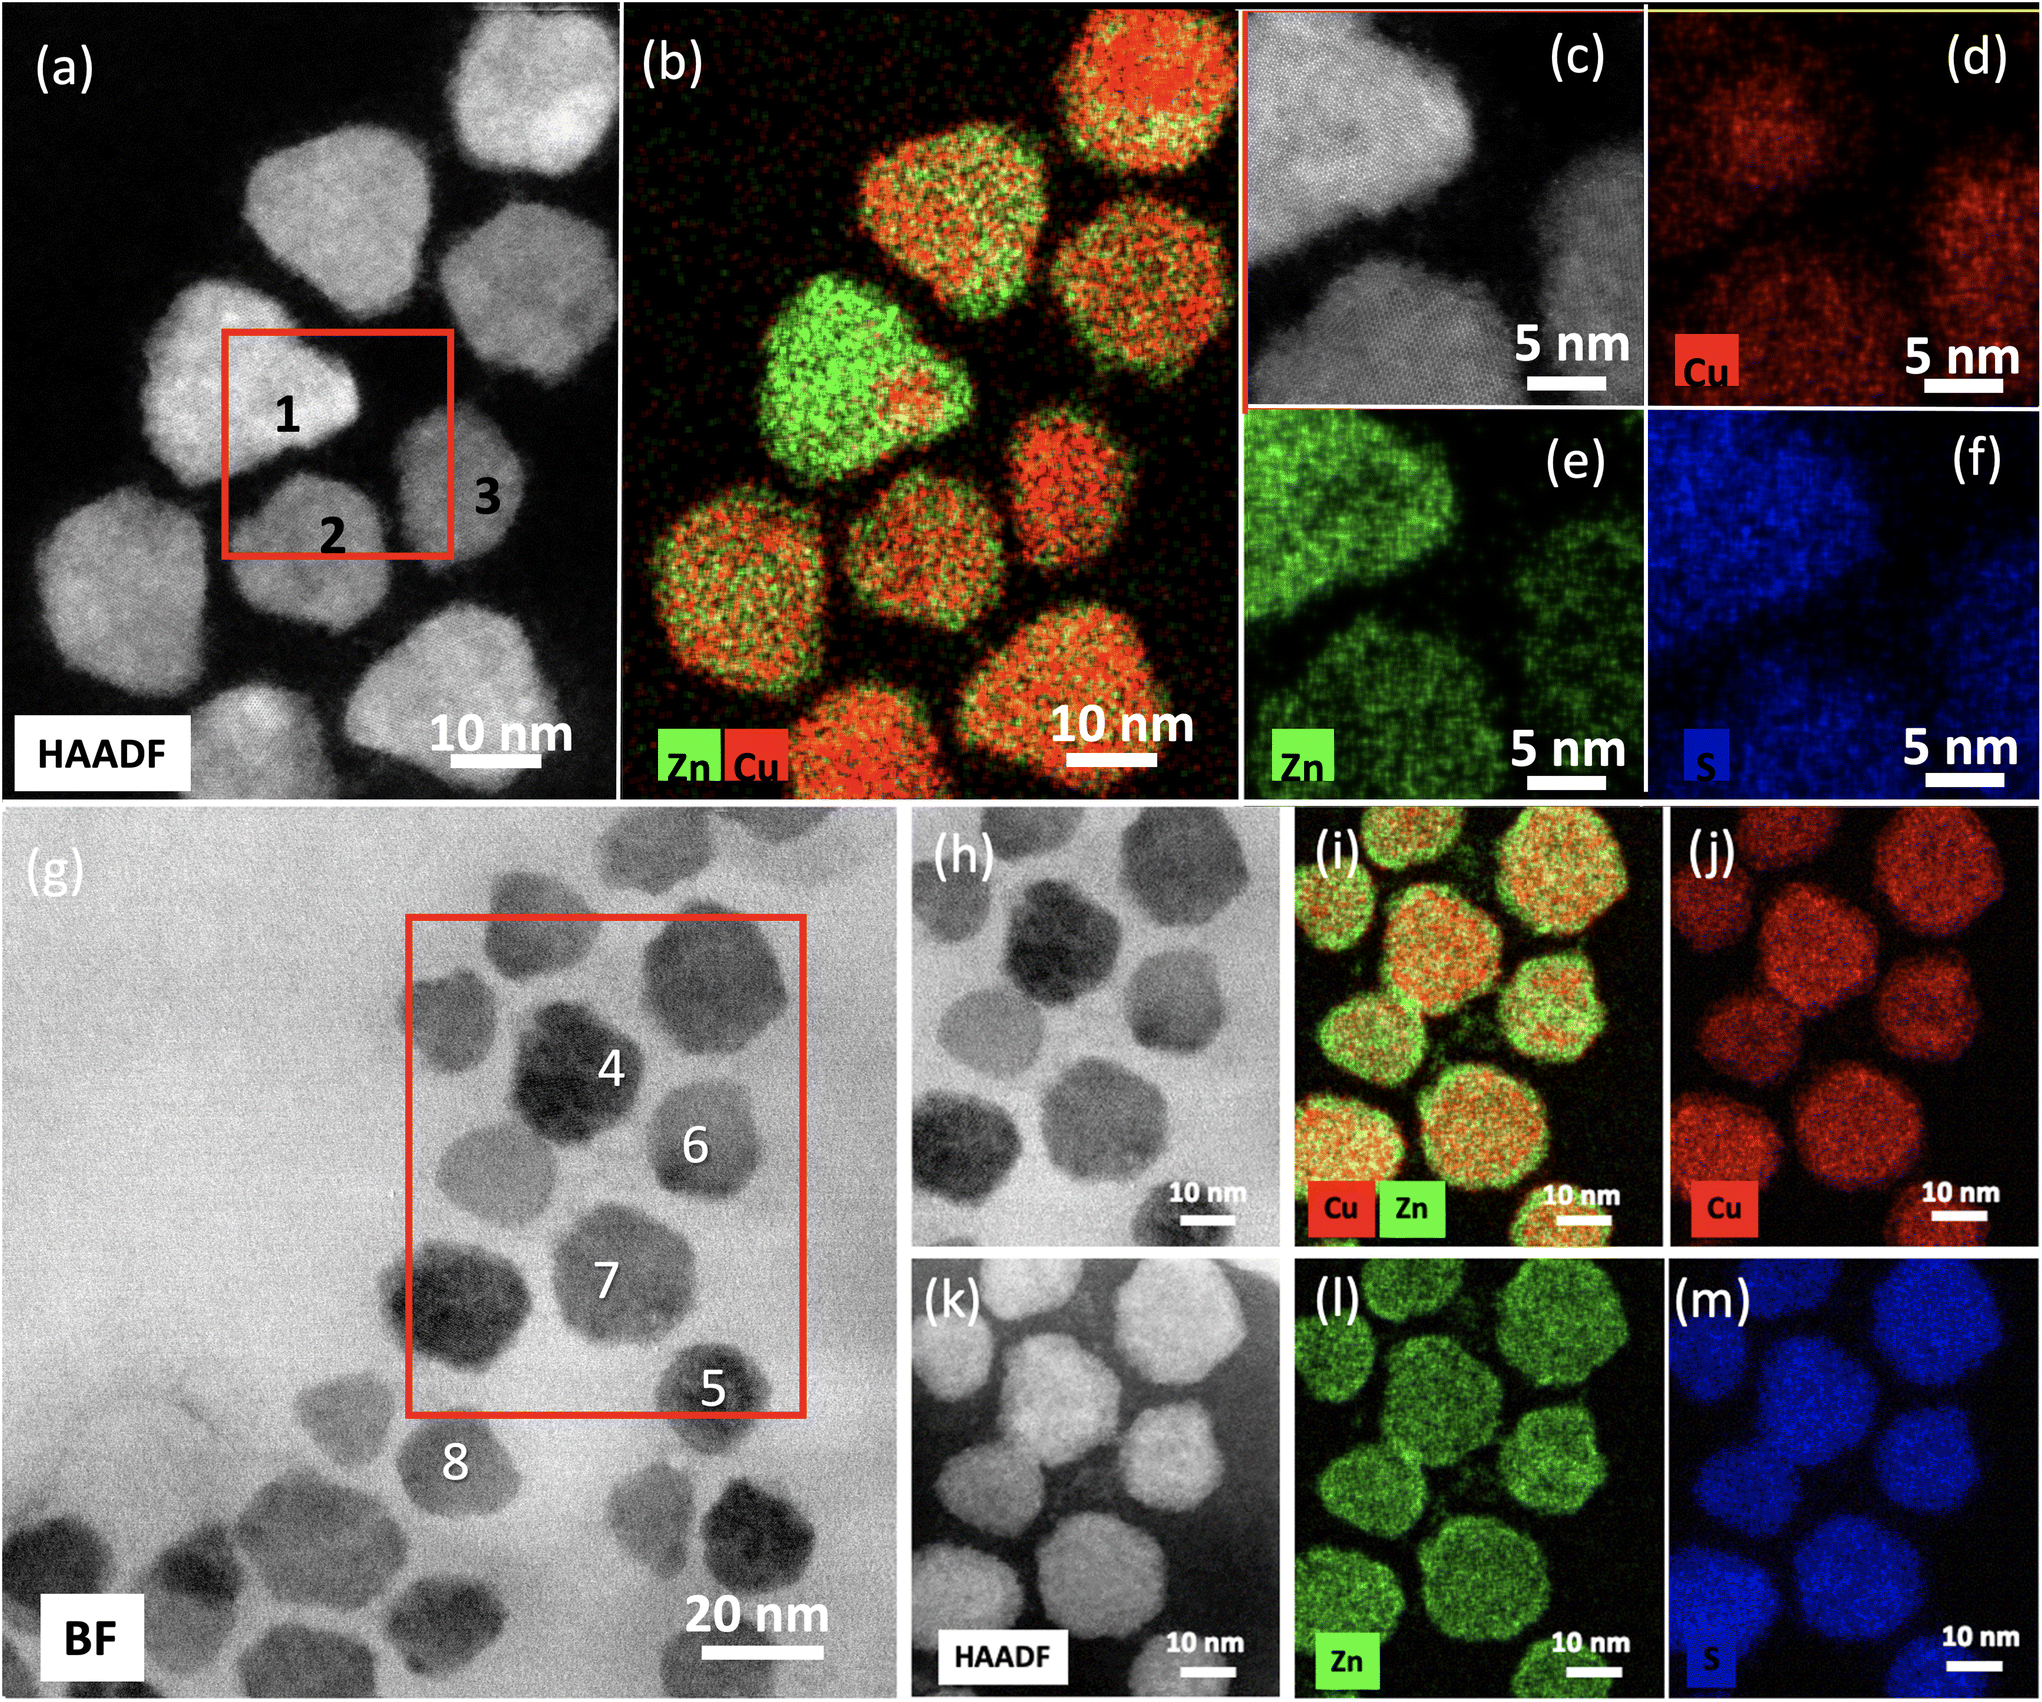 | ||
| Fig. 2 High-resolution STEM images of CuS:Zn nanoparticles obtained at (a–f) 230 °C and (g–m) 90 °C: (a, c and k) HAADF STEM images, (g and h) BF-STEM images, (b and i) composite EDXS elemental maps of relative distributions of Cu and Zn, (e and l) EDXS elemental maps for Zn, (f and j) EDXS elemental maps for Cu, (d and m) EDXS elemental map for S. (c–f) The zoomed in areas shown by the red square in (a). (h–m) The zoomed in areas shown by the red rectangle in (g). | ||
:Zn nanoparticles obtained at 230 °C and 90 °C marked in Fig. 2(a and g)
| Nanoparticles | Cu at% | Zn at% | S at% |
|---|---|---|---|
| 1 – 230 °C | 10.0 | 43.3 | 46.7 |
| 2 – 230 °C | 25.8 | 26.3 | 47.9 |
| 3 – 230 °C | 34.9 | 20.0 | 45.1 |
| 4 – 90 °C | 30.3 | 21.8 | 47.9 |
| 5 – 90 °C | 28.4 | 23.3 | 48.2 |
| 6 – 90 °C | 25.1 | 27.0 | 47.9 |
| 7 – 90 °C | 28.5 | 23.2 | 48.3 |
| 8 – 90 °C | 18.9 | 33.3 | 47.8 |
Nanoparticles prepared at 90 °C displayed an almost homogeneous distribution of Cu and Zn, with a slight predominance of zinc at the surface as might be expected in a lower temperature reaction (Fig. 2). The percentages of copper and zinc highlight that both elements varied in differing particles, both between 20% and 30% (Table 1), whilst the percentage of sulfur was relatively stable at 48%, highlighting that this was indeed cationic exchange and that the dithiocarbamate did not add further sulfur to the particle. Nanoparticles prepared at 230 °C displayed approximately similar elemental distributions, although occasional particles displayed a predominance of zinc with percentages significantly exceeding those of the parent copper (Fig. 2(a), particle 1, and Table 1). Again, the percentage of sulfur remained approximately constant at 45% to 48%; the higher synthesis temperature accounting for the lower sulfur percentage. This is consistent with previous reports on cation exchange in both CuS29,36 and Cu2−xSe37 systems.
The accompanying X-ray diffraction (XRD) data for the nanoparticles show a diffraction pattern consistent with the previous reports of covellite structure of CuS nanoparticles, with no apparent contribution from ZnS (Fig. 3). This suggests that the overall material maintains the covellite crystalline structure following cationic exchange with Zn. No discernible differences were observed in the XRD patterns taken from the nanoparticles prepared at different temperatures, confirming that the particles did not grow significantly further in size at the elevated temperature. A slight shift (≈1°) to a lower reflection angle was observed at the higher synthesis temperatures, consistent with a slight increase in a lattice parameter.
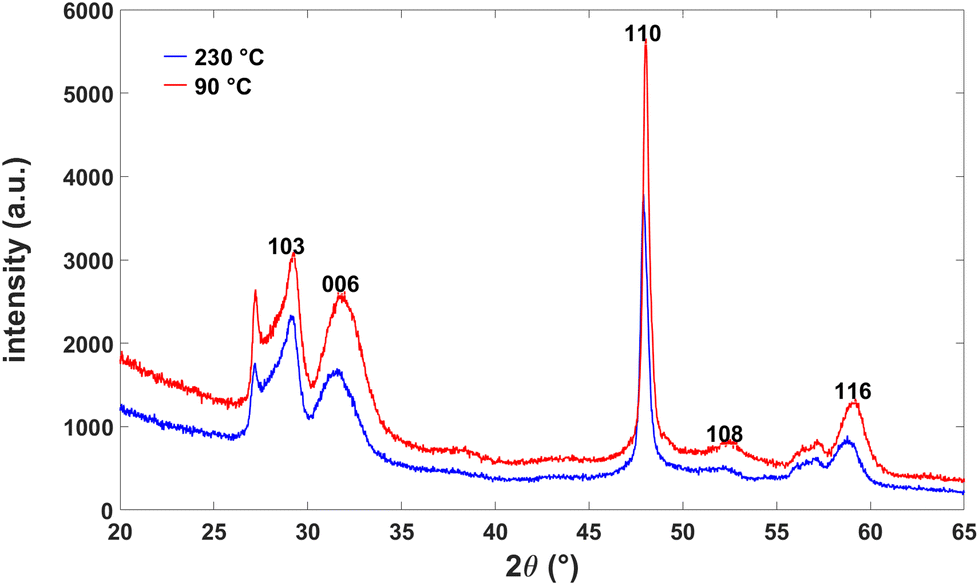 | ||
| Fig. 3 X-ray diffraction spectra for CuS:Zn nanoparticles prepared at 90 °C (red line) and 230 °C (blue line). Identical crystalline structures are observed. Miller indices are assigned to prominent reflections. | ||
Optical characterization of nanoparticles
The absorption spectra of the synthesized nanoparticles are shown in Fig. 4(a). For absorption spectroscopy, the nanoparticles were placed in tetra-chloroethylene (TCE). The absorption spectrum of the original CuS nanoparticle solution hadan absorption peak at 1250 nm which was in the characteristic range for CuS nanoparticles.33 At higher synthesis temperatures, corresponding to increased Zn concentration, the absorption exhibited a red shift of the LSP resonance in the range of 1250 nm to 1750 nm (Fig. 4(a)): at synthesis temperatures of 90 °C and 230 °C, the samples had the LSP peaks at 1420 nm and 1630 nm, respectively. The full width at half maximum (FWHM) of the observed LSP peaks is approximately the same ∼0.4 eV for all the nanoparticles with different Zn concentrations. The CuS:Zn nanoparticles synthesised at different temperatures have similar average sizes with a size dispersion similar across the range oftemperatures used (Fig. 2). Therefore, the contribution of the inhomogeneous broadening to the FWHM is expected to be the same for all the spectra.
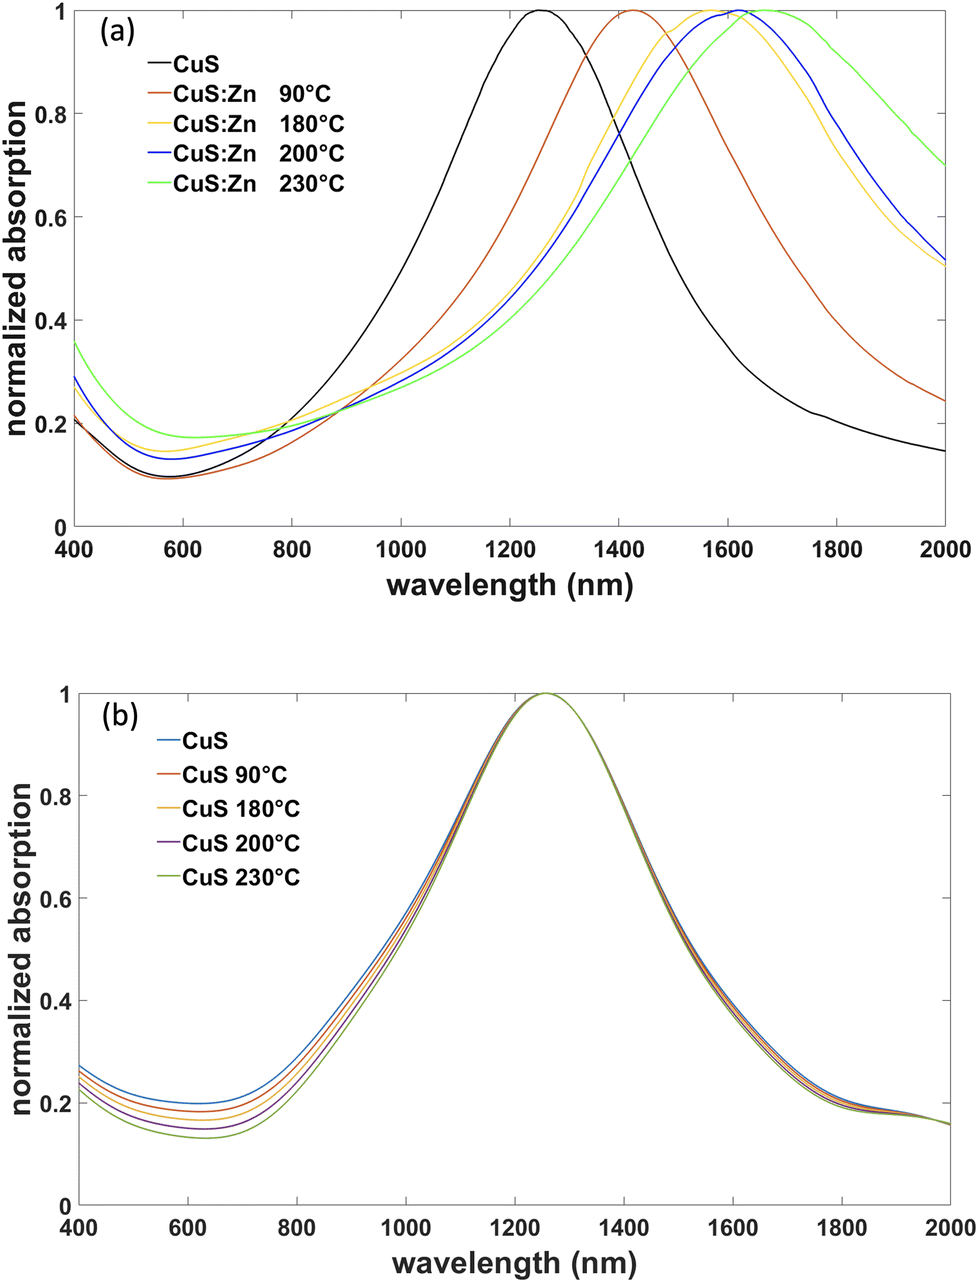 | ||
| Fig. 4 Absorption spectra of doped and undoped CuS nanoparticles synthesized or treated at different temperatures indicated: (a) Zn-doped CuS and (b) pure CuS. The nanoparticles are dispersed in tetrachloroethylene (TCE) solvent with refractive index 1.5055. | ||
In the control experiments, in order to discount the possibility of the shape or size modification of CuS nanoparticles under treatment at increased temperatures, the Zn precursor during heating was replaced with pure sulfur. No appreciable LSP shift was observed under these conditions (Fig. 4(b)). A very small reduction of the FWHM can be related to Ostwald ripening inducing a smaller size dispersion for the annealed nanoparticles.38
The dependence of the LSP position on the Zn concentration in the nanoparticles is indicative of the changes in the hole density in the nanoparticles upon Zn doping. The hole concentration decreases when Zn substitutes Cu, resulting in the lower plasma frequency and, therefore, the long-wavelength shift of the LSP resonance which depends on the plasma frequency.
The detailed modelling of the LSP in anisotropic nanoparticles requires numerical treatment of the plasmonic response with the known permittivity of the material. In order to obtain qualitative understanding of the LSP shift and estimate the changes to the free-carrier concentration, we model the nanoplatelets as oblate spheroids and neglect the anisotropy of the material. This shape approximation was shown to provide a relatively good correspondence with the dominant hexagonal shape of the nanoplatelets for the polarisation of light parallel to the platelets.16 The approximation of materials as isotropic can be justified by the dominant contribution of εx, the in-plane component of the permittivity of nanoplatelets, to the LSP response of CuS nanodisks.16
In this approximation, the polarisability of the subwavelength spheroidal nanoparticle along the principal axis is given by39
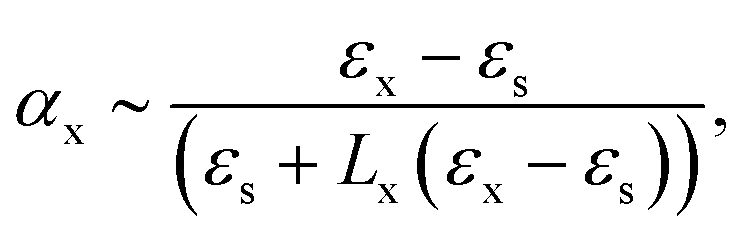 | (1) |
| n = AωLSP2 | (2) |
:Zn nanoparticles on the temperature of synthesis (Fig. 5).
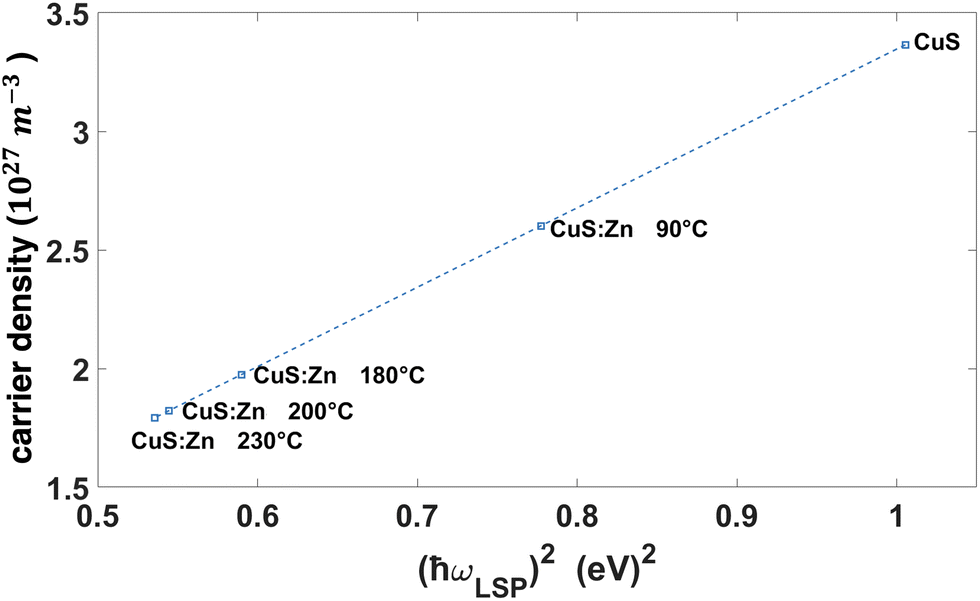 | ||
| Fig. 5 Hole density in CuS:Zn nanoparticles synthesised at different temperatures calculated from the observed LSP frequency using eqn (2). | ||
As can be seen from the observed LSP behaviour, the carrier density for CuS:Zn nanoparticles decreases almost 2 fold with the increasing temperature of synthesis, when more Zn substitutes Cu in the nanoparticles.
CuS![[thin space (1/6-em)]](https://www.rsc.org/images/entities/h3_char_2009.gif) :Zn thin nanoparticle films
:Zn thin nanoparticle films
Thin films of the doped CuS:Zn nanoparticles were fabricated using the method of chemical functionalization of a glass substrate.40 In brief, glass substrates were first thoroughly washed with DI water multiple times followed by ultrasonication in acetone and drying in nitrogen flow. The substrates were then immersed in a 30:70 ratio of H2O2:H2SO4 maintained at 50 °C for 30 min. They were ultrasonicated in DI water and dried in a nitrogen flow and this was repeated multiple times. The dried substrates were immediately immersed in 1 vol% solution of mercaptopropyl triMethoxy silane (MPTMS) in toluene and shaken for 12 hours. The substrates were taken out, ultrasonicated in toluene, dried under nitrogen flow and then immersed in the CuS:Zn nanoparticle solutions in chloroform and shaken for 24 hours. Finally, the substrates were washed in methanol and dried under nitrogen flow. The resulting thin films of nanoparticles has uniform coverage over large areas and a thickness of ∼6 nm as shown in the inset in Fig. 6(a).
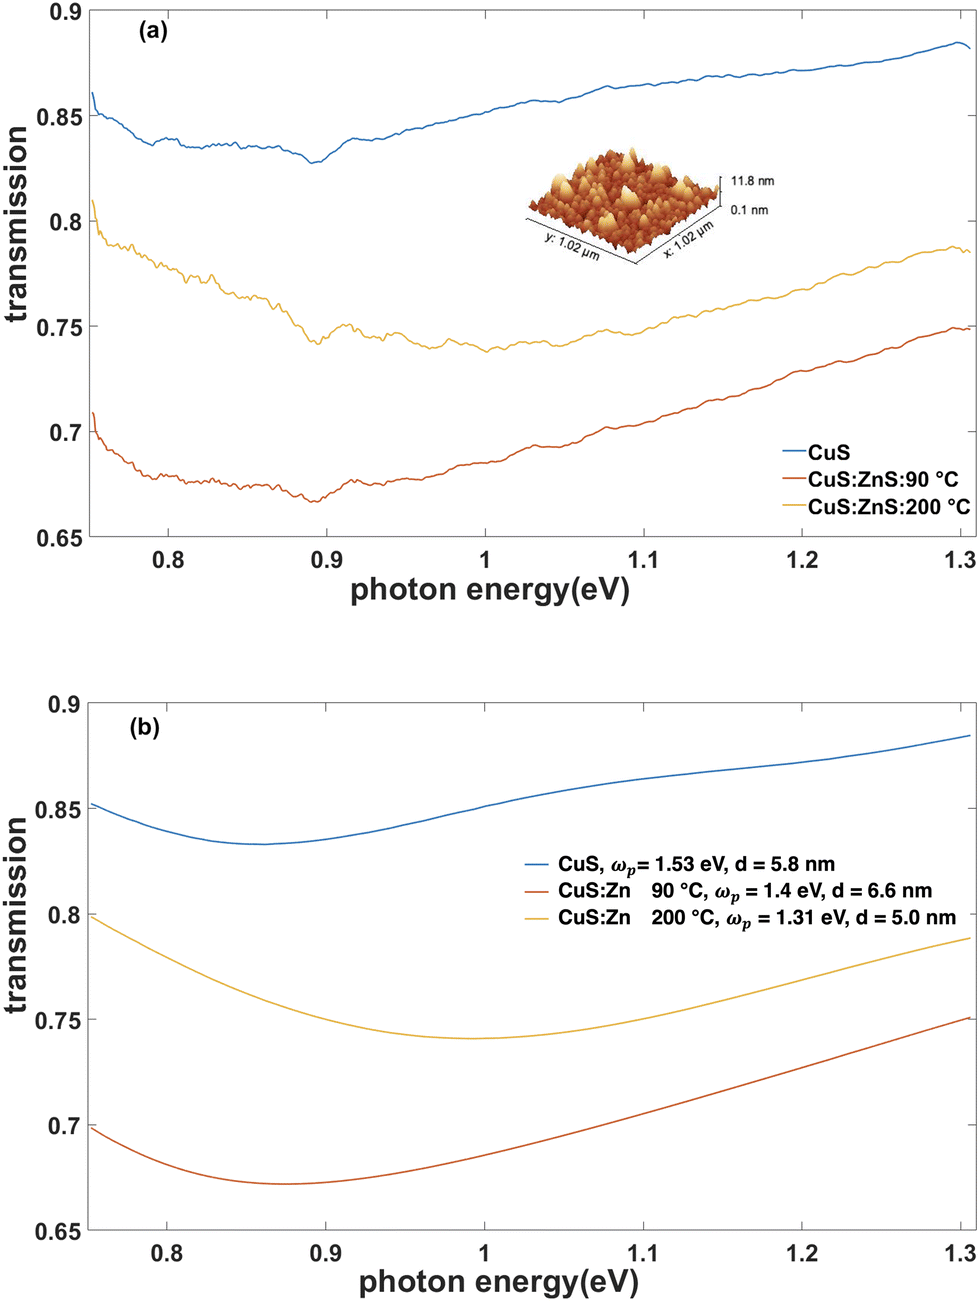 | ||
| Fig. 6 (a) Measured and (b) simulated transmission spectra at normal incidence of CuS:Zn nanoparticle films with different Zn concentrations. Inset in (a) shows the AFM height profile of a CuS:Zn nanofilm on a glass substrate. Experimental plasma frequencies and film thicknesses used in the simulations are shown in (b). | ||
The near-infrared transmission spectra of the films of the nanoparticles with different Zn concentration show similar spectral behaviour with the absolute transmission strongly dependent on the doping (Fig. 6). The transmission spectra can be approximated considering the thin films of the nanoparticles as an effective medium. Assuming that the nanocrystals in the films are oriented in the same way with the z-axis normal to the interface, so that the same εx component of the permittivity is responsible for the optical response at normal incidence, the transfer matrix model41 for a thin film on a thick glass substrate can be used to evaluate the transmission spectra. Large number of free parameters (up to 10) is required in order to account for both the Drude and Lorenz parts of the permittivity due to a complex band structure of the material, even if the thickness of the film is fixed and a plasma frequency is taken from Fig. 5. This prevents reliable quantitative fitting and determination of the effective parameters due to overparametrisation. Nevertheless, the transmission spectra obtained with this model indicate qualitative agreement with the experimental spectra, when using relative differences in the carrier concentration in eqn (2) for the Drude part of the effective permittivity.
Conclusions
We showed a wide range tuning of the LSPs of CuS nanoplatelets using Zn doping. By performing ion-exchange, we were able to control free-hole density in the nanoparticles resulting in a tuneable LSP. This was achieved in a single synthesis procedure where the ratio of Zn to Cu in the nanocrystals can be changed by adjusting the temperature of the reaction. The replacement of Cu by Zn resulted in the reduction of the hole density and, therefore, significant red shift of the plasma frequency of the material and localised surface plasmon resonances. We also fabricated thin monolayered films of these nanoparticles with optical properties consistent with the reduction of the plasma frequency during doping. The described approach is important for controlling both plasmonic properties and carrier relaxation rate in nanocrystals32 as both depend on the free-carrier concentration. The demonstrated tuning of the free-carrier concentration and the associated plasmonic properties of CuS nanocrystals is important for the development new plasmonic platforms with controllable optical properties required for numerous applications in both catalysis and nonlinear optics.Conflicts of interest
There are no conflicts to declare.Acknowledgements
This work was supported by the EPSRC (UK) grants EP/M013812/1, EP/V001914/1 and EP/W017075/1. All the data supporting finding of this work are presented in the Results section and are available from the corresponding author upon reasonable request.References
- M. L. Brongersma, N. J. Halas and P. Nordlander, Nat. Nanotechnol., 2015, 10, 25–34 CrossRef CAS PubMed.
- S. Linic, U. Aslam, C. Boerigter and M. Morabito, Nat. Mater., 2015, 14, 567–576 CrossRef CAS PubMed.
- M. Kauranen and A. V. Zayats, Nat. Photonics, 2012, 6, 737–748 CrossRef CAS.
- P. Wang, M. E. Nasir, A. V. Krasavin, W. Dickson, Y. Jiang and A. V. Zayats, Acc. Chem. Res., 2019, 52, 3018–3028 CrossRef CAS PubMed.
- C. Zong, C.-J. Chen, M. Zhang, D.-Y. Wu and B. Ren, J. Am. Chem. Soc., 2015, 137, 11768–11774 CrossRef CAS PubMed.
- X. Wang, S.-C. Huang, S. Hu, S. Yan and B. Ren, Nat. Rev. Phys., 2020, 2, 253–271 CrossRef.
- P. Wang, A. V. Krasavin, L. Liu, Y. Jiang, Z. Li, X. Guo, L. Tong and A. V. Zayats, Chem. Rev., 2022, 122, 15031–15081 CrossRef CAS PubMed.
- A. V. Zayats, I. I. Smolyaninov and A. A. Maradudin, Phys. Rep., 2005, 408, 131–314 CrossRef CAS.
- L. Chen, H. Hu, Y. Chen, J. Gao and G. Li, Mater. Adv., 2021, 2, 907–926 RSC.
- A. Boltasseva and H. A. Atwater, Science, 2011, 331, 290–291 CrossRef CAS PubMed.
- G. V. Naik, V. M. Shalaev and A. Boltasseva, Adv. Mater., 2013, 25, 3264–3294 CrossRef CAS PubMed.
- G. V. Naik, J. L. Schroeder, X. Ni, A. V. Kildishev, T. D. Sands and A. Boltasseva, Opt. Mater. Express, 2012, 2, 478–489 CrossRef CAS.
- I. Kriegel, F. Scotognella and L. Manna, Phys. Rep., 2017, 674, 1–52 CrossRef CAS.
- Z. Liu, Y. Zhong, I. Shafei, R. Borman, S. Jeong, J. Chen, Y. Losovyj, X. Gao, N. Li, Y. Du, E. Sarnello, T. Li, D. Su, W. Ma and X. Ye, Nat. Commun., 2019, 10, 1394 CrossRef PubMed.
- S. D. Lounis, E. L. Runnerstrom, A. Bergerud, D. Nordlund and D. J. Milliron, J. Am. Chem. Soc., 2014, 136, 7110–7116 CrossRef CAS PubMed.
- R. M. Córdova-Castro, M. Casavola, M. van Schilfgaarde, A. V. Krasavin, M. A. Green, D. Richards and A. V. Zayats, ACS Nano, 2019, 13, 6550–6560 CrossRef PubMed.
- M. A. Mahmoud and M. A. El-Sayed, J. Phys. Chem. Lett., 2013, 4, 1541–1545 CrossRef CAS PubMed.
- Q. Zhang, N. Li, J. Goebl, Z. Lu and Y. Yin, J. Am. Chem. Soc., 2011, 133, 18931–18939 CrossRef CAS PubMed.
- M. Rycenga, M. H. Kim, P. H. C. Camargo, C. Cobley, Z.-Y. Li and Y. Xia, J. Phys. Chem. A, 2009, 113, 3932–3939 CrossRef CAS PubMed.
- Y. Liu, M. Liu and M. T. Swihart, J. Phys. Chem. C, 2017, 121, 13435–13447 CrossRef CAS.
- Y. Xie, A. Riedinger, M. Prato, A. Casu, A. Genovese, P. Guardia, S. Sottini, C. Sangregorio, K. Miszta, S. Ghosh, T. Pellegrino and L. Manna, J. Am. Chem. Soc., 2013, 135, 17630–17637 CrossRef CAS PubMed.
- K. Asami, H. Nishi and T. Tatsuma, Nanoscale, 2016, 8, 14092–14096 RSC.
- I. Kriegel, F. Scotognella and L. Manna, Phys. Rep., 2017, 674, 1–52 CrossRef CAS.
- D. Dorfs, T. Härtling, K. Miszta, N. C. Bigall, M. R. Kim, A. Genovese, A. Falqui, M. Povia and L. Manna, J. Am. Chem. Soc., 2011, 133, 11175–11180 CrossRef CAS PubMed.
- G. Garcia, R. Buonsanti, E. L. Runnerstrom, R. J. Mendelsberg, A. Llordes, A. Anders, T. J. Richardson and D. J. Milliron, Nano Lett., 2011, 11, 4415–4420 CrossRef CAS PubMed.
- J. Ludwig, L. An, B. Pattengale, Q. Kong, X. Zhang, P. Xi and J. Huang, J. Phys. Chem. Lett., 2015, 6, 2671–2675 CrossRef CAS PubMed.
- T.-T. Zhuang, F.-J. Fan, M. Gong and S.-H. Yu, Chem. Commun., 2012, 48, 9762–9764 RSC.
- M. Wang, A. Tang, L. Peng, C. Yang and F. Teng, Chem. Commun., 2016, 52, 2039–2042 RSC.
- J. M. R. Tan, M. C. Scott, W. Hao, T. Baikie, C. T. Nelson, S. Pedireddy, R. Tao, X. Ling, S. Magdassi, T. White, S. Li, A. M. Minor, H. Zheng and L. H. Wong, Chem. Mater., 2017, 29, 9192–9199 CrossRef CAS.
- Q. A. Akkerman, A. Genovese, C. George, M. Prato, I. Moreels, A. Casu, S. Marras, A. Curcio, A. Scarpellini, T. Pellegrino, L. Manna and V. Lesnyak, ACS Nano, 2015, 9, 521–531 CrossRef CAS PubMed.
- G. Liu, S. Qi, J. Chen, Y. Lou, Y. Zhao and C. Burda, Nano Lett., 2021, 21, 2610–2617 CrossRef CAS PubMed.
- A. Y. Bykov, A. Shukla, M. van Schilfgaarde, M. A. Green and A. V. Zayats, Laser Photonics Rev., 2021, 15, 2000346 CrossRef CAS PubMed.
- Y. Xie, L. Carbone, C. Nobile, V. Grillo, S. D'Agostino, F. Della Sala, C. Giannini, D. Altamura, C. Oelsner, C. Kryschi and P. D. Cozzoli, ACS Nano, 2013, 7, 7352–7369 CrossRef CAS PubMed.
- A. Morales-García, A. L. Soares, E. C. Dos Santos, H. A. de Abreu and H. A. Duarte, J. Phys. Chem. A, 2014, 118, 5823–5831 CrossRef PubMed.
- C. T. Koch, Ph.D. thesis, Arizona State University, 2002.
- Y. Liu, M. Liu, D. Yin, L. Qiao, Z. Fu and M. T. Swihart, ACS Nano, 2018, 12, 7803–7811 CrossRef CAS PubMed.
- V. Lesnyak, R. Brescia, G. C. Messina and L. Manna, J. Am. Chem. Soc., 2015, 137, 9315–9323 CrossRef CAS PubMed.
- K. Hosomi, K. Ozaki, K. Takahiro, F. Nishiyama and S. Yokoyama, Jpn. J. Appl. Phys., 2019, 59, 015002 CrossRef.
- A. V. Zayats, Opt. Commun., 1999, 161, 156–162 CrossRef CAS.
- R. M. Pasternack, S. Rivillon Amy and Y. J. Chabal, Langmuir, 2008, 24, 12963–12971 CrossRef CAS PubMed.
- C. C. Katsidis and D. I. Siapkas, Appl. Opt., 2002, 41, 3978–3987 CrossRef PubMed.
| This journal is © The Royal Society of Chemistry 2023 |