Facile synthesis and size-dependent optical properties of luminescent ZnIn2S4 nanocrystals derived from metal xanthates†
Nisha
Kushwah
*a,
G.
Kedarnath
 *ab,
V.
Sudarsan
a and
A. P.
Srivastava
c
aChemistry Division, Bhabha Atomic Research Centre, Mumbai-400 085, India. E-mail: kedar@barc.gov.in; knisha@barc.gov.in
bHomi Bhabha National Institute, Anushaktinagar, Mumbai-400 094, India
cMaterials Science Division, Bhabha Atomic Research Centre, Mumbai-400 085, India
First published on 17th November 2022
Abstract
ZnIn2S4 (ZIS), a ternary semiconductor with photo-absorption in the visible region of the solar spectrum, is a promising active material for catalysis, optoelectronics and photoconductors and exists in various morphologies. Synthesis of phase-pure ZIS nanocrystals (NCs) devoid of any binary or biphasic impurities is highly necessary for device applications. The present investigation deals with facile synthesis of hexagonal phase ZIS spherical NCs by thermolysis of tris isopropylxanthate of indium and bis isopropylxanthate of zinc in oleylamine (OAm) at 280 °C for different durations (10, 15 and 20 min). The crystal structure, phase purity, elemental composition, morphology and band gap of the as-synthesized ZIS NCs were thoroughly evaluated by powder X-ray diffraction (pXRD), Raman, energy dispersive X-ray spectroscopy (EDS), electron microscopy tools and diffuse reflectance spectroscopy (DRS), respectively. The size-dependent optical band gap and emission maximum were tuned in the range of 3.18 to 2.40 eV and 440 to 528 nm by adjusting the reaction time from 10 to 20 minutes. Size-dependent quantum yields (QYs) in the range of 7–11% have been achieved for these NCs. Lifetime measurements performed on these samples show lifetimes in the range of 1.3–1.5 ns for the fast-decaying component and 5.7–7.3 ns for the slow decaying component.
Introduction
Snowballing environmental alarms have led to an avid quest for environmentally benign materials for all technological applications such as optoelectronics,1 photovoltaics,2 thermoelectrics,3 and bio-imaging.4 With this objective, the family of II–III2–VI4 ternary semiconductors such as ZnIn2S4 (ZIS) has been established as an important category of materials owing to their distinct physicochemical properties and better photo-corrosion resistance compared to their binary counterparts. These properties, accompanied by a direct band gap2 of 2.1–2.5 eV, led to their potential applications not only in optoelectronics but also in photocatalysis, charge storage, electrochemical recording and thermoelectricity.5–7 ZIS is anticipated as a substitute to conventional II–VI materials such as CdS8 and CdSe-seeded CdS,9–11etc. as despite their interesting properties and high quantum yields, their applications are limited to an extent due to the toxic nature of cadmium and selenium. Moreover, ternary materials such as ZIS have discrete benefits over binary semiconductors as they have multiple degrees of freedom for tailoring their properties. For instance, their optoelectronic properties can be handily tuned either by tailoring size or shape, or by varying the ratio of constituent elements over a wide range.ZIS is a layered-structure semiconductor that exists in three crystal polymorphs, namely cubic, hexagonal and rhombohedral lattices. The hexagonal phase is thermodynamically more stable than the cubic phase and the ions are arranged in S–Zn–S–In–S–In–S septuple layers, where all the Zn2+ and half of the In3+ ions are tetrahedrally coordinated by sulfur atoms, and the other half of the In3+ ions are octahedrally coordinated.12 In contrast, in cubic ZIS, Zn2+ ions are tetrahedrally coordinated by S2− ions and In3+ ions are octahedrally coordinated. These phases are interconvertible at different conditions of temperature and pressure.13 Furthermore, the phase of ZIS governs the properties and the applications of ZIS. For example, for the photodegradation of rhodamine B, hexagonal ZIS shows high photoactivity, whereas for methyl orange the photoactivity is relatively low. In contrast, cubic ZIS behaves in exactly the opposite way.14 The cubic form of ZIS finds application as a thermoelectric material,15 whereas hexagonal ZIS exhibits the properties of photoconductivity and photoluminescence.16,17
To date, a number of synthetic routes such as spray pyrolysis,18 spin coating,19 hydrothermal,20,21 solvothermal,12,22 ultrasonic,23 chemical vapour deposition and microwave assisted24 methods are available for the synthesis of ZIS materials which govern the material’s morphology and its application. Various morphologies of ZIS such as quantum dots,4 nanoparticles,25 nanotubes,26 nanoribbons,27 nanowires,28 microspheres29 and micropeonies30 have been synthesised and found application in various fields. The morphology of ZIS plays a significant role for determining its application. ZIS nanosheets have been tested as light-harvesting components of a photoelectrochemical system and showed a promising light-to-current conversion efficiency.31 Whereas, ZIS nanotubes and nanowires were found to have highly efficient photocatalytic activity to degrade organic pollutants in aqueous solutions.13 However, synthesis of luminescent ZIS NCs is scanty. Although tunable luminescent ZIS NCs with different amounts of Zn incorporation have been reported,32 size-dependent luminescent ZIS NCs have not been investigated to the best of our knowledge.
Furthermore, the scalability and applicability of the above synthetic protocols are restricted by the use of either sensitive/toxic chemicals or the use of multiple metal salts and sulfur sources leading to the addition of binary sulfide impurities. In addition, the optical properties of ternary semiconductors are strongly influenced by their crystallinity, structural defects and chemical purity. Therefore, it is essential to have a facile, easily controllable and scalable synthesis strategy to produce luminescent ZIS nanostructures.
One such method to synthesize phase pure multinary metal sulfides employing metal xanthates and thiocarbamates has been explored and established by Lewis33–35 and Revaprasadu’s group.36–38 These metal xanthates being single source molecular precursors (SSMPs) have advantages over the normal metal salt precursors for the synthesis of ternary ZIS NCs. The existence of preformed M–S bonds in SSMPs can assist the formation of a single-phase ternary compound, thereby avoiding the formation of various secondary phases including binary metal sulfides which otherwise are formed when normal metal salt precursors are used as starting materials. Recently, our group successfully isolated Cu2GeS3 NCs by utilizing metal xanthates.39 However, metal xanthates have not been employed for the preparation of luminescent ZIS NCs. Encouraged by these results and having a cognizance of the versatility and merits of metal xanthates, luminescent ZIS NCs were synthesized by simultaneous thermolysis of [In(S2COPri)3] and [Zn(S2COPri)2] in OAm at 280 °C. Additionally, size-dependent optical property tunability of ZIS NCs with QYs in the range of 7–11% has been achieved. The application of these molecular precursors presents a simple way to access environmentally friendly ZIS NCs with optoelectronic potentiality.
Experimental
Materials and methods
ZnSO4·7H2O (95%), InCl3 (98%) and oleylamine (OAm) were obtained from commercial sources and used without further purification. Potassium salts of isopropyl xanthates were prepared using reported methods.40 Solvents (methanol, toluene and OAm) used in the experiments were dried and distilled prior to use under a nitrogen atmosphere. Methanol was dried by refluxing it over activated magnesium–iodine for ∼2 hours and then distilled under nitrogen. The dried methanol was stored over 3 Å molecular sieves overnight prior to use. Toluene was dried by refluxing over sodium with benzophenone as indicator followed by distillation. The distilled toluene was stored over 3 Å molecular sieves overnight prior to use. Oleylamine was heated at 110 °C under a nitrogen atmosphere for 30 min prior to use. All the reactions were carried out under a nitrogen atmosphere.Characterization techniques
Elemental analyses were carried out on a Thermo Fischer Flash EA1112 CHNS elemental analyzer. The 1H and 13C{1H} NMR spectra were recorded on a Bruker Avance-II spectrometer operating at 300 and 75.47 MHz, respectively. Chemical shifts are relative to internal chloroform peaks for 1H and 13C{1H} NMR spectra. X-ray powder diffraction patterns were obtained on a Philips PW-1820 powder diffractometer using CuKα radiation. Average crystallite size was calculated from the diffraction line width based on the Scherrer relation, D = 0.9λ/β![[thin space (1/6-em)]](https://www.rsc.org/images/entities/char_2009.gif) cos
cos![[thin space (1/6-em)]](https://www.rsc.org/images/entities/char_2009.gif) θ, where D is the average particle size, λ is the wavelength of X-rays and β is the full width at half maximum (FWHM).
θ, where D is the average particle size, λ is the wavelength of X-rays and β is the full width at half maximum (FWHM).
SEM and EDS measurements were carried out on a Zeiss Gemini Sigma 500. A Zeiss Libra 200 FE transmission electron microscope (TEM) operating at an accelerating voltage of 200 kV was used for the TEM studies. The samples for TEM were prepared by placing a drop of sample dispersed in chloroform on a carbon-coated copper grid.
Optical diffuse reflectance measurements in the range 200–1800 nm (0.68 to 6.2 eV) were performed on a JASCO V-670 two-beam spectrometer with a diffuse reflectance (DR) attachment consisting of an integration sphere coated with barium sulfate which was used as a reference material. Measured reflectance data were converted to absorption (A) using the Kubelka–Munk remission function.41 The band gaps of the samples were estimated by extrapolating the linear portion of the plot to the X (energy) axis.
All luminescence measurements were carried out at room temperature using an Edinburgh Instruments FLSP 920 system, with a 450 W Xe lamp and 60 W microsecond flash lamp. QYs were measured using an integrating sphere coated with BaSO4. All emission spectra were corrected for the detector response and excitation spectra for the lamp profile. Emission measurements were carried out with a resolution of 5 nm.
Time-resolved emission measurements: time-resolved fluorescence measurements were carried out using a time-correlated-single-photon-counting (TCSPC) setup (IBH, UK). In the present work, a 451 nm diode laser (∼100 ps, 1 MHz repetition rate) was used as the excitation source and a TBX-4 detector was used for fluorescence detection. A re-convolution procedure was used to analyze the observed decays using a suitable instrument response function obtained by substituting the sample cell with a light scatterer (suspension of TiO2 in water). With the present setup, the instrument time resolution was adjudged to be better than 50 ps. The fluorescence decays were analyzed as a sum of exponentials where, I(t) is the time-dependent fluorescence intensity and Bi and τi are the pre-exponential factor and the fluorescence lifetime for the ith component of the fluorescence decay. The quality of the fits and consequently the mono or bi-exponential nature of the decays was judged by the reduced chi-squared (χ2) values and the distribution of the weighted residuals among the data channels. For an acceptable fit, the χ2 value was close to unity and the weighted residuals were distributed randomly among the data channels.
Synthesis of precursors
The precursors were synthesised according to the method reported in the literature.40Synthesis of [Zn(S2COPri)2] (1)
To an aqueous solution of ZnSO4·7H2O (1.00 g, 3.47 mmol), KS2COPri (1.2 g, 6.88 mmol) in water was added and stirred for 30 min. The reaction contents were then filtered and dried to obtain a white coloured product, which was recrystallised using benzene/hexane to obtain a white solid. Yield: 1.0 g, 86.0%. Anal. calcd for C8H12O2S4Zn, C, 28.6; H, 4.20; S, 38.19%. Found: C, 28.3; H, 3.9; S, 39.7%. 1H NMR (CDCl3) δ: 1.48 (OCHMe2), 5.12 (s, br, CH); 13C{1H} NMR (CDCl3) δ: 21.4 (OCHMe2), 85.6 (OCH), 228.6 (CS2).Synthesis of [In(S2COPri)3] (2)
To an aqueous solution of InCl3 (1.15 g, 5.2 mmol), KS2COPri (2.74 g, 15.72 mmol) solution in water was added slowly and stirred for 60 min. The whole reaction mixture was filtered and dried to obtain a white solid, which was then recrystallized in benzene–hexane to obtain yellowish white crystals. Yield 2.5 g, 92.0%. Anal. calcd for C12H21O3S6In, C, 27.7; H, 4.1; S, 37.0. Found: C, 28.0; H, 4.5; S, 37.2%. 1H NMR (CDCl3) δ: 1.25 (OCHMe2), 5.28 (s, br, CH); 13C{1H} NMR (CDCl3) δ: 21.5 (OCHMe2), 78.1 (OCH), 225.1 (CS2).Preparation of ZIS by the heat-up method
In a typical experiment, [In(S2COPri)3] (1) (200 mg, 0.38 mmol) and [Zn(S2COPri)2] (2) (128 mg, 0.38 mmol) were taken together in a three necked flask containing OAm (10.0 mL) and heated up to 280 °C with vigorous stirring under argon. Aliquots were collected at intervals of 10, 15 and 20 minutes after reaching 280 °C, in vials each containing 2 mL of toluene. From this point onwards these aliquots were labelled as ZIS10, ZIS15 and ZIS20, respectively. To these aliquots, excess methanol was added and centrifuged to give light yellow nanocrystals.Results and discussion
Synthesis and characterization of ZIS nanostructures
The metal xanthates, [Zn(S2COPri)2] (1) and [In(S2COPri)3] (2) were synthesised by a metathesis reaction using the xanthate ligand (KS2COPri) in water with the respective metal salt, and purified by recrystallization in a benzene/hexane mixture (eqn (R1) and (R2)). The metal xanthates were characterized by elemental analysis and by NMR (1H and 13C{1H}) spectroscopy.| ZnSO4·7H2O + 2KS2COPri → [Zn(S2COPri)2] + K2SO4 | (R1) |
| InCl3 + 3KS2COPri → [In(S2COPri)3] + 3KCl | (R2) |
With this objective, ZIS nanocrystals have been synthesized by thermolysis of [Zn(S2COPri)2] (1) and [In(S2COPri)3] (2) in OAm at 280 °C. The selection of OAm as a passivating agent is based on its suitable boiling point (360 °C) required for thermolyzing the complexes to obtain nanocrystals of targeted size and composition. Furthermore, OAm catalyses the thermal degradation of both complexes at a relatively lower temperature compared to their decomposition temperature in the absence of OAm.45 In addition, the nitrogen of the amino group has good affinity for both indium and zinc which can facilitate the passivation of nanocrystals. In a typical synthesis, a 1![[thin space (1/6-em)]](https://www.rsc.org/images/entities/char_2009.gif) :
:![[thin space (1/6-em)]](https://www.rsc.org/images/entities/char_2009.gif) 1 molar mixture of both the complexes was taken together in a three necked flask containing OAm under an argon atmosphere and heated slowly. The turbid reaction mixture turns into a clear solution at around 150 °C which subsequently becomes yellow at 250 °C. The heating was continued up to 280 °C. The nanocrystals of different sizes were isolated at intervals of 10, 15 and 20 minutes from the start of the reaction in order to evaluate the tunability of their optical properties. In the present investigation, experiments were carried out at a single temperature to understand the effect of single source precursor and growth time on the structural and optical properties of the material. Many xanthates in general have relatively high decomposition temperatures. Therefore, the high alloying temperature of ZnS and In2S3 to form ZnIn2S4, prompted us to select a high reaction temperature of around 280 °C.
1 molar mixture of both the complexes was taken together in a three necked flask containing OAm under an argon atmosphere and heated slowly. The turbid reaction mixture turns into a clear solution at around 150 °C which subsequently becomes yellow at 250 °C. The heating was continued up to 280 °C. The nanocrystals of different sizes were isolated at intervals of 10, 15 and 20 minutes from the start of the reaction in order to evaluate the tunability of their optical properties. In the present investigation, experiments were carried out at a single temperature to understand the effect of single source precursor and growth time on the structural and optical properties of the material. Many xanthates in general have relatively high decomposition temperatures. Therefore, the high alloying temperature of ZnS and In2S3 to form ZnIn2S4, prompted us to select a high reaction temperature of around 280 °C.
Characterization of ZIS nanocrystals
The phase purity and crystal structure of ZIS NCs were investigated by the pXRD technique. The pXRD patterns of all ZIS NC samples show Bragg's peaks at 2θ = 21.60, 27.7, 28.89, 30.45, 47.25 and 55.61° corresponding to the reflections originating from (006), (102), (103), (104), (110) and (202) confirming the hexagonal phase of ZIS (ICSD No. 016200 and JCPDF 72-0773) (Fig. 1). The presence of broad peaks in pXRD indicates the nano-dimensional nature of the particles. The particle sizes of the nanostructures were estimated using the Scherrer equation. The results of the pXRD were corroborated by the elemental composition of pristine ZIS NCs by EDS analysis, listed in Table 1, which confirms a nearly 1![[thin space (1/6-em)]](https://www.rsc.org/images/entities/char_2009.gif) :
:![[thin space (1/6-em)]](https://www.rsc.org/images/entities/char_2009.gif) 2
2![[thin space (1/6-em)]](https://www.rsc.org/images/entities/char_2009.gif) :
:![[thin space (1/6-em)]](https://www.rsc.org/images/entities/char_2009.gif) 4 atomic percentage ratio of Zn
4 atomic percentage ratio of Zn![[thin space (1/6-em)]](https://www.rsc.org/images/entities/char_2009.gif) :
:![[thin space (1/6-em)]](https://www.rsc.org/images/entities/char_2009.gif) In
In![[thin space (1/6-em)]](https://www.rsc.org/images/entities/char_2009.gif) :
:![[thin space (1/6-em)]](https://www.rsc.org/images/entities/char_2009.gif) S (Fig. S2–S4, ESI†) matching the stoichiometry of ZIS. The average crystallite sizes of all the nanostructures isolated at 10, 15 and 20 minutes, estimated by the Scherrer equation, were found to be 2.5, 4.8 and 7.9 nm, respectively. The sizes of ZIS nanocrystals isolated at different durations of the reaction vary for a fixed reaction temperature.
S (Fig. S2–S4, ESI†) matching the stoichiometry of ZIS. The average crystallite sizes of all the nanostructures isolated at 10, 15 and 20 minutes, estimated by the Scherrer equation, were found to be 2.5, 4.8 and 7.9 nm, respectively. The sizes of ZIS nanocrystals isolated at different durations of the reaction vary for a fixed reaction temperature.
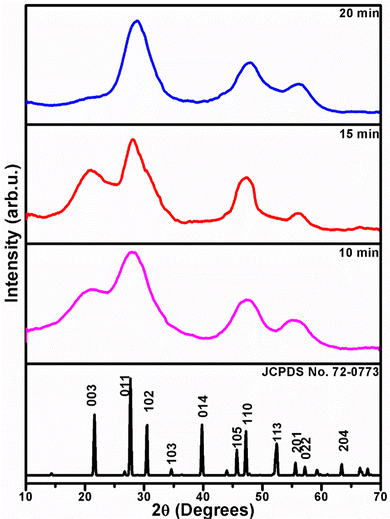 | ||
| Fig. 1 XRD patterns of ZIS NCs isolated at 10, 15 and 20 minutes of thermolysis of [Zn(S2COPri)2] (1) and [In(S2COPri)3] (2) overlaid on the standard hexagonal ZIS XRD pattern (JCPDS 72-0773). | ||
| Time intervals at which aliquots were collected (min) | Average crystallite sizea (nm) | Particle size by TEM (nm) | EDS analysesb |
|---|---|---|---|
| a Average crystallite size calculated from pXRD using the Scherrer equation. b EDS analyses in atom % ratio of the constituent elements. | |||
| 10 | 2.5 | 2.9 | 14.3![[thin space (1/6-em)]](https://www.rsc.org/images/entities/char_2009.gif) : :![[thin space (1/6-em)]](https://www.rsc.org/images/entities/char_2009.gif) 25.6 25.6![[thin space (1/6-em)]](https://www.rsc.org/images/entities/char_2009.gif) : :![[thin space (1/6-em)]](https://www.rsc.org/images/entities/char_2009.gif) 60.1 (1 60.1 (1![[thin space (1/6-em)]](https://www.rsc.org/images/entities/char_2009.gif) : :![[thin space (1/6-em)]](https://www.rsc.org/images/entities/char_2009.gif) 1.8 1.8![[thin space (1/6-em)]](https://www.rsc.org/images/entities/char_2009.gif) : :![[thin space (1/6-em)]](https://www.rsc.org/images/entities/char_2009.gif) 4.20) 4.20) |
| 15 | 4.8 | 5.2 | 13.8![[thin space (1/6-em)]](https://www.rsc.org/images/entities/char_2009.gif) : :![[thin space (1/6-em)]](https://www.rsc.org/images/entities/char_2009.gif) 29.1 29.1![[thin space (1/6-em)]](https://www.rsc.org/images/entities/char_2009.gif) : :![[thin space (1/6-em)]](https://www.rsc.org/images/entities/char_2009.gif) 57.1 (1 57.1 (1![[thin space (1/6-em)]](https://www.rsc.org/images/entities/char_2009.gif) : :![[thin space (1/6-em)]](https://www.rsc.org/images/entities/char_2009.gif) 2.1 2.1![[thin space (1/6-em)]](https://www.rsc.org/images/entities/char_2009.gif) : :![[thin space (1/6-em)]](https://www.rsc.org/images/entities/char_2009.gif) 4.1) 4.1) |
| 20 | 7.89 | 8.5 | 15.5![[thin space (1/6-em)]](https://www.rsc.org/images/entities/char_2009.gif) : :![[thin space (1/6-em)]](https://www.rsc.org/images/entities/char_2009.gif) 28.9 28.9![[thin space (1/6-em)]](https://www.rsc.org/images/entities/char_2009.gif) : :![[thin space (1/6-em)]](https://www.rsc.org/images/entities/char_2009.gif) 55.6 (1 55.6 (1![[thin space (1/6-em)]](https://www.rsc.org/images/entities/char_2009.gif) : :![[thin space (1/6-em)]](https://www.rsc.org/images/entities/char_2009.gif) 1.86 1.86![[thin space (1/6-em)]](https://www.rsc.org/images/entities/char_2009.gif) : :![[thin space (1/6-em)]](https://www.rsc.org/images/entities/char_2009.gif) 3.60) 3.60) |
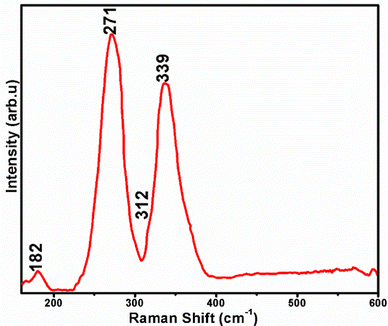
The phase purity of ZIS NCs was further assessed by Raman spectroscopy due to the difficulty in identifying binary phase impurities present in ternary materials by pXRD alone. Furthermore, Raman spectroscopy gives direct information about the phonon modes of nanocrystalline materials. The Raman spectrum of a typical sample shown in Fig. 2 displays peaks at 182 (Eg), 271 (F1u (LO1)), and 339 (F1u (LO2)) cm−1, and a shoulder peak at 312 (F1u (TO2)) cm−1.46 The bands appearing at 271 cm−1 may be assigned to (Zn/In)–St in tetrahedral sites.47 The Raman phonon modes seen at 271, 312, and 339 cm−1 may be assigned to F1u symmetry and are Raman forbidden, however, the assignment was justified by Unger et al. by considering the modes as Fröhlich electron–phonon interaction and deformation potential scattering.48 The homogeneous distribution of the constituent elements within the nanocrystals was further corroborated by 2-D elemental mapping (Fig. S5, ESI†).
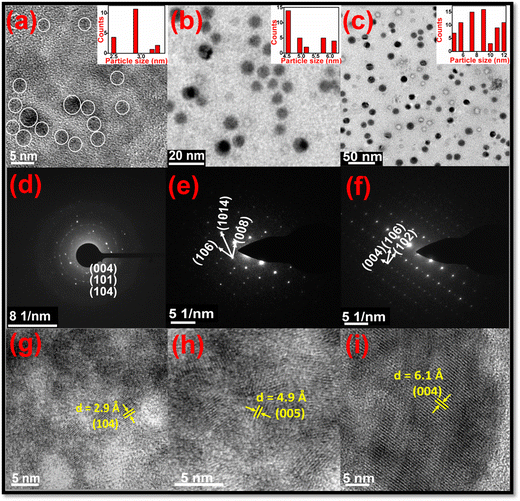
All the isolated ZIS NCs were characterized by TEM, SAED and HRTEM (Fig. 3) to elucidate the shape, size and phase of the nanocrystals. TEM images revealed that ZIS NCs were spherical in shape with sizes of 2.5, 5.2 and 8.5 nm, respectively for 10, 15 and 20 minutes. Histograms depicting the particle distributions of the same are shown in the insets of Fig. 3a–c. The SAED image of NCs isolated at 10 min (Fig. 3d) exhibits concentric circles corresponding to (004), (101), and (104) planes of the hexagonal phase of ZIS (ICSD No. 016200 and JCPDS-72-0773) and a circular pattern pointing to their polycrystalline nature. Similarly, SAED patterns of ZIS NCs collected at 15 (Fig. 3e) and 20 minutes (Fig. 3f) revealed a set of planes (106), (008) and (1014), and (004), (102) and (106) matching with the same phase of ZIS. The dot-like pattern signifies the single crystalline nature. Furthermore, HRTEM images of ZIS NCs isolated at 10 (Fig. 3g), 15 (Fig. 3h) and 20 (Fig. 3i) min, displaying lattice fringes with d spacings of 2.9, 4.9 and 6.1 Å, respectively corresponding to (104), (005), and (004) planes confirm the hexagonal phase of ZIS (ICSD No. 016200 and JCPDS-72-0773).
The formation of spherical NCs of different sizes with an increase in the reaction time for a fixed temperature may be explained as follows. The formation of any NCs involves nucleation and growth steps. A number of factors control the nucleation and growth process of the nanocrystals. Temperature is one such factor which can thermodynamically and kinetically control these processes, leading to different sizes and shapes of the NCs.2,49 However, at a relatively high reaction temperature as in the present investigation (280 °C), the product NC formation is thermodynamically controlled. Furthermore, both surface diffusion and precursor desorption are expected at such a high temperature. Therefore, nuclei grow isotropically resulting in the formation of symmetrical structures like spheres in order to minimize the surface energy of NCs for a given nanocrystal volume.2 Additionally, when the reaction temperature is fixed and the reaction time is increased from 10 to 20 minutes, the amount of precursor depletes steadily and the average NC size continues to increase through Ostwald ripening.
Surface properties of the nanostructures
The surface characterization of ZIS nanostructures was evaluated by employing FT-IR spectroscopy (Fig. S6, ESI†). FT-IR spectra of ZIS nanostructures exhibited different characteristic IR modes corresponding to νN–H (symmetric 3286 cm−1) stretches, νCH2 (asymmetric 2928 cm−1 and symmetric 2856 cm−1) stretches, and the δN–H bending mode (1531–1539 cm−1), indicating the presence of alkyl amines. The broad νN–H stretches observed in the ZIS samples are typical for OLA-capped nanostructures. The shift of νN–H and δN–H bands to lower wave numbers compared to those of free OLA (νN–H = 3373 cm−1 and δN–H = 1561 cm−1)50 signifies surface bound –NH2 in ZIS nanostructures.Optical properties of ZIS nanocrystals
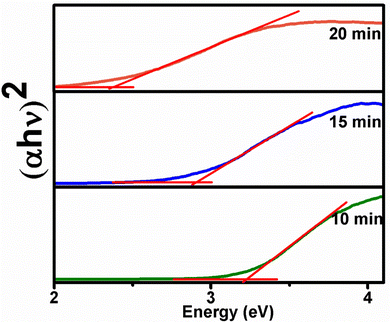
ZIS has an optical band gap in the range 2.35–3.25 eV, which makes it efficient for absorption in the visible range.51–53 In particular, the hexagonal phase of ZIS is photoluminescent and photoconductive. In view of this, both optical band gap measurements and photoluminescent properties of the samples ZIS10, ZIS15 and ZIS20 were examined. The optical band gaps of these nanostructures were determined using the Kubelka–Munk function, F(R) as given in eqn (1).| F(R) = A(hν − Eg)n/2 | (1) |
The optical direct band gap values of ZIS nanocrystals isolated at 10, 15 and 20 minutes were found to be 3.18, 2.92 and 2.40 eV, respectively (Fig. 4), which are close to the reported values.2 These values indicate a red shift in band gap with an increase in the reaction time and hence particle size. A similar trend was observed when the band gap was calculated from emission maxima of PL emission spectra measured in solution (toluene). The emission spectra are usually solvent dependent and shifts are due to changes in solvent polarity and solvent relaxation, hence a lower value of band gap was observed here (reaction time (Eg): 10 min (2.81 eV), 15 min (2.57 eV) and 20 min (2.35 eV)). Although the exciton Bohr radius of ZIS has not yet been reported in the literature, the considerable blue shift of the band gap values for ZIS10 and ZIS15 relative to the bulk band gap may have resulted from the quantum confinement effect.
The photoluminescence studies of ZIS NC aliquots (ZIS10, ZIS15 and ZIS20) show that the emission properties were tunable in the range of 440 to 528 nm. The emission spectra of ZIS NCs (Fig. 5) isolated at 10, 15 and 20 minutes exhibit broad emission peaks with maxima at 440, 483 and 528 nm, respectively, for an excitation wavelength of 345, 374 and 416 nm. The gradual shift in emission maxima from 440 to 528 nm is due to the increase in ZIS NC particle size. Large differences in Eg values estimated from DRS and photoluminescence studies (Table 2) suggest that multiple excitonic levels do exist near the band edges in these samples.
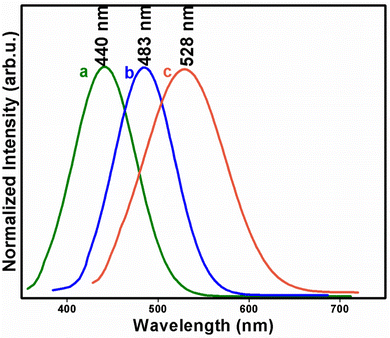 | ||
| Fig. 5 Photoluminescence emission spectra of ZIS NCs isolated at (a) 10, (b) 15 and (c) 20 minutes of thermolysis of [Zn(S2COPri)2] (1) and [In(S2COPri)3] (2) in OAm at 280 °C. | ||
| Time intervals at which aliquots were collected (min) | Excitation maximum (nm) | Emission maximum (nm) | FWHM of emission peaks | E g(direct) from emission maximum (in eV) | E g(direct) from DRS (in eV) | QY (%) |
|---|---|---|---|---|---|---|
| 10 | 345 | 440 | 80.45 | 2.81 | 3.18 | 11 |
| 15 | 374 | 483 | 77.7 | 2.57 | 2.92 | 9 |
| 20 | 416 | 528 | 104 | 2.35 | 2.40 | 7 |
The quantum yields (QYs) of these ZIS NCs were 11, 9 and 7%, respectively (Table 2). With the increase in particle size, the probability of electrons and holes in the particle meeting decreases and this leads to a reduced extent of electron–hole recombination and subsequent decrease in the quantum yield values. Based on the theory of excitons,54 the oscillator strength (fex) of the exciton (electron–hole) recombination is given by the following expression (eqn (2))
 | (2) |
It may be noted that the QY values reported in the present study are better than those reported for Zn3In2S6 quantum dots.4 Furthermore, the relative concentration of carriers on the particle's surface increases with a decrease in particle size. As measured lifetime is inversely proportional to the sum of the radiative and non-radiative recombination probabilities (Arad + Anrad), lifetime is expected to decrease with a decrease in particle size. Indeed, it is observed in the present study that the lifetime of ZIS NCs decreases with a decrease in particle size and this aspect is discussed in the following section.
Time resolved transient photoluminescence (TRPL)
Decay curves corresponding to emission from ZIS NCs were monitored by time-resolved transient photoluminescence (TRPL) decay spectroscopy. Fig. 6 presents the PL profiles which can be well-fitted with the bi-exponential function as in eqn (3).55| I(t) = A1·exp(−t/τ1) + A2·exp(−t/τ2) | (3) |
 | (4) |
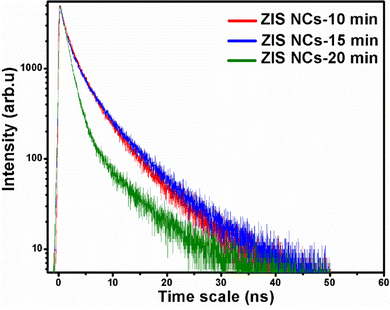 | ||
| Fig. 6 TRPL decay spectra of ZIS NCs isolated at 10, 15 and 20 minutes of thermolysis of [Zn(S2COPri)2] (1) and [In(S2COPri)3] (2) in OAm at 280 °C. | ||
| Sample | Particle size | Exi 440 nm; Ems = 510 nm | ||||
|---|---|---|---|---|---|---|
| τ 1 (ns) | A 1 (%) | τ 2 (ns) | A 2 (%) | τ A (ns) | ||
| ZIS10 | 1.47 | 46.31 | 5.73 | 53.69 | 4.958141 | |
| ZIS15 | 1.36 | 40.88 | 6.23 | 59.12 | 5.591295 | |
| ZIS20 | 1.30 | 80.47 | 7.31 | 19.53 | 4.768469 | |
Conclusions
A simple route for the synthesis of phase-pure ZIS NCs by co-thermolysis of zinc and indium xanthates is presented in this investigation. Additionally, size tunable PL emission and optical band gap properties of ZIS NCs are presented in this investigation. The PL emission properties of 2.9–8.5 nm ZIS NCs revealed that they are tunable in the range of 440 to 528 nm. These NCs also exhibit size-dependent QYs in the range of 7–11%. In short, thermolysis of metal xanthates is an effective, facile and promising way to produce luminescent ternary nanomaterials with size-dependent optical properties in scalable amounts for optoelectronic applications.Conflicts of interest
The authors declare no conflicts of interest.Acknowledgements
We thank Dr A. K. Tyagi, Director, Chemistry Group, Bhabha Atomic Research Centre for the encouragement of this work and Dr Bal Govind Vats for recording pXRD data.References
- Q. Ye, J. Lu, Z. Zheng, W. Huang, J. Yao and G. Yang, Adv. Opt. Mater., 2022, 10, 2102335 CrossRef CAS.
- S. Peng, L. Li, Y. Wu, L. Jia, L. Tian, M. Srinivasan, S. Ramakrishna, Q. Yan and S. G. Mhaisalkar, CrystEngComm, 2013, 15, 1922 RSC.
- M. A. Mohebpour, B. Mortazavi, T. Rabczuk, X. Zhuang, A. V. Shapeev and M. B. Tagani, Phys. Rev. B, 2022, 105, 134108 CrossRef CAS.
- J. Song, C. Ma, W. Zhang, S. Yang, S. Wang, L. Lv, L. Zhu, R. Xia and X. Xu, J. Mater. Chem. B, 2016, 4, 7909 RSC.
- Z. Chen, D. Li, W. Zhang, Y. Shao, T. Chen, M. Sun and X. Fu, J. Phys. Chem. C, 2009, 113, 4433 CrossRef CAS.
- L. Shi, P. Yin and Y. Dai, Langmuir, 2013, 29, 12818 CrossRef CAS.
- X. Gou, F. Cheng, Y. Shi, L. Zhang, S. Peng, J. Chen and P. Shen, J. Am. Chem. Soc., 2006, 128, 7222 CrossRef CAS.
- N. Mishra, W. Y. Wu, B. M. Srinivasan, R. Hariharaputran, Y. W. Zhang and Y. Chan, Chem. Mater., 2016, 28, 1187 CrossRef CAS.
- N. Mishra, N. J. Orfield, F. Wang, Z. Hu, S. Krishnamurthy, A. V. Malko, J. L. Casson, H. Htoon, M. Sykora and J. A. Hollingsworth, Nat. Commun., 2017, 8, 15083 CrossRef CAS PubMed.
- Y. Xu, J. Lian, N. Mishra and Y. Chan, Small, 2013, 9, 1908 CrossRef CAS.
- N. Mishra, V. G. V. Dutt and M. P. Arciniegas, Chem. Mater., 2019, 31, 9216 CrossRef CAS.
- J. Lee, H. Kim, T. Lee, W. Jang, K. H. Lee and A. Soon, Chem. Mater., 2019, 31, 9148 CrossRef CAS.
- J. Wang, S. Sun, R. Zhou, Y. Li, Z. He, H. Ding, D. Chen and W. Ao, J. Mater. Sci. Technol., 2021, 78, 1 CrossRef CAS.
- Y. Chen, R. Huang, D. Chen, Y. Wang, W. Liu, X. Li and Z. Li, ACS Appl. Mater. Interfaces, 2012, 4, 2273 CrossRef CAS PubMed.
- M. A. Sriram, P. H. Mcmichael, A. Waghray, P. N. Kumta, S. Misture and X. L. Wang, J. Mater. Sci., 1998, 33, 4333 CrossRef CAS.
- S. Mora, C. Paorici and N. Romeo, J. Appl. Phys., 1971, 42, 2061 CrossRef CAS.
- N. Romeo, A. Dallaturca, R. Braglia and G. Sberveglieri, Appl. Phys. Lett., 1973, 22, 21 CrossRef CAS.
- M. Li, J. Su and L. Guo, Int. J. Hydrogen Energy, 2008, 33, 2891 CrossRef CAS.
- Y. Xie, Y. Liu, H. Cui, W. Zhao, C. Yang and F. Huang, J. Power Sources, 2014, 265, 62 CrossRef CAS.
- C. Li, H. Li, L. Han, C. Li and S. Zhang, Mater. Lett., 2011, 65, 2537 CrossRef CAS.
- M. Ebadi, M. Ramezani and Z. Zarghami, J. Cluster Sci., 2016, 27, 341 CrossRef CAS.
- S. Shen, L. Zhao and L. Guo, J. Phys. Chem. Solids, 2008, 69, 2426 CrossRef CAS.
- J. Chen, F. Xin, X. Yin, T. Xiang and Y. Wang, RSC Adv., 2015, 5, 3833 RSC.
- A. Chachvalvutikul, W. Pudkon, T. Luangwanta, T. Thongtem, S. Thongtem, S. Kittiwachana and S. Kaowphong, Mater. Res. Bull., 2019, 111, 53 CrossRef CAS.
- Z. Lei, W. You, M. Liu, G. Zhou, T. Takata, M. Hara, K. Domen and C. Li, Chem. Commun., 2003, 2142 RSC.
- S. Wang, X. Hai, X. Ding, K. Chang, Y. Xiang, X. Meng, Z. Yang, H. Chen and J. Ye, Adv. Mater., 2017, 29, 1701774 CrossRef.
- Q. Liu, Y. Zhou, J. Kou, X. Chen, Z. Tian, J. Gao, S. Yan and Z. Zou, J. Am. Chem. Soc., 2010, 132, 14385 CrossRef CAS.
- X. Feng, K. Shankar, O. K. Varghese, M. Paulose, T. J. Latempa and C. A. Grimes, Nano Lett., 2008, 8, 3781 CrossRef CAS.
- Z. Chen, D. Li, W. Zhang, C. Chen, W. Li, M. Sun, Y. He and X. Fu, Inorg. Chem., 2008, 47, 9766 CrossRef CAS.
- S. Adhikari, A. V. Charanpahari and G. Madras, ACS Omega, 2017, 2, 6926 CrossRef CAS.
- K. Y. Wu, S. Yao, G. Lv, Y. Wang, H. Zhang, P. Liao and Y. Wang, J. Catal., 2021, 401, 262 CrossRef.
- B. Kempken, V. Dzhagan, D. R. T. Zahn, M. J. P. Alcocer, I. Kriegel, F. Scotognella, J. Parisi and J. Kolny-Olesiak, RSC Adv., 2015, 5, 89577 RSC.
- A. Buckingha, B. Ward-O’Brien, W. Xiao, Y. Li, J. Qu and D. J. Lewis, Chem. Commun., 2022, 58, 8025 RSC.
- Y. T. Alharbi, F. Alam, A. Salhi, M. Missous and D. J. Lewis, Sci. Rep., 2021, 11, 3053 CrossRef CAS PubMed.
- F. Makin, F. Alam, M. A. Buckingham and D. J. Lewis, Sci. Rep., 2022, 12, 5627 CrossRef CAS.
- G. B. Shombe, M. D. Khan, C. Zequine, C. Zhao, R. K. Gupta and N. Revaprasadu, Sci. Rep., 2020, 10, 3260 CrossRef CAS.
- M. B. Mensah, J. A. M. Awudja, N. Revaprasadu and P. O’Brien, Mater. Sci. Semicond. Process., 2021, 122, 105493 CrossRef CAS.
- M. A. Malik, N. Revaprasadu and P. O’Brien, Chem. Mater., 2001, 13, 913 CrossRef CAS.
- A. Y. Shah, G. Karmakar, A. Tyagi and G. Kedarnath, New J. Chem., 2022, 46, 19817–19823 RSC.
- S. Ghoshal, A. Wadawale and V. K. Jain, Anal. Sci., 2008, 24, 15 CrossRef.
- B. Philips-Invernizzi, D. Dupont and C. Cazé, Opt. Eng., 2001, 40, 1082 CrossRef.
- S. Palaty, P. V. Devi and K. J. Mary, Prog. Rubber Plast. Recycl. Technol., 2010, 26, 199 CrossRef CAS.
- D. P. Dutta, G. Sharma, S. Ghoshal, N. Kushwah and V. K. Jain, J. Nanosci. Nanotechnol., 2006, 6, 235 CrossRef CAS.
- A. l Johnson, M. Hill, G. K-Kohn, K. Molloy and A. Sudlow, Inorg. Chem. Commun., 2014, 49, 8–11 CrossRef CAS.
- S. Mourdikoudis and L. M. L. Marzan, Chem. Mater., 2013, 25, 1465 CrossRef CAS; M. D. Khan, M. Akhtar, M. A. Malik, N. Revaprasadu and P. O’Brien, ChemistrySelect, 2018, 3, 2943 CrossRef.
- W. K. Unger, B. Famworth, J. C. Irwin and H. Pink, Solid State Commun., 1978, 25, 913 CrossRef CAS.
- S. A. López-Riyera, L. Martínez, B. Fontal, W. Giriat and F. Medina, Semicond. Sci. Technol., 1995, 10, 645 CrossRef.
- W. K. Unger, H. Meuth, J. C. Irwin and H. Pink, Phys. Status Solidi A, 1978, 46, 81 CrossRef CAS.
- Y. Pana, X. Yuan, L. Jianga, H. Yu, J. Zhang, H. Wang, R. Guana and G. Zeng, Chem. Eng. J., 2018, 354, 407 CrossRef.
- O. Chen, Y. Yang, T. Wang, H. Wu, C. Niu, J. Yang and Y. C. Cao, J. Am. Chem. Soc., 2011, 133, 17504 CrossRef CAS.
- S. Peng, L. Li, Y. Wu, L. Jia, L. Tian, M. Srinivasan, S. Ramakrishna, Q. Yan and S. G. Mhaisalkar, CrystEngComm, 2013, 15, 1922 RSC.
- S. Shen, P. Guo, L. Zhao, Y. Du and L. Guo, J. Solid State Chem., 2011, 184, 2250 CrossRef CAS.
- S. Shen, L. Zhao, Z. Zhou and L. Guo, J. Phys. Chem. C, 2008, 112, 16148 CrossRef CAS.
- R. S. Knox, Theory of Excitons, Solid State Physics Supplements, Academic Press, New York, 1963 Search PubMed.
- C. Du, B. Yan, Z. Lin and G. Yang, Catal. Sci. Technol., 2019, 9, 4066–4076 RSC.
- Z. Zhang, K. Liu, Z. Feng, Y. Bao and B. Dong, Sci. Rep., 2016, 6, 19221 CrossRef CAS.
Footnote |
| † Electronic supplementary information (ESI) available: Additional figures. See DOI: https://doi.org/10.1039/d2nj05175c |
| This journal is © The Royal Society of Chemistry and the Centre National de la Recherche Scientifique 2023 |

