Removal of uranium from wastewater through Ni–Al-layered double hydroxide@carbon nanotubes functionalized by polyethyleneimine†
Debin
Ji
 *a,
Yao
Liu
a,
Xuepeng
Wang
b,
Zhiqiang
Qiao
a,
Jialiang
Yang
a,
Ziheng
Bai
c,
Shuxia
Guan
a,
Zhandong
Li
d,
Hongjun
Wu
a and
Yongde
Yan
*b
aCollege of Chemistry and Chemical Engineering, Northeast Petroleum University, Daqing, 163318, P. R. China. E-mail: jidebin900302@163.com
bCollege of Materials Science and Chemical Engineering, Harbin Engineering University, Harbin, 150001, P. R. China. E-mail: y5d2006@hrbeu.edu.cn
cState Key Laboratory for Chemical Engineering, Tianjin University, Tianjin, 300350, P. R. China
dHeilongjiang Key Laboratory of Gas Hydrate Efficient Development, Northeast Petroleum University, Daqing, 163318, P. R. China
First published on 9th November 2022
Abstract
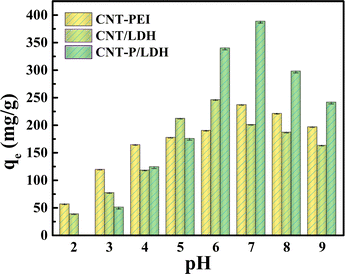
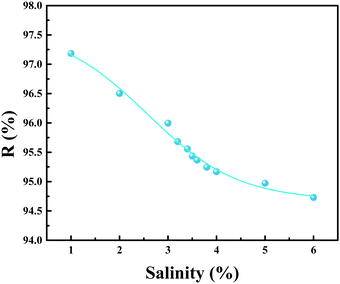
Nuclear energy is widely used as an efficient energy. However, the production of a large amount of uranium-containing wastewater is considerably harmful to the environment. Adsorption is a commonly used method for removing uranium ions from water. In this study, carbon nanotubes (CNTs) were first modified with polyethyleneimine (PEI), and then Ni–Al-layered double hydroxide (LDH) was anchored to CNT-PEI (CNT-P) by using the co-precipitation method to obtain CNT-P/LDH (NO3−). The experimental results indicated that the adsorption process was consistent with Langmuir kinetic adsorption and Sips adsorption isotherm models at the pH of 6. The fit result of the Sips adsorption isotherm model indicated that the adsorption capacity of CNT-P/LDH was 646.6 mg g−1. XPS analyses showed that the adsorption of uranium on CNT-P/LDH mainly involved three aspects. Tests were conducted for different salinities, and the results showed a uranium removal rate of >95% at a salinity of 3.5%.
1. Introduction
As a type of advanced clean energy, nuclear energy has achieved zero carbon emission and is applied in various fields.1,2 Uranium is the main element of nuclear fission and is highly radioactive with a half-life of hundreds of millions of years.3 It often exists in water as uranyl ions (UO22+), which can cause irreparable harm to the environment and humans.4 However, due to the inevitable causes, such as uranium mining, the use of nuclear power plants, and nuclear wastewater leakage, a large amount of uranium-containing wastewater is produced, which poses a great threat to the environment and ecology.5,6 Therefore, uranium ions must be removed from uranium-containing wastewater.7,8 The removal and recycling of uranium ions from uranium-containing wastewater can lead to not only a decrease in the adverse effects of nuclear wastewater on the natural environment but also reutilization of waste uranium resources. Adsorption has become one of the most commonly used methods9–12 for removing uranyl ions from water, and efficient and fast adsorbents must be urgently obtained.13–15 Metal organic frameworks (MOFs),1,16 magnetic materials,17,18 silica,19 polyacrylonitriles,20,21 hemp fiber,14,15,22,23 and carbon materials24–27 have been used in uranium adsorption.Carbon nanotubes (CNTs) have received attention in the field of adsorption since their discovery in the 1900s.6,28–30 In 2009, Schierz et al.31 first proposed the use of CNTs for uranium adsorption. Shao et al.32 used a plasma-induced method to graft carboxymethyl cellulose onto CNTs (MWCNT-g-CMC). The introduction of carboxymethyl fibers improved the dispersibility of CNTs in water, and the functional groups of –NH2 and CMC could cause the complexation of UO22+ with the MWCNT-g-CMC surface. Song et al.33 first used chemically coupled polydopamine (PDA) with a regenerated surface-initiated activator of electron-transfer atom-transfer radical polymerization for the controlled grafting of CNTs known as poly (glycidyl methacrylate) (PGMA) brushes. The moderately and highly reactive groups were further treated with ethylenediamine (EDA) to obtain CNT–PDA–PGMA–EDA. The introduction of PDA and PGMA provided N and O elements that have an affinity toward UO22+, thus increasing the affinity of adsorbents. With EDA addition, the adsorption capacity reached 192.9 mg g−1, and the adsorption rate was 15 times higher than the adsorption rate of pristine CNTs and was higher than the adsorption rate of any CNT-based uranium adsorbent available at that time.
Polyethyleneimine (PEI) is a polymer with a high cationic charge density and multi-branched long chain, is rich in amine and imine groups, and can be combined with various metal ions through reactions, such as coordination and classical attraction.34,35 PEI does not chelate with alkali and alkaline earth metals at any pH; thus, it is highly suitable for adsorption in seawater.36,37 However, PEI is extremely water-soluble and cannot be used as a single adsorbent; hence, it is often grafted on other adsorbents. The stability of CNTs in water can be improved through PEI functionalization.38
Layered double hydroxide (LDH) is a layered structure compound with exchangeable anions (e.g., CO32−, NO3−, and SO42−) available between layers.20,39–43 Its advantages such as the abundance of exchangeable interlayer anions, unique layered structure, and large specific surface area render LDH widely applicable in the field of adsorption. However, LDH is difficult to recycle even after its single use.44 Therefore, researchers anchored it to other adsorbents to increase the adsorption capacity and facilitate adsorbent recycling. The adsorption capacity of CNTs after LDH anchoring is greater than that of other CNT-based adsorbents but can lead to severe agglomeration.6,45 Moreover, the most studied interlayer anion of LDH is CO32−, and other interlayer anions have been rarely investigated.46–48
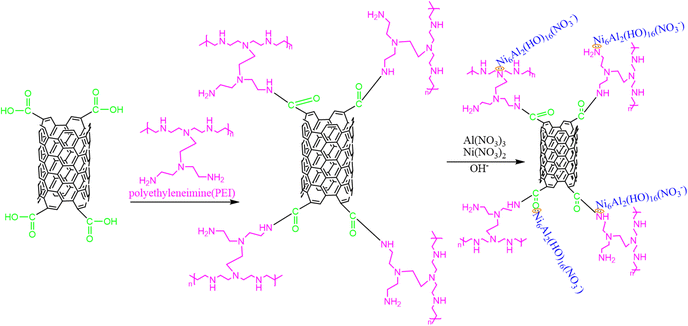
Based on the aforementioned investigations, in this study, CNT-P/LDH, with NO3− as the interlayer anion, was prepared. PEI was first employed to functionalize CNT (CNT-PEI) for further improving water solubility and dispersibility of CNTs. Then, Ni–Al/LDH was anchored to obtain CNT-PEI (CNT-P/LDH), and CNT-P/LDH(NO3−) was prepared. CNT-P/LDH composites were comprehensively analyzed through characterization methods, such as Fourier-transform infrared (FT-IR), scanning electron microscopy (SEM), nitrogen adsorption and desorption isotherms, and X-ray diffraction (XRD). The effects of pH, adsorption time, and temperature on adsorption were studied. In addition, FT-IR, XRD and X-ray photoelectron spectroscopy (XPS) were employed to analyze the adsorption spectra before and after uranium adsorption, and the adsorption mechanism was discussed, which provided a theoretical basis for adsorption enhancement. Because interlayer anions were present in LDH, the effect of the presence of different anions on the adsorption capacity was investigated. Finally, solutions with different salinities were configured to provide a basis for uranium extraction from seawater.
2. Experiments
2.1 Reagents and Materials
The uranyl ion solution was prepared from uranyl nitrate (UO2(NO3)2·6H2O, AR). 1-Hydroxybenzotriazole (HOBT), N,N′-dicyclohexylabdimd (DCC), and PEI were purchased from Aladdin. Ni(NO3)2·6H2O and Al(NO3)3·9H2O were procured from Tianjin Damao. Other nitrates used were purchased from Tianjin Damao. Carboxylated CNTs were purchased from Carbon Dilute Technology Co., Ltd.2.2 Analysis and characterization
Fourier transform infrared spectroscopy (FT-IR) (Avatar 370, Nicholas Corporation) analysis was performed to detect the functional group structure of the material. All spectra were recorded with a resolution of 4 cm−1 and 16 scans and measured between 400 and 4000 cm−1. For SEM investigation, an IGMA-type scanning electron microscope produced by Carl Zeiss, Germany, was used. The acceleration voltage is 0.1–20 kV, and the magnification is 10–5000 times. XRD analysis was performed using a D/Max-TTR III X-ray diffractometer (Rigaku, Japan). XRD was performed from 5° to 70° (2θ region) with a 0.02° step size using monochromatized Cu Kα (λ = 1.541 Å) radiation. The specific surface areas and pore structure information of CNT-P/LDH were measured by N2 sorption isotherms at 77 K using the model ASAP 2010 produced by Micromeritics, USA. The samples were heated at 120 °C to remove water. Nitrogen adsorption–desorption was performed at relative pressures from 0.99 to 0.01. Inductively coupled plasma-mass spectrometry (ICP-MS) was performed using an 820-MS inductively coupled plasma mass spectrometer produced by Bruker, Germany. This tool can detect μg L−1 order. In this study, the concentration (mg L−1) of uranyl ions and other metal ions was measured by ICP-MS. XPS experiments were performed using a surface analysis system (Thermofisher Escalab Xi+). Al Kα radiation (hν = 1486.6 eV) from a monochromatic X-ray source and a 500 μm light spot size was used. The high resolution spectra were recorded at the pass energy of 30 eV with a step size of 0.05 eV.2.3 Synthesis of CNT-PEI
![[thin space (1/6-em)]](https://www.rsc.org/images/entities/char_2009.gif) :
:![[thin space (1/6-em)]](https://www.rsc.org/images/entities/char_2009.gif) HOBT (1
HOBT (1![[thin space (1/6-em)]](https://www.rsc.org/images/entities/char_2009.gif) :
:![[thin space (1/6-em)]](https://www.rsc.org/images/entities/char_2009.gif) 1) was added to the RBF, and the mixture was dissolved in 50 mL of distilled water. The –NH2 of PEI reacts with COOH of CNT-COOH, and CO–NH is formative. The ultrasound treatment was conducted for 30 min to achieve complete dispersion. Then, the solution was stirred at 60 °C for 5 h. Subsequently, the product was rinsed with distilled water and, finally, was dried to obtain CNT-PEI.
1) was added to the RBF, and the mixture was dissolved in 50 mL of distilled water. The –NH2 of PEI reacts with COOH of CNT-COOH, and CO–NH is formative. The ultrasound treatment was conducted for 30 min to achieve complete dispersion. Then, the solution was stirred at 60 °C for 5 h. Subsequently, the product was rinsed with distilled water and, finally, was dried to obtain CNT-PEI.
| Al(NO3)3·9H2O + Ni(NO3)2·6H2O + NaOH → Ni6Al2(16H2O)(NO3−) | (1) |
2.4 Adsorption experiments
To 50 mL of uranyl solution, 0.02 g of the adsorbent was added, and the adsorption equilibrium was reached in a shaker. The adsorption experiment is presented in the ESI† in detail. The sample was filtered, and the U(VI) concentration in the solution was analyzed using ICP-MS. Basic parameters, that is, adsorption capacity qe (mg g−1) and removal rate R (%), were calculated using eqn (1) and (2), respectively.| qe = (C0 − Ce)·V/m | (2) |
 | (3) |
3. Results and discussion
3.1 Characterization
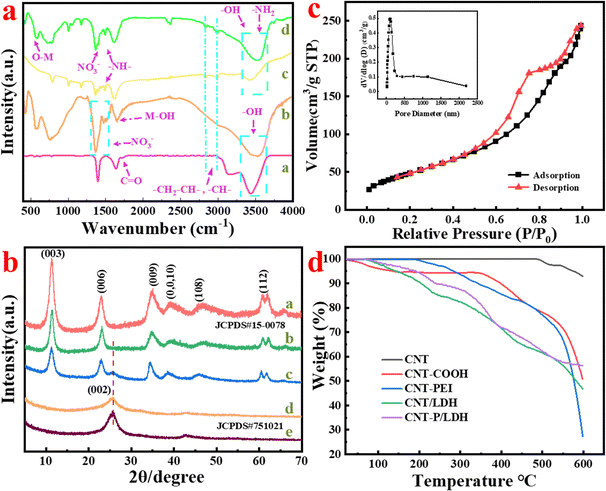
The FT-IR spectra of CNT-COOH, Ni–Al/LDH, CNT-PEI, and CNT-P/LDH are presented as a, b, c, and d curves, respectively, in Fig. 2a. In curve a, the band at 3431 cm−1 is attributed to the stretching vibration peaks of –COOH on the CNT-COOH surface. The symmetric and antisymmetric bands of C–H appear at 2828 and 2986 cm−1, respectively.49,50 The band at 1724 cm−1 corresponds to the stretching vibration of C![[double bond, length as m-dash]](https://www.rsc.org/images/entities/char_e001.gif) O bonds. After PEI functionalization of CNT-COOH (curve c), the peaks observed at 1350–1500 cm−1 are caused by the –NH–, –NH2, and C–N bonds of PEI, and the C
O bonds. After PEI functionalization of CNT-COOH (curve c), the peaks observed at 1350–1500 cm−1 are caused by the –NH–, –NH2, and C–N bonds of PEI, and the C![[double bond, length as m-dash]](https://www.rsc.org/images/entities/char_e001.gif) O bond can not be observed obviously. Pure Ni–Al/LDH presents a strong and broad O–H peak at 3500 cm−1. The M–OH peak appears at 1610 cm−1, and the peak for NO3− is observed at 1350–1500 cm−1. The stretching vibration peaks of O–M (M = Ni and Al) and O–M–O appear near 500 cm−1.51 After the CNT-PEI-anchored growth of Ni–Al/LDH, CNT-P/LDH shows a broad and strong O–H peak at 3500 cm−1, which is weaker than the O–H peak of Ni–Al/LDH. Symmetric and antisymmetric peaks of C–H are observed at 2800–2900 cm−1. The peaks for M–OH and the C
O bond can not be observed obviously. Pure Ni–Al/LDH presents a strong and broad O–H peak at 3500 cm−1. The M–OH peak appears at 1610 cm−1, and the peak for NO3− is observed at 1350–1500 cm−1. The stretching vibration peaks of O–M (M = Ni and Al) and O–M–O appear near 500 cm−1.51 After the CNT-PEI-anchored growth of Ni–Al/LDH, CNT-P/LDH shows a broad and strong O–H peak at 3500 cm−1, which is weaker than the O–H peak of Ni–Al/LDH. Symmetric and antisymmetric peaks of C–H are observed at 2800–2900 cm−1. The peaks for M–OH and the C![[double bond, length as m-dash]](https://www.rsc.org/images/entities/char_e001.gif) C double bond appearing near 1610 cm−1 overlap because they are considerably close. The C
C double bond appearing near 1610 cm−1 overlap because they are considerably close. The C![[double bond, length as m-dash]](https://www.rsc.org/images/entities/char_e001.gif) O bond weakens. Due to the addition of NO3− and superposition of imine peaks at 1370 cm−1, stretching vibration peaks of O–M (M = Ni and Al) and O–M–O appear at 500 cm−1. Therefore, Ni–Al/LDH was successfully grown on CNT-PEI.
O bond weakens. Due to the addition of NO3− and superposition of imine peaks at 1370 cm−1, stretching vibration peaks of O–M (M = Ni and Al) and O–M–O appear at 500 cm−1. Therefore, Ni–Al/LDH was successfully grown on CNT-PEI.
Fig. 2b shows the XRD patterns of Ni–Al/LDH, CNT-P/LDH, CNT–LDH, CNT-PEI, and CNTs. CNTs exhibit two diffraction peaks at 26.2° and 44.3°, corresponding to the (0 0 2) and (1 0 1) planes of graphite.52 These diffraction peaks are consistent with the standard card of JCPDS#75-1021. After PEI functionalization, the graphitic peak of CNTs observed at 26.2° considerably weakens and broadens. PEI modification causes certain damage to the CNT crystal structure. The diffraction peaks of pure Ni–Al/LDH at 11.6°, 23.3°, 35.5°, 39.7°, 47.6° and 61.8° correspond to (0 0 3), (0 0 6), (0 0 9), (0 0 10), (1 0 8), and (1 1 2) planes. They are consistent with the standard card of JCPDS#15-0078, respectively, which presents the typical crystal structure of Ni–Al.20 When Ni–Al/LDH is anchored to CNTs, a weak (0 0 2) graphite peak can be observed for CNT–LDH; however, when it is anchored to CNT-P, this peak becomes substantially weak and almost disappears. The characteristic peaks of LDH are not as high as a single-intensity peak. Therefore, the anchoring of LDH to CNTs leads to different degrees of influence on their crystal structures.
Fig. 2c shows the N2 cycle adsorption and desorption curve of CNT-P/LDH, and the accompanying image presents the pore size distribution curve. CNT-P/LDH exhibits the type IV isotherm according to the IUPAC classification, indicating a mesoporous structure material.53 The BET specific surface area of CNT-P/LDH is 180.7 m2 g−1, and the average pore size and volume are 8.34 nm and 0.377 cm3 g−1, respectively.
Fig. 2d presents the graph of the thermogravimetric analysis of several functionalized CNTs. The weight loss of CNTs with different degrees of functionalization varied. The comparison of the curves between CNT–COOH and CNT–PEI proved successful PEI functionalization from the side. The mass loss of CNT/LDH was slightly more than that of CNT-P/LDH because only carboxyl groups existed in carboxylated CNTs, and LDH could only be anchored to the carboxyl groups. After PEI modification, an abundance of amine and imine groups was introduced into CNTs to anchor additional LDH to PEI. Therefore, after high temperature, more metal oxides remained, and the weight of CNT-P/LDH was higher than that of CNT–LDH. The XRD pattern acquired after high-temperature baking is shown in Fig. S1 of the ESI.†
The microstructure of CNT-P/LDH is shown in Fig. 3a–c. It can be seen that the microstructures of CNT-P/LDH are not fixed in size and shape. The ends of the CNT-PEI are very reactive as they contain additional active sites, such as –NH– and –NH2.52 The ends of CNT-PEI are embedded and twined together in Ni–Al/LDH, which present slight aggregate. Surface scanning of Fig. 3a by EDS is shown in Fig. 3d–i. Because LDH was anchored on CNT-PEI by N, the distributions of Ni, Al and C are highly consistent, as well as those for N and O. LDH, –OH on the surface and interlayer anions NO3− can provide more active sites for adsorbing uranium.
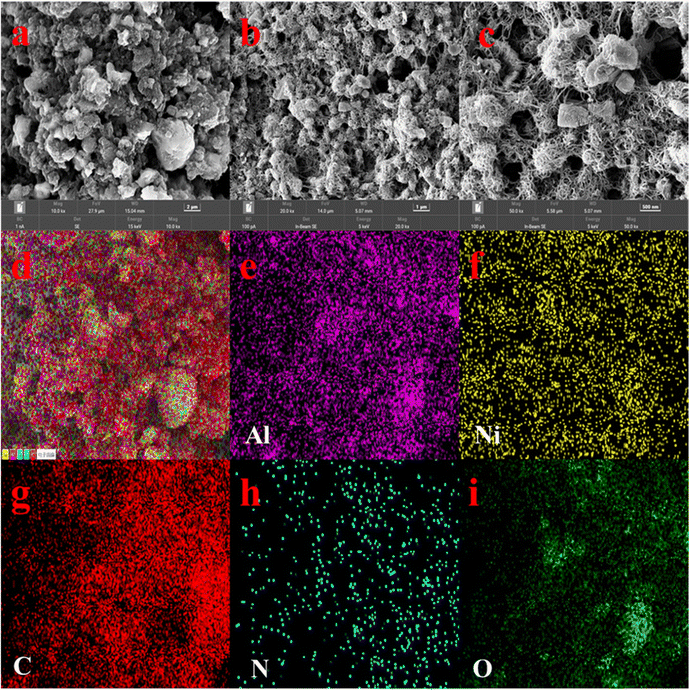 | ||
| Fig. 3 (a–c) SEM patterns of CNT-P/LDH at different magnification times; (d–i) element distribution. | ||
3.2 Study of the uranium adsorption behavior of CNT-P/LDH
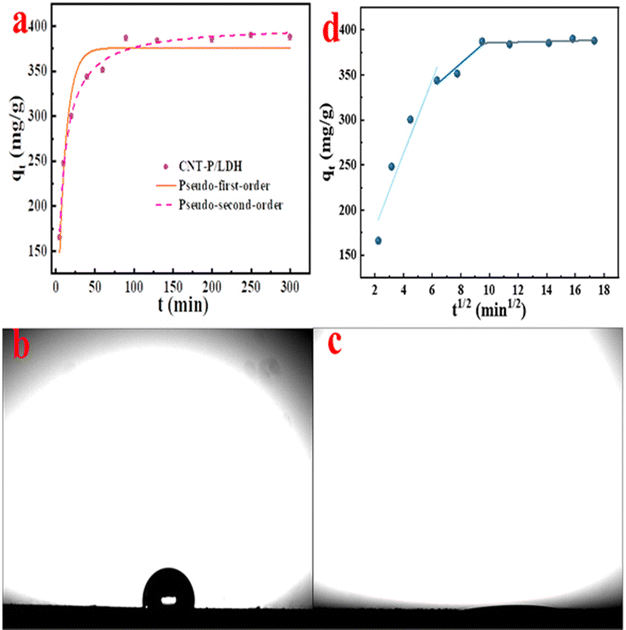
The temperature was set to 298 K, and the adsorption time was set between 5 and 300 min to study kinetic adsorption. In the initial 50 min, due to the availability of numerous unoccupied active sites and exchangeable interlayer anions, the adsorbent shows the ability of rapid uranyl ion removal in water, which increases to 87% of the saturated amount (Fig. 5a). After 50 min, the adsorption rate starts to decrease and reaches the adsorption equilibrium at 90 min. Fig. 5b and c shows the wettability of CNTs and CNT-P/LDH, respectively. Raw CNTs are in a hydrophobic state, and their equilibrium time for uranium adsorption can be up to over 5 h.6 Improving the hydrophilicity of the adsorbent can not only provide extra adsorption active sites for the adsorbent but also accelerate the adsorption rate.23 The side-chains of PEI and anchoring of Ni–Al/LDH which facilitated further modification provided more active sites (–OH, –NH2, and –NH–) for CNT-COOH, leading to more adsorption sites for U(VI) accelerating the adsorption rate.
The adsorption data were analyzed and fitted using the pseudo-first-order and pseudo-second-order kinetic models to understand the kinetic mechanism of adsorption. The fitting results and parameters of the kinetic analysis are shown in Fig. 5a and Table 1, respectively. The pseudo-second-order kinetic model fit result of adsorption capacity (401.2 mg g−1) is a more approximate experimental result (390.15 mg g−1) than the pseudo-first-order kinetic model (375.7 mg g−1) fit result. The correlation coefficient R2 of pseudo-second-order kinetic models (0.9913 > 0.9376) is more close to 1. The comparison of the approximation degree between the experimental and the calculated adsorption capacity and value of the correlation coefficient R2 revealed that the adsorption of CNT-P/LDH to uranyl ions conformed to the pseudo-second-order kinetic model and was a chemical adsorption process.55
| Kinetic model | q e (mg-U g-ads−1) | k 1 (min−1)/k2 (g mg−1 min−1) | R 2 |
|---|---|---|---|
| Pseudo-first-order kinetic model | 375.7 | 0.1007 | 0.9376 |
| Pseudo-second-order kinetic model | 401.2 | 0.0004 | 0.9913 |
The intraparticle diffusion model can provide detailed information on the adsorption process; thus, this model was used to fit the kinetic data. Fig. 5d shows the fitting of the particle diffusion model for different adsorption time data. The fitting parameters are presented in Table 2. The straight line fitted using three segments shown in Fig. 5d indicates that adsorption is chiefly divided into three processes: external diffusion, intraparticle diffusion, and the final adsorption equilibrium. All the three fitting straight lines pass through the origin, indicating that the rate-controlling step of CNT-P/LDH adsorption is affected by both surface adsorption and intra-particle diffusion. The slope that was gradually slowed down (kp1 > kp2 > kp3) can reflect the adsorption rate. The final adsorption equilibrium step is the rate-limiting step, which results from the interaction of uranyl ions with active sites on the adsorbent surface.56
| T (K) | k p1 | R 1 2 | k p2 | R 2 2 | k p3 | R 3 2 |
|---|---|---|---|---|---|---|
| 298 | 41.31 | 0.8700 | 13.88 | 0.8260 | 0.3976 | 0.0613 |
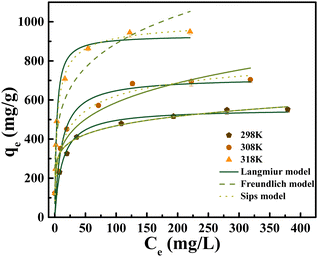
The fitting curve (Fig. 6) and fitting parameters (Table 3) indicate that the adsorption process can be appropriately described using the Sips model (RSips2 (0.9786) > RFreundlich2 (0.9657) > RLangmuir2 (0.9175). The saturated adsorption capacity obtained by fitting this model is 646.6 mg g−1. For uranium, the CNT-P/LDH adsorption process involves both monolayer and multi-layer adsorption. In addition, the uranium removal rate of the adsorbent is nearly 100% at a low-concentration solution of uranium. This characteristic is beneficial for uranium adsorption from nuclear wastewater.
| Isothermal model | Parameter | |
|---|---|---|
| Langmuir | q L (mg g−1) | 555.2 |
| K L (L mg−1) | 0.08271 | |
| R 2 | 0.9175 | |
| Freundlich | K F (L g−1) | 175.7 |
| n | 4.934 | |
| R 2 | 0.9657 | |
| Sips | q s (mg g−1) | 646.6 |
| K s | 0.2121 | |
| m | 0.4113 | |
| R 2 | 0.9786 | |
Table 4 shows the adsorption capacities and contact time of different adsorbents towards uranium. These adsorbents were compared with CNT-P/LDH. It can be seen that CNT-P/LDH has excellent adsorption capacity and adsorption rate for uranium. In consequence, CNT-P/LDH is suitable as a material for adsorbing uranium.
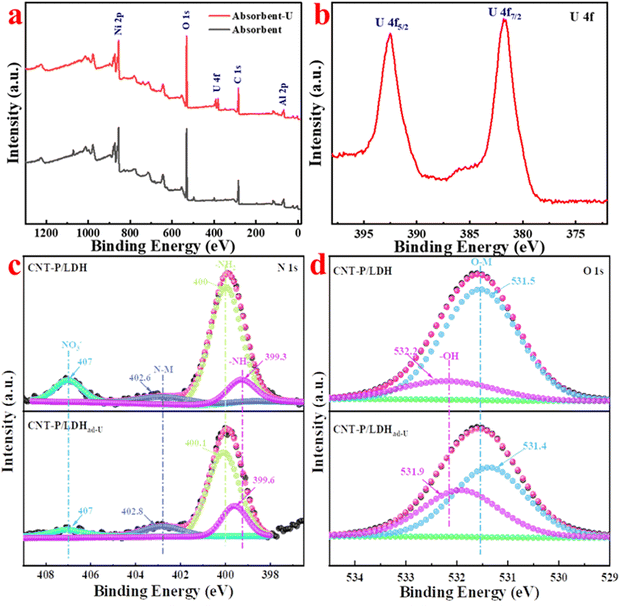 | ||
| Fig. 7 (a) Complete XPS spectra of CNT-P/LDH and CNT-P/LDHad-U; (b) fine spectra of CNT-P/LDH and CNT-P/LDHad-U; (c and d) CNT-P/LDH and fine maps of N 1s and O 1s of CNT-P/LDHad-U. | ||
Many studies have shown that after adsorption, the state of atoms involved in adsorption changes, resulting in varying binding energies. Therefore, it is sufficient to prove that an element is involved in the adsorption process when the binding energy of the element changes in XPS. XPS can be performed for quantitative analyses.
Fig. 7c and d presents the N 1s and O 1s fine spectra of CNT-P/LDH and CNT-P/LDHad-u, respectively. The N 1s fine spectra of CNT-P/LDH can be fitted to four peaks: –NH–, –NH2, N–M, and NO3−; their binding energies are 399.3, 400, 402.6, and 407 eV, respectively. After the adsorption of uranyl ions, a 0.2 eV shift for –NH2 and a 0.3 eV shift for –NH– and N–M can be observed, suggesting that they are involved in the adsorption process. The lone pair of electrons on N coordinates with the empty U orbital. No displacement is observed before and after adsorption for the interlayer anion NO−3 at 407 eV; however, the decrease in its content indicates that this anion is replaced with uranyl ions. Before adsorption, two peaks of –OH (532.2 eV) and O–M (531.5 eV) can be fitted to the fine spectrum of O 1s. After adsorption, –OH shifts by 0.3 eV, and O–M shifts by 0.1 eV, indicating that the metal atoms on CNT-P/LDH show electrostatic attraction to the O atoms of uranyl ions.57
Therefore, the adsorption mechanism of uranium on CNT-P/LDH mainly involves the following aspects: (1) the classical attraction of the O element available on CNT-P/LDH with uranyl ions; (2) coordination of the lone pair of electrons of N with U; and (3) exchange of interlayer ions of LDH with uranyl ions.
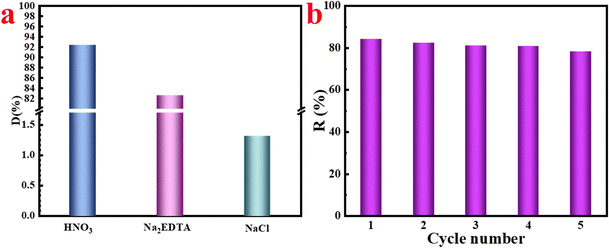 | ||
| Fig. 9 (a) Desorption efficiency of different desorption solutions; (b) cycling performance (MCNT-P/LDHad-U = 0.02 g, T = 298 K, V = 50 mL). | ||
4. Conclusions
CNT-P/LDH(NO3−) was prepared using the co-precipitation method. The FT-IR, XRD, and XPS results showed that the interlayer anion NO3− can be replaced with (UO2)3(OH)5+ and (UO2)4(OH)7+ and that –NH2 and –NH– can coordinate with uranyl ions, rendering the adsorbent to exhibit a strong adsorption effect. Several adsorption experiments showed that the adsorption process conformed to the pseudo-second-order kinetic and Sips isotherm adsorption models. The adsorption capacity of CNT-P/LDH was 549.25 mg g−1 at the pH of 6 and 298 K. CNT-P/LDH also exhibited a high removal rate when the effect of salinity was tested. CNT-P/LDH could serve as a potential seawater uranium sorbent.Conflicts of interest
There are no conflicts to declare.Acknowledgements
The work was financially supported by the National Natural Science Foundation of China (21976047 and 21790373), the Central Support Fund for the Reform and Development of Local Colleges and Universities (14011202102), the China Postdoctoral Science Foundation (2017M621244), the Postdoctoral Research Start-up Gold in Heilongjiang Province (16180019), the Natural Science Foundation of Heilongjiang Province (LH2022E030), and the Science Foundation of Northeast Petroleum University (15011030811, 1305021863, 15041260347 and 15041202126).References
- B. Zhao, L. Y. Yuan, Y. Wang, T. Duan and W. Q. Shi, ACS Appl. Mater. Interfaces, 2021, 13, 16300–16308 CrossRef CAS PubMed.
- Y. Xie, C. Chen, X. Ren, X. Wang, H. Wang and X. Wang, Prog. Mater. Sci., 2019, 103, 180–234 CrossRef CAS.
- H. J. Chen, Z. H. Gong, Z. J. Zhuo, X. Zhong, M. Z. Zhou, X. P. Xiang, Z. B. Zhang, Y. H. Liu and Y. Chen, Chem. Eng. J., 2022, 428, 132113–132124 CrossRef CAS.
- M. Zhao, Z. P. Cui, D. Q. Pan, F. Y. Fan, J. H. Tang, Y. M. Hu, Y. Xu, P. C. Zhang, P. Li, X. Y. Kong and W. S. Wu, ACS Appl. Mater. Interfaces, 2021, 13, 17931–17939 CrossRef CAS PubMed.
- M. H. Khani, A. R. Keshtkar, M. Ghannadi and H. Pahlavanzadeh, Equilibrium, J. Hazard. Mater., 2008, 150, 612–618 CrossRef CAS PubMed.
- M. M. Song, Q. Wang and Y. D. Meng, J. Radioanal. Nucl. Chem., 2012, 293, 899–906 CrossRef CAS.
- M. Tuzen, T. A. Saleh, A. Sari and Naeemullah, Chem. Eng. Res. Des., 2020, 159, 353–361 CrossRef CAS.
- T. A. Saleh, Naeemullah, M. Tuzen and A. Sari, Chem. Eng. Res. Des., 2017, 117, 218–227 CrossRef CAS.
- D. B. Ji, Y. Liu, H. Y. Ma, Z. H. Bai, Z. Q. Qiao, C. Yan, Y. D. Yan and H. J. Wu, ACS Sustainable Chem. Eng., 2022, 10, 11990–11999 CrossRef CAS.
- A. Alkenani and T. A. Saleh, J. Mol. Liq., 2022, 367, 120291–120301 CrossRef CAS.
- T. A. Saleh, J. Mol. Liq., 2022, 359, 119340–119351 CrossRef CAS.
- A. A. Alazab and T. A. Saleh, J. Water Process Eng., 2022, 50, 103125–103135 CrossRef.
- A. Q. Al-Gamal and T. A. Saleh, J. Water Process Eng., 2022, 47, 102770–102785 CrossRef.
- Z. H. Bai, Q. Liu, D. L. Song, H. S. Zhang, J. Y. Liu, R. R. Chen, J. Yu, R. M. Li and J. Wang, React. Funct. Polym., 2020, 149, 104512–104523 CrossRef CAS.
- Z. H. Bai, Q. Liu, H. S. Zhang, J. Y. Liu, J. Yu and J. Wang, J. Mol. Liq., 2020, 297, 111739–111750 CrossRef CAS.
- Z. Y. Bai, Q. Liu, H. S. Zhang, J. Yu, R. R. Chen, J. Y. Liu, D. L. Song, R. M. Li and J. Wang, ACS Appl. Mater. Interfaces, 2020, 12, 18012–18022 CrossRef CAS.
- X. F. Zhang, J. Wang, R. M. Li, Q. H. Dai, R. Gao, Q. Liu and M. L. Zhang, Ind. Eng. Chem. Res., 2013, 52, 10152–10159 CrossRef CAS.
- Y. G. Zhao, J. X. Li, L. P. Zhao, S. W. Zhang, Y. S. Huang, X. L. Wu and X. K. Wang, Chem. Eng. J., 2014, 235, 275–283 CrossRef CAS.
- W. T. Li, Q. Liu, R. R. Chen, J. Yu, H. S. Zhang, J. Y. Liu, R. M. Li, M. L. Zhang, P. L. Liu and J. Wang, Inorg. Chem. Front., 2018, 5, 1321–1328 RSC.
- W. T. Li, R. R. Chen, Q. Liu, J. Y. Liu, J. Yu, H. S. Zhang, R. M. Li, M. L. Zhang and J. Wang, ACS Sustainable Chem. Eng., 2018, 6, 13385–13394 CrossRef CAS.
- W. T. Li, Q. Liu, J. Y. Liu, H. S. Zhang, R. M. Li, Z. S. Li, X. Y. Jing and J. Wang, Appl. Surf. Sci., 2017, 403, 378–388 CrossRef CAS.
- Z. H. Bai, Q. Liu, H. S. Zhang, J. Y. Liu, J. Yu and J. Wang, Chem. Eng. J., 2020, 382, 122555–122565 CrossRef CAS.
- H. Q. Gu, Q. Liu, G. H. Sun, J. Liu, R. R. Chen, J. Yu, J. H. Zhu and J. Wang, Chem. Eng. J., 2022, 430, 132742–132751 CrossRef CAS.
- Y. Jung, S. Kim, S. J. Park and J. M. Kim, Colloids Surf., A, 2008, 313, 292–295 CrossRef.
- W. H. Zhao, X. Y. Lin, H. M. Cai, T. Mu and X. G. Luo, Ind. Eng. Chem. Res., 2017, 56, 12745–12754 CrossRef CAS.
- T. N. Gevrek, A. Degirmenci, R. Sanyal, H. A. Klok and A. Sanyal, ACS Appl. Polym. Mater., 2021, 3, 2507–2517 CrossRef CAS.
- Y. X. Qian, Y. H. Yuan, H. L. Wang, H. Liu, J. X. Zhang, S. Shi, Z. H. Guo and N. Wang, J. Mater. Chem. A, 2018, 6, 24676–24685 RSC.
- K. A. Nassereldeen1, S. E. Mirghami1 and N. W. Salleh, IFMBE Proc., 2011, 35, 88–91 Search PubMed.
- A. Gupta, S. R. Vidyarthi and N. Sankararamakrishnan, J. Hazard. Mater., 2014, 274, 132–144 CrossRef CAS PubMed.
- J. Xu, Z. Cao, Y. L. Zhang, Z. L. Yuan, Z. M. Lou, X. H. Xu and X. K. Wang, Chemosphere, 2018, 195, 351–364 CrossRef CAS PubMed.
- A. Schierz and H. Zanker, Environ. Pollut., 2009, 157, 1088–1094 CrossRef CAS PubMed.
- D. D. Shao, J. Hu, X. K. Wang and M. Nagatsu, Chem. Eng. J., 2011, 170, 498–504 CrossRef CAS.
- Y. Song, G. Ye, Y. X. Lu, J. Chen, J. C. Wang and K. Matyjaszewski, ACS Macro Lett., 2016, 5, 382–386 CrossRef CAS.
- C. Bertagnolli, A. Grishin, T. Vincent and E. Guibal, Ind. Eng. Chem. Res., 2016, 55, 2461–2470 CrossRef CAS.
- S. B. Ding and Y. P. Ting, Environ. Sci. Technol., 2005, 39, 8490–8496 CrossRef.
- J. B. Lindén, M. Larsson, S. Kaur, W. M. Skinner, S. J. Miklavcic, T. Nann, I. M. Kempson and M. Nydén, RSC Adv., 2015, 5, 51883–51890 RSC.
- M. Ghoul, M. Bacquet and M. Morcellet, Water Res., 2003, 37, 729–734 CrossRef CAS PubMed.
- H. Moradian, H. Fasehee, H. Keshvari and S. Faghihi, Colloids Surf., B, 2014, 122, 115–125 CrossRef CAS PubMed.
- G. Sriram, A. Bendre, T. Altalhi, H. Y. Jung, G. Hegde and M. Kurkuri, Chemosphere, 2022, 287, 131976–131988 CrossRef CAS.
- X. Wang, Y. W. Cai, T. H. Han, M. Fang, K. C. Chen and X. L. Tan, J. Hazard. Mater., 2020, 399, 123081–123092 CrossRef CAS.
- S. L. Ma, L. Huang, L. J. Ma, Y. Shim, S. M. Islam, P. L. Wang, L. D. Zhao, S. C. Wang, G. B. Sun, X. J. Yang and M. G. Kanatzidis, J. Am. Chem. Soc., 2015, 137, 3670–3677 CrossRef CAS.
- H. Zhang, Z. R. Dai, Y. Sui, N. Y. Wang, H. Y. Fu, D. X. Ding, N. Hu, G. Y. Li, Y. D. Wang and L. Li, Ind. Eng. Chem. Res., 2018, 57, 17318–17327 CrossRef CAS.
- H. Asiabi, Y. Yamini and M. Shamsayei, Chem. Eng. J., 2018, 337, 609–615 CrossRef CAS.
- X. Y. Yuan, X. Y. Jing, H. Xu, X. C. Zhang and J. Xu, Chemosphere, 2022, 287, 131919–131929 CrossRef CAS PubMed.
- H. J. Chen, Z. Chen, G. X. Zhao, Z. B. Zhang, C. Xu, Y. H. Liu, J. Chen, L. Zhuang, T. Haya and X. K. Wang, J. Hazard. Mater., 2018, 347, 67–77 CrossRef CAS PubMed.
- J. L. Wu, K. Tian and J. L. Wang, Prog. Nucl. Energy, 2018, 106, 79–86 CrossRef CAS.
- H. J. Chen, Z. B. Zhang, X. X. Wang, J. Chen, C. Xu, Y. H. Liu, Z. M. Yu and X. K. Wang, ACS Appl. Nano Mater., 2018, 1, 2386–2396 CrossRef CAS.
- X. Y. Yuan, C. Y. Yin, Y. Y. Zhang, Z. Y. Chen, Y. F. Xu and J. Wang, Sci. Rep., 2019, 9, 5807–5820 CrossRef.
- Y. D. Zou, P. Y. Wang, W. Yao, X. X. Wang, Y. H. Liu, D. X. Yang, L. Wang, J. Hou, A. Alsaedi, T. Hayat and X. K. Wang, Chem. Eng. J., 2017, 330, 573–584 CrossRef CAS.
- T. A. Saleh, Environ. Sci. Pollut. Res., 2015, 22, 16721–16731 CrossRef CAS PubMed.
- T. A. Saleh, Appl. Surf. Sci., 2011, 257, 7746–7751 CrossRef CAS.
- T. A. Saleh, J. Cleaner Prod., 2017, 172, 2123–2132 CrossRef.
- T. A. Saleh, Chem. Eng. J., 2021, 404, 126987–126997 CrossRef CAS.
- K. S. W. Sing, D. H. Everett, R. A. W. Haul, L. Moscou, R. A. Pierotti, J. Rouquerol and T. Siemieniewska, IUPAC, 1985, 57, 603–619 CAS.
- A. Krestou and D. Panias, Eur. J. Miner. Process. Environ. Prot., 2004, 4, 113–129 Search PubMed.
- A. N. Ngigi, Y. S. Ok and S. Thiele-Bruhn, J. Hazard. Mater., 2019, 364, 663–670 CrossRef CAS.
- W. Liu, X. Zhao, T. Wang, D. Y. Zhao and J. R. Ni, Chem. Eng. J., 2016, 286, 427–435 CrossRef CAS.
- Y. W. Cai, C. F. Wu, Z. Y. Liu, L. J. Zhang, L. H. Chen, J. Wang, X. K. Wang, S. T. Yang and S. A. Wang, Environ. Sci.: Nano, 2017, 4, 1876–1886 RSC.
- J. H. Zhu, Q. Liu, J. Y. Liu, R. R. Chen, H. S. Zhang, R. M. Li and J. Wang, Environ. Sci.: Nano, 2018, 5, 467–475 RSC.
Footnote |
| † Electronic supplementary information (ESI) available: Batch adsorption experiments of CNT-P/LDH; XRD spectra after LDH calcination; FT-IR spectra of CNT-P/LDH and CNT-PLDHad-U; XRD spectra of CNT-P/LDH and CNT-PLDHad-U; and SEM and EDS spectra of CNT-P/LDHad-U. See DOI: https://doi.org/10.1039/d2nj04916c |
| This journal is © The Royal Society of Chemistry and the Centre National de la Recherche Scientifique 2023 |

