A new amide alkaloid induces the apoptosis of human melanoma A375 cells via inhibition of the STAT3 signaling pathway
Ru
Wang†
ab,
Bo
Yang†
a,
Beibei
Zhang
ab,
Qinqin
Zhang
ab,
Bing
Cao
ab,
Jufang
Jia
ab,
Meng
Liu
ab,
Pengli
Guo
ab,
Yuhan
Zhang
ab,
Xiaokun
Li
 a,
Xiaoke
Zheng
 *ab and
Weisheng
Feng
 *ab
*ab
aHenan University of Chinese Medicine, 156 Jinshui East Road, Zhengzhou, 450046, China. E-mail: zhengxk.2006@163.com; fwsh@hactcm.edu.cn; Tel: +86-371-6019-0296
bThe Engineering and Technology Center for Chinese Medicine Development of Henan Province, 156 Jinshui East Road, Zhengzhou, 450046, China
First published on 16th November 2022
Abstract
Melanoma is the deadliest invasive skin cancer, posing a serious threat to human health. Emerging evidence has shown that STAT3 is a major oncogene in melanoma and validated as a target for melanoma therapy. In this study, we synthesized a new amide alkaloid, (R)-2-(butylamino)-N-(4-((4-methylpiperazine-1-yl) methyl) phenyl)-4-(piperidine-3-ylamino) pyrimidine-5-carboxamide (ZYL-01). AG490 (the antagonist of STAT3) and the human melanoma A375 cells and A375 cells transfected with the STAT3C expression construct (A375-STAT3-3C) or with an empty vector (A375-STAT3-NC) are used to investigate the effects of ZYL-01 treatment of human melanoma A375 cells and determine the relevant mechanisms. Our results showed that ZYL-01 significantly reduced the A375 cell index, inhibited A375 cell proliferation and migration capacity, reduced the levels of MMP and increased the levels of ROS, Ca2+, and apoptosis in A375, A375-STAT3-3C and A375-STAT3-NC cells in a dose-dependent manner. The effect of AG490 was more significant compared to cells without AG490, and the effect of A375-STAT3-NC cells was more significant than A375-STAT3-3C cells. ZYL-01 markedly increased the expression of Bax and cleaved caspase-3 and reduced Bcl-2 and p-STAT3. In conclusion, our results suggest that ZYL-01 could inhibit the activity of A375 cells by inducing cells apoptosis via inhibiting the STAT3 signaling pathway.
1 Introduction
Melanoma, a common skin malignancy originating from the malignant transformation of melanocytes in the basal layer of the skin epidermis, has high levels of invasiveness, metastasis, and recurrence rate along with poor prognosis.1–3 The World Health Organization estimates that nearly 130![[thin space (1/6-em)]](https://www.rsc.org/images/entities/char_2009.gif) 000 people are diagnosed with melanoma each year, and about 37
000 people are diagnosed with melanoma each year, and about 37![[thin space (1/6-em)]](https://www.rsc.org/images/entities/char_2009.gif) 000 people die from this disease annually.3 In recent years, melanoma research has been increasing, and its treatment relies mainly on the early surgical removal of malignant tissue, supplemented by chemotherapy and drug therapy, but success is limited by drug resistance, a high recurrence rate, and many side effects,4,5 and to date, there has been no completely effective treatment.6 Therefore, it is urgent to find a drug and method to effectively treat melanoma.
000 people die from this disease annually.3 In recent years, melanoma research has been increasing, and its treatment relies mainly on the early surgical removal of malignant tissue, supplemented by chemotherapy and drug therapy, but success is limited by drug resistance, a high recurrence rate, and many side effects,4,5 and to date, there has been no completely effective treatment.6 Therefore, it is urgent to find a drug and method to effectively treat melanoma.
Signal transducer and activator of transcription 3 (STAT3) is a cytoplasmic signaling molecule and nuclear transcription factor that binds to DNA and is involved in regulating tumor cell proliferation and differentiation, cell cycle disorders, inhibition of apoptosis, and suppression of immune responses.7,8 STAT3 plays a vital role in the development of melanoma by increasing the expression levels of anti-apoptotic and anti-proliferative genes, inhibiting the expression of tumor suppressor genes and the antitumor immune response, and promoting survival and proliferation of melanoma cells.9 STAT3 has been shown to be a therapeutic target for melanoma;2 thus, targeting and inhibiting its activation has become an attractive strategy for developing new treatments for melanoma.10
Imatinib has inhibitory effects on the proliferation of KIT-activated mutant melanoma cells and induces apoptosis.11 In this study, we used 2,4-dichloro-5-pyrimidinecarboxylate as a raw material through nucleophilic substitution, ester hydrolysis, amidation reactions, and other reactions to synthesize (R)-2-(butylamino)-N-(4-((4-methylpiperazine-1-yl) methyl) phenyl)-4-(piperidine-3-ylamino) pyrimidine-5-carboxamide (ZYL-01). We found that ZYL-01 has some structural similarities to imatinib, including 1,4-dimethylpiperazine, N-phenylacetamide, and N-methylpyrimidin-2-amine, and it was easy to synthesize under mild conditions. Therefore, human melanoma A375 cells were selected to explore the anti-melanoma activity of ZYL-01 and its related mechanism, which provides an experimental basis for the clinical treatment of melanoma.
2 Materials and methods
2.1 Cells
Human melanoma A375 cells were purchased from Procell Life Science & Technology Co., Ltd A375 cells transfected with a STAT3C expression construct (A375-STAT3-3C) or with an empty vector (A375-STAT3-NC) were donated by Hong Kong Baptist University.2.2 Synthesis of ZYL-01
The synthesis route of ZYL-01 is shown in Fig. 1. First (R)-3-aminopiperidine-1-carboxylate tert-butyl ester (2.10 g, 10.50 mmol) and DIEA (5.1 mL, 32.00 mol, 7087-68-5, Macklin) were added dropwise to a solution of thyl-2,4-dichloro-5-pyrimidinecarboxylate (2.33 g, 10.50 mmol, 51940-64-8, Bidepharm) in IPA (20 mL, 67-63-0, Hengxing). The mixture was stirred at room temperature for 4 h and the solvent was evaporated to obtain compound 1a. Then, 1a (3.18 g, 8.26 mmol) and n-butylamine (1.21 g, 16.50 mmol, 109-73-9, Macklin) were dissolved in DMF (3 mL). The mixture was stirred at 45 °C for 12 h. The resulting mixture was extracted with EtOAc (3×). The organic layers were combined and concentrated. The residue was purified by column chromatography to provide 1b (1.26 g, 62.0% over 2 steps). Next, 1b (1.50 g, 3.56 mmol) and KOH (1.79 g, 32.00 mmol) were added to the mixture of THF and H2O (10 mL, 3![[thin space (1/6-em)]](https://www.rsc.org/images/entities/char_2009.gif) :
:![[thin space (1/6-em)]](https://www.rsc.org/images/entities/char_2009.gif) 2, v/v), and the mixture was heated to 90 °C for 2 h. Then the reaction mixture was cooled to room temperature and acidified by a solution of HCl (4.0 N) to pH 3. The resulting mixture was extracted with DCM (4×). The combined organic layers were dried (Na2SO4) and concentrated to provide 1c (1.26 g, 90.0%). Subsequently, to a solution of 1c (1.00 g, 2.54 mmol), 4-(4-methylpiperazine-1-ylmethyl) aniline (0.68 g, 3.31 mmol, 70261-82-4, Bidepharm), TEA (0.70 mL, 5.10 mmol, 102-71-6, Jinan Century Tongda Chemical Co., Ltd) in anhydrous DMF was added HATU (1.93 g, 3.31 mmol, 148893-10-1, Shanghai Haohong Scientific Co., Ltd). The resulting mixture was stirred for 12 h at room temperature. Then water was added to the mixture and the mixture was extracted with EA (4×). The organic layers were combined and purified by column chromatography to obtain 1d (0.73 g, 60.0%). Finally, 1d (0.58 g, 1.00 mmol) was dissolved in a mixed solution of DCM (5 mL) and CF3COOH (5 mL) and then stirred at room temperature for 2 h. After completion of the reaction, the pH was adjusted to 8–9 with NaOH (10%) and the mixture was extracted with DCM (4×). The organic layers were combined and purified by column chromatography to obtain ZYL-01 (0.11 g, 65.1%). 1H NMR (500 MHz, MeOD) δ 8.41 (s, 1H), 7.53 (d, J = 8.5 Hz, 2H), 7.28 (d, J = 8.5 Hz, 2H), 4.13 (s, 1H), 3.49 (s, 2H), 3.39 (s, 2H), 3.25 (d, J = 10.6 Hz, 1H), 2.92 (dd, J = 8.6, 3.9 Hz, 1H), 2.62 (dd, J = 16.4, 6.5 Hz, 2H), 2.54 (s, 8H), 2.27 (s, 3H), 2.07 (s, 1H), 1.82–1.76 (m, 1H), 1.65–1.55 (m, 3H), 1.50 (d, J = 10.1 Hz, 1H), 1.41 (dd, J = 15.1, 7.4 Hz, 2H), 0.96 (t, J = 7.4 Hz, 3H). 13C NMR (126 MHz, MeOD) δ 166.80 (s), 156.41 (s), 137.78 (s), 132.63 (s), 129.63 (s), 120.90 (s), 61.92 (s), 54.24 (s), 52.06 (s), 50.03 (s), 45.15 (s), 44.57 (s), 40.55 (s), 31.58 (s), 30.26 (s), 24.11 (s), 19.80 (s), 12.92 (s); HRMS-EI m/z [M + H]+ calcd for C26H41N8O: 481.3403, found: 481.3401.
2, v/v), and the mixture was heated to 90 °C for 2 h. Then the reaction mixture was cooled to room temperature and acidified by a solution of HCl (4.0 N) to pH 3. The resulting mixture was extracted with DCM (4×). The combined organic layers were dried (Na2SO4) and concentrated to provide 1c (1.26 g, 90.0%). Subsequently, to a solution of 1c (1.00 g, 2.54 mmol), 4-(4-methylpiperazine-1-ylmethyl) aniline (0.68 g, 3.31 mmol, 70261-82-4, Bidepharm), TEA (0.70 mL, 5.10 mmol, 102-71-6, Jinan Century Tongda Chemical Co., Ltd) in anhydrous DMF was added HATU (1.93 g, 3.31 mmol, 148893-10-1, Shanghai Haohong Scientific Co., Ltd). The resulting mixture was stirred for 12 h at room temperature. Then water was added to the mixture and the mixture was extracted with EA (4×). The organic layers were combined and purified by column chromatography to obtain 1d (0.73 g, 60.0%). Finally, 1d (0.58 g, 1.00 mmol) was dissolved in a mixed solution of DCM (5 mL) and CF3COOH (5 mL) and then stirred at room temperature for 2 h. After completion of the reaction, the pH was adjusted to 8–9 with NaOH (10%) and the mixture was extracted with DCM (4×). The organic layers were combined and purified by column chromatography to obtain ZYL-01 (0.11 g, 65.1%). 1H NMR (500 MHz, MeOD) δ 8.41 (s, 1H), 7.53 (d, J = 8.5 Hz, 2H), 7.28 (d, J = 8.5 Hz, 2H), 4.13 (s, 1H), 3.49 (s, 2H), 3.39 (s, 2H), 3.25 (d, J = 10.6 Hz, 1H), 2.92 (dd, J = 8.6, 3.9 Hz, 1H), 2.62 (dd, J = 16.4, 6.5 Hz, 2H), 2.54 (s, 8H), 2.27 (s, 3H), 2.07 (s, 1H), 1.82–1.76 (m, 1H), 1.65–1.55 (m, 3H), 1.50 (d, J = 10.1 Hz, 1H), 1.41 (dd, J = 15.1, 7.4 Hz, 2H), 0.96 (t, J = 7.4 Hz, 3H). 13C NMR (126 MHz, MeOD) δ 166.80 (s), 156.41 (s), 137.78 (s), 132.63 (s), 129.63 (s), 120.90 (s), 61.92 (s), 54.24 (s), 52.06 (s), 50.03 (s), 45.15 (s), 44.57 (s), 40.55 (s), 31.58 (s), 30.26 (s), 24.11 (s), 19.80 (s), 12.92 (s); HRMS-EI m/z [M + H]+ calcd for C26H41N8O: 481.3403, found: 481.3401.
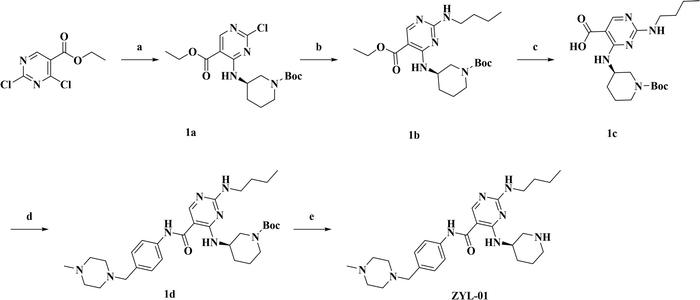 | ||
| Fig. 1 Synthetic roadmap for ZYL-01. (a) Isopropanol, rt.; (b) CH3(CH2)3NH2, DMF, 45 °C; (c) KOH, THF/H2O, 90 °C, 2 h; (d) DMF, HATU, rt.; (e) CF3COOH, DCM, rt. | ||
2.3 Cell culture
A375 cells were cultured in high glucose dulbecco's modified eagle's medium (DMEM, 2357125, Gibco) supplemented with 10% fetal bovine serum (FBS, 10270106, Gibco) and antibiotics (penicillin 66.7 mg L−1, streptomycin 100 mg L−1). A375-STAT3-NC and A375-STAT3-3C cells were cultured in DMEM supplemented with 10% FBS, antibiotics, and purinemycin (0.6 μg L−1, A1113802, Gibco) and maintained in a 5% CO2 and 37 °C environment. Logarithmic cells were taken for subsequent experiments.2.4 Determination of cell index by real-time cell analysis
A375 cells were seeded at a density of 4000 cells per well in a 16-well plate (CIM-Plate16, ACEA) and cultured for 24 h in a xCELLigence RTCA DP Instrument, then divided into a normal control group (CON) and ZYL-01 dosing group (1, 2, 4, 6, 8, 10, 20 μM). Cells were cultured for 48 h after treatment. The cell index was analyzed using the formula: (CON wells − dosing wells)/CON wells × 100%. The difference in cell index was compared between dosing wells and CON wells.2.5 Analysis of cell cycle by flow cytometry
A375 cells were seeded in a 6-well plate at a density of 1![[thin space (1/6-em)]](https://www.rsc.org/images/entities/char_2009.gif) 20
20![[thin space (1/6-em)]](https://www.rsc.org/images/entities/char_2009.gif) 000 cells per well. After overnight incubation, the cells were divided into a CON and ZYL-01 dosing group (1, 5 μM) and cultured for 24 and 48 h. Then, the effect of ZYL-01 on the cell cycle was detected using a Cell Cycle and Apoptosis Detection Kit (G1700, Servicebio) according to the instructions. Flow cytometry was performed using a FACS AriaIII (BD Biosciences) utilizing 10
000 cells per well. After overnight incubation, the cells were divided into a CON and ZYL-01 dosing group (1, 5 μM) and cultured for 24 and 48 h. Then, the effect of ZYL-01 on the cell cycle was detected using a Cell Cycle and Apoptosis Detection Kit (G1700, Servicebio) according to the instructions. Flow cytometry was performed using a FACS AriaIII (BD Biosciences) utilizing 10![[thin space (1/6-em)]](https://www.rsc.org/images/entities/char_2009.gif) 000 events.
000 events.
2.6 Cell migration assay
A375 cells were seeded at a density of 4000 cells per well on a 96-well plate, incubated overnight at 37 °C, and divided into CON group, ZYL-01 dosing group (1, 5 μM), and AG490 (10 μM) antagonist group (CON+, 1 μM+, 5 μM+) with normal medium and corresponding concentrations of ZYL-01. AG490 (HY-12000, MCE) was added 30 min before the ZYL-01 treatment. Then, the migration dynamics of the cells within 48 h were detected using a high-content imaging analysis system (Opera Phenix, PerkinElmer).2.7 Measurement of ROS levels by flow cytometry
A375, A375-STAT3-NC, and A375-STAT3-3C cells were seeded in 6-well plates at a density of 1![[thin space (1/6-em)]](https://www.rsc.org/images/entities/char_2009.gif) 20
20![[thin space (1/6-em)]](https://www.rsc.org/images/entities/char_2009.gif) 000 cells per well. A375 cells were divided into a CON group, ZYL-01 dosing group (1, 5 μM), and AG490 antagonistic group (CON+, 1 μM+, 5 μM+). A375-STAT3-NC and A375-STAT3-3C cells were divided into NC-CON, NC-1 (1 μM), NC-5 (5 μM), 3C-CON, 3C-1 (1 μM) and 3C-5 (5 μM) groups and cultured for 24 and 48 h after ZYL-01 treatment. The cells were collected and the effect of ZYL-01 on cellular reactive oxygen species (ROS) was detected by flow cytometry according to the instructions of the reactive oxygen species detection kit (CA1410, Solarbio)
000 cells per well. A375 cells were divided into a CON group, ZYL-01 dosing group (1, 5 μM), and AG490 antagonistic group (CON+, 1 μM+, 5 μM+). A375-STAT3-NC and A375-STAT3-3C cells were divided into NC-CON, NC-1 (1 μM), NC-5 (5 μM), 3C-CON, 3C-1 (1 μM) and 3C-5 (5 μM) groups and cultured for 24 and 48 h after ZYL-01 treatment. The cells were collected and the effect of ZYL-01 on cellular reactive oxygen species (ROS) was detected by flow cytometry according to the instructions of the reactive oxygen species detection kit (CA1410, Solarbio)
2.8 Measurement of mitochondria membrane potential levels by flow cytometry
After obtaining the cell samples in the above experiments, a JC-1 Mitochondrial Membrane Potential Detection Kit (G1515, Servicebio) was used to detect the mitochondria membrane potential (MMP) level according to the manufacturer's instructions by flow cytometry.2.9 Measurement of intracellular Ca2+ levels by flow cytometry
After obtaining the cell samples in the above experiments, the levels of Ca2+ were detected using Fluo-4, AM (F8500, Solarbio). The procedure was as follows. Cells were collected, washed with PBS, and centrifuged. After the supernatant was discarded, a 500 μL working solution (Fluo-4, AM 1 mg + Pluronic 1.65 mg + HBSS 200 μL) was added and incubated at 37 °C in the dark for 20 min. Then five volumes of HBSS containing 1% FBS were added and cultured for 40 min. The cells were then washed once with PBS and centrifuged. Then the supernatant was discarded, and the pellet was resuspended in PBS, and cultured at 37 °C for 10 min. The levels of Ca2+ within A375 cells were measured with flow cytometry.2.10 Measurement of apoptosis level by flow cytometry
After obtaining the cell samples in the above experiments, the level of apoptosis in the A375 cells was detected using a PE Annexin V/7-AAD Apoptosis Detection Kit (559763 BD) with flow cytometry.2.12 In-cell western assay
A375 cells were seeded at a density of 4000 cells per well on a 96-well plate. After 24 h of treatment, the supernatant was discarded and the cells were fixed in 3.7% paraformaldehyde at room temperature for 20 min. The cells were permeabilized with 0.1% Triton X-100 5 times and for 5 min each and then blocked in 5% bovine serum albumin (BSA, Genview) for 1.5 h. Then the cells were incubated overnight at 4 °C with the following antibodies: Bax (1![[thin space (1/6-em)]](https://www.rsc.org/images/entities/char_2009.gif) :
:![[thin space (1/6-em)]](https://www.rsc.org/images/entities/char_2009.gif) 100, ab32503, Abcam), Bcl-2 (1
100, ab32503, Abcam), Bcl-2 (1![[thin space (1/6-em)]](https://www.rsc.org/images/entities/char_2009.gif) :
:![[thin space (1/6-em)]](https://www.rsc.org/images/entities/char_2009.gif) 50, MA5-11757, Thermofisher), cleaved caspase-3 (1
50, MA5-11757, Thermofisher), cleaved caspase-3 (1![[thin space (1/6-em)]](https://www.rsc.org/images/entities/char_2009.gif) :
:![[thin space (1/6-em)]](https://www.rsc.org/images/entities/char_2009.gif) 1000, ab49822, Abcam), STAT3 (1
1000, ab49822, Abcam), STAT3 (1![[thin space (1/6-em)]](https://www.rsc.org/images/entities/char_2009.gif) :
:![[thin space (1/6-em)]](https://www.rsc.org/images/entities/char_2009.gif) 1000, #9139S, CST), p-STAT3 (1
1000, #9139S, CST), p-STAT3 (1![[thin space (1/6-em)]](https://www.rsc.org/images/entities/char_2009.gif) :
:![[thin space (1/6-em)]](https://www.rsc.org/images/entities/char_2009.gif) 2000, #9145S, CST), and GAPDH (1
2000, #9145S, CST), and GAPDH (1![[thin space (1/6-em)]](https://www.rsc.org/images/entities/char_2009.gif) :
:![[thin space (1/6-em)]](https://www.rsc.org/images/entities/char_2009.gif) 100, AC033, AbClonal). After washing with PBST, cells were incubated with goat anti-rabbit IgG (1
100, AC033, AbClonal). After washing with PBST, cells were incubated with goat anti-rabbit IgG (1![[thin space (1/6-em)]](https://www.rsc.org/images/entities/char_2009.gif) :
:![[thin space (1/6-em)]](https://www.rsc.org/images/entities/char_2009.gif) 500, 925-68071, Li-COR) or goat anti-mouse IgG (1
500, 925-68071, Li-COR) or goat anti-mouse IgG (1![[thin space (1/6-em)]](https://www.rsc.org/images/entities/char_2009.gif) :
:![[thin space (1/6-em)]](https://www.rsc.org/images/entities/char_2009.gif) 1000, 925-32210, Li-COR) secondary antibodies and incubated at room temperature for 1 h in the dark. Protein levels were quantitated using Image Studio version 5.2 (Clx, Li-COR).
1000, 925-32210, Li-COR) secondary antibodies and incubated at room temperature for 1 h in the dark. Protein levels were quantitated using Image Studio version 5.2 (Clx, Li-COR).
2.13 Molecular docking
The Chem Office was used to draw the three-dimensional (3D) structure of ZYL-01. The STAT3 protein 3D structure (No. 6NJS) was downloaded based on the PDB database. All docking simulations were performed using default parameters, and binding affinities were estimated by total scores. The docking process was performed by AutoDock 4 to analyze the binding properties of the ligands for each protein.2.14 Statistical analysis
The RTCA results were considered statistically significant if the difference in the cell index between the dosing well and normal well was greater than 10%. Other data were analyzed using SPSS26.0 software (IBM, NY). The results are presented as the mean ± standard deviation (SD) using the single factor analysis of variance (One-Way-ANOVA) between groups, and a p value lower than 0.05 was considered to be statistically significant.3 Results
3.1 ZYL-01 could reduce the A375 cell index
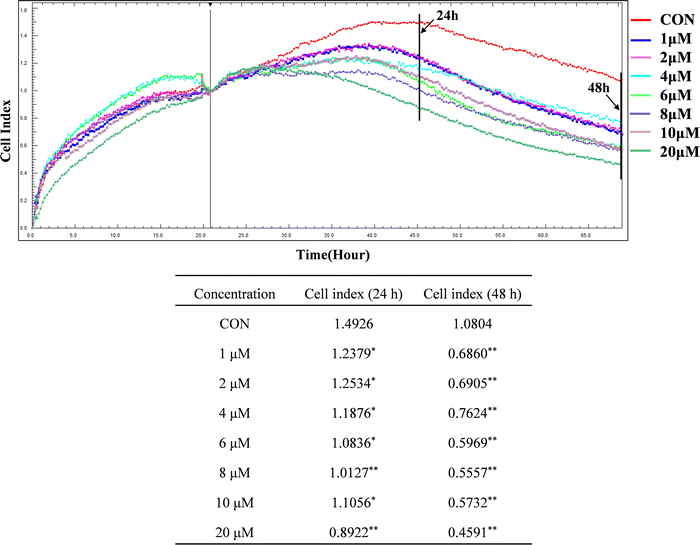
Compared with the CON group, the cell index of A375 was significantly decreased after treatment with ZYL-01 in a time-dependent manner. In addition, we found that the A375 cell index was reduced by ZYL-01 at a concentration of 1 μM at 24 and 48 h, and slightly increased as the concentration increased. It decreased again when the concentration of ZYL-01 reached 4 μM at 24 h and 6 μM at 48 h. Therefore, in subsequent experiments, cells were treated with 1 and 5 μM at 24 and 48 h (Fig. 2).3.2 ZYL-01 could inhibit A375 cell proliferation and migration by mediating STAT3
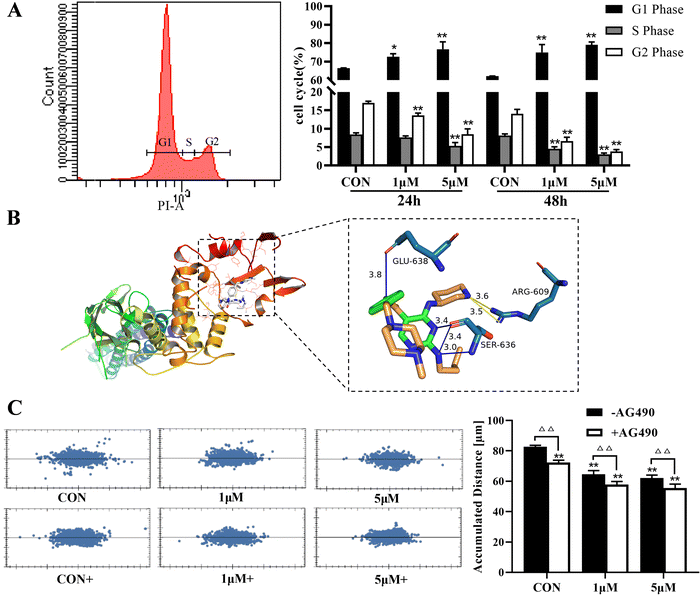
The effect of ZYL-01 on the A375 cell cycle was detected by flow cytometry, as shown in Fig. 3A. After treatment with ZYL-01, the proportion of cells in the G1 phase significantly increased, whereas the proportion of cells in the S phase significantly decreased in a dose-dependent manner. In addition, the results of molecular docking showed that ZYL-01 was buried in the binding capsule of STAT3 with a binding energy of −5.3 kcal mol−1. The acceptor–ligand interaction analysis showed that ZYL-01 could form six hydrogen bonds with ARG-609, GLU-638 and SER-636 in STAT3, with exact bond lengths of 3.6, 3.5, 3.8, 3.4, 3.4 and 3.0 Å, respectively (Fig. 3B). ZYL-01 significantly inhibited the migration ability of A375 cells and reduced cell displacement, and the effect of adding AG490 was more significant compared with no AG490 treatment (Fig. 3C).3.3 ZYL-01 could increase ROS levels in A375 cells
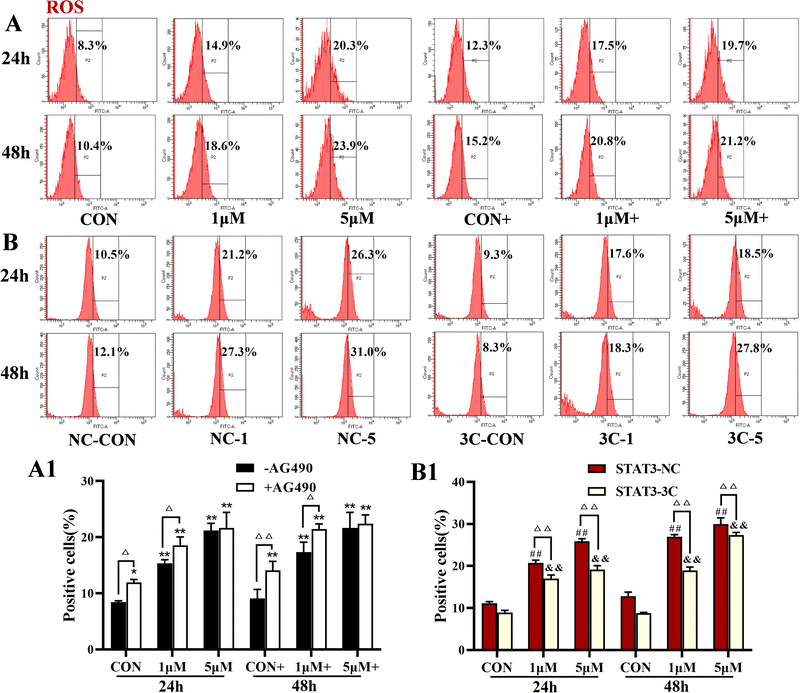
The levels of ROS were detected by flow cytometry, and the results are shown in Fig. 4. ZYL-01 significantly increased the levels of ROS and exhibited a dose-dependent relationship. In addition, the effect of adding AG490 was more significant compared with no AG490 treatment in A375 cells, and the levels of ROS in A375-STAT3-NC cells were more affected by ZYL-01 compared with A375-STAT3-3C cells.3.4 ZYL-01 could reduce MMP levels in A375 cells
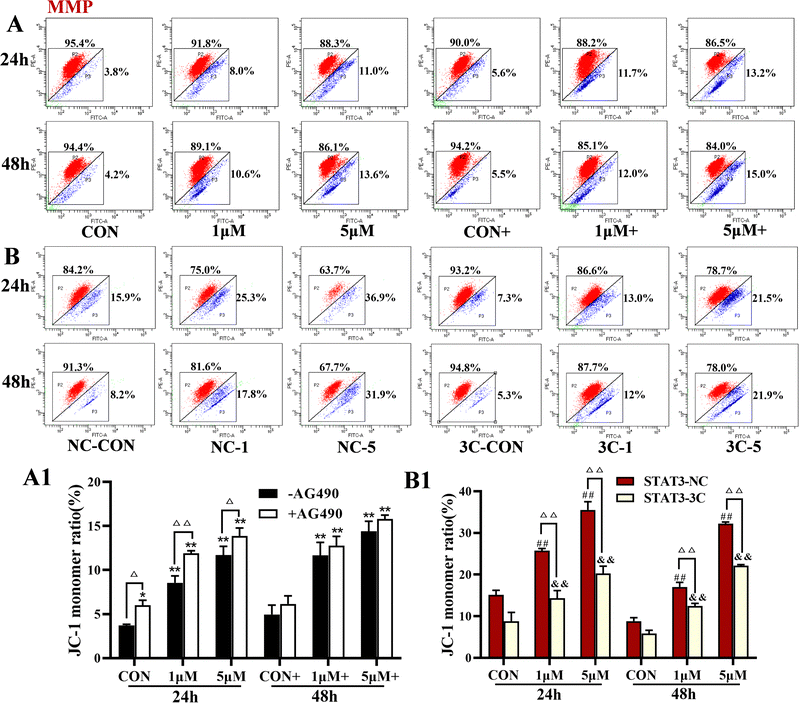
The levels of MMP were detected by flow cytometry, and the results are shown in Fig. 5. ZYL-01 significantly reduced the MMP levels compared with the CON group in a dose-dependent manner. In addition, the effect of AG490 was more significant compared with no AG490 treatment in the A375 cells, and the MMP levels in the A375-STAT3-NC cells were more affected by ZYL-01 compared with the A375-STAT3-3C cells.3.5 ZYL-01 could increase Ca2+ levels in A375 cells
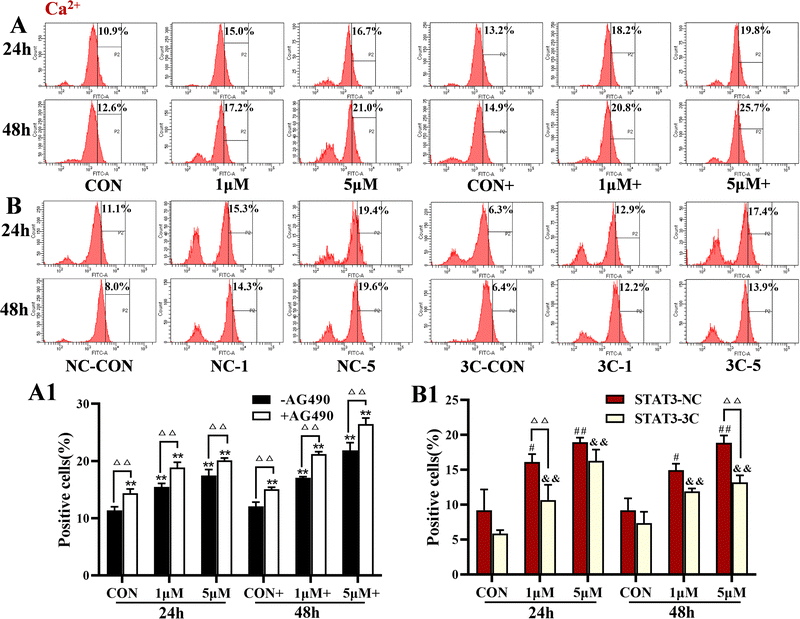
Analysis of intracellular Ca2+ levels showed that ZYL-01 significantly increased the levels of Ca2+ compared with the CON group in a dose-dependent manner. In addition, the effect of adding AG490 was more significant compared with no AG490 treatment in the A375 cells, and the Ca2+ levels in the A375-STAT3-NC cells were more affected by ZYL-01 compared with A375-STAT3-3C cells (Fig. 6).3.6 ZYL-01 could increase the level of apoptosis in A375 cells
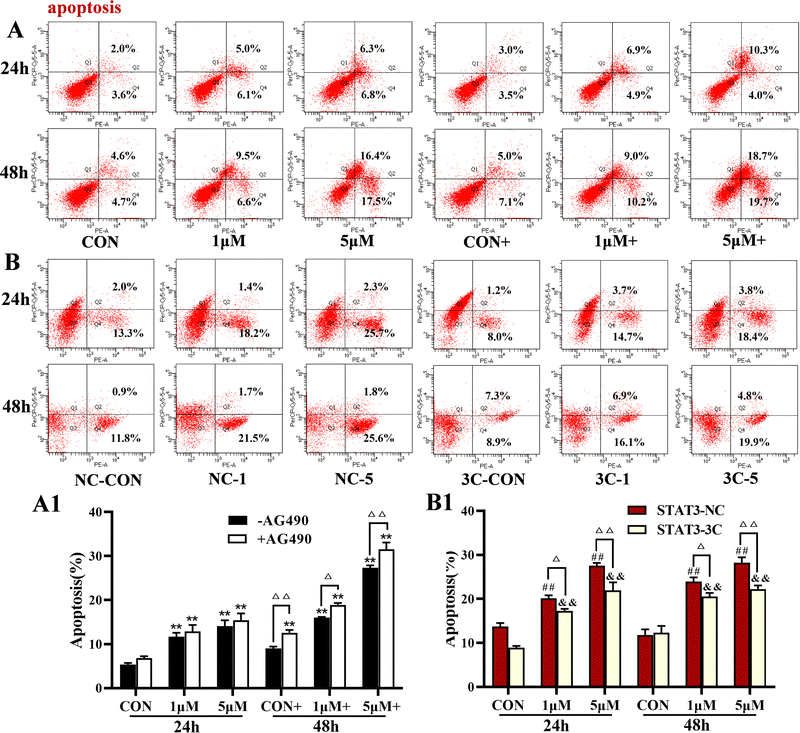
The levels of apoptosis were detected by flow cytometry (Fig. 7). The results showed that ZYL-01 significantly increased the apoptosis level compared with the CON group in a dose-dependent manner. In addition, the effect of adding AG490 was more significant compared with no AG490 treatment in the A375 cells, and the levels of apoptosis of A375-STAT3-NC cells were more affected by ZYL-01 compared with A375-STAT3-3C cells.3.7 ZYL-01 could induce apoptosis by inhibiting the activity of STAT3
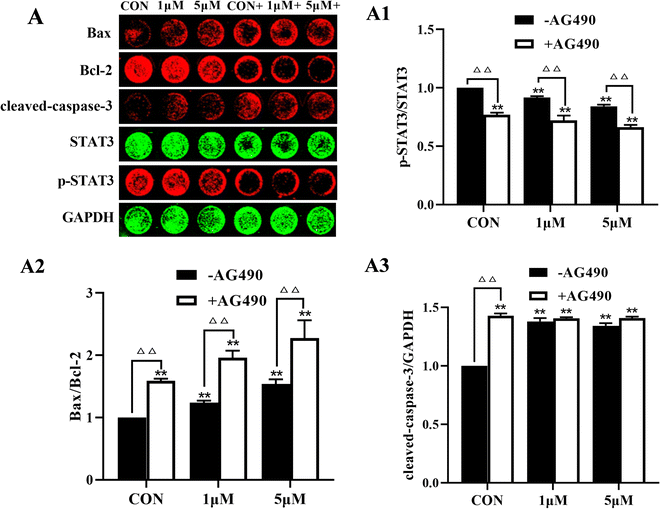
To further clarify the role of STAT3 in the anti-melanoma effect of ZYL-01, we detected apoptosis and STAT3 signaling pathway-related proteins in A375 cells. ZYL-01 significantly increased the levels of Bax and cleaved caspase-3 and reduced the levels of Bcl-2 and p-STAT3. The effect of adding AG490 was more significant compared with no AG490 treatment (Fig. 8).4 Discussion
Melanoma is the most lethal and invasive form of skin cancer, with increasing annual levels of morbidity and mortality worldwide, and is one of the most malignant tumors seriously threatening human health.12 Current treatment methods include surgical resection, immunotherapy, and drug chemotherapy, but their success has been limited by the high metastasis rate, drug resistance, and many adverse effects.13,14 Therefore, there is an urgent need to find drugs with low toxicity and good efficacy to improve the survival rate of melanoma patients. In this study, human melanoma A375 cells were selected, and the anti-melanoma effect and related mechanism of ZYL-01 were discussed based on STAT3 and apoptosis.Dysregulation of the cell cycle can cause uncontrolled cell proliferation, genomic instability, and tumorigenesis.15 In the cell cycle experiment, it was found that the proportion of cells staying in the G1 stage significantly increased after ZYL-01 treatment, and the proportion of cells in the S phase significantly decreased in a dose-dependent manner. These results suggested that ZYL-01 can inhibit cell proliferation by inducing A375 cells to stay in the G1 phase. Tumor migration and invasion are important mechanisms for tumor metastasis,16 and the difficulty in treating malignant melanoma is that it easily metastasizes and spreads remotely.13 Cell migration experiments showed that ZYL-01 significantly inhibited the migration of A375 cells in a dose-dependent manner, and treatment with the antagonist AG490 and in combination with ZYL-01 exerted the same effect. These data suggest that ZYL-01 may play a similar role as the AG490 antagonist. AG490 is a tyrosine kinase inhibitor that selectively inhibits activation of the STAT3 signaling pathway,17 suggesting that ZYL-01 may play an inhibitory role in inhibiting A375 cell migration by inhibiting activation of the STAT3 pathway.
Apoptosis, the programmed death of cells, plays an important role in tumor progression and drug resistance14 and a mechanism of action of many chemotherapeutic drugs against tumors is to induce apoptosis.18 ROS is a general term for a class of active oxygen-containing compounds produced by the aerobic metabolism of organisms. Mitochondria are the main sites where ROS are produced,19 and an increase in ROS can lead to a decrease in MMP and cause apoptosis.20 In addition, ROS can act on phospholipase A2 on cell membranes, causing intracellular Ca2+ release or Ca2+ inflow, which in turn promotes ROS production.21 In this study, we demonstrated that ZYL-01 significantly increased ROS and Ca2+ levels in A375 cells, significantly reducing the MMP, and induced apoptosis in a dose-dependent manner. The changes in A375 cells were in line with the antagonist AG490 of STAT3 and compound combinations. STAT3 is an important abnormal molecule in tumorigenesis and development,7 and in melanoma, activation of the STAT3 signaling pathway induces angiogenesis, cell proliferation, migration, and survival.22 Inhibition of STAT3 significantly inhibits the growth of tumor cells and induces their apoptosis.23 In this study, ROS, Ca2+, MMP, and apoptotic levels of A375 cells both with the successful transfection of the STAT3 overexpression vector and those without sequenced plasmid vector were detected, and the results were consistent with those of normal A375 cells. More importantly, cells without sequenced plasmid vectors had a better ability than those transfected with STAT3C overexpression vectors. Overexpression of STAT3 increased the apoptosis level, indicating that the ability of ZYL-01 to induce apoptosis is stronger than the ability of STAT3 to inhibit apoptosis. Studies have shown that Bax as a pro-apoptotic member results in apoptosis. The activation of caspase-3 makes apoptosis an irreversible state. In addition, STAT3 activation resulted in dimer formation and translocation to the nucleus to induce the expression of Bcl-2.24,25 We found that ZYL-01 promoted the expression of Bax and cleaved caspase-3, and reduced the expression of Bcl-2 and p-STAT3/STAT3, which suggest that ZYL-01 can exert anti-melanoma effects by inhibiting the activation of STAT3 and increasing the apoptosis level of A375 cells.
In summary, ZYL-01 was found to be able to exert anti-melanoma effects by inhibiting A375 cell apoptosis, which may be related to inhibition of the STAT3 signaling pathway. Among them, the choice of treatment depends on the severity of disease symptoms and the associated illness, adherence, and side effects. Therefore, comparison of the efficacy, safety and acceptability of ZYL-01 in melanoma and the optimization of its structure need further study. In order to further uncover the underlying mechanisms of melanoma treatment, future work may include further investigation and validation of the biological processes involved through in-depth cell model studies and in vivo validation in animals.
Author contributions
Ru Wang and Bo Yang: data curation, formal analysis, methodology, validation, writing – original draft, and writing – review & editing. Beibei Zhang: formal analysis, methodology, validation, and writing – review & editing. Qinqin Zhang: data curation, methodology, validation, and writing – review & editing. Bing Cao and Jufang Jia: investigation, methodology, and resources. Meng Liu, Pengli Guo and Yuhan Zhang: methodology and resources. Xiaokun Li: methodology, resources, and writing – review & editing. Xiaoke Zheng and Weisheng Feng: funding acquisition, methodology, project administration, resources, supervision, validation, and writing – review & editing.Conflicts of interest
The authors declare no competing financial interest.Acknowledgements
This work was supported by the National Key Research and Development Project (The Major Project for Research of the Modernization of TCM): (2017YFC1702800, 2019YFC1708802), Henan province high-level personnel special support “ZhongYuan One Thousand People Plan”-Zhongyuan Leading Talent (ZYQR201810080), the Study on the key technology for quality control and the key characteristics of Rehmannia glutinosa, Dioscorea opposita Thunb and Achyranthes bidentata Blume from Henan Province (171100310500), and the Henan Province Traditional Chinese Medicine Scientific Research Project (20-212Y2152).Notes and references
- Y. Yu, D. Ladeiras, Y. Xiong, K. F. Boligan, X. Liang, S. von Gunten, R. E. Hunger, X. F. Ming and Z. Yang, J. Cell. Physiol., 2020, 235, 9997–10011 CrossRef CAS PubMed.
- R. Xu, M. Zeng, Y. Wu, S. Wang, B. Zhang, J. Zhang, Y. Kan, B. Li, B. Cao, X. Zheng and W. Feng, OncoTargets Ther., 2021, 14, 3487–3501 CrossRef.
- F. Gwadry-Sridhar, S. Nikan, A. Hamou, S. J. Seung, T. Petrella, A. M. Joshua, S. Ernst and N. Mittmann, Curr. Oncol., 2017, 24, 168–175 CrossRef CAS PubMed.
- B. Deng, X. L. Jiang, Z. B. Tan, M. Cai, S. H. Deng, W. J. Ding, Y. C. Xu, Y. T. Wu, S. W. Zhang, R. X. Chen, J. Kan, E. X. Zhang, B. Liu and J. Z. Zhang, Phytother. Res., 2021, 35, 3836–3847 CrossRef CAS.
- G. B. da Silva, M. A. Yamauchi, D. Zanini and M. D. Bagatini, Purinergic Signalling, 2022, 18, 61–81 CrossRef CAS PubMed.
- Y. H. Luo, J. Q. Li, Y. Zhang, J. R. Wang, W. T. Xu, Y. Zhang, Y. C. Feng, S. Z. Li and C. H. Jin, Drug Dev. Res., 2019, 80, 1040–1050 CrossRef CAS.
- H. Meng, Y. Pang, G. Liu, Z. Luo, H. Tan and X. Liu, J. Dermatol. Sci., 2020, 100, 201–208 CrossRef CAS PubMed.
- P. K. Raut, H. S. Lee, S. H. Joo and K. S. Chun, Food Chem. Toxicol., 2021, 157, 112604 CrossRef CAS PubMed.
- M. Berkoz, F. Ozkan-Yilmaz, A. Ozluer-Hunt, M. Krosniak, O. Turkmen, D. Korkmaz and S. Keskin, Pharmacol. Rep., 2021, 73, 650–663 CrossRef CAS PubMed.
- S. Momtaz, K. Niaz, F. Maqbool, M. Abdollahi, L. Rastrelli and S. M. Nabavi, BioFactors, 2017, 43, 347–370 CrossRef CAS PubMed.
- X. Wei, L. Mao, Z. Chi, X. Sheng, C. Cui, Y. Kong, J. Dai, X. Wang, S. Li, B. Tang, B. Lian, X. Yan, X. Bai, L. Zhou, J. Guo and L. Si, Oncol. Res., 2019, 27, 495–501 CrossRef PubMed.
- W. Liu, X. Liu, Z. Pan, D. Wang, M. Li, X. Chen, L. Zhou, M. Xu, D. Li and Q. Zheng, Biomolecules, 2019, 9, 275 CrossRef PubMed.
- C. J. Chang, Y. L. Hung, T. C. Chen, H. J. Li, Y. H. Lo, N. L. Wu, D. C. Chang and C. F. Hung, Biomolecules, 2021, 11, 1039 CrossRef CAS PubMed.
- J. Chen, W. Zhang, C. Pan, J. Fan, X. Zhong and S. Tang, Life Sci., 2021, 271, 119185 CrossRef CAS.
- Y. Liu, X. Kang, G. Niu, S. He, T. Zhang, Y. Bai, Y. Li, H. Hao, C. Chen, Z. Shou and B. Li, Artif. Cells, Nanomed., Biotechnol., 2019, 47, 626–635 CrossRef CAS PubMed.
- L. Si, X. Yan, W. Hao, X. Ma, H. Ren, B. Ren, D. Li, Z. Dong and Q. Zheng, Oncol. Rep., 2018, 39, 2160–2170 CAS.
- Y. Zhou, Y. Sun, W. Hou, L. Ma, Y. Tao, D. Li, C. Xu, J. Bao and W. Fan, Int. J. Mol. Med., 2020, 46, 191–200 CrossRef CAS PubMed.
- B. F. Yan, X. Chen, J. Liu, S. J. Liu, J. Z. Zhang, Q. Q. Zeng and J. A. Duan, Folia Biol., 2021, 67, 108–117 CAS.
- J. Park, G. An, W. Lim and G. Song, Pestic. Biochem. Physiol., 2022, 181, 105011 CrossRef CAS PubMed.
- L. Amaral-Machado, W. N. Oliveira, E. N. Alencar, A. K. M. Cruz, H. A. O. Rocha, K. Ebeid, A. K. Salem and E. S. T. Egito, Biomed. Pharmacother., 2019, 117, 109103 CrossRef CAS PubMed.
- L. Liu, X. Sun, Y. Guo and K. Ge, Chem. – Biol. Interact., 2022, 351, 109756 CrossRef CAS PubMed.
- T. Yang, L. Wei, X. Ma and H. Ke, J. Recept. Signal Transduction Res., 2021, 41, 99–104 CrossRef CAS PubMed.
- W. Shen, C. Chen, Y. Guan, X. Song, Y. Jin, J. Wang, Y. Hu, T. Xin, Q. Jiang and L. Zhong, Int. J. Biol. Macromol., 2017, 104, 681–686 CrossRef CAS PubMed.
- D. E. Johnson, R. A. O'Keefe and J. R. Grandis, Nat. Rev. Clin. Oncol., 2018, 15, 234–248 CrossRef CAS.
- Z. Changizi, A. Moslehi, A. H. Rohani and A. Eidi, J. Biochem. Mol. Toxicol., 2021, 35, e22642 CrossRef CAS.
Footnote |
| † These authors contributed equally. |
| This journal is © The Royal Society of Chemistry and the Centre National de la Recherche Scientifique 2023 |

