
Exotic magnetic properties in Zintl phase BaVSe3: a theoretically supported experimental investigation†
Chinnu V.
Devan
ab,
Anoop A.
Nair
 c,
Ramany
Revathy
de,
Biswapriya
Deb
*ab and
Manoj Raama
Varma
*bd
c,
Ramany
Revathy
de,
Biswapriya
Deb
*ab and
Manoj Raama
Varma
*bd
aPhotosciences and Photonics, Chemical science and Technology Division, CSIR-National Institute for Interdisciplinary Science and Technology (NIIST), Thiruvananthapuram-695019, Kerala, India
bAcademy of Scientific and Innovative Research (AcSIR), Ghaziabad-201002, India. E-mail: manoj@niist.res.in; biswapriya.deb@niist.res.in; Fax: +91-471-2491712; Tel: +91-471-2515478 Tel: +91-471-2515377
cSchool of Physics (SoP), Indian Institute of Science Education and Research, Thiruvananthapuram-695551, Kerala, India
dMaterials Science and Technology Division, CSIR-National Institute for Interdisciplinary Science and Technology (NIIST), Thiruvananthapuram-695019, Kerala, India
eDepartment of Physics, St. John's College, Anchal, Kollam, Kerala, India
First published on 30th November 2022
Abstract
The magnetic properties of Zintl phase barium vanadium selenide (BaVSe3) were investigated experimentally and theoretically. BaVSe3, synthesized through a solid-state route, crystallized into a hexagonal structure with the space group p63/mmc. A secondary phase of barium selenide (BaSe3) was also formed during the synthesis along with BaVSe3. The BaVSe3 crystal system exhibited a Curie temperature (TC) of 40.81 K. Exotic magnetic phenomena like the glassy nature and the Griffiths-like phase were observed in BaVSe3 for the first time. The experimentally observed effective magnetic moment was less than the spin-only moment due to the nonmagnetic secondary phase. The crystal structure, lattice parameters, DOS, spin-polarized charge density calculations, TC and effective magnetic moment were theoretically studied using density functional theory (DFT) as implemented in Quantum ESPRESSO and via the atomistic simulation code VAMPIRE. DFT and atomistic simulations give an insight into the localization of magnetic moment on the V4+ ions, the metallic nature, and the occurrence of ferromagnetism in BaVSe3 which has been observed experimentally.
1. Introduction
Zintl phases are a special class of complex structures with the general formula A–T–Q, where A is an alkali metal or an alkaline earth metal, T is a transition metal, and Q is the main group element.1 These intermetallic phases satisfy the Zintl–Klemm concept in which the electropositive atoms act as electron donors and electronegative atoms act as valence-electron acceptors. This donor–acceptor system leads to a valence-balanced condition.2 Transition metal compounds exhibit a paramagnetic (PM) to ferromagnetic (FM) transition at particular temperatures, leading to some exciting phenomena like colossal magnetoresistance (CMR)3 due to the critical FM fluctuations about TC.4 This property finds applications in device components like the magnetic reading head. CMR was initially observed in manganese-based oxides and recent reports suggest its presence in alloys and chalcogenides.5,6BaVSe3, having a hexagonal perovskite-like structure with the general formula BaVX3 (with X = S, Se), satisfies the Zintl–Klemm concept.7 Among the above-mentioned BaVX3 compounds, BaVS3 has been extensively studied.8 BaVS3 shows a metal to insulator transition at a temperature of 70 K, a hexagonal to orthorhombic structural transition at 240 K and antiferromagnetic (AFM) ordering below 30 K.7 The selenium (Se) ions, being larger than the sulphur (S) ions, lead to orbital overlap in BaVSe3 and generate a condition synonymous to one where BaVS3 is under high pressure.9 BaVSe3 exhibits a structural transition from hexagonal to orthorhombic at a temperature of ∼310 K.10,11
Ternary chalcogenides with the general formula BaMX3 (M = Ti, V, Nb or Ta and X = S or Se) exhibit a quasi-one-dimensional structure. At room temperature, BaVS3 crystallizes in the CsNiCl3 structure having a space group of p63/mmc with a linear chain of vanadium atoms formed by the face sharing of VS6 octahedra. In this structure the unidimensionality arises from the short intrachain V–V (vanadium–vanadium) distance (2.805 Å) and a long interchain V–V separation (6.724 Å).12 The ideal quasi-one-dimensional nature is represented by vanadium ion chains that are slightly distorted, forming a zig-zag pattern along the crystallographic c axis. BaVSe3 also exhibits a metallic ferromagnetic nature and is considered to be an example of an itinerant electron magnet possessing a 1D structure;13 hence its primary application is in the field of spintronics.14 Sugiyama et al. reported that the V moments align ferromagnetically along the c-axis but they slightly canted towards the a-axis by 28° and are coupled antiferromagnetically.15 Recently, several studies have been conducted on the spin-glass behavior and the long-range AFM ordering in dilute metallic alloys and layered transition metal chalcogenides.16–19 Magnetic materials with glassy behavior are characterized by randomness, competing interactions and geometrical frustrations, which lead to the freezing of magnetic moments below a temperature denoted as the freezing temperature (Tf).20 These metastable ground states are structurally similar to the glassy state.21
Materials exhibiting glassy behavior are categorized into several classes based on the observed density of magnetic moments. Canonical spin-glass (SG) materials exhibit a small magnetic moment density and can be considered as single magnetic impurities being dispersed in a nonmagnetic host. These materials indicate a phase transition that is brought about due to the strong interaction and cooperative spin freezing present in them. These magnetic systems have some frozen-in structural disorder and do not have any well-defined long-range order as observed in FM and AFM systems. These systems exhibit a freezing transition with order in which the spins are correlated to form clusters which are oriented in random directions.22 Cluster glass (CG) materials exhibit large magnetic moment densities, resulting from local magnetic moment and frustration between the neighboring magnetic clusters.21 This state can be distinguished from SG by the presence of clusters originating due to short-range magnetic ordering at temperatures near TC.22 When the density of magnetic moments of a material overcomes the glassy limit, it results in long-range magnetic order. Such magnetic materials exhibit a transition from the PM state to an ordered state at a transition temperature before the glassy appearance at Tf. The PM, SG and CG states lack the long-range magnetic ordering.20–23
Nowadays intense research and development (R&D) is underway to understand the Griffiths-like phase (GP) observed in different magnetic materials.24 Griffith first observed the GP in randomly diluted Ising ferromagnetic systems. In such systems, magnetization fails to be an analytical function of magnetic field at temperatures between the Curie–Weiss temperature and the Griffiths temperature.25 The reasons for the origin of the GP vary from one material to another, some of which are phase separation, the presence of cluster sizes ranging from nanometers to micrometers and competition for intra–interlayer magnetic interactions.26 In most of the materials the GP arises due to the occurrence of short-range ordered FM clusters in the PM region.27 In manganese oxide-based materials,28 quenched disorder plays an essential role in GP formation. In the case of 4f electron alloys29 the origin of the GP is associated with inherent disorder and competition between the Ruderman–Kittel–Kasuya–Yosida (RKKY) interaction and the Kondo effect.
In the present investigation, we synthesized polycrystalline Zintl phase BaVSe3 with BaSe3 as the secondary phase through a solid-state method and carried out detailed structural and magnetic investigations. The present study establishes the glassy behavior of BaVSe3 with the secondary phase of BaSe3 for the first time. The GP is another area of interest in the present system. The existence of this phenomenon is established through different magnetic property evaluation techniques. In addition to experimental techniques, we also employ DFT and atomistic simulations to probe the electronic and magnetic nature of the material. The band structure, density of states, effective magnetic moment and the Curie temperature of the synthesized material were theoretically investigated through DFT analysis.
2. Experimental section
2.1. Synthesis
Polycrystalline BaVSe3 was synthesized via a solid-state reaction route using the precursors Ba, V and Se. The components of the precursors, i.e., Ba rods (99.99%), V pieces (99.7%) and Se granules (99.999%), were purchased from Alfa Aesar. The synthesis was done in three steps: at first Ba and Se were weighed in a 1![[thin space (1/6-em)]](https://www.rsc.org/images/entities/char_2009.gif) :1 ratio under a nitrogen atmosphere in a glove box with 1 ppm oxygen level and moisture level, sealed under vacuum (10−4 Torr) in quartz tubes and annealed at 600 °C for 2 days. In the second step VSe2 was prepared via the same solid-state route, with a heat treatment of the evacuated and sealed quartz tube at 750 °C for 8 days. The obtained pieces were ground and then subjected to recrystallization for an extended duration of 8 days at 750 °C. The synthesized material from the first step and VSe2 were mixed with Se in the required stoichiometry in a glove box with ideal conditions and sealed under vacuum in quartz tubes. The tubes were then heated at 950 °C for 100 hours. The obtained powder was crushed and pelletized for characterization using various techniques.
:1 ratio under a nitrogen atmosphere in a glove box with 1 ppm oxygen level and moisture level, sealed under vacuum (10−4 Torr) in quartz tubes and annealed at 600 °C for 2 days. In the second step VSe2 was prepared via the same solid-state route, with a heat treatment of the evacuated and sealed quartz tube at 750 °C for 8 days. The obtained pieces were ground and then subjected to recrystallization for an extended duration of 8 days at 750 °C. The synthesized material from the first step and VSe2 were mixed with Se in the required stoichiometry in a glove box with ideal conditions and sealed under vacuum in quartz tubes. The tubes were then heated at 950 °C for 100 hours. The obtained powder was crushed and pelletized for characterization using various techniques.
2.2. Characterization techniques
The crystal structure of the synthesized BaVSe3 was analyzed by utilizing the powder X-ray diffraction technique (XRD, Bruker D8 Advance diffractometer) using Cu-Kα radiation with a wavelength of 1.5406 Å in the 2θ range of 10°–90° with a step size of 0.005°. The Rietveld refinements of the XRD patterns were done by using GSAS-EXPGUI software. The elemental analysis was carried out using X-ray photoelectron spectroscopy (PHI 5000 Versaprobe II) and the peaks were fitted by using Multi-Pak software. Magnetic measurements were carried out using a vibrating sample magnetometer (VSM) attached to the physical property measurement system (PPMS DynaCool, Quantum Design, USA).2.3. Computational details
The spin-polarized DFT calculations are carried out using Quantum ESPRESSO, the plane-wave pseudopotential (PW + PP) code. The converged values for the K-point grid, the kinetic energy cut-off of the wave function and the kinetic energy cut-off for charge density are 8 × 8 × 8, 80 Ry and 640 Ry, respectively, and are used in conducting the SCF (self-consistent field) calculations. The approximation involved was the GGA-PBE (generalized gradient approximation-Perdew–Burke–Ernzerhof) exchange–correlation functional with the KJPAW (Kresse–Joubert projector augmented wave) pseudopotential. The GGA-KJPAW pseudopotential is acquired from the Quantum ESPRESSO repository of pseudopotentials and is used for our calculations as it is reasonably accurate and inexpensive in terms of the computational power required. The denser grid for NSCF (non-self-consistent field) calculations is taken to be 16 × 16 × 16. The geometry is relaxed using the BFGS (Broyden–Fletcher–Goldfarb–Shanno) algorithm. The constraint involved keeping the lattice parameters (a, b, c, α, β and γ) equal to the ones obtained from the XRD measurement and moving the ions so as to obtain the minimum energy structure with the forces on the atoms reduced (shown in Fig. S1, ESI†). The electronic structure calculated via DFT resembles the experimentally obtained lattice and at the same time the relaxation (by varying the positions of atoms) minimizes the effect of strains that may exist in the unit cell. The DFT+U methodology, which is based on the Hubbard model, can be used to reduce the electron delocalization, but we were not able to tune the U parameter based on an experimentally observed physical quantity (like the bandgap). Since the system is metallic, the DFT+U methodology was not followed in our simulations. The Curie temperature is simulated via the atomistic simulation code VAMPIRE which implements the 3D Heisenberg model.The atomistic spin model used in VAMPIRE is based on the spin Hamiltonian, which describes the fundamental spin-dependent interactions at the atomic level (neglecting the effects of potential and kinetic energy and electron correlations). The spin Hamiltonian is defined as

3. Results and discussion
3.1. Crystal structure
The indexed XRD spectra of the synthesized BaVSe3 are shown in Fig. S2 in the ESI,† and the Rietveld refined XRD pattern is shown in Fig. 1(a). The existence of the secondary phase of BaSe3 is also evident from the XRD data. | ||
| Fig. 1 (a) Rietveld refined XRD pattern of BaVSe3 and (b) a graphical representation of the BaVSe3 unit cell obtained from the refined XRD data. | ||
Hulliger et al.30 reported the formation of BaSe3 from its constituent elements at temperatures between 500 °C and 700 °C and remained stable even after prolonged heat treatment. The presence of secondary phases is common in solid-state synthesized materials from constituent elements.31 The primary phase BaVSe3 belongs to the hexagonal crystal system with a space group of p63/mmc and the other phase, BaSe3, belongs to the tetragonal system with a space group of p421m. The goodness of fit factor of the refinement (χ2) is obtained as 1.66. The lattice parameters of BaVSe3 are a = b = 6.9944 Å and c = 5.8577 Å. The α, β and γ angles are 90°, 90°, and 120°, respectively. From the Rietveld refinement, the phase fraction obtained for BaVSe3 is 76.21% and for the secondary phase it is 23.79%. A crystallographic information file (CIF) is created from the Rietveld refined XRD data using the software Crystal Maker (version 2.7.3). A graphical representation with the labeling of Ba, V and Se is shown in Fig. 1(b), where the barium, vanadium and selenium (Se) ions are labeled with purple, red and orange spheres, respectively. The Wyckoff symbols and the initial fractional coordinates are given in Table 1. The structure from the CIF file is subjected to constrained relaxation prior to conducting the DFT calculations. The procedure for the same is detailed in the ESI.†
| Atoms | Wyckoff symbols | x coordinate | y coordinate | z coordinate |
|---|---|---|---|---|
| Ba | 2c | 0.33333 | 0.66667 | 0.25 |
| Se | 6h | 0.82735 | 0.65470 | 0.25 |
| V | 2a | 0 | 0 | 0 |
3.2. X-ray photoelectron spectroscopy
X-ray photoelectron spectroscopy (XPS) studies of polycrystalline BaVSe3 were carried out to observe the oxidation state and chemical composition of the sample. The binding energies are corrected with the reference energy of 284.60 eV (C 1s). Fig. 2(a)–(c) shows the peak fitted high-resolution spectra of Ba, V, and Se, respectively. Fig. 2(a) depicts the deconvolution of the Ba 3d5/2 peak, fitted with two curves at binding energies of 781.27 eV and 779.35 eV, representing the Ba2+ and Ba0 states, respectively.32 In BaVSe3, vanadium exists in the V4+ state; however, the presence of V5+ may indicate the surface oxidation33 and the formation of V2O5 on the top 5 nm layer of BaVSe3. However, the presence of V2O5 is not observed in XRD, indicating that the formation of V2O5 is negligible and does not influence the properties of the considered system. Fig. 2(c) shows the deconvoluted spectra of Se. It has a lower binding energy of 54.36 eV due to Se ions (Se2−)32 and a higher binding energy of 55.90 eV corresponding to the Se0 state.32 Hulliger et al.30 reported that BaSe3 has the ionic formula of Ba2+Se0Se21−, where Se0 corresponds to the formation of the secondary phase, BaSe3, and is confirmed by the Rietveld refinement of XRD spectra.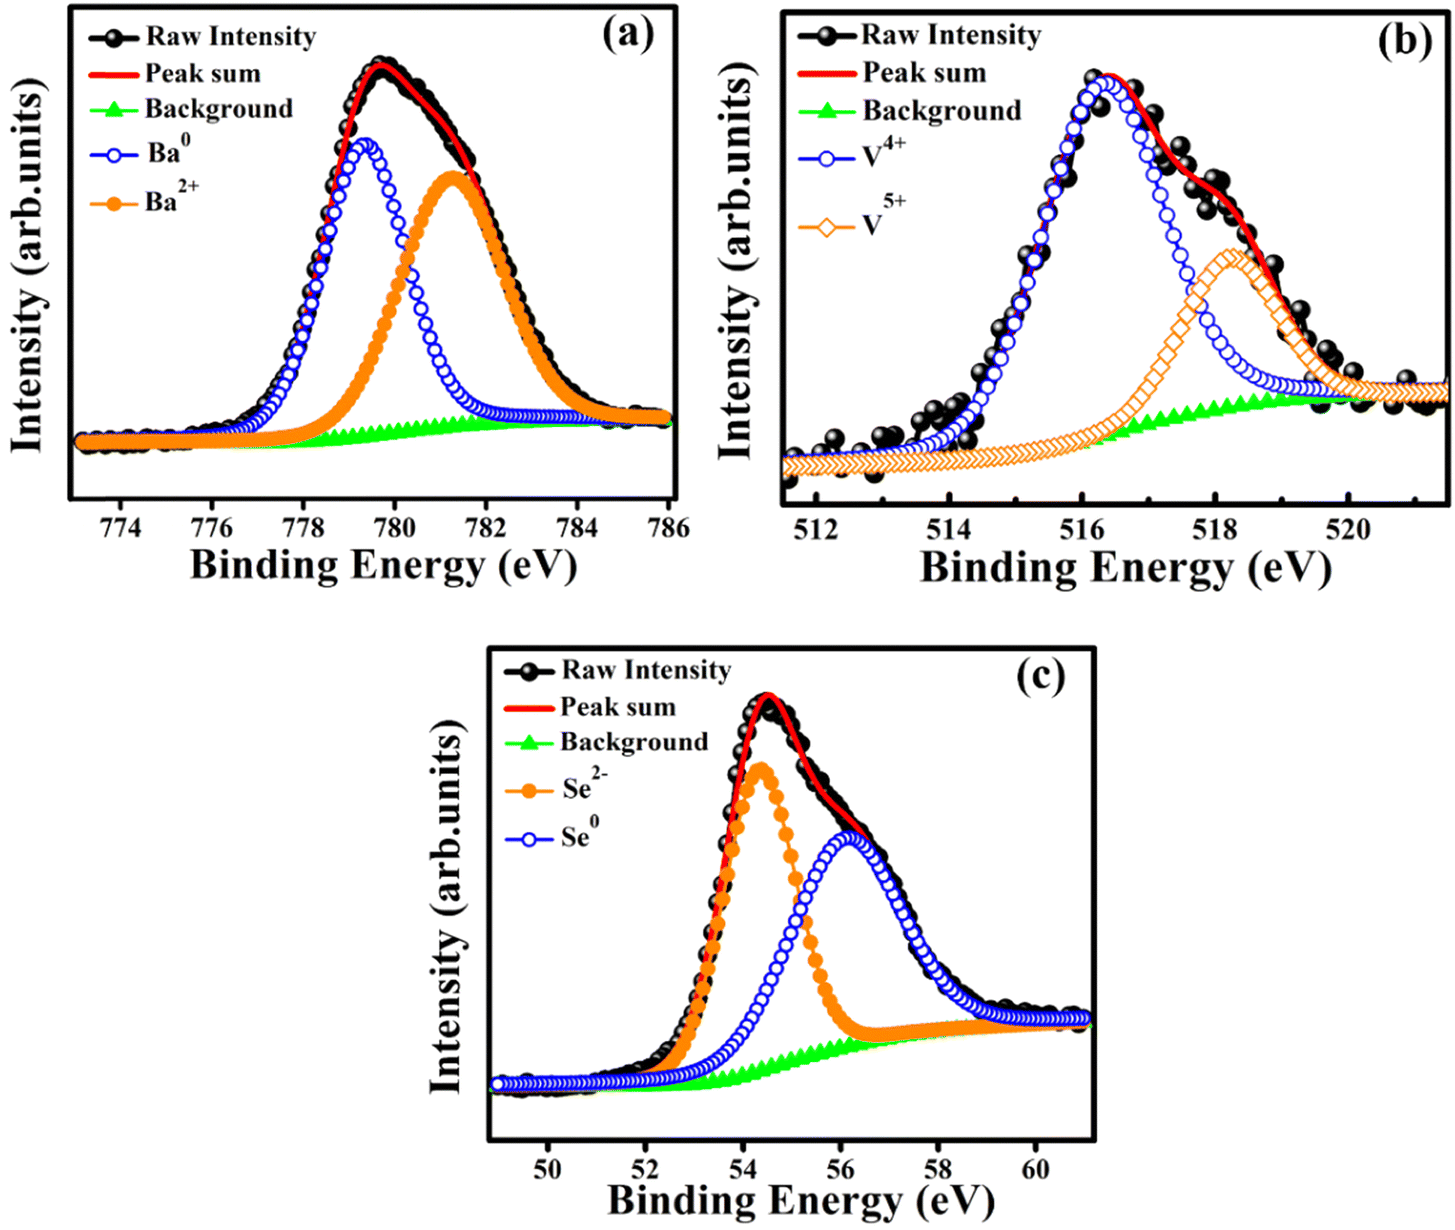 | ||
| Fig. 2 Deconvoluted high resolution XPS spectra of elements (a) Ba, (b) V and (c) Se. | ||
3.3. Magnetic properties
The magnetic hysteresis (M–H) loops were recorded at different temperatures in the field ranging from −90 kOe to +90 kOe. Fig. 3(a) shows the M–H loops recorded at different temperatures such as 2 K, 10 K, 25 K and 43 K. Up to 25 K, the MH loop shows FM nature, and the M(H) loop at 43 K shows PM behavior, which profoundly indicates the FM to PM transition at a critical temperature (i.e., Curie temperature, TC) between 25 K and 43 K. | ||
| Fig. 3 (a) M–H loops recorded at different temperatures, (b) zoomed-in view of (a), (c) M–T curves recorded at different magnetic fields, and (d) the dM/dT versus T plot. | ||
However, the hysteresis loops below TC exhibit unsaturated magnetization even at a higher field of 90 kOe. Usually this kind of unsaturated magnetization is due to the presence of AFM moments.34 Also, an unsaturated M–H loop is one of the criteria for magnetic systems with glassy behavior.35Fig. 3(a) clearly demonstrates the above-mentioned unsaturated nature of magnetization and is a profound indication of a frustrated ferromagnetic system.36 In the magnified view of the hysteresis (shown in Fig. 3(b)), a non-zero coercivity (HC) and remanent magnetization (MR) at temperatures of 2 K, 10 K, and 25 K can be observed. Here, HC and MR are observed to decrease with an increase in temperature. Another parameter of interest is the anisotropy constant (K) since it depends strongly on temperature.37 In Table 2, HC, saturation magnetization (MS) and MR are presented. The reduction in coercivity can be a direct consequence of the reduction in effective magnetic anisotropy with an increase in temperature.38 According to the Néel model of anisotropy, the magnetic energy barrier39 is given in eqn (1) as
 | (1) |
| T (K) | H C (kOe) | M S (emu g−1) | M R (emu g−1) |
|
|---|---|---|---|---|
| 2 | 1.00 | 2.80 | 1.32 | 1409.80 |
| 10 | 0.67 | 2.22 | 1.29 | 748.80 |
| 25 | 0.23 | 1.38 | 1.07 | 161.30 |
The temperature-dependent magnetization of the material is studied in the temperature range of 2–100 K at different field strengths. The zero-field cooled (ZFC) and field cooled (FC) magnetization versus temperature (M–T) curves were recorded under different field conditions. In ZFC, the material is cooled to 2 K in the absence of an external magnetic field and subsequently warmed from 2 K to 300 K by applying the required field; the required data are collected during the warming process. In FC, the M–T measurement was carried out in the presence of a constant field with cooling the sample from 300 K to 2 K. Fig. 3(c) shows the M–T curves of BaVSe3 under the influence of 100 Oe, 500 Oe and 1000 Oe fields, indicating that there is a split in ZFC and FC at low temperatures. This bifurcation in the M–T curves was not suppressed by the applied strong magnetic fields, which is an indication of glassy behavior.40 Fig. S3 in the ESI,† shows the observed cusp in ZFC at lower fields.
The transition temperature, TC, is obtained from the minimum of the dM/dT versus T plot. Below TC, the material exhibits FM ordering and a paramagnetic behavior is observed above TC. Fig. 3(d) shows the dM/dT vs. T plot of BaVSe3 and the TC obtained is 40.81 K. This is in good agreement with previous reports by Kelber et al. (TC = 41 K)11 and Akrap et al. (TC = 43 K).9 Some recent reports of 2D magnetic materials exhibit low TC values (below 50 K).41–43 But the Curie temperature of ferromagnetic materials is dependent on the size and shape effects of nanoparticles.44,45 These results indicate that the presence of nonmagnetic BaSe3 did not affect the properties of BaVSe3 much. Since V is a first-row transition metal, orbital angular momentum does not contribute to the total magnetic moment due to orbital quenching.37 Hence, the magnetic moment for these metals originates from electron spin-only magnetic moment and is given by
 | (2) |
In BaVSe3, vanadium is the only element that contributes to magnetism. The spin-only magnetic moment for V4+ calculated from eqn (2) is 1.73μB per F.U. Since eqn (2) represents a scenario in which spins are non-interacting, the magnetic properties of BaVSe3 are also obtained via a DFT calculation. DFT involves solving the many-body Schrödinger equation. Hence it reveals the interactions between the ions in a crystal system. The spin-polarized bands (the calculation procedure is mentioned in Section S4.1 of the ESI†) crossing the Fermi level (0 eV) at Gamma and other high-symmetry points (Fig. 4(a)) indicate the metallic nature of the material. This is also evident from the peaking of spin-polarized DOS (the calculation procedure is mentioned in Section S4.2 of the ESI†) near the Fermi level (given in Fig. 4(b)). The room temperature electrical conductivity (120 S m−1) measurements further confirm the metallic nature of the material (S5(c), ESI†). The spike seen in the spin-up DOS near the Fermi level can be attributed to the dispersion-less nature of the spin-up bands. The spin-polarized band structure is obtained along the k-path “G-M-K-G-A-L-H-A|L-M|K-H” (where the letters stand for the high symmetry points) as given in Fig. 4(c), where hexagonal BaVSe3 is considered. The magnetic moment of the unit cell was also calculated from the DOS using eqn (3):
 | (3) |
 | ||
| Fig. 4 (a) The spin-polarized band structure of BaVSe3. The blue (solid-line) and red (dotted-line) bands indicate the spin-up and spin-down channels, respectively (the green dashed line indicates the Fermi level at zero). (b) The spin-polarized density of states (DOS) of BaVSe3 near the Fermi level. (c) The k-path (for band structure calculations) taken through the Brillouin zone. | ||
The spin-polarized charge density distribution (Fig. 5) is calculated to understand the distribution of spins inside the crystal (Section S4.3, ESI†). The charge with a positive spin polarity is localized around the vanadium atom (Fig. 5(a–d)) as observed from the iso-surface plot (iso-value = 0.022) shown in Fig. 5(d). The spin-polarized charge density distribution is also found to be different on the two vanadium atoms (Fig. 5(d)) in the BaVSe3 unit cell.
 | ||
| Fig. 5 The spin-polarized charge density plots of (a) the BaVSe3 unit cell (Ba – pink, V – red, Se – orange), (b) BaVSe3 unit cell with the V atoms visible, (c) BaVSe3 unit cell (zoomed-in) and (d) vanadium ions with electron distribution iso-surface (yellow) which are magnified. | ||
From Fig. S6 (ESI†), the experimental effective magnetic moment is calculated from the C–W fit by using eqn (4):
 | (4) |
The FM to PM transition of BaVSe3 is also investigated via atomistic simulations. The exchange interaction constant (J) is obtained as +0.392 × 10⁻²¹ J per atom. The positive value of J is also indicates that the material is ferromagnetic in nature. The atomistic simulation of the Curie temperature using VAMPIRE yielded a value of 41.01 K (shown in Fig. 6(a) and (b)). The initial spin distribution for the calculation involved assigning a moment of 1.046μB to the V ions arranged in a pattern as shown in Fig. 6(c).
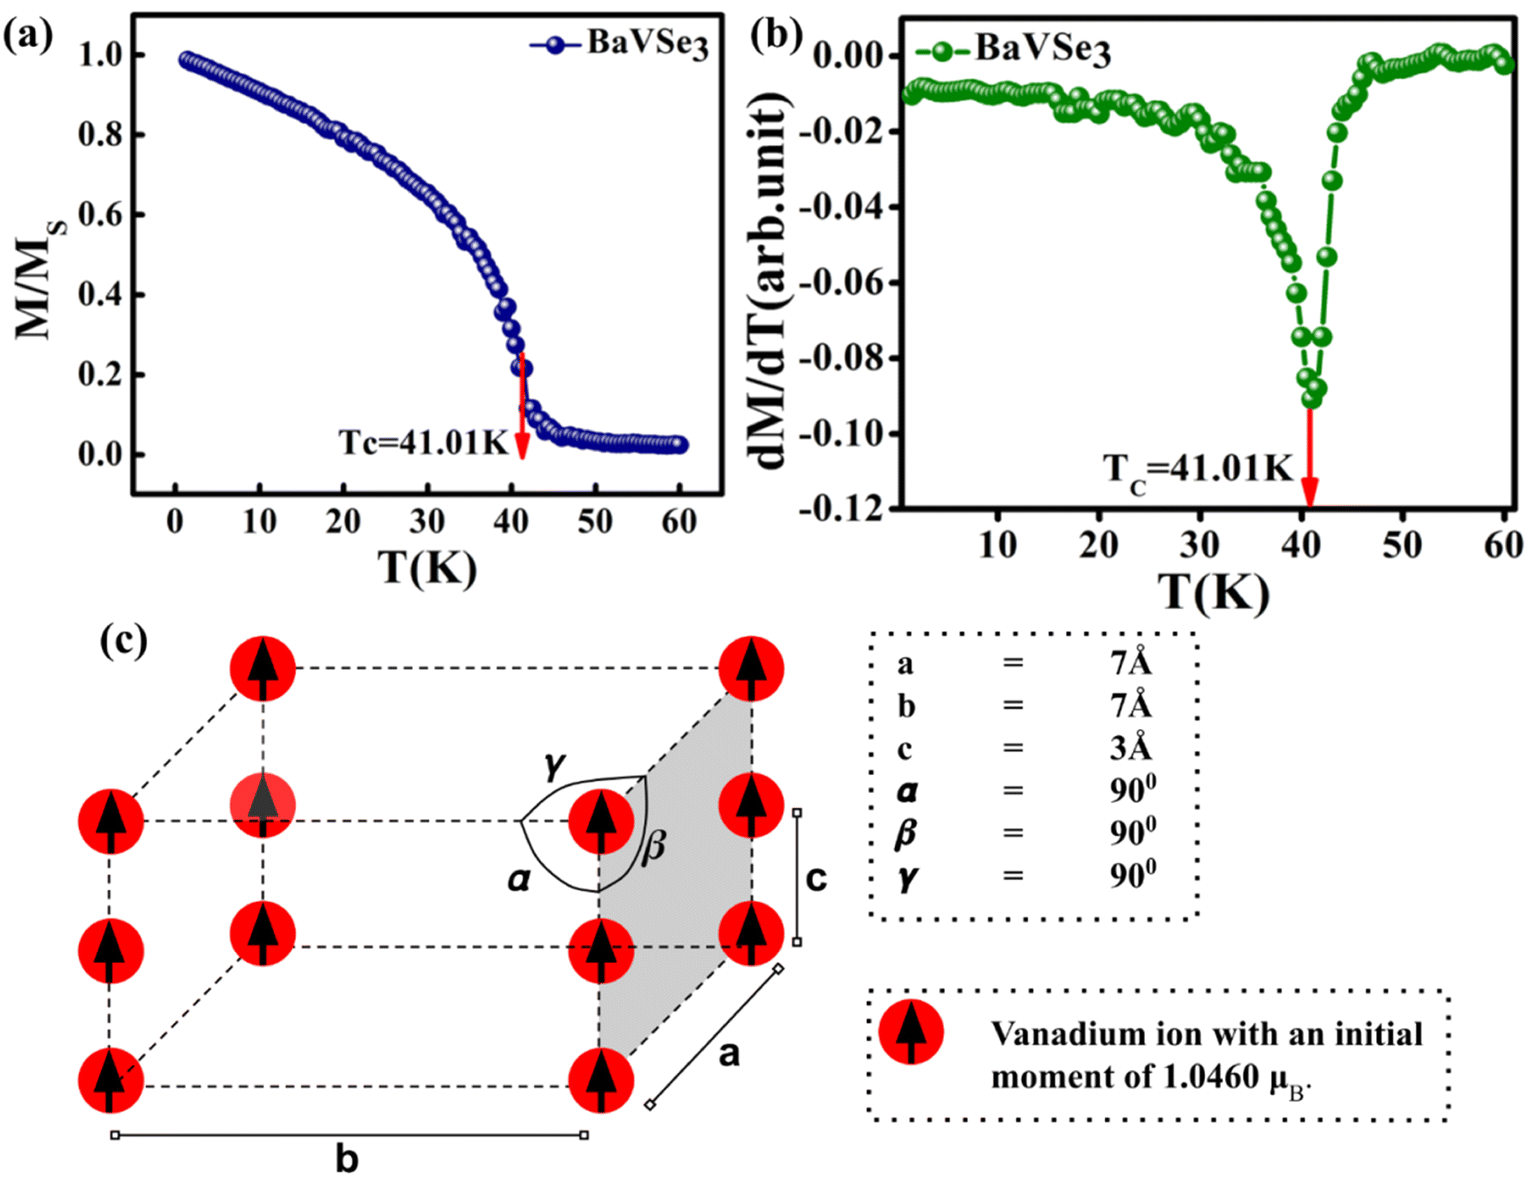 | ||
| Fig. 6 (a) M–T curve obtained from the atomistic simulation, (b) dM/dT vs. T curve obtained from the simulated M–T curve, and (c) the initial spin configuration chosen for the BaVSe3 unit cell for the Curie temperature simulation. | ||
The simulation required the dimensions of the magnetic unit cell (a, b and c), damping constant, exchange-matrix value, atomic-spin-moment and the uniaxial-anisotropy constant. The magnetic unit cell was taken in accordance with the distribution of local moments (located mostly on the vanadium ions in the unit cell of the crystal) obtained from the DFT calculations. The distribution of local magnetic moments resembled a hexagonal magnetic unit cell with the parameter values of a, b and c of 7 Å, 7 Å, and 3 Å, respectively. The magnetic unit cell is not equivalent to the crystallographic unit (repeating unit with a specific composition of elements) as it takes into consideration the local spin magnetic moment (localized on the atoms) and is defined as the smallest repeating spin configuration. Hence, the magnetic unit cell parameters (a, b and c) mentioned here are different from those defined for the unit cell of the BaVSe3 crystal. Since the support for unit cells with non-orthogonal cell vectors is not implemented in VAMPIRE,46 the magnetic unit cell was considered as an orthorhombic unit cell (as shown in Fig. 6(c)) with the a, b, and c parameters taken as 7 Å, 7 Å, and 3 Å. The atomic magnetic moment is given as 1.0460μB, the value of the local magnetic moment for vanadium obtained from DFT. The initial magnetic configuration as given in Fig. 6(c) is taken to be similar to that in the DFT configuration. The damping constant, uniaxial-anisotropy constant and exchange matrix value are provided as 1.0, 6.39 × 10⁻³⁰ J per atom, and 0.392 × 10⁻²¹ J per atom, respectively. To get an estimate of the exchange matrix value, eqn (5) was used.
 | (5) |
In most of the substituted manganites there is magnetic inhomogeneity at temperatures above TC, and Griffith initially explained it for disordered magnetic systems.48–50 It is defined for randomly diluted Ising ferromagnets and this phase appears as ferromagnetic clusters in a paramagnetic matrix above TC.24 This theory was first introduced for explaining the CMR, magnetic susceptibility, and heat capacity in La0.7Ca0.3MnO3.51 The downturn deviation from standard PM behavior in the inverse susceptibility graph at lower applied fields is a hallmark of the presence of the GP.52 It is due to the short-range FM ordering in the PM region. However, on increasing the applied magnetic field the anomaly in the C–W plot softens and attains the classical C–W behavior.53
According to the concept of GP there is always a finite probability of finding FM clusters with randomly distributed spins in the temperature range TC < T < TG, where TC is the C–W temperature and TG is the Griffiths temperature at which the deviation in χ−1 occurs. In the Griffiths phase spontaneous magnetization is absent due to the lack of long-range FM order.54 Further, Bray extended the concept of GP and at present the GP is observed in the region TRC < T < TG, where TRC is the critical temperature of the random FM at which the susceptibility starts to diverge.55 So the GP is the area between completely ordered states above TRC and the disordered state below TG. In general, TRC is considered as the C–W temperature, Θ. Hence, the GP is defined as the region of the PM phase where the magnetic clusters are generated.56
Fig. 7(a) shows the χ−1versus T behavior under the influence of various field strengths of 100 Oe, 1000 Oe, 3000 Oe and 10000 Oe. It can be seen that there is a visible downturn in the variation of χ−1 above the temperature TC. The retention of this anomaly up to a field strength of 10000 Oe indicates that higher fields are required for its suppression. The linear fit of the C–W plot at fields of 3000 Oe and 10000 Oe is depicted in Fig. 7(b). The fit exhibited a TG value of 116 K and a Θ value of 17 K. The GP is observed in this temperature range. On increasing the field to 10000 Oe the linear fit overlaps with the PM region, confirming the disappearance of FM clusters in the PM region. This is due to the fact that the increase in field leads to the magnetization of the spins which are outside the clusters or the masking FM signal by the enhanced PM background.52
 | ||
| Fig. 7 (a) C–W plot at different fields and (b) C–W plot with linear fit in the PM region. | ||
The susceptibility of the GP at low applied fields follows a power-law, which is formulated in eqn (6).
 | (6) |
Here λ is the magnetic susceptibility exponent with a value that lies between 0 and 1, and TRC is the random critical temperature. Based on the value of λ, the GP and PM phases can be distinguished. When λ = 1, it corresponds to GP behavior and λ = 0 is indicative of the PM state. TRC is the random critical temperature at which the C–W law yields a λ value close to zero above TG, and in the present case the Θ can be considered as TRC.57 In Fig. 8(a) the linear region of the graph ln(χ−1) versus ln(T − TRC) is fitted with a power law. The λ values for lower and higher fields are calculated from the slope of the fitted straight line in the GP region. The λGP value decreases from 0.99 to 0.94 when the applied field increases from 100 Oe to 10000 Oe. This is in good agreement with the required range. This confirms the presence of the GP in this Zintl phase compound and the high value of λGP indicates the prominence of the GP. The linear fit in the paramagnetic region (T > TG) at higher fields (10000 Oe) shows a reduction in the λPM value to 0.12 and this is due to the decrease in the size of the clusters in the PM region under large fields. On increasing the field, the exponent value gets reduced (this is a signature of GP behavior), as higher fields are needed to remove the ferromagnetic clusters in the paramagnetic matrix. Here, the M(H) measurements above TC also show FM-like behavior with small loops as shown in Fig. 8(b) and (c) and its inset. This hysteresis above and below TG is due to the presence of FM or AFM clusters in the GP regime.
 | ||
| Fig. 8 (a) GP analysis, (b) M–H loop at 43 K, (c) M–H loop at 50 K and (d) Arrott plot. | ||
Another major analysis technique used to probe for the presence of the GP is the Arrott plot, in which the square of magnetization (M2) is plotted as a function of H/M.58Fig. 8(d) shows the Arrott plot at 43 K, which is well above TRC (17 K) and below TG (116 K). The extrapolation of linear fit in the M2versus H/M plot exhibits a negative y-intercept. This indicates the absence of spontaneous magnetization (i.e. MS = 0) above TC. The absence of MS in the GP regime is an indirect characteristic of the Griffiths-like phase in BaVSe3. Hence, the Arrott plot analysis further confirms the presence of the GP in BaVSe3.
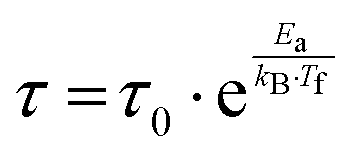
The foremost measurement that indicates a glassy-like nature is the AC susceptibility measurement.59 The AC susceptibility measurements are carried out by varying the temperature from 22 K to 44 K at frequencies of 177 Hz, 555 Hz and 777 Hz. Fig. 9(a) depicts the real part of AC susceptibility (χ′) vs. temperature at different frequencies. The temperature at which the peak point occurs in the χ′ vs. T plot is the freezing temperature (Tf). χ′ has a peak at Tf as shown in Fig. 9(a) and it shifts towards the right when the frequency is increased. This frequency dependent shift indicates the glassy nature of the material. The three models introduced to explain the Tf shift are the Arrhenius law, Vogel–Fulcher (V–F) law and critical scaling approach,19,21,60,61 When the spin-glass material is cooled from a paramagnetic state, it results in a random configuration initially. The spins will locally optimize their respective orientations over longer length scales, which defines the time growing correlation length, ξ.62 Let us assume that τ0 represents the spin relaxation time, Ea is the activation energy, TSG represents the critical spin glass ordering temperature in which the frequency tends to zero, z is the dynamical critical exponent, υ represents the critical exponent of spin correlation length, and  .63 The relationship between relaxation time τ and reduced temperature is given by
  . The τ is associated with the frequency (f) at which the single-spin flip occurs and is given by τ = 1/2πf. The relaxation time is obtained from the experiments and the other parameters are calculated by fitting the experimental data with the concerned model.
 | ||
| Fig. 9 Frequency dependence of the (a) real component of AC-magnetic susceptibility and (b) relaxation time τ versus maximum spin-freezing temperature Tf fitted to the VF law (solid line) and power law (dashed line). The inset shows linear fitted ln(τ) versus ln(t), where reduced temperature t = (Tf−TSG)/TSG and the solid line is the linear fit. | ||
The first model is the Arrhenius law64 represented by eqn (7).
 | (7) |
 | (8) |
 | (9) |
For spin-glass nature to be evident in a system, the τ0 must be in the range of 10−10 to 10−13 seconds and the value of zv should be between 4 and 12.65 Another parameter of interest is the Mydosh parameter (g) which determines the relative temperature shift of Tf with frequency, which is given by the relationship shown in eqn (10).
 | (10) |
The g value for spin glasses lies between 0.005 and 0.08 and for superparamagnetic materials this value is greater than 2.66 If the g value is in between those of the above two classes of materials, then the system exhibits a cluster glass nature. In the present case, the g value obtained is 0.1, which lies in the value range of cluster glasses. The Arrhenius model is omitted because the fit does not converge with the experimental data. Therefore, the other two models are considered and are fitted to the experimental data. Fig. 9(b) shows the ln(τ) versus Tf graph and the data are fitted using both the V–F model and the critical power law model. The parameter values obtained using the V–F model are Ea/kB = 0.243 ± 0.011, T0 = 37.401 ± 0.001 K and τ0 = 1.522 × 10⁻⁴ s. From the dynamical scaling analysis, TSG and the critical exponent zυ are obtained as 37.518 ± 0.012 K and 0.459 ± 0.008, respectively. From this analysis the higher value of τ0 and lower value of zυ confirm the slower spin flipping mechanism and the existence of randomly oriented ferromagnetic clusters rather than atomic-level randomness.67
4. Conclusion
BaVSe3, a Zintl phase crystal system, is synthesized through a solid-state reaction by vacuum sealing and controlled atmosphere heat treatment. The secondary phase associated with it has been identified as nonmagnetic BaSe3. The crystal structure was analyzed experimentally via XRD and theoretically by using DFT simulations. The magnetic measurements indicate that the present material has an FM to PM transition at a TC of 40.81 K. The effective magnetic moment calculated was 1.02μB, which is less than the reported values due to the influence of the nonmagnetic impurity phase. We report the occurrence of glassy nature and the Griffiths-like phase in the BaVSe3 crystal system for the first time. The glassy nature is probed and confirmed via AC magnetic susceptibility measurements. The presence of a hysteresis loop at temperatures above TC provides evidence for the existence of the Griffiths-like phase. The reason for the same can be attributed to the persistence of FM or AFM clusters in the PM matrix. The spin-polarized DFT calculations (without the inclusion of spin–orbit coupling) are carried out to analyze the electronic and magnetic properties of the material. The spin-polarized band structure is a reason for the metallic nature. The crossing of the Fermi level (EF) by the bands of both spin channels is also a reason. The Curie temperature is theoretically obtained as 41.6 K by using the atomistic simulation suite software VAMPIRE. The effective magnetic moment calculated from the DOS is 1.73μB, and the spin-polarized charge density distribution confirms the localization of magnetic moments on the V4+ ions and it is found to be different on the two vanadium ions present within the same BaVSe3 unit cell.Conflicts of interest
There are no conflicts of interest to declare.Acknowledgements
C. V. D. acknowledges the support of University Grants Commission (UGC), India, for granting a research fellowship. R. R. is thankful to the Kerala State Council for Science, Technology and Environment (KSCSTE), Kerala, India for granting a junior research fellowship. The authors acknowledge the measurement facilities in different labs of CSIR-NIIST. M. R. V. and B. D. are thankful to the Science and Engineering Research Board, Department of Science and Technology, New Delhi, India for funding this research through the Project EMR/2017/004539(Ver-1) dated 06/05/2019.References
- A. Balvanz, S. Baranets and S. Bobev, Acta Crystallogr., 2020, 76, 869–873 CAS.
- S. M. Kauzlarich, Materials, 2019, 12, 10–12 CrossRef.
- Y. Tokura, Rep. Prog. Phys., 2006, 69, 797–851 CrossRef CAS.
- A. J. Millis, P. B. Littlewood and B. I. Shraiman, Phys. Rev. Lett., 1995, 74, 5144–5147 CrossRef CAS PubMed.
- S. Jin, T. H. Tiefel, M. McCormack, R. A. Fastnacht, R. Ramesh and L. H. Chen, Science, 1994, 264, 413–415 CrossRef CAS PubMed.
- A. P. Ramirez, R. J. Cava and J. Krajewski, Nature, 1997, 386, 156–159 CrossRef CAS.
- N. J. Poulsen, Mater. Res. Bull., 1998, 33, 313–322 CrossRef CAS.
- A. W. R. A. Gardner and M. Vlasse, Acta Crystallogr., Sect. B, 1969, 25, 781–787 CrossRef.
- A. Ana, S. Vladan, H. Mirta, M. Miljak, N. Bariši, H. Berger and L. Forró, Phy. Rev. B: Condens. Matter Mater. Phys., 2008, 78, 1–11 Search PubMed.
- D. Grieger, L. Boehnke and F. Lechermann, J. Phys. D: Appl. Phys., 2010, 22, 275601 Search PubMed.
- J. Kelber, A. H. Reis, A. T. Aldred and M. H. Muller, J. Solid State Chem., 1979, 30, 357–364 CrossRef CAS.
- J. Gopalakrishnan and K. S. Nanjundaswamy, Bull. Mater. Sci., 1983, 5, 287–306 CrossRef CAS.
- T. Yamasaki, S. Giri, H. Nakamura and M. Shiga, J. Phys. Soc. Jpn., 2001, 70, 1768–1771 CrossRef CAS.
- J. Dijkstra, C. F. van Bruggen, C. Haas and R. A. de Groot, Phys. Rev. B: Condens. Matter Mater. Phys., 1989, 40, 7973–7976 CrossRef CAS PubMed.
- J. Sugiyama, W. Higemoto, D. Andreica, F. O. Kenji, E. Nocerino, M. Månsson, Y. Sassa, R. Gupta, R. Khasanov, H. Ohta and H. Nakamura, Phys. Rev. B: Condens. Matter Mater. Phys., 2021, 103, 1–10 CrossRef.
- Z. Huang, B. Wolfgang, S. Mankovsky, P. Svitlana, H. Ebert and K. K. Reinhard, J. Solid State Chem., 2006, 179, 2067–2078 CrossRef CAS.
- D. Yuan, N. Liu, K. Li, S. Jin, J. Guo and X. Chen, Inorg. Chem., 2017, 56, 13187–13193 CrossRef CAS PubMed.
- C. P. H. Lei, E. S. Bozin and K. Wang, Phys. Rev. B: Condens. Matter Mater. Phys., 2011, 84, 3–6 Search PubMed.
- B. Wang, Z. Guo, F. Sun, J. Deng, J. Lin, D. Wu and W. Yuan, J. Solid State Chem., 2019, 272, 126–130 CrossRef CAS.
- J. A. Mydosh, Spin Glasses: An Experimental Introduction, 1993 Search PubMed.
- G. Benka, A. Bauer, P. Schmakat, S. Säubert, M. Seifert, P. Jorba and C. Pfleiderer, Condens. Matter, 2020, 1–14 CAS.
- S. Mukherjee, R. Ranganathan, P. Anilkumar and P. Joy, Phy. Rev. B: Condens. Matter Mater. Phys., 1996, 54, 9267–9274 CrossRef CAS PubMed.
- K. Binder and A. P. Young, Rev. Mod. Phys., 1986, 58, 801–976 CrossRef CAS.
- P. R. Mandal and T. K. Nath, Mater. Res. Express, 2015, 2, 66101 CrossRef.
- R. B. Griffiths, Phys. Rev. Lett., 1969, 23, 563–890 CrossRef.
- K. Ghosh, C. Mazumdar, R. Ranganathan and S. Mukherjee, Sci. Rep., 2015, 5, 15801 CrossRef CAS PubMed.
- Y. Öner and A. Guler, J. Appl. Phys., 2013, 141, 5–8 Search PubMed.
- E. D. J. Burgy, M. Mayr, V. Martin-Mayor and A. Moreo, Phys. Rev. Lett., 2001, 87, 277202 CrossRef PubMed.
- A. H. C. Neto, G. Castilla and B. A. Jones, Phys. Rev. Lett., 1998, 81, 3531–3534 CrossRef.
- F. Hulliger and T. Siegrist, Cryst. Struct. BaSe2 BaSe3, 1981, 36b, 14–15 CAS.
- S. K. Bux, A. Zevalkink, J. G. Snyder, J. P. Fluerial, O. Janka, D. Uhl and S. Kauzlarich, J. Mater. Chem. A, 2014, 2, 215–220 RSC.
- NIST XPS Data base,URL: https://srdata.nist.gov/xps/main_search_menu.aspx.
- G. Silversmit, D. Depla, H. Poelman, G. B. Marin and R. De Gryse, Surf. Sci., 2006, 600, 3512–3517 CrossRef CAS.
- M. Motin Seikh, V. Caignaert, O. I. Lebedev and B. Raveau, Solid State Commun., 2014, 180, 52–55 CrossRef CAS.
- J. Kroder, J. Gooth, W. Schnelle, G. H. Fecher and C. Felser, AIP Adv., 2019, 55327, 0–5 Search PubMed.
- V. Kumar, R. Kumar, K. Singh, S. K. Arora, I. V. Shvets and R. Kumar, J. Appl. Phys., 2014, 116, 1–6 Search PubMed.
- S. Blundell, Mag. Condens. Matter, 2001, 128–129 Search PubMed.
- N. A. Spaldin, Magnetic materials: fundamentals and applications, 2011 Search PubMed.
- S. Upadhyay, K. Parekh and B. Pandey, J. Alloys Compd., 2016, 678, 478–485 CrossRef CAS.
- H. Neuendorf and W. Gunßer, J. Magn. Magn. Mater., 1997, 173, 117–125 CrossRef CAS.
- Z. Zheng, K. Ren, Z. Huang, Z. Zhu, K. Wang, Z. Shen and J. Yu, Semicond. Sci. Technol., 2021, 36, 1–9 Search PubMed.
- Z. Guan and S. Ni, ACS Appl. Mater. Interfaces, 2020, 12, 53067–53075 CrossRef CAS PubMed.
- S. Wang and J. Yu, J. Supercon. Nov. Magn., 2018, 31, 2789–2795 CrossRef CAS.
- L. Fei Cao, D. Xie, M. Xing Guo, H. S. Park and T. Fujita, Trans. Nonferrous Met. Soc. China, 2007, 17, 1451–1455 CrossRef.
- R. Revathy, M. R. Varma and K. P. Surendran, Mater. Res. Bull., 2019, 120, 110576 CrossRef CAS.
- VAMPIRE software manual, https://vampire.york.ac.uk/.
- R. F. L. Evans, W. J. Fan, P. Chureemart, T. A. Ostler, M. O. A. Ellis and R. W. Chantrell, J. Phys.: Condens. Matter, 2014, 26, 103202 CrossRef CAS PubMed.
- Y. E. Samoshkina, M. V. Rautskii, E. A. Stepanova, D. S. Neznakhin, N. V. Andreev and V. I. Chichkov, J. Exp. Theor. Phys., 2017, 125, 1090–1095 CrossRef CAS.
- G. G. L. A. N. Ulyanov, N. E. Pismenova and D. S. Yang, J. Alloys Compd., 2015, 618, 607–608 CrossRef.
- R. M. Eremina, I. V. Yatsyk, Y. M. Mukovskiĭ and A. L. H. A. Krug Von Nidda, JETP Lett., 2007, 85, 51–54 CrossRef CAS.
- M. B. Salamon, P. Lin and S. H. Chun, Phys. Rev. Lett., 2002, 88, 1972031–1972034 CrossRef.
- E. D. A. Tozri, J. Alloys Compd., 2019, 783, 718–728 CrossRef.
- P. Tong, B. Kim, D. Kwon, T. Qian, S. I. Lee, S. W. Cheong and B. G. Kim, Phy. Rev. B: Condens. Matter Mater. Phys., 2008, 77, 1–7 Search PubMed.
- S. O. Manjunatha, A. Rao, P. Poornesh, W. J. Lin and Y. K. Kuo, Phys. B: Condens. Matter, 2016, 498, 82–91 CrossRef CAS.
- A. J. Bray and M. A. Moore, J. Phys. C: Solid State Phys, 1984, 17(23), L613 CrossRef CAS.
- H. S. Nair, D. Swain, N. Hariharan, S. Adiga, C. Narayana and S. Elzabeth, J. Appl. Phys., 2011, 110, 123919 CrossRef.
- A. K. N. M. K. Majee and P. A. Bhobe, J. Magn. Magn. Mater., 2019, 485, 112–117 CrossRef.
- I. N. Bhatti, I. N. Bhatti, R. N. Mahato and M. A. H. Ahsan, Phys. Lett. A, 2019, 383, 2326–2332 CrossRef CAS.
- C. A. M. Mulder, A. J. Van Duyneveldt and J. A. Mydosh, Phy. Rev. B: Condens. Matter Mater. Phys., 1982, 25, 515–518 CrossRef CAS.
- G. Balaji, G. Wilde, J. Weissmüller, N. S. Gajbhiye and V. K. Sankaranarayanan, Phys. Status Solidi B, 2004, 241, 1589–1592 CrossRef CAS.
- G. F. Goya, H. R. Rechenberg and V. Sagredo, J. Magn. Magn. Mater., 2001, 226–230, 1298–1299 CrossRef CAS.
- E. Vincent and V. Dupuis, Springer Series in Materials Science, 2018, vol. 275, pp. 31–56 Search PubMed.
- P. Bag, K. Somesh and R. Nath, J. Magn. Magn. Mater., 2020, 497, 165977 CrossRef CAS.
- J. Souletie and J. L. Tholence, Phys. Rev. B: Condens. Matter Mater. Phys., 1985, 32, 516–519 CrossRef CAS PubMed.
- P. Bag, P. R. Baral and R. Nath, Phys. Rev. B, 2018, 98, 1–10 Search PubMed.
- R. Yadav and S. Elizabeth, J. Appl. Phys., 2015, 117, 53902 CrossRef.
- M. Viswanathan and P. S. A. Kumar, Phys. Rev. B: Condens. Matter Mater. Phys., 2009, 80, 3–6 CrossRef.
Footnote |
| † Electronic supplementary information (ESI) available. See DOI: https://doi.org/10.1039/d2nj04129d |
| This journal is © The Royal Society of Chemistry and the Centre National de la Recherche Scientifique 2023 |