An innovative hybrid biosorbent composed of nano ZnO and marine macro algae Jania rubens embedded in an alginate/PVA matrix: insights into Pb2+ removal in water†
Kadimpati Kishore
Kumar
*ac,
Sanneboina
Sujatha
b,
Wojciech
Skarka
 d and
Olivier
Monfort
 *e
*e
aDepartment of Pharmaceutical Bio-Technology, Mallareddy College of Pharmacy, Osmania University, 500 100 Secunderabad, Telangana, India. E-mail: kishore.kumar.kadimpati@polsl.pl; Tel: +48 729376412
bDepartment of Pharmaceutics, Narayana Pharmacy College, JNT University, Ananthapuramu, 524 002 Nellore, Andhra Pradesh, India
cDepartment of Environmental Biotechnology, Faculty of Power and Environmental Engineering, Akademicka 2, Silesian University of Technology, 44100 Gliwice, Poland
dDepartment of Fundamental of Machine Design, Faculty of Mechanical Engineering, Konarskiego 18A, Silesian University of Technology, 44100 Gliwice, Poland
eDepartment of Inorganic Chemistry, Faculty of Natural Sciences, Comenius University Bratislava, Ilkovicova 6, Mlynska Dolina, 84215 Bratislava, Slovakia. E-mail: monfort1@uniba.sk; Tel: +421 290142141
First published on 22nd November 2022
Abstract
Nanoparticles of zinc oxide (ZnO) combined with a Jania rubens (JR) biosorbent have been embedded in a sodium alginate (SA)–polyvinyl alcohol (PVA) matrix. This hybrid biosorbent was characterized by FTIR, and the presence of functional groups involved in the adsorption of Pb2+ was revealed. SEM/EDX analyses have shown that the hybrid biosorbent exhibited porous microstructures which are decorated with ZnO nanoparticles (hydrodynamic size of 68 ± 2 nm). The removal of Pb2+ from aqueous medium was thoroughly investigated. The adsorption capacity has been measured at qe = 39.1 mg g−1 at pH = 5 and T = 303 K with the concentration of biosorbent and Pb2+ at 2.0 g L−1 and 100 mg L−1, respectively. The Freundlich and Langmuir isotherms have been used to model the adsorption process, from which the maximum adsorption capacity (qm) of the hybrid biosorbent was calculated to be 111 mg g−1. The adsorption kinetics are represented by a pseudo-second order model. In addition, the hybrid biosordent was regenerated and reused for four cycles for the removal of Pb2+.
1. Introduction
Non-biodegradable and hazardous heavy metal ions including lead (Pb2+), cadmium (Cd2+), chromium (Cr6+), mercury (Hg2+), and arsenic (As3+) are still released into the natural environment via inefficiently treated wastewaters from various industries, thus being a serious threat to the ecosystem and human health.1 Therefore, wastewater treatment should be improved by additional techniques like biological, chemical, or physical ones. In this work, particular attention is paid to removing Pb2+ using a physico-chemical method i.e. an adsorption process using an innovative hybrid biosorbent. Even in small concentrations, Pb2+ can cause carcinogenicity/genotoxicity, thus resulting in severe damage to brain, kidneys, and blood cells.1 The World Health Organization has set the permissible limit of lead in potable water at 0.01 mg L−1.2 On the other hand, effective and eco-friendly approaches are required to remove such low concentrations of lead. Adsorption using a biomass-based sorbent (biosorption) is a technologically proven method for the sequestration of heavy metals, especially for biosorbents composed of algae,3–7 fungi,8 bacteria,9 plants10,11 and chitin.12 In addition, hybrid biosorbents, i.e., biosorbents combined with synthetic adsorbents, are even more promising regarding their stability, reproducibility, cost-effectiveness, thus their efficiency. In particular, the design of hybrid biosorbents by their entrapment with metal oxide nanoparticles in a polymeric matrix has appeared as an attractive technology since such nanoparticles can provide specific adsorption of heavy metal ions.13 For example, a TiO2-yeast nanocomposite exhibited a higher metal removal of Cr(VI) compared to conventional biosorbents.14In addition, the immobilization of adsorbents into biological matrices appears promising for practical reasons like the ease of complete post-separation after treatment along with a limitation of nanoparticle release in the treated system. Therefore, natural polymers are excellent candidates because of their biodegradability and eco-friendly nature.15 Among natural polymers, alginate is an excellent candidate due to its non-toxicity and availability (from marine algae). The chemical structure of alginates is composed of guluronic and mannuronic acids that can interact and entrap hybrid biosorbents. The whole system can be enclosed into a film like a flexible polymer such as polyvinyl alcohol (PVA) which is cheap, stable and non-toxic.16,17 Several hybrid biosorbents have already exhibited good efficiency in the removal of aqueous Pb2+. For instance, iron oxide nanoparticles combined with a fungal biosorbent (Phanerochaete chrysosporium) and immobilized in an alginate matrix have exhibited an adsorption efficiency of 96% for Pb2+ removal at pH = 5.18 Furthermore, Fe3O4 nanoparticles embedded in an alginate/PVP/calcium gel have been reported to remove Cd2+ with a maximum adsorption efficiency of 98 mg g−1.19 Similarly, a magnetic alginate composite has been synthesized in the form of beads for the removal of Pb2+ from aqueous solutions.20 Another work reported the preparation of alginate-based Fe3O4−MnO2 xerogels for the removal of Cr6+ and Cd2+.21 However, no report has been found on the use of a metal oxide adsorbent combined with marine algae and embedded in an alginate and PVA matrix which is the focus of this present work.
Indeed, a new type of hybrid biosorbent is prepared based on ZnO nanoparticles and Jania rubens (JR) biomass. ZnO is biocompatible, non-toxic and has already been used in environmental applications, while nanosized ZnO (particle size ranging from 60 to 200 nm) does not show mutagenic activities.22–26 Subsequently, the ZnO–JR hybrid biosorbent is embedded in the alginate/PVA biomatrix. The efficiency of this hybrid biosorbent is investigated toward the removal of aqueous Pb2+. The effects of different parameters (adsorbent and pollutant concentrations, pH, and temperature) are assessed while the adsorption mechanism is extensively discussed based on isotherm models, kinetics and thermodynamics. Therefore, the present work could be considered as a promising approach for the development of innovative and efficient hybrid biosorbents.
2. Materials and methods
2.1. Preparation of materials
2.2. Characterization methods
The hybrid biosorbent as well as the separated components i.e. the JR, ZnO and ZnO–JR adsorbents, and the PVA–SA biomatrix were ground into fine powders. The powders were analyzed using a Fourier transform infrared spectrophotometer (FTIR, Tensor 37, Bruker) using a KBr pellet to determine the functional groups of the materials. The morphology of the particle surface and the cross section of the materials was studied using scanning electron microscopy (SEM, JXA-8100, JEOL) and the hydrodynamic size of the ZnO nanoparticles in the hybrid biosorbent was measured using a dynamic light scattering device (DLS, Zetasizer, Malvern). The surface area of the ZnO nanoparticles was estimated by N2 adsorption using a BET (Brunauer–Emmett–Teller) isotherm technique (NOVA 2200e). The EDX spectra were also monitored. In addition, atomic absorption spectrophotometry (AAS, AA400-PerkinElmer) was used to analyze the Pb2+ concentration in the aqueous samples. The point of zero charge (PZC) of ZnO–JR was measured by the pH drift method in 0.1 M NaCl electrolyte.28 Briefly, six flasks of 50 mL NaCl solution were prepared, and the pH was adjusted with 0.1 N HCl and NaOH at 2, 4, 6, 8, 10 and 12, respectively. Then, 100 mg ZnO–JR was added to each flask that was kept in a shaker at 160 rpm for 24 h. After the shaking, the content was filtered, and the pH of each solution was measured. This procedure was repeated but without the addition of ZnO–JR. Finally, the final pH vs. initial pH was plotted, and the point of intersection was considered as the PZC of ZnO–JR nanoparticles.292.3. Calculations and measurements
The Pb2+ metal uptake qe was calculated using eqn (1) and the percentage of Pb2+ removal (R%) by the adsorbents was calculated using eqn (2): | (1) |
 | (2) |
The batch studies of Pb2+ removal were performed in Erlenmeyer flasks under constant stirring (160 rpm) of 50 mL Pb2+ solution at different concentrations (25, 50, 75, and 100 mg L−1) and containing adsorbent at different concentrations i.e. ZnO particles 25, 50 and 100 mg L−1 loaded with JR i.e. 2, 4, and 8 g L−1, respectively. The pH of was adjusted using 0.1N NaOH and HNO3 solutions and the effect of different temperatures (293, 303, 313, and 323 K) was assessed. The adsorption experiments were performed for a duration of 120 min and repeated thrice. Also, the reusability of the hybrid biosorbent was evaluated by repeating the adsorption–desorption cycles four times. The desorption of Pb2+ from the hybrid biosorbent was performed using 2N HCl. It is worth noting that Ca2+ (crosslinking agent in the PVA–SA matrix) was released at low pH while at high pH, Pb2+ started to precipitate, thus a pH range between 3 and 6 was used in the present work.
3. Results and discussion
3.1. Characterization of adsorbents
The FTIR spectra of native JR biosorbent, the JR biosorbent embedded in PVA–SA matrix, the hybrid biosorbent (i.e. ZnO–JR–PVA–SA) and the hybrid biosorbent loaded with Pb2+ are depicted in Fig. 1. The peaks at 3470.94 and 2518.74 cm−1 correspond to –OH and –CH (Fig. 1a), respectively, and were shifted to 3448.77 and 2521.29 cm−1 (Fig. 1b), thus suggesting the successful immobilization of JR biosorbent in the PVA–SA matrix.30 In addition, the peaks of the JR biosorbent at 1635.16 cm−1, 1473.37 cm−1 and 856.18 cm−1 (Fig. 1a) were assigned to the vibrations of amide I (i.e., –CO–NH), amide II (i.e., –CO–NH and –COO− NH+) and –NH2, respectively, and were slightly shifted after their entrapment in the PVA–SA matrix (Fig. 1b, 1c and 1d). Similarly, the peak at 1077.85 cm−1 which was assigned to –C–OH of PVA (Fig. 1b) was shifted to 1082.84 cm−1 in the hybrid biosorbent (Fig. 1c), thus suggesting this chemical function was involved in the entrapment of JR–ZnO in the PVA–SA matrix. The peak assigned to PVA at 1257.45 cm−1 (Fig. 1b) due to the presence of –C–O vanished in the hybrid biosorbent that was probably caused by the interaction with ZnO.4 Furthermore, a new peak at 2930.67 cm−1 (Fig. 1b) was assigned to the PVA–SA matrix, especially to the –OH stretching in the sugar ring of SA. By comparison with the FTIR spectra of hybrid biosorbent (Fig. 1c) and Pb2+ loaded hybrid biosorbent (Fig. 1d), this peak vanished since it was implicated in the Pb2+ surface complexation during the adsorption process. The sharp peak in JR biosorbent at 856.18 cm−1 (Fig. 1a) was due to –NH2, and this peak was shifted to 859.30, 859.39 and 858.71 cm−1 in the JR biosorbent embedded in the PVA–SA matrix, the hybrid biosorbent and the Pb2+ loaded hybrid biosorbent, respectively. A similar trend in the shift of the peak 603.85 cm−1 (Fig. 1a), which was assigned to the –SH group, was observed, but it disappeared in the Pb2+ loaded hybrid biosorbent (Fig. 1d). This might be due to the involvement of the –SH group in the adsorption process of Pb2+. It could also be assumed that the –OH, –C–N, –C–O, –C–N–C, –CO–NH, –NH2 and –SH functional groups of the hybrid biosorbent were involved in the adsorption process of Pb2+.31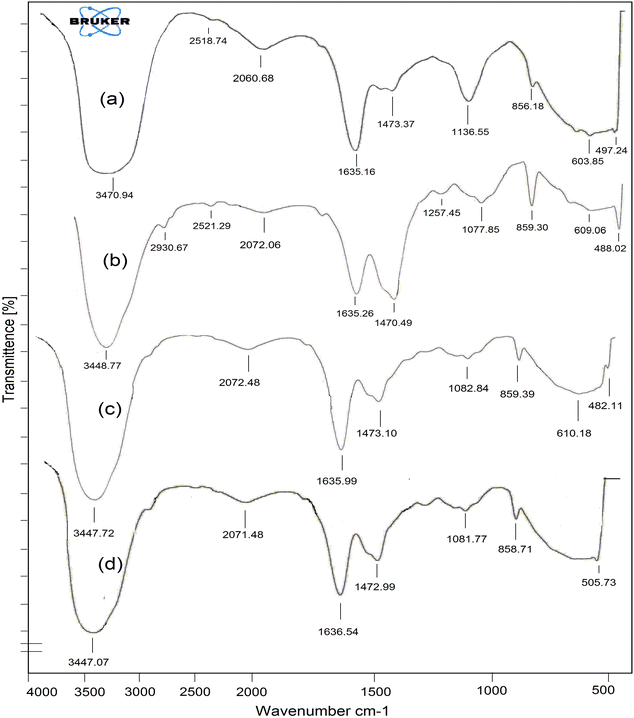 | ||
| Fig. 1 FTIR spectra of the (a) JR biosorbent, (b) JR biosorbent embedded in the PVA–SA matrix, (c) hybrid biosorbent and (d) Pb2+ loaded hybrid biosorbent. | ||
SEM images of the hybrid biosorbent before and after loading of Pb2+ (Fig. 2a and b) revealed that the surface was rough and the Pb2+ adsorption did not affect the surface morphology of the hybrid biosorbent. The white dots were ZnO nanoparticles (marked with arrows). Their presence was confirmed by EDX and DLS which determined the hydrodynamic size to be 68 ± 2 nm (Fig. S1, ESI†). The BET analysis of ZnO nanoparticles showed that the specific surface area was 14.6 m2 g−1 (Fig. S2, ESI†). Similar results were also observed in the literature.34,35Fig. 2c and d show the surface and cross-section images of the hybrid biosorbent. The presence of micropores (Fig. 2d) was clear, which was a significant benefit for the removal of Pb2+. Similar conclusions were highlighted in other works on immobilized biosorbents.32,33 It is worth noting that the hybrid biosorbent was also characterized by SEM and EDX after 4 cycles of Pb2+ adsorption (Fig. S3, ESI†). The SEM images showed that the surface morphology of the hybrid biosorbent remained almost intact (Fig. S3b, ESI†) although the porous structure was slightly smoothed, probably due to Pb2+ adsorption but also release of Ca2+ (ion exchange). The EDX analysis (Fig. S3a, ESI†) still confirmed the presence of ZnO after 4 cycles of reuse while the quantity of Pb2+ increased, thus confirming the efficiency of the hybrid biosorbent.
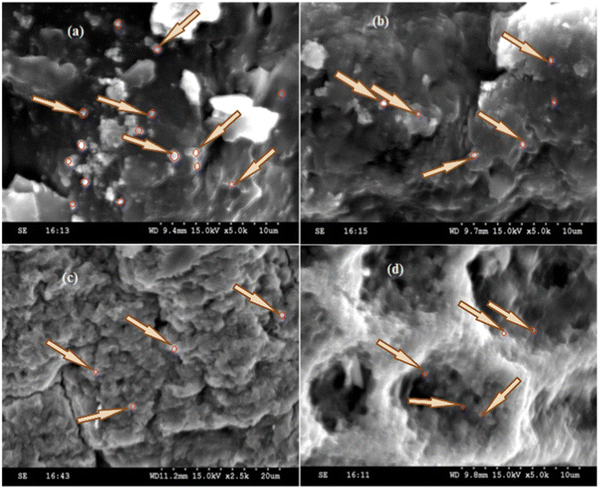 | ||
| Fig. 2 SEM images of the hybrid biosorbent (a) before and (b) after Pb2+ loading, and of the (c) surface and (d) cross-section of the hybrid biosorbent. | ||
3.2. Assessment of the effect of experimental parameters
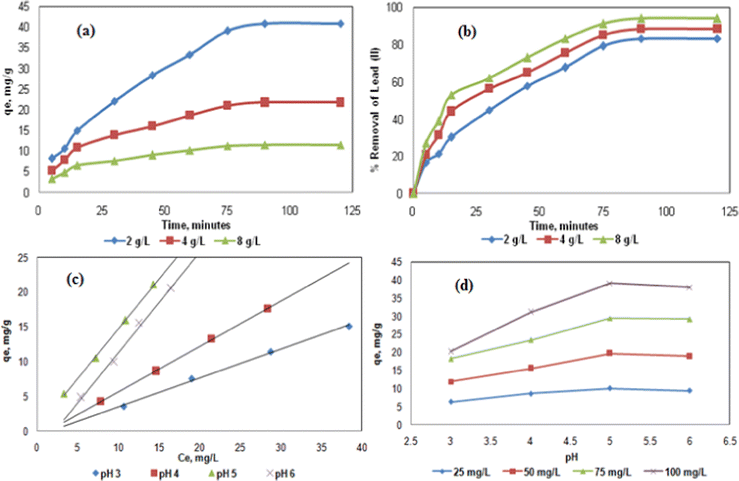
The effect of different concentrations of the hybrid biosorbent (2, 4, and 8 g L−1) was assessed on the metal uptake (qe) and the removal efficiency (R) of Pb2+solution (100 mg L−1) at pH = 5 and T = 303 K (Fig. 3a and b). The metal uptake occurred relatively quickly at the early stages because of the availability of binding sites, before reaching a plateau when approaching the equilibrium. Concerning the removal efficiency of Pb2+, it was more than 80% after 90 min and even reached 94% using 8g L−1 biosorbent, thus suggesting an optimal contact time of about 120 min. Similar trends were observed for Pb2+ removal using C. fastigiata and Ulva lactuca biosorbents.36,37The effect of pH was significant due to the (de)protonation of the functional groups involved in the Pb2+ adsorption.38 An increase of pH from 3 to 5 (for Ce = 15 mg L−1) led to an increase of metal uptake from about 5 to 22 mg g−1 and a further increase to pH = 6 lead to a decrease to qe = 17 mg g−1 (Fig. 3c). A similar trend was observed at different initial Pb2+ concentrations (from 25 to 100 mg L−1) where the highest metal uptake was observed at pH = 5 (Fig. 3d). At low pH (pH <5), the protonation of the functional groups at the surface of a hybrid biosorbent might lead to electrostatic repulsion of positively charged lead and the biosorbent, while at higher pH (pH >5), a decrease of metal uptake might be caused by precipitation of lead into Pb(OH)2.39 At the optimal pH i.e. at pH = 5, the surface hydroxyl group in ZnO and JR can chemically adsorb Pb2+ according to the following reaction:
Zn/JR–OH + Pb+2 ![[left over right harpoons]](https://www.rsc.org/images/entities/char_21cb.gif) Zn–O–Pb+ + H+ Zn–O–Pb+ + H+ | (3) |
In addition, at this pH, it is assumed that surface carboxyl groups could also improve the adsorption of Pb2+ by the hybrid biosorbent via surface complexation.40 To further explain the effect of pH, the pH of PZC for the hybrid biosorbent was measured as pHPZC = 4.32 (Fig. S4, ESI†). Therefore, below pHPZC, the Pb2+ adsorption was low due to the electrostatic repulsion effect. However, the adsorption increased from pHPZC to pH = 5 since the adsorbent surface became negatively charged, thus allowing the adsorption of Pb2+ (electrostatic attraction). In addition, Ca2+ ions which were used as crosslinking agents were released during the Pb2+ adsorption process via ion exchange, thus enhancing the adsorption process at pH = 5. Furthermore, a previous report revealed that with hybrid magnetic alginate adsorbent, the calcium concentration is almost constant and the maximum adsorption capacity of Pb2+ was found in the pH range 4.0–6.5.20 Therefore, the present results are in accordance with this report since the optimal pH for Pb2+ adsorption is 5.
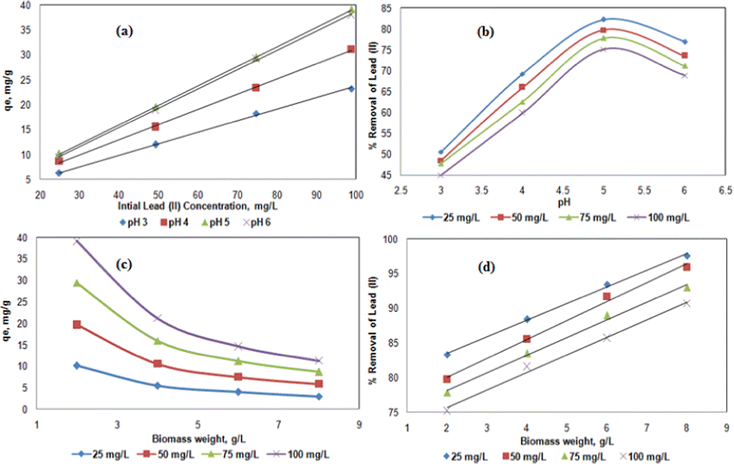
Concerning the effect of the initial Pb2+ concentration (25, 50, 75, and 100 mg L−1), the metal uptake and removal efficiency of Pb2+ were investigated (Fig. 4a and b). The qe increased from 10.1 to 39.1 mg g−1 with increasing initial Pb2+concentration from 25 to 100 mg L−1 using 2 g L−1 hybrid biosorbent at T = 303 K and pH = 5 (Fig. 4a), since higher concentrations were required to overcome the mass transfer resistance of cations in between the solid and aqueous phases.43 However, at pH = 5, the removal efficiency of Pb2+ decreased from 86 to 75% as the initial Pb2+concentration increased from 25 to 100 mg L−1 (Fig. 4b), due to the congestion of adsorption sites.44
The effect of biomass dosage i.e. the biosorbent concentration, was also investigated on the efficiency of Pb2+ adsorption (Fig. 4c and 4d). For 100 mg L−1 Pb2+ solution at pH = 5 and T = 303 K, the metal uptake decreased from 39.1 to 11.3 mg g−1 as the biosorbent concentration increased from 2 to 8 g L−1 (Fig. 4c), while the removal efficiency of Pb2+ continuously increased from 75 to 90% (Fig. 4d). Although the removal efficiency logically increased with increasing biomass dosage (by increasing the available surface area),45 the metal uptake is the highest for 2 g L−1 hybrid biosorbent, thus it is considered to be the optimal concentration. Also, as the hybrid biosorbent quantity increased, particle collision took place, thus leading to a decrease of the adsorption efficiency. Indeed, further increase of concentration led to a decrease of qe due to negative interactions between the adsorbent particles. Also, lower hybrid biosorbent concentrations would lead to a reduction in process costs at an industrial level.
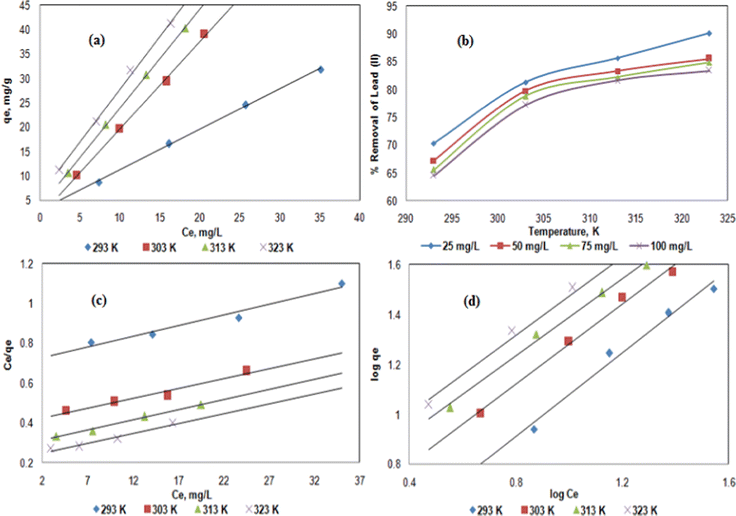
Finally, the effect of temperature was investigated (Fig. 5a and b) which is probably one of the most crucial parameters for the efficiency of an adsorption process. The metal uptake was enhanced from about 15 to 38 mg g−1 (for Ce = 15 mg L−1) as the temperature increased from 293 to 323 K (Fig. 5a), while the removal efficiency increased continuously from 70 to 90% for the 25 mg L−1 Pb2+ solution using 2 g L−1 hybrid biosorbent at pH = 5 (Fig. 5b). It worth noting that the observed differences in the temperature range 303–323 K was slightly significant. Therefore, due to energy consumption and the potential scale-up to an industrial process, 303 K was considered as the optimal temperature. The enhancement of Pb2+ removal with increasing temperature was explained by a decrease of viscosity, thus improving the diffusion rate through the polymeric SA–PVA matrix until the adsorption sites onto the ZnO–JR adsorbent. This trend was reported for Pb2+ using the Phanerochaete chrysosporium biosorbent.46,47
3.3. Adsorption isotherms
To discuss the adsorption isotherms (Fig. 5c and d), two models including Langmuir (eqn (4)) and Freundlich (eqn (5)) ones were considered. | (4) |
 | (5) |
| Langmuir model | Freundlich model | |||||
|---|---|---|---|---|---|---|
| T (K) | q m (mg g−1) | b (L mg−1) | R 2 | K f | n f | R 2 |
| 293 | 111.11 | 0.01278 | 0.945 | 0.5662 | 1.2033 | 0.980 |
| 303 | 111.11 | 0.02222 | 0.962 | 0.3273 | 1.4104 | 0.991 |
| 313 | 100 | 0.03424 | 0.991 | 0.2415 | 1.2970 | 0.993 |
| 323 | 111.11 | 0.03896 | 0.965 | 0.2032 | 1.2804 | 0.986 |
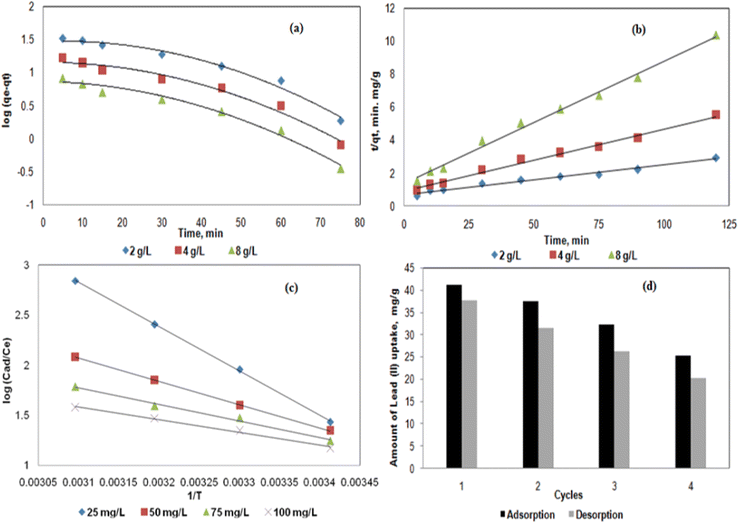
Although the R2 of the Langmuir model is lower than the Freundlich one, the data were relatively consistent (Fig. 5c). Since there were different binding sites on the hybrid biosorbent (JR, ZnO, SA and PVA), the Langmuir model is difficult to apply for such heterogeneous surface properties. The values of b constants (Table 1) indicated that the adsorption capacity of the hybrid biosorbent for Pb2+ is high. Indeed, the calculated maximum metal uptake (qm) was about 111 mg g−1 which was 43% greater than the value of native JR alone (71 mg g−1) under similar experimental conditions.4 Concerning the Freundlich model (Fig. 5d), the values of R2 were much higher (Table 1), thus indicating that this model fits the adsorption of Pb2+ on the hybrid biosorbent. For comparison, the maximum metal uptake (qm) for Pb2+ was reported on hybrid magnetic alginate beads as 100 mg g−120 and further qm values of various adsorbents based on biomass algae are summarized in Table S1 (ESI†).4,32,36,37,44,46,48,49
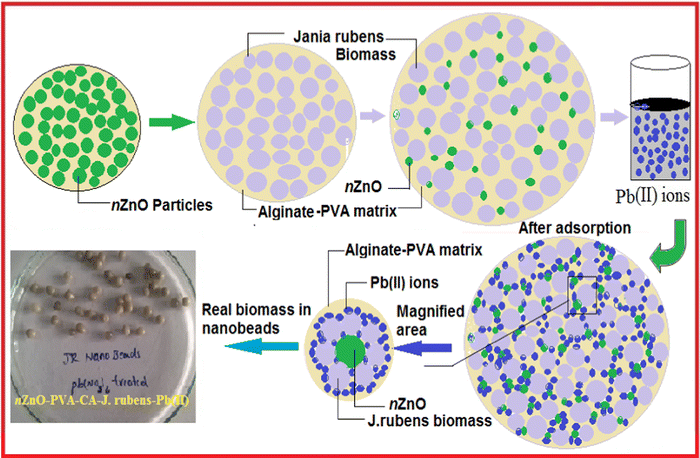
To highlight the adsorption process of Pb2+ by the hybrid biosorbent, a schematic representation is shown in Fig. 6. One of the advantages of this hybrid biosorbent is related to the post-separation technique since it is easy to separate and regenerate the beads after potential treatment of wastewater contaminated by heavy metals like Pb2+, thus reducing the risk of metal oxide nanoparticle leaching.50
3.4. Adsorption kinetics and thermodynamics
As mentioned above, there were several functional groups (e.g., –COOH, –NH2,–SH, and –OH) from the SA, PVA, ZnO and JR components of the hybrid bisorbent that could interact with Pb2+. To propose the elucidation of the adsorption kinetics, the pseudo–first (eqn (6)) and pseudo-second (eqn (7)) order kinetic models were applied (Fig. 7a and b). | (6) |
 | (7) |
| Hybrid biosorbent conc. | Pseudo-first order model | Pseudo-second order model |
|---|---|---|
| 2 g L−1 | q ecal = 40.4575 mg g−1 | q ecal = 58.823 mg g−1 |
| k 1 = 0.0345 h−1 | k 2 = 4.129 × 10⁻⁵ g mg−1h−1 | |
| R 2 = 0.914 | R 2 = 0.977 | |
| 4 g L−1 | q ecal = 21.6271 mg g−1 | q ecal = 27.027 mg g−1 |
| k 1 = 0.0368 h−1 | k 2 = 1.527 × 10⁻⁴ g mg−1h−1 | |
| R 2 = 0.923 | R 2 = 0.991 | |
| 8 g L−1 | q ecal = 11.9949 mg g−1 | q ecal = 13.515 mg g−1 |
| k 1 = 0.0391 h−1 | k 2 = 4.064 × 10⁻⁴ g mg−1h−1 | |
| R 2 = 0.934 | R 2 = 0.993 |
The pseudo-first order kinetic model (Fig. 7a) did not exhibit a linear behavior while the pseudo-second order one (Fig. 7b) is clearly linear. In addition, the R2 coefficients for the pseudo-second order kinetic model were higher and close to 0.99 (Table 2), thus were appropriate to describe the adsorption kinetics of Pb2+ on the hybrid biosorbent. Similar results were reported for hybrid magnetic alginate beads for the removal of Pb2+.49
Concerning the thermodynamic parameters, the changes in standard free energy (ΔG°), enthalpy (ΔH°), and entropy (ΔS°) from the adsorption process can be calculated from the following equations:
 | (8) |
 | (9) |
| T (K) | ΔH° (kJ mol−1) | ΔS° (kJ mol−1 K−1) | ΔG° (kJ mol−1) |
|---|---|---|---|
| 293 | 84.840 | 316.6937 | −92.7064 |
| 303 | 44.574 | 177.8004 | −53.8289 |
| 313 | 31.592 | 131.8855 | −41.2486 |
| 323 | 24.5083 | 106.3432 | −34.3244 |
The free energy values (ΔG°) were negative, thus revealing the spontaneity of Pb2+ adsorption on the hybrid biosorbent. In addition, the adsorption is endothermic due to positive values of ΔH° while the decrease of ΔS° suggested an improvement in the randomness at the solution/adsorbent interlayer.51,52
3.5. Reuse of the hybrid biosorbent
To highlight the potential application of the hybrid biosorbent, four cycles of adsorption–desorption of 100 mg L−1 Pb2+ were investigated using 2 g L−1 hybrid biosorbent at pH = 5 and T = 303 K (Fig. 7d). The desorption process was performed with 2 N HCl.53,54 After the first cycle, about 40 mg g−1 of Pb2+ metal uptake was measured from which 91% was desorbed (37.6 mg g−1). As the hybrid biosorbent was reused, the adsorption of Pb2+ decreased to about 25 mg g−1 from which 85% was desorbed after the fourth cycle (Fig. 7d). The weak reusability of the hybrid biosorbent can be explained by several reasons: (i) the Pb2+ is chemically adsorbed at the surface of the hybrid biosorbent, e.g. non-electrostatic interactions between the adsorbent and the cations. Similar observations were reported in works that also focused on the removal of Pb2+ by other hybrid biosorbents.55 It is worth noting that the regeneration of the hybrid biosorbent was performed using 2N HCl,56 thus resulting in low pH that partially damaged the structure of the hybrid biosorbent. Therefore, after 4 cycles of reuse, the efficiency of the present hybrid biosorbent decreased. However, the adsorption efficiency remained high for the removal of Pb2+ and its eco-friendly nature is a significant benefit for potential use in environmental remediation on a higher scale.4. Conclusions
The hybrid biosorbent composed of ZnO–JR–PVA–SA is a promising material for the treatment of waste waters contaminated with Pb2+. The functional groups at the surface of the hybrid biosorbent were involved in the chemical adsorption of Pb2+ including surface complexation. The microporous structure was undoubtedly a benefit due to the higher surface area for Pb2+ adsorption. The metal uptake was about 39.1 mg g−1 for 100 mg L−1 Pb2+ solution using 2 g L−1 hybrid biosorbent at pH = 5 and T = 303 K. The adsorption isotherm was fitted by the Freundlich model, and the maximum metal uptake was calculated to be about 111 mg g−1. The adsorption kinetics followed a pseudo-second order reaction since the functional groups of the components of the hybrid biosorbent were involved in the adsorption of Pb2+. The adsorption process using the hybrid biosorbent was spontaneous and endothermic. Finally, its eco-friendly nature and relatively high efficiency upon reuse are beneficial for the development of such adsorbents in future environmental applications, especially the treatment of wastewaters contaminated with heavy metals.Author contributions
Kadimpati Kishore Kumar: conceptualization, methodology, investigation, and writing: original draft. Sanneboina Sujatha: methodology, investigation, analysis, data curation, and writing: original draft. Wojciech Skarka: methodology, data curation, and writing: original draft. Olivier Monfort: conceptualization, methodology, and writing: review & editing.Conflicts of interest
The authors declare that there is no conflict of interest.Acknowledgements
This work was partially financed by the Slovak Research and Development Agency under contract No. APVV-21-0039 and it was also supported by the Operation Program of Integrated Infrastructure for the project “UpScale of Comenius University Capacities and Competence in Research, Development and Innovation” (ITMS 2014+: 313021BUZ3) co-financed by the European Regional Development Fund. Kadimpati Kishore Kumar acknowledges the Department of Science and Technology (SERB) for the research grant (Grant No. SB/EMEQ103/2013) and also the Indian Institute of Chemical Technology for SEM/EDX analyses.References
- S. K. Yadav, D. K. Singh and S. Sinha, J. Environ. Chem. Eng., 2014, 2, 9 CrossRef CAS.
- M. Ahmaruzzaman and V. K. Gupta, Ind. Eng. Chem. Res., 2011, 50, 13589 CrossRef CAS.
- I. S. Bădescua, D. Bulgariub, I. Ahmad and L. Bulgariu, J. Environ. Manage., 2018, 224, 288 CrossRef PubMed.
- K. K. Kadimpati, Int. J. Phytorem., 2017, 19, 183 CrossRef CAS PubMed.
- B. Sarada, M. K. Prasad, K. K. Kumar and C. V. R. Murthy, J. Environ. Chem. Eng., 2014, 2, 1533 CrossRef CAS.
- K. K. Kishore, B. Sarada, M. K. Prasad and C. V. R. Murthy, Appl. Water Sci., 2013, 3, 85 CrossRef.
- D. Bulgariu and L. Bulgariu, Bioresour. Technol., 2012, 103, 489 CrossRef CAS.
- G. Kirova, Z. Velkova, M. Stoytcheva, Y. Hristova, I. Iliev and V. Gochev, Biotechnol. Equip., 2015, 29, 689 CrossRef CAS.
- X. Hu, L. Huang, J. Cao, H. Yang, D. Li, Y. Qiao, J. Zhao and Z. Zhang, PLoS One, 2020, 15, e0226557 CrossRef CAS.
- B. Sarada, M. K. Prasad, K. K. Kadimpati and C. V. R. Murthy, Int. J. Phytorem., 2013, 15, 756 CrossRef CAS PubMed.
- K. K. Kumar, M. K. Prasad, G. R. Lakshmi and C. V. R. Murthy, Desalin. Water Treat., 2013, 51, 5592 CrossRef.
- S. S. Salih and T. K. Ghosh, J. Environ. Chem. Eng., 2018, 6, 435 CrossRef CAS.
- J. Cai, M. Lei, J. R. Z. He, T. Chen, S. Liu, S. H. Fu, T. T. Li, G. Liu and P. Fei, Composites, Part A, 2017, 92, 10 CrossRef CAS.
- P. R. Choudhury, P. S. Bhattacharya, S. Ghosh, S. Majumdar, S. Saha and G. C. Sahoo, J. Environ. Chem. Eng., 2017, 5, 214 CrossRef CAS.
- G. Zhao, X. Ren, X. Gao, X. Tan, J. Li, C. Chen, Y. Huang and X. Wang, Dalton Trans., 2011, 40, 10945 RSC.
- A. Chhatri, J. Bajpai, A. K. Bajpao, S. S. Sandhu, N. Jain and J. Biawas, Carbohydr. Polym., 2011, 83, 876 CrossRef CAS.
- N. A. M. Zain, M. S. Suhaimi and A. Idris, Process Biochem., 2011, 46, 2122 CrossRef CAS.
- P. Xu, G. Zeng, D. Huang, S. Hu, C. Feng, C. Lai, M. Zhao, C. Huang, N. Li, Z. Wei and G. Xie, Colloids Surf., A, 2013, 419, 147 CrossRef CAS.
- L. Jiao, P. Qi, Y. Liu, B. Wang and L. Shan, J. Nanomater., 2015, 940985 Search PubMed.
- B. Agnès, D. Talbot, A. Sébastien and D. Vincent, J. Colloid Interface Sci., 2011, 362, 486 CrossRef PubMed.
- A. Kumar, S. Prasad, P. N. Saxena, N. G. Ansari and D. K. Patel, ACS Omega, 2011, 6, 3931–3945 CrossRef.
- X. B. Wang, W. P. Cai, Y. X. Lin, G. Z. Wang and C. H. Liang, J. Mater. Chem., 2010, 20, 8582 RSC.
- Y. Chong, T. Limei, L. Qingsong, B. Ailing, W. Yanqiu and Y. Yingmin, NANO: Brief Rep. Rev., 2015, 10, 15500741 Search PubMed.
- A. M. Holmes, I. M. Kempson, T. Turnbull, D. Paterson and M. S. Roberts, ACS Appl. Bio. Mater., 2020, 3, 3640 CrossRef CAS PubMed.
- K. Schilling, B. Bradford, D. Castelli, E. Dufour, J. F. Nash, W. Paper, S. Schulte, I. Tooley, B. Vanden and F. Schellauf, Photochem. Photobiol. Sci., 2010, 9, 495 CrossRef CAS.
- N. A. Monteiro-Riviere, K. Wiench, R. Landsiedel, S. Schulte, A. O. Inman and J. E. Riviere, Toxicol. Sci, 2011, 123, 264 CrossRef CAS.
- R. Meghana, S. Ponnusamy, M. Chellamuthu, C. Joseph, K. Satheesh and M. Enrico, Colloids Surf. B., 2013, 105, 24 CrossRef.
- R. D. C. Soltani, M. Mashayekhi, M. Naderi, G. Boczkaj, S. Jorfi and M. Safari, Ultrason. Sonochem., 2019, 55, 117 CrossRef CAS.
- Z. U. H. Khan, H. M. Sadiq, N. S. Shah and A. U. Khan, J. Photochem. Photobiol., B, 2019, 192, 147 CrossRef.
- V. S. Munagapati, V. Yarramuthi, S. K. Nadavala, S. R. Alla and K. Abburi, Chem. Eng. J., 2010, 157, 357 CrossRef CAS.
- C. Filote, G. Ungureanu, R. Boaventura, S. Santos, I. Volf and C. Botelho, Process Saf. Environ. Prot., 2017, 108, 34 CrossRef CAS.
- M. Isam, L. Baloo, S. R. M. Kutty and S. Yavari, Water, 2019, 11, 2325 CrossRef CAS.
- H. S. Alia, N. F. S. Kandila and I. B. M. Ibraheem, Desalin. Water Treat., 2020, 206, 250 CrossRef.
- A. Sulciute, K. Nishimura, E. Gilshtein, F. Cesano, G. Viscardi, A. G. Nasibulin, Y. Ohno and S. Rackauskas, J. Phys. Chem. C, 2021, 125, 1472 CrossRef CAS.
- M. A. Ismail, K. K. Taha, A. Modwi and L. Khezami, J. Ovonic Res., 2018, 14, 381 CAS.
- B. Sarada, M. K. Prasad, K. K. Kumar and C. V. R. Murthy, Environ. Sci. Pollut. Res., 2014, 21, 1314 CrossRef CAS.
- W. M. Ibrahim, J. Hazard. Mater., 2011, 192, 1827 CrossRef CAS.
- Y. Andrea, J. M. Holger, L. Martha, M. T. Jean and G. Eric, J. Hazard. Mater., 2011, 185, 922 CrossRef PubMed.
- B. Shi, W. Zuo, J. Zhang, H. Tong and J. Zhao, J. Environ. Qual., 2016, 45, 984 CrossRef CAS.
- Y.-C. Lee and S.-P. Chang, Bioresour. Technol., 2011, 102, 5297 CrossRef CAS PubMed.
- M. T. Cook, G. Tzortzis, D. Charalampopoulos and V. V. Khutoryanskiy, J. Control. Release, 2017, 162, 56 CrossRef PubMed.
- K. Won, S. Kim, K. J. Kim, H. W. Park and S. J. Moon, Process Biochem., 2005, 40, 2149 CrossRef CAS.
- M. Iram, C. Guo, Y. P. Guan, A. Ishfaq and H. Z. Liu, J. Hazard. Mater., 2010, 181, 1039 CrossRef CAS PubMed.
- M. M. R. Mohammad, R. Parisa, A. Atefeh and R. K. Ali, J. Hazard. Mater., 2011, 185, 401 CrossRef.
- E. Pertile, T. Dvorský, V. Václavík and S. Heviánková, Life, 2021, 11, 240 CrossRef CAS PubMed.
- N. N. Nassar, J. Hazard. Mater., 2010, 184, 538 CrossRef CAS.
- P. Xu, G. Zeng, D. Huang, S. Hu, C. Feng, C. Lai, M. Zhao, C. Huang, N. Li, Z. Wei and G. Xie, Colloids Surf., A, 2013, 419, 147 CrossRef CAS.
- M. M. Areco, S. Hanela, J. Duran and M. S. Afonso, J. Hazardous. Mater., 2012, 213, 123 CrossRef PubMed.
- A. Idris, N. S. M. Ismail, N. Hassan, E. Misran and N. Audrey-Flore, J. Ind. Eng. Chem., 2012, 18, 1582 CrossRef CAS.
- S. Tiwari, A. Hasan and L. M. Pandey, J. Environ. Chem. Eng., 2017, 5, 442 CrossRef CAS.
- J. Yang, B. Hou, J. Wang, B. Tian, J. Bi, N. Wang, X. Li and X. Huang, Nanomaterials, 2019, 9, 424 CrossRef CAS.
- S. Jastin, P. Mrudula, L. P. Madona, M. Arun, C. Natarajan and M. Amitava, Bioresour. Technol., 2013, 128, 423 CrossRef.
- C. Piar, B. Amit and B. P. Yogesh, Int. Biodeterior. Biodegrad., 2015, 97, 60 CrossRef.
- R. B. Nessim, A. R. Bassiouny, H. R. Zaki, M. N. Moawad and K. M. Kandeel, Chem. Ecol., 2011, 27, 579 CrossRef CAS.
- F. Zhang, B. Wang, P. Jie, J. Zhu and F. Cheng, Polymer, 2021, 228, 123878 CrossRef CAS.
- V. D. Kiosseoglou and P. Sherman, Colloid Polymer Sci., 1983, 261, 502 CrossRef CAS.
Footnote |
| † Electronic supplementary information (ESI) available. See DOI: https://doi.org/10.1039/d2nj04896e |
| This journal is © The Royal Society of Chemistry and the Centre National de la Recherche Scientifique 2023 |

