DOI:
10.1039/D2NJ04665B
(Paper)
New J. Chem., 2023,
47, 462-471
Construction of CoS/Cd0.5Zn0.5S ohmic heterojunctions for improving photocatalytic hydrogen production activity†
Received
21st September 2022
, Accepted 20th November 2022
First published on 21st November 2022
Abstract
CoS/Cd0.5Zn0.5S ohmic heterojunctions were successfully constructed by a two-step solvothermal method. The CoS/Cd0.5Zn0.5S heterojunctions were characterized by X-ray diffraction (XRD), scanning electron microscopy (SEM), transmission electron microscopy (TEM), X-ray photoelectron spectroscopy (XPS), UV-visible diffuse reflectance spectroscopy (UV-vis) and ultraviolet photoelectron spectroscopy (UPS). The introduction of CoS can effectively improve the photocatalytic hydrogen evolution activity of Cd0.5Zn0.5S, and its content has an impact on the activity of the CoS/Cd0.5Zn0.5S heterojunction. The hydrogen evolution rate of the 30%-CoS/Cd0.5Zn0.5S nanocomposite reached 6916.7 μmol g−1 h−1 in 3 vol% lactic acid aqueous solution with an optimal quantum efficiency of 9.32%, which is 5.1 times that of pure Cd0.5Zn0.5S. Moreover, the 30%-CoS/Cd0.5Zn0.5S sample shows good photocatalytic hydrogen production stability. Mechanistic studies suggest that CoS/Cd0.5Zn0.5S with an ohmic heterojunction can effectively transfer and separate the photogenerated electrons and holes, thereby improving the photocatalytic hydrogen production. This work could offer a facile and low-cost strategy for the construction of composite photocatalysts with high-efficiency hydrogen evolution.
1. Introduction
In recent years, the world has faced the threat of global warming caused by the depletion of fossil fuels and the rapid growth of CO2 emissions after combustion. Solar energy is a kind of clean energy, which is considered as a sustainable, renewable and abundant energy that can meet the current and future energy needs of mankind.1,2 Therefore, people are eager to use solar energy to make efficient and clean fuels to replace fossil energy through artificial photosynthesis. H2 is considered as a clean and sustainable new generation of energy, whose combustion products will only produce water without polluting gases, and H2 can be generated through water photolysis driven by solar energy.3,4 Therefore, the development of efficient photocatalysts is an effective means to convert solar energy into sustainable energy and replace fossil fuels.5
Up to now, many semiconductor photocatalysts, such as TiO2,6 SrTiO3,7 ZnS,8 SnO2,9 and g-C3N4,10 have been developed for photocatalytic water decomposition to produce hydrogen. However, only a few semiconductors have suitable band positions and visible-light response properties.11–13 Among many semiconductor photocatalysts, CdS-based photocatalysts have been proved to be effective photocatalysts due to their narrow bandgap and bandgap tunability.14,15 Pure CdS can easily form agglomerate particles and has inherent photocorrosion, which makes its photocatalytic hydrogen evolution performance low.16,17 It is an effective method to combine CdS and ZnS to form a CdZnS solid solution.18,19 In particular, the formation of solid solutions reduces the use of toxic Cd2+, the band gap position can be adjusted by changing the molar ratio of CdS and ZnS, and the photocatalytic hydrogen evolution performance can be better than that of CdS and ZnS under visible light irradiation.20 In order to improve the photocatalytic hydrogen evolution performance of CdZnS, many strategies have been developed, such as metal and non-metallic particle doping, cocatalyst loading, heterojunction strategy, etc.21–23 Among them, the supported cocatalyst is one of the best choices to improve the separation efficiency of photogenerated charges and photocatalytic activity.24
At present, noble metal cocatalysts such as Pt,21 Ru,25 Pd26 and Au27 have been widely used in photocatalytic hydrogen production. However, the scarcity and high cost of precious metals seriously limit their application in the field of photocatalysis. Therefore, efforts have been made to develop cheap and efficient noble metal-free cocatalysts. Some noble metal-free cocatalysts such as phosphides, oxides, sulfides and carbides have attracted extensive attention.28–32 Notably, transition metal phosphates with high conductivity and stability, such as Co4S3,33 CoS2,34 Co9S835,36 and CoS,37 have been proved to be excellent cocatalysts for photocatalytic hydrogen production.
In this work, the CoS/Cd0.5Zn0.5S photocatalyst was prepared by a two-step solvothermal method, and the effect of the content of CoS on the photocatalytic hydrogen evolution performance of Cd0.5Zn0.5S/CoS nanocomposite was investigated. The introduction of CoS was found to improve the photocatalytic performance. However, excessive CoS leads to a decrease of photocatalytic hydrogen evolution. When the molar ratio of CoS and Cd0.5Zn0.5S is 0.3, the photocatalytic hydrogen evolution efficiency of 30%-CoS/Cd0.5Zn0.5S can reach 6916.7 μmol g−1 h−1, which is 5.1 times that of pure Cd0.5Zn0.5S, and the optimized CoS/Cd0.5Zn0.5S nanocomposite shows high chemical stability. By analyzing the ultraviolet photoelectron spectroscopy (UPS) results of the prepared samples, the mechanism behind the improved hydrogen evolution under visible light is proposed.
2. Experimental section
2.1. The synthesis of Cd0.5Zn0.5S nanorods
All reagents were of analytical grade and used without further purification. 2.5 mmol Cd(CH3COOH)2·2H2O and 2.5 mmol Zn(CH3COOH)2·2H2O were put into 60 mL of ethylenediamine with stirring for 1 h. Then, 15 mmol thioacetamide was added to the above solution with further stirring for another 60 min. The obtained solution was transferred to a 100 mL Teflon-lined stainless steel autoclave and reacted at 180 °C for 14 h. After the reaction, the reactor was cooled to room temperature, and the final product was cleaned by centrifugation with deionized water and ethanol several times, and then dried under vacuum at 60 °C overnight.
2.2. Synthesis of CoS/Cd0.5Zn0.5S
10 mmol Cd0.5Zn0.5S solid solution was added to 60 mL of absolute ethanol with ultrasonic dispersion for 5 min, and then magnetically stirred for another 20 min to get solution A. Next, L-cysteine and CoCl2·6H2O were added to the above mixture and stirred for another hour. Then, the mixture was transferred to a 100 mL Teflon-lined stainless steel autoclave, and heated at 180 °C for 12 h. After the reaction is complete, the oven was cooled naturally to room temperature. The samples were washed several times by centrifugation with water and absolute ethanol, and then dried under vacuum at 60 °C overnight. The molar ratios of CoS and Cd0.5Zn0.5S were 0.1, 0.2, 0.3, 0.4, and 0.5, respectively, and the synthesized samples were marked as X-CoS/Zn0.5Cd0.5S (X = 10%, 20%, 30%, 40% and 50%).
2.3. Characterization
An X-ray powder diffractometer (XRD, Bruker D8 Advance) was used to characterize the crystal structure of the obtained samples. Elemental measurements of Co, Cd and Zn in the samples were determined by using inductively coupled plasma atomic emission spectrometry (ICP-OES, ThermoFisher iCAP PRO X). Scanning electron microscopy (SEM, Hitachi S-4800) and high resolution transmission electron microscopy (HRTEM, Thermo Scientific Talos F200X) were used to observe the morphology and microstructure of the samples. UV-vis spectra were recorded using a UV-vis spectrophotometer (DRS, Shimadzu UV-2550 spectrophotometer) with BaSO4 as the internal standard. X-ray photoelectron spectroscopy (XPS, Thermo Fisher Scientific ESCALAB 250Xi) was used to obtain the surface composition of the samples and their chemical states. A UV-vis spectrophotometer (DRS, Shimadzu UV-2550) was used to measure the absorbance of the obtained samples with BaSO4 as the background baseline. Time-resolved PL spectra (TRPL) were obtained with a time-resolved spectrometer (Edinburgh FLS980). Ultraviolet photoelectron spectroscopy (UPS) measurements were performed with He Iα (21.22 eV).
2.4. Evaluation of photoelectrochemical performance
Photoelectrochemical experiments were carried out on an electrochemical workstation equipped with three electrodes (CHI-660E, Shanghai Chenhua), using a 300 W Xenon lamp with a filter (λ ≥ 400 nm) as the visible light source, the standard Ag/AgCl electrode as the reference electrode, platinum wire (Pt) as the counter electrode, the sample coated FTO conductive glass as the working electrode, and 0.10 M Na2SO4 as the electrolyte. The preparation method of the working electrode was as follows: 5 mg of the sample was dispersed in a mixture solution composed of 1000 μL of isopropanol and 40 μL of Nafion by ultrasound treatment for 1 h to form a uniform suspension, and the suspension was spun evenly on conductive glass with specification of 1 cm × 2 cm using a desktop glue homogenizer (KW-4A) and air dried naturally.
2.5. Photocatalytic experiments
The photocatalytic hydrogen production experiments were carried out in a sealed glass reactor with a highly permeable quartz lid. Before the reaction, 30 mg of the sample was first dispersed into a 70 mL glass reactor containing 3 vol% lactic acid aqueous solution and sonicated for 10 min. Then, the glass reactor was vacuumized for 30 min to remove the dissovled air. The temperature of the whole reaction process was controlled at 15 °C using a cooling circulating water system. A 300 W Xenon lamp (CEL-HXF300, Beijing Zhongjiaojinyuan Source) with a filter (λ ≥ 400 nm) was used as the light source. The yield of H2 was determined by gas chromatography (GC-7920) and the whole reaction process was 3 h. The H2 yield was quantified using a standard curve.
The apparent quantum efficiency (AQE) of 30%-CoS/Cd0.5Zn0.5S was evaluated using the same photocatalytic hydrogen process except for light sources using band-pass filters (420 nm). The AQE is calculated according to the following eqn (1):
| |  | (1) |
where
NA is the Avogadro constant (6.02 × 10
23 mol
−1),
n is the number of moles of hydrogen produced at 420 nm (0.4549 mmol),
h is the Planck constant (6.626 × 10
−34 J s
−1),
c is the light speed (3 × 10
8 m s
−1),
S represents the irradiation area (here in 19.63 cm
2),
P is the intensity of irradiation light (here in 39.47 mW cm
−2),
t refers to the photoreaction time (3600 s), and
λ is the wavelength of light (420 nm).
3. Results and discussion
3.1. Crystal structure and morphology
Fig. 1 shows the XRD pattern of pure CoS. The obvious diffraction peaks of pure CoS are located at 2θ = 30.5°, 35.3°, 47.0° and 54.3°, which correspond to the (100), (101), (102) and (110) crystal planes of CoS (JCPDS No. 75-0605).38Fig. 1 shows the XRD patterns of CoS/Cd0.5Zn0.5S nanocomposites with different amounts of CoS. Compared with the standard diffraction peaks of ZnS and CdS, the diffraction peaks of Cd0.5Zn0.5S are slightly shifted to higher angles, indicating that the sample is not a simple mixture of ZnS (PDF No. 05-0566) and CdS (PDF No. 41-1049), but forms a solid solution of Cd0.5Zn0.5S.39 The diffraction peak of Cd0.5Zn0.5S did not shift significantly after CoS loading on the surface of Cd0.5Zn0.5S, which indicates that the loading of CoS does not affect the crystal structure of Cd0.5Zn0.5S. By comparing the XRD patterns of pure CoS and CoS/Cd0.5Zn0.5S nanocomposites, three weak peaks of CoS at 2θ = 30.5°, 35.3° and 47.0° are observed, which may be due to the good distribution of CoS on the surface of Cd0.5Zn0.5S.40 The X value was determined via an inductively coupled plasma optical emission spectrometry (ICP-OES) analysis. Table S1 (ESI†) shows that the composition of the solid is close to that designed in the synthesis. Meanwhile, HRTEM further confirmed the formation of the CoS/Cd0.5Zn0.5S nanocomposite, shown in Fig. 3.
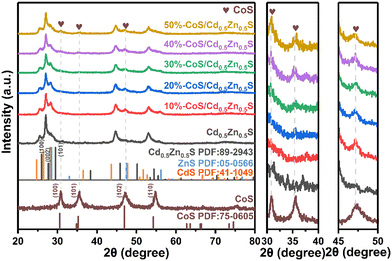 |
| | Fig. 1 The XRD patterns of pure CoS, Cd0.5Zn0.5S and different CoS/Cd0.5Zn0.5S nanocomposites. | |
Fig. 2 shows the SEM images of the prepared sample. In Fig. 2a, pure Cd0.5Zn0.5S exhibits regular nanorods with slight agglomeration. In Fig. 2b, CoS shows a lamellar packing structure with an irregular shape and a large number of holes. The SEM images of CoS/Cd0.5Zn0.5S nanocomposites in Fig. 2c and d show that Cd0.5Zn0.5S nanorods became rough, which indicated that the surface of Cd0.5Zn0.5S was covered by CoS nanosheets.
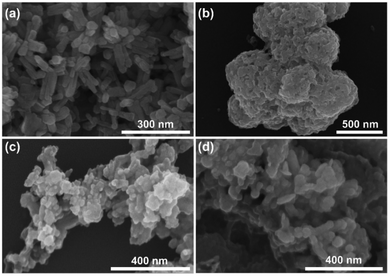 |
| | Fig. 2 The SEM images of Cd0.5Zn0.5S (a), CoS (b), 10%-CoS/Cd0.5Zn0.5S nanocomposite (c) and 30%-CoS/Cd0.5Zn0.5S nanocomposite (d). | |
Fig. 3 shows the TEM images of Cd0.5Zn0.5S, CoS and 30%-CoS/Cd0.5Zn0.5S. As shown in Fig. 3a and b, pure Cd0.5Zn0.5S is composed of nanorods with a diameter of about 20 nm, and the HRTEM image (Fig. 3b) shows distinct lattice fringes with a spacing of 0.34 nm, which belong to the (100) crystal plane of hexagonal Cd0.5Zn0.5S.41 The high-angle annular dark field image (Fig. S1a, ESI†) and the corresponding energy dispersive X-ray (EDX) mapping images (Fig. S1b–e, ESI†) further reveal the element composition and distribution of Cd0.5Zn0.5S. The TEM image in Fig. 3c shows irregular overlapping of CoS layered structures. The HRTEM image (Fig. 3d) shows the lattice fringes with interplanar distances of 0.20 nm and 0.25 nm corresponding to the spacing of the (102) and (101) plane of CoS,42,43 respectively. In the TEM image of the 30%-CoS/Cd0.5Zn0.5S nanocomposite (Fig. 3e), the shape of Cd0.5Zn0.5S did not change significantly after loading CoS, and its diameter was increased to about 30 nm. As shown in Fig. 3f, the HRTEM image of 30%-CoS/Cd0.5Zn0.5S shows that the lattice fringes of 0.34 nm and 0.25 nm are attributed to the (100) and (101) crystal planes of Cd0.5Zn0.5S and CoS, respectively. These results not only demonstrated the successful synthesis of the CoS/Cd0.5Zn0.5S nanocomposite, but also confirmed the close contact between CoS and Cd0.5Zn0.5S, which was in favor of electron transport.
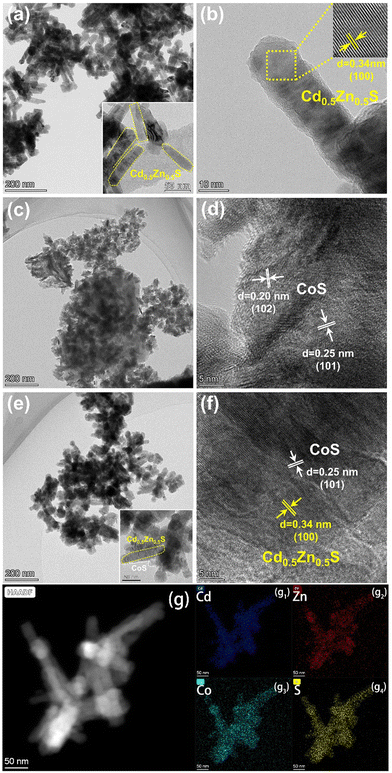 |
| | Fig. 3 TEM image of the prepared sample: (a and b) Cd0.5Zn0.5S; (c and d) CoS; (e and f) 30%-CoS/Cd0.5Zn0.5S; and (g) elemental mapping of 30%-CoS/Cd0.5Zn0.5S. | |
XPS was used to investigate the surface composition and chemical state of the prepared photocatalyst, and the results are shown in Fig. 4. As shown in Fig. 4a, the elements of Cd, Zn and S in the survey spectrum of Cd0.5Zn0.5S, Cd, Zn, S and Co in the survey spectrum of 30%-CoS/Cd0.5Zn0.5S, and Co and S in the survey spectrum of CoS can be observed. In Fig. 4b, the XPS spectrum of Cd 3d for Cd0.5Zn0.5S showed the two characteristic peaks with binding energies of 404.4 eV and 411.2 eV ascribed to Cd 3d5/2 and Cd 3d3/2, respectively, indicating the characteristics of Cd2+.44 In the Zn 2p spectrum (Fig. 4c), two peaks at 1021.2 eV (Zn 2p3/2) and 1044.2 eV (Zn 2p1/2) are assigned to the Zn (+2) chemical state of Cd0.5Zn0.5S.45 Moreover, the XPS spectrum of S 2p in Cd0.5Zn0.5S (Fig. 4d) showed two peaks, located at 160.9 eV and 162.1 eV, respectively, which are characteristic of S2−.46 The peaks for S 2p in 30%-CoS/Cd0.5Zn0.5S shift to a lower binding energy compared with those of pure CoS, which is attributed to the fact that the transfer of electrons from Cd0.5Zn0.5S to CoS was facilitated at the two-phase interface by CoS loading.47–49 The Co 2p spectra of CoS and 30%-CoS/Cd0.5Zn0.5S are shown in Fig. 4e and the Co 2p spectrum was fitted to six peaks. For pure CoS, the binding energies at 785.0 eV and 802.6 eV are ascribed to the satellite peaks of Co 2p, while the binding energies at 778.8 eV and 793.9 eV are ascribed to Co 2p3/2 and 2p1/2, which indicate the existence of Co3+.50 The other two peaks located at 780.6 and 796.5 eV are ascribed to Co 2p3/2 and 2p1/2, which indicates the existence of Co2+.50 Compared to pure CoS, the Co binding energies of 30%-CoS/Cd0.5Zn0.5S are shifted to a lower binding energy, which also demonstrates the formation of the CoS/Cd0.5Zn0.5S heterojunction.
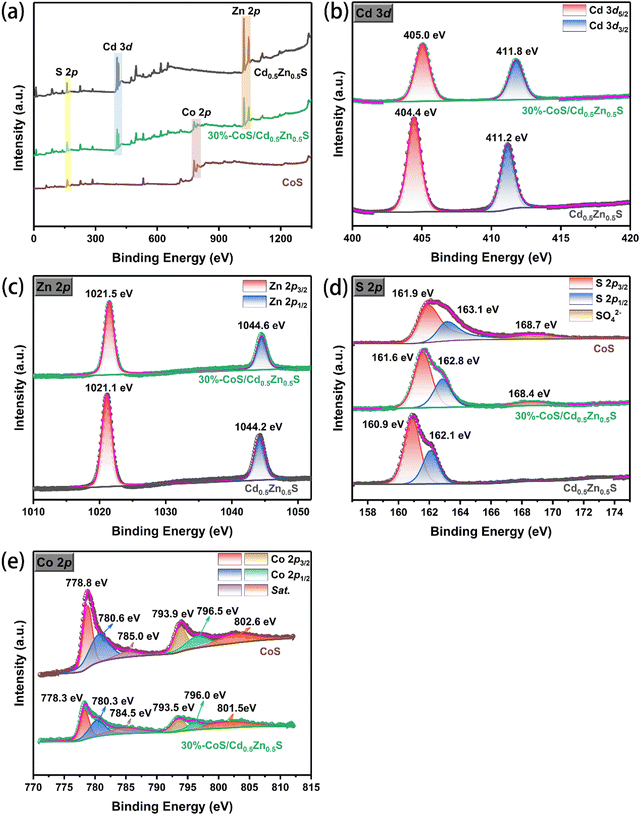 |
| | Fig. 4 XPS results of Cd0.5Zn0.5S, CoS and 30%-CoS/Cd0.5Zn0.5S nanocomposite: (a) full range survey spectra; (b) Cd 3d; (c) Zn 2p; (d) S 2p; and (e) Co 2p. | |
In order to deeply understand the effect of CoS loading on the optical properties of Cd0.5Zn0.5S, UV-vis DRS was used to explore the optical capture capability of the CoS/Cd0.5Zn0.5S composite. As shown in Fig. 5a, the absorption edge of pure Cd0.5Zn0.5S appears at 506 nm. Compared with pristine Cd0.5Zn0.5S, the visible light absorption intensity of binary CoS/Cd0.5Zn0.5S nanocomposites increases with the increment of CoS loading, and the absorption edge of the 30%-CoS/Cd0.5Zn0.5S nanocomposite redshifts to 755 nm, which indicated that heterojunctions are formed between CoS and Cd0.5Zn0.5S, thus improving the separation efficiency of photogenerated carriers. According to Fig. 5b, the corresponding bandgap value (Eg) was estimated by the formula αhv = A(hv − Eg)n/2 for Cd0.5Zn0.5S and 30%-CoS/Cd0.5Zn0.5S, respectively.51 The calculation results as shown in Fig. 5b and the bandgap values of pure Cd0.5Zn0.5S and 30%-CoS/Cd0.5Zn0.5S are 2.51 and 2.08 eV, respectively. The optical absorption competence of the CoS/Cd0.5Zn0.5S nanocomposites was effectively enhanced because of the introduction of CoS due to its black intrinsic color, which is conducive to enhancing photocatalytic performance.
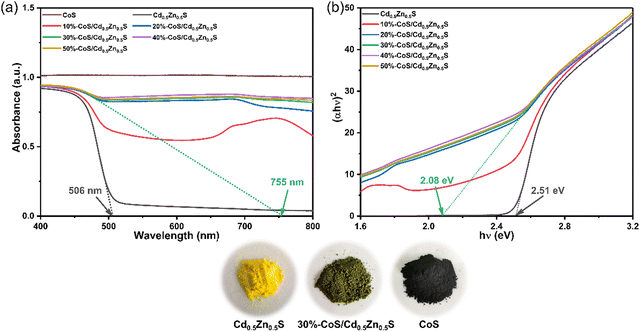 |
| | Fig. 5 (a) UV-vis diffuse reflectance spectra of the as-prepared different samples. (b) Tauc plots of the as-prepared different samples. | |
3.2. Photocatalytic hydrogen evolution activity
The photocatalytic hydrogen evolution of pure Cd0.5Zn0.5S and CoS/Cd0.5Zn0.5S nanocomposites was evaluated in aqueous solution containing lactic acid as the sacrificial reagent with visible light irradiation (λ > 400 nm). In Fig. 6a, pure Cd0.5Zn0.5S can achieve 122.1 μmol of hydrogen production in 3 h, which can be attributed to the low electron transfer efficiency and rapid recombination of charges. By increasing the amount of CoS in the CoS/Cd0.5Zn0.5S nanocomposite, the photocatalytic hydrogen evolution performance of the CoS/Cd0.5Zn0.5S nanocomposite is enhanced accordingly. When the molar ratio of CoS and Cd0.5Zn0.5S is 0.3, the amount of H2 production reaches 622.5 μmol, which is about 5.1 times higher than that of pure Cd0.5Zn0.5S. By further increasing the modification amounts of CoS in CoS/Cd0.5Zn0.5S, the photocatalytic performance was decreased, which is attributed to the fact that excessive CoS would inhibit hydrogen production activity. Therefore, CoS played a role of accelerating the separation of electrons with a moderate loading, which will provide more reactive sites, facilitating H2 production. Fig. 6b shows the hydrogen evolution rate of different samples. Cd0.5Zn0.5S, 10%-CoS/Cd0.5Zn0.5S, 20%-CoS/Cd0.5Zn0.5S, 30%-CoS/Cd0.5Zn0.5S, 40%-CoS/Cd0.5Zn0.5S and 50%-CoS/Cd0.5Zn0.5S can achieve photocatalytic hydrogen evolution rates of 1356.6 μmol h−1 g−1, 1669.6 μmol h−1 g−1, 4413.1 μmol h−1 g−1, 6916.7 μmol h−1 g−1, 3924.4 μmol h−1 g−1 and 3123.2 μmol h−1 g−1, respectively. We found that the hydrogen production activity of 30%-CoS/Cd0.5Zn0.5S was better than that of some photocatalysts in the literature (summarized in Fig. 6d and Table S2, ESI†).2,52–62 The stability of a photocatalyst is vital for a catalytic reaction. Therefore, the cycling stability of the 30%-CoS/Cd0.5Zn0.5S nanocomposite was measured every three hours as one cycle and the results are shown in Fig. 6c. The 30%-CoS/Cd0.5Zn0.5S nanocomposite does not show significant decrease of photocatalytic H2-production activity. As shown in Fig. S2 (ESI†), the XPS results indicate that the chemical state of the 30%-CoS/Cd0.5Zn0.5S nanocomposite showed no significant change after the photocatalytic HER. Meanwhile, 30%-CoS/Cd0.5Zn0.5S displayed a good HER apparent quantum efficiency (AQE) of 9.32% at 420 nm.
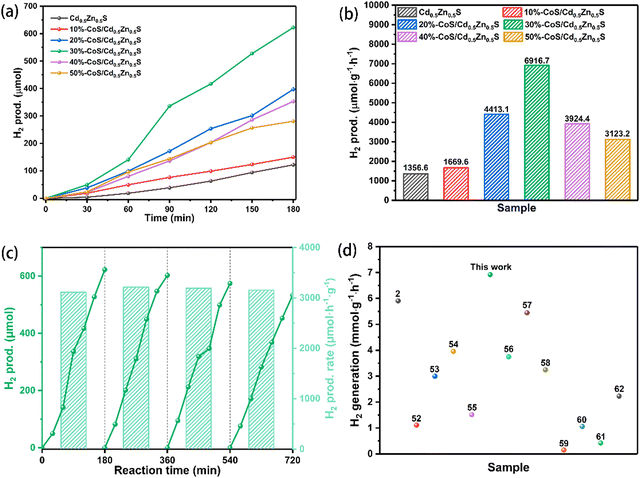 |
| | Fig. 6 The photocatalytic hydrogen production activities (a and b) of different samples under visible light irradiation (λ > 400 nm) in the presence of lactic acid. (c) Recycling test of 30%-CoS/Cd0.5Zn0.5S and (d) comparison of photocatalytic hydrogen production rates of different photocatalysts. | |
3.3. Separation and transfer efficiency of charge carriers
The separation efficiency of a photoexcitation carrier can be shown by fluorescence intensity. In Fig. 7a, pure Cd0.5Zn0.5S shows a strong emission signal at 465 nm because of the highest recombination rate of electrons and holes. However, the fluorescence emission signal of 30%-CoS/Cd0.5Zn0.5S is reduced, which could be because the addition of the cocatalyst CoS effectively promoted the separation of charges.63 The rapid separation of electrons and holes enables more electrons to take part in the reduction, thus faciliating the enhancement of the photocatalytic activity of 30%-CoS/Cd0.5Zn0.5S.
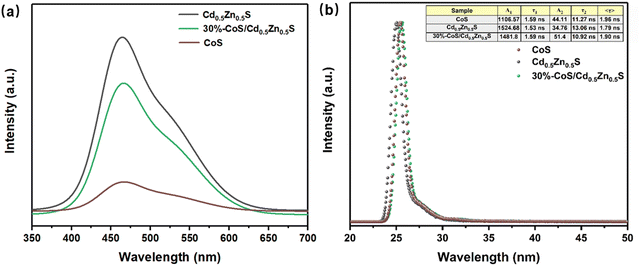 |
| | Fig. 7 (a) PL spectra of Cd0.5Zn0.5S, CoS and 30%-CoS/Cd0.5Zn0.5S; (b) TRPL spectra of Cd0.5Zn0.5S, CoS and 30%-CoS/Cd0.5Zn0.5S. | |
The charge separation efficiency of the samples is further studied using time-resolved photoluminescence (TRPL) spectra.64,65Fig. 7b shows the time-resolved PL (TRPL) profiles of Cd0.5Zn0.5S and 30%-CoS/Cd0.5Zn0.5S, which help to evaluate the transfer efficiency of photogenerated carriers. The value of τ is calculated using the following eqn (2):66
| |  | (2) |
where
A1 and
A2 are the constants obtained after fitting the decay curves, corresponding to non-radiative and radiative relaxation processes, respectively.
τ1 and
τ2 represent fast and slow lifetimes, caused by non-radiative and radiative complexes, respectively. The specific fitted data are presented in the inserted table. The lifetime of charge carriers of 30%-CoS/Cd
0.5Zn
0.5S (
τ = 1.90 ns) is longer than that of pure Cd
0.5Zn
0.5S (
τ = 1.79 ns). Therefore, the transfer efficiency of the photogenerated carriers was improved after CoS loading on the surface of Cd
0.5Zn
0.5S, which improves the photocatalytic hydrogen activity.
2
The electrochemical properties of catalysts are crucial for the hydrogen evolution reaction; therefore, electrochemical tests for Cd0.5Zn0.5S, CoS, 10%-CoS/Cd0.5Zn0.5S and 30%-CoS/Cd0.5Zn0.5S are performed. As shown in Fig. 8a, the transient photocurrent–time curves (I–t curves) are obtained using the cyclic switching light source in order to study the photochemical properties. The results show that 30%-CoS/Cd0.5Zn0.5S has the highest photocurrent intensity of all the tested samples, which indicates that the addition of CoS improved the electron utilization efficiency and led to more efficient electron transfer. Hence 30%-CoS/Cd0.5Zn0.5S showed the best H2 evolution performance. Electrochemical impedance spectroscopy (EIS) is used to provide more evidence for the charge transfer efficiency of the catalyst. As shown in Fig. 8b, the 30%-CoS/Cd0.5Zn0.5S nanocomposite has the minimum resitance curve, which shows that it has the minimum resistance to effectively transmit electrons from the conduction band of Cd0.5Zn0.5S. The above analysis is consistent with the results of TRPL.
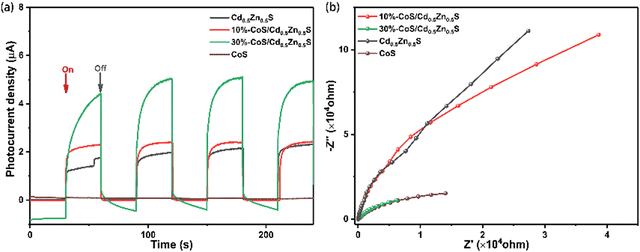 |
| | Fig. 8 (a) Transient photocurrent and (b) Nyquist impedence plots of the different as-prepared samples. | |
3.4. Mechanism for photocatalytic H2 evolution
In order to investigate the photocatalytic mechanism, UPS is performed (Fig. 9a and b), and the WF (work function), EV and EC can be estimated based on the following eqn (3)–(6):67,68where E1 is the upper emission onset energy, E2 is the lower emission onset energy, ENHE is the energy of normal hydrogen electrode and EAVS is the energy of absolute vacuum. The EV and EC values of Cd0.5Zn0.5S are presented in Table 1. Therefore, the energy levels of Cd0.5Zn0.5S and CoS are shown in Fig. 9c based on the results of the UPS and UV-vis spectra, and pure CoS only shows its metallic properties. The work functions of Cd0.5Zn0.5S (Ws) and CoS (Wm) are 4.81 eV and 4.21 eV, respectively (Fig. 9c). This result suggests that the Ef of CoS is higher than that of Cd0.5Zn0.5S, inferring the formation of ohmic contact between Cd0.5Zn0.5S and CoS. When CoS is loaded on the surface of Cd0.5Zn0.5S, electrons will transfer from CoS to Cd0.5Zn0.5S until the Fermi levels for both components are equal. After thermal equilibrium is established between them, the photogenerated electrons produced by Cd0.5Zn0.5S are transferred to CoS, which is shown in Fig. 9d. This can prevent electron–hole recombination in photocatalysis, which results in an enhanced photocatalytic performance. As a consequence, under visible light irradiation, the electrons accumulated on CoS can reduce H+ to H2 and the holes stacked in the valence band of CdS can oxidize lactic acid to the oxidation products, thus accomplishing photocatalytic H2 production from H2O under visible light.
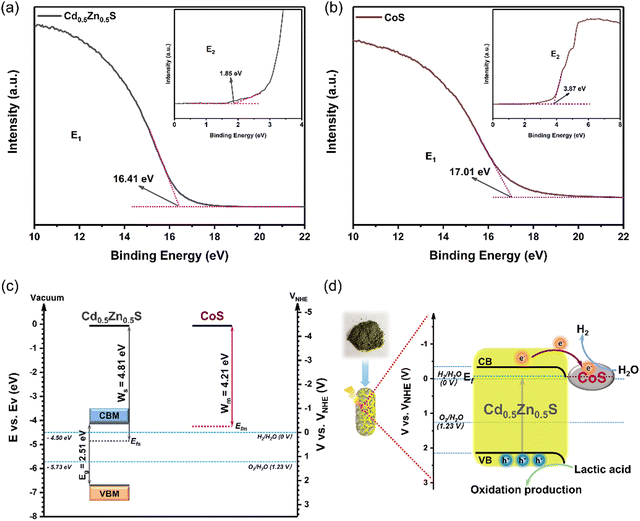 |
| | Fig. 9 UPS spectra of Cd0.5Zn0.5S (a) and CoS (b). The band structure diagram of Cd0.5Zn0.5S and CoS (c). The photocatalytic enhanced mechanism of CoS loading on Cd0.5Zn0.5S for H2 evolution (d). | |
Table 1 Bandgaps (Eg), work function (WF), valence band (EVBM), and conduction band (ECBM) of Cd0.5Zn0.5S and CoS
| Sample |
E
g
|
W
F
|
E
VBM(AVS) |
E
VBM(NHE) |
E
CBM(AVS) |
E
CBM(NHE) |
| Cd0.5Zn0.5S |
2.51 |
4.81 |
−6.66 |
2.16 |
−4.15 |
−0.35 |
| CoS |
|
4.21 |
|
|
|
|
4. Conclusions
In summary, a series of CoS modified Cd0.5Zn0.5S heterojunctions were synthesized via a two-step solvothermal method. The results reveal that CoS is an effective and stable cocatalyst to improve the photocatalytic H2 evolution activity of Cd0.5Zn0.5S. The CoS/Cd0.5Zn0.5S nanocomposite with an optimized composition shows a photocatalytic H2 evolution rate of 6916.7 μmol h−1 g−1 with an apparent quantum efficiency (AQE) of 9.32% measured at 420 nm, which is 5.1 times that of pure Cd0.5Zn0.5S. Moreover, the CoS/Cd0.5Zn0.5S nanocomposite shows excellent stability over four cycles of photocatalytic H2 production. According to the results from PEC and TRPL, the improved photocatalytic H2 evolution performance was mainly attributed to the efficient separation of charge carriers caused by the formed CoS/Cd0.5Zn0.5S heterojunction. During photocatalytic H2 evolution, CoS acts as an electron-trapping center and a highly active site to prevent charge recombination, and improve the photocatalytic H2 evolution activity. This work demonstrates that low cost and earth-abundant CoS can replace noble metals as a highly efficient cocatalyst for photocatalytic H2 evolution.
Author contributions
Shuhan Jiang: methodology, investigation, and funding acquisition. Luping Shen: validation, formal analysis, visualization, and writing – original draft. Yanan Liu: validation and formal analysis. Shuaikang Qi: resources and data curation. Zhufeng Lu: resources, investigation, data curation, and writing – review & editing. Lei Li: validation, formal analysis, and visualization. Hongxia Ma: resources and data curation. Hongmei Wang: formal analysis, writing – review & editing, and funding acquisition.
Conflicts of interest
There are no conflicts to declare.
Acknowledgements
This work was financially supported by the Natural Science Foundation of Zhejiang Province (No. LY22E020009) and the Scientific Training Program for College Students of Jiaxing University (No. 8517221490).
References
- C. Bie, H. Yu, B. Cheng, W. Ho, J. Fan and J. Yu, Adv. Mater., 2021, 33, 2003521 CrossRef CAS PubMed.
- G. Wang, Y. Quan, K. Yang and Z. Jin, J. Mater. Sci. Technol., 2022, 121, 28–39 CrossRef.
- W. Xue, W. Chang, X. Hu, J. Fan and E. Liu, Chin. J. Catal., 2021, 42, 152 CrossRef CAS.
- Y. Sun, X. Wang, Q. Fu and C. Pan, Appl. Surf. Sci., 2021, 564, 150379 CrossRef CAS.
- X. Zhao, J. Feng, J. Liu, W. Shi, G. Yang, G. C. Wang and P. Cheng, Angew. Chem., Int. Ed., 2018, 57, 9790–9794 CrossRef CAS.
- K. Sekar, C. Chuaicham, B. Vellaichamy, W. Li, W. Zhuang, X. Lu, B. Ohtani and K. Sasaki, Appl. Catal., B, 2021, 294, 120221 CrossRef CAS.
- M. Ganapathy, C. Tang and V. Alagan, Int. J. Hydrogen Energy, 2022, 47, 27555–27565 CrossRef CAS.
- S. Sun, D. Ren, M. Yang, J. Cui, Q. Yang and S. Liang, Int. J. Hydrogen Energy, 2022, 47, 9201–9208 CrossRef CAS.
- M. A. Ahmed, A. Fahmy, M. G. Abuzaid and E. M. Hashem, J. Photoch. Photobio. A, 2020, 400, 112660 CrossRef CAS.
- X. Zhang, H. Liang, C. Li and J. Bai, Inorg. Chem. Commun., 2022, 144, 109838 CrossRef CAS.
- C. Xiao, S. Gao, Z. Cui, X. Liu, Z. Wang, Y. Lu, R. Sa, Q. Li and Z. Ma, Int. J. Hydrogen Energy, 2022, 47, 28869–28878 CrossRef CAS.
- Q. Wang, S. Zhu, S. Zhao, C. Li, R. Wang, D. Cao and G. Liu, Fuel, 2022, 322, 124163 CrossRef CAS.
- B. Sun, J. Bu, X. Chen, D. Fan, S. Li, Z. Li, W. Zhou and Y. Du, Chem. Eng. J., 2022, 435, 135074 CrossRef CAS.
- H. Long, P. Wang, X. Wang, F. Chen and H. Yu, Appl. Surf. Sci., 2022, 604, 154457 CrossRef CAS.
- L. Chen, D. Wang, Y. Xia, R. Liang, R. Huang and G. Yan, Int. J. Hydrogen Energy, 2022, 47, 28486–28494 CrossRef CAS.
- Y. Wang, X. Wang, Y. Ji, R. Bian, J. Li, X. Zhang, J. Tian, Q. Yang and F. Shi, Int. J. Hydrogen Energy, 2022, 47, 22045–22057 CrossRef CAS.
- D. Zhao and C. F. Yang, Renewable Sustainable Energy Rev., 2016, 54, 1048–1059 CrossRef CAS.
- D. Huang, M. Wen, C. Zhou, Z. Li, M. Cheng, S. Chen, W. Xue, L. Lei, Y. Yang, W. Xiong and W. Wang, Appl. Catal., B, 2020, 267, 118651 CrossRef CAS.
- T. Yu, Z. Lv, K. Wang, K. Sun, X. Liu, G. Wang, L. Jiang and G. Xie, J. Power Sources, 2019, 438, 227014 CrossRef CAS.
- L. Wu, J. Gong, L. Ge, C. Han, S. Fang, Y. Xin, Y. Li and Y. Lu, Int. J. Hydrogen Energy, 2016, 41, 14704–14712 CrossRef CAS.
- B. Lv, X. Feng, X. Feng, X. Wang, Z. Yuan, B. Xu, Y. Yang and F. Zhang, Appl. Surf. Sci., 2021, 569, 151096 CrossRef CAS.
- Z. W. Mei, B. K. Zhang, J. X. Zheng, S. Yuan, Z. Q. Zhuo, X. G. Meng, Z. H. Chen, K. Amine, W. L. Yang, L. W. Wang, W. Wang, S. F. Wang, Q. H. Gong, J. Li, F. S. Liu and F. Pan, Nano Energy, 2016, 26, 405–416 CrossRef CAS.
- A. P. Gaikwad, D. Tyagi, C. A. Betty and R. Sasikala, Appl. Catal., A, 2016, 517, 91–99 CrossRef CAS.
- C. Bie, B. Cheng, J. Fan, W. Ho and J. Yu, EnergyChem, 2021, 3, 100051 CrossRef CAS.
- B. Tahir, M. Tahir, M. G. M. Nawawai, A. H. Khoja, B. Ul Haq and W. Farooq, Int. J. Hydrogen Energy, 2021, 46, 27997–28010 CrossRef CAS.
- Z. Xie, J. Chen, Y. Chen, T. Wang, X. Jiang, Y. Xie and C. Z. Lu, Appl. Surf. Sci., 2022, 579, 152003 CrossRef CAS.
- P. Jiménez-Calvo, V. Caps and V. Keller, Renewable Sustainable Energy Rev., 2021, 149, 111095 CrossRef.
- L. Chen, H. Huang, Y. Zheng, W. Sun, Y. Zhao, X. Wang and S. Francis Paul, Dalton Trans., 2018, 47, 12188–12196 RSC.
- X. L. Yin, L. L. Li, M. L. Liu, D. C. Li, L. Shang and J. M. Dou, Chem. Eng. J., 2019, 370, 305–313 CrossRef CAS.
- P. Wang, S. Zhan, H. Wang, Y. Xia and R. R. Kumar, Appl. Catal., B, 2018, 230, 210–219 CrossRef CAS.
- B. Li, W. Wang, J. Zhao, Z. Wang, B. Su, Y. Hou, Z. Ding, W. J. Ong and S. Wang, J. Mater. Chem. A, 2021, 9(16), 10270–10276 RSC.
- H. Chen, F. Wang, K. Wang, Y. Wu and C. Guo, J. Colloid Interface Sci., 2022, 624, 296–306 CrossRef CAS.
- S. Guo, Y. Li, C. Xue, Y. Sun, C. Wu, G. Shao and P. Zhang, Chem. Eng. J., 2021, 419, 129213 CrossRef CAS.
- J. Tang, B. Gao, J. Pan, L. Chen, Z. Zhao, S. Shen, J. K. Guo, C. T. Au and S. F. Yin, Appl. Catal., A, 2019, 588, 117281 CrossRef CAS.
- C. Feng, Z. Chen, J. Jing, M. Sun, J. Han, K. Fang and W. Li, J. Photoch. Photobio. A, 2021, 409, 113160 CrossRef CAS.
- S. Wang, B. Y. Guan, X. Wang and X. W. D. Lou, J. Am. Chem. Soc., 2018, 140(45), 15145–15148 CrossRef CAS.
- S. Liu, Y. Ma, D. Chi, Y. Sun, Q. Chen, J. Zhang, Z. He, K. Zhang and B. Liu, Int. J. Hydrogen Energy, 2022, 47, 9220–9229 CrossRef CAS.
- H. Peng, J. Yong, H. Wang, Y. Wang, Y. Gou, F. Wang and X. Zheng, Int. J. Hydrogen Energy, 2022, 47, 31269–31278 CrossRef CAS.
- M. Huang, J. Yu, C. Deng, Y. Huang, M. Fan, B. Li, Z. Tong, F. Zhang and L. Dong, Appl. Surf. Sci., 2016, 365, 227–239 CrossRef CAS.
- L. Song, S. Zhang, D. Liu, S. Sun and J. Wei, Int. J. Hydrogen Energy, 2020, 45, 8234–8242 CrossRef CAS.
- A. P. Gaikwad, D. Tyagi, C. A. Betty and R. Sasikala, Appl. Catal., A, 2016, 517, 91–99 CrossRef CAS.
- Q. Geng, Y. Li and H. Xie, Vacuum, 2022, 203, 111308 CrossRef CAS.
- Y. Wu, J. Cheng, Z. Liang, T. Qiu, Y. Tang, J. Shi, S. Gao, R. Zhong and R. Zou, Carbon, 2022, 198, 353–363 CrossRef CAS.
- L. Sun, L. Li, J. Yang, J. Fan and Q. Xu, Chin. J. Catal., 2022, 43, 350–358 CrossRef CAS.
- G. K. Kiran, T. V. M. Sreekanth, P. C. Nagajyothi, K. Yoo and J. Kim, Mater. Lett., 2022, 316, 132026 CrossRef CAS.
- X. L. Yin, L. L. Li, Y. L. Wang, L. H. Yao, X. Y. Li and Y. Lu, Int. J. Hydrogen Energy, 2022, 47, 20103–20111 CrossRef CAS.
- Z. Zhang, L. Huang, J. Zhang, F. Wang, Y. Xie, X. Shang, Y. Gu, H. Zhao and X. Wang, Appl. Catal., B, 2018, 233, 112–119 CrossRef CAS.
- J. Tian, W. Xue, M. Li, T. Sun, X. Hu, J. Fan and E. Liu, Catal. Sci. Technol., 2022, 12, 3165–3174 RSC.
- Z. Liang and X. Dong, J. Photochem. Photobiol. A, 2021, 407, 113081 CrossRef CAS.
- H. Zhou and J. Hu, Mater. Lett., 2017, 195, 26–30 CrossRef CAS.
- X. Zhang, Z. Cheng, P. Deng, L. Zhang and Y. Hou, Int. J. Hydrogen Energy, 2021, 46, 15389–15397 CrossRef CAS.
- H. Yang, J. Tang, Y. Luo, X. Zhan, Z. Liang, L. Jiang, H. Hou and W. Yang, Small, 2021, 17(36), 2102307 CrossRef CAS.
- B. Gong, Y. Lu, P. Wu, Z. Huang, Y. Zhu, Z. Dang, N. Zhu, G. Lu and J. Huang, Appl. Surf. Sci., 2016, 365, 280–290 CrossRef CAS.
- Y. Wang, H. Jin, Y. Li, J. Fang and C. Chen, Int. J. Hydrogen Energy, 2022, 47(2), 962–970 CrossRef CAS.
- C. Zheng, G. Jiang and Z. Jin, Int. J. Hydrogen Energy, 2022, 47(1), 292–304 CrossRef CAS.
- S. Qi, Y. Miao, J. Chen, H. Chu, B. Tian, B. Wu, Y. Li and B. Xin, Nanomaterials, 2021, 11(6), 1357 CrossRef CAS PubMed.
- Y. Zou, C. Guo, X. Cao, T. Chen, Y. Kou, L. Zhang, T. Wang, N. Akram and J. Wang, Int. J. Hydrogen Energy, 2022, 47(60), 25289–25299 CrossRef CAS.
- T. Bai, X. Shi, M. Liu, H. Huang, J. Zhang and X. H. Bu, RSC Adv., 2021, 11(60), 38120–38125 RSC.
- M. Imran, A. B. Yousaf, M. Farooq and P. Kasak, Int. J. Hydrogen Energy, 2022, 47(13), 8327–8337 CrossRef CAS.
- X. Wang, L. Li, H. Gu, H. Zhang, J. Zhang, Q. Zhang and W. L. Dai, Appl. Surf. Sci., 2022, 574, 151553 CrossRef CAS.
- P. Mu, M. Zhou, K. Yang, C. Zhou, Y. Mi, Z. Yu, K. Lu, Z. Li, S. Ouyang, W. Huang and C. Yu, Energy Fuels, 2021, 5(22), 5814–5824 CAS.
- Y. Hao, Z. Min, H. Guo, P. Shi, Y. Min, J. Fan and Q. Xu, Appl. Surf. Sci., 2021, 546, 149137 CrossRef CAS.
- B. Li, F. Wei, B. Su, Z. Guo, Z. Ding, M. Q. Yang and S. Wang, Mater. Today Energy, 2022, 24, 100943 CrossRef CAS.
- R. Wang, P. Yang, S. Wang and X. Wang, J. Catal., 2021, 402, 166–176 CrossRef CAS.
- B. Su, H. Huang, Z. Dinga, M. B. J. Roeffaers, S. Wang and J. Long, J. Mater. Sci. Technol., 2022, 124, 164–170 CrossRef.
- Z. Bi, R. Guo, X. Ji, X. Hu, J. Wang, X. Chen and W. Pan, Int. J. Hydrogen Energy, 2022, 47(81), 34430–34443 CrossRef CAS.
- Q. Liu, J. Cao, Y. Ji, Y. Liu, C. Liu, G. Che, D. Wang, J. Cao, W. Li and X. Liu, Appl. Surf. Sci., 2021, 570, 151085 CrossRef CAS.
- Z. Xiong, Y. Hou, R. Yuan, Z. Ding, W. J. Ong and S. Wang, Acta Phys.-Chim. Sin., 2022, 38, 2111021 Search PubMed.
|
| This journal is © The Royal Society of Chemistry and the Centre National de la Recherche Scientifique 2023 |
Click here to see how this site uses Cookies. View our privacy policy here.  *b
*b


