Glucose-assisted synthesis of a magnetic monohydroxy aluminium oxide@carbon (γ-AlOOH/Fe3O4@C) nanocomposite as an innovative sorbent for extraction and pre-concentration of deferasirox present in plasma and urine samples†
Payam
Arabkhani
a,
Negar
Sadegh
b,
Mahmoud
Shahamat
a and
Arash
Asfaram
 *a
*a
aMedicinal Plants Research Center, Yasuj University of Medical Sciences, Yasuj, Iran. E-mail: arash.asfaram@yums.ac.ir
bDepartment of Chemistry, Faculty of Sciences, Shahrekord University, P. O. Box 115, Shahrekord, Iran
First published on 16th November 2022
Abstract
In this paper we describe the synthesis, characterization, and use of a glucose-assisted magnetic aluminum oxyhydroxide@carbon (γ-AlOOH/Fe3O4@C) nanocomposite as a novel sorbent for the extraction and pre-concentration of deferasirox (DFX) present in plasma and urine samples using the ultrasonic-assisted dispersive solid-phase microextraction (UA-DSPME) method prior to HPLC-UV measurement. The sorption process was systemically optimized by experimental design and statistical analysis to maximize the extraction efficiency of DFX. The proposed method could be successfully employed for DFX determination in double-distilled water, plasma, and urine samples (real and spiked samples), with recovery range of 96.1–105%. Also, a good linear range from 10 to 3500 ng mL−1 was found with a correlation value of 0.9938, and relative recoveries between 2.09 and 5.22% were achieved adequately. Furthermore, the limit of quantification (LOQ) and the limit of detection (LOD) were found to be 5.421 and 0.163 ng mL−1 (based on a signal-to-noise ratio of 3) which were acceptable values compared to those of other reports.
1. Introduction
In thalassemia patients above the age of two, the medication deferasirox (DFX) is used to chelate the extra iron burden induced by recurrent blood transfusions. Exjade is the brand name for this medication.1 This medication falls under the group of chelating medicines, and when iron persistently accumulates in the body as a result of blood transfusions or disorders such as thalassemia, it causes an increase in iron excretion through stool by chelating iron.2 The DFX is divided into three branches, and two of its molecules create a full combination with one molecule of iron. DFX is an intracellular oral chelator with a considerable affinity for iron. Skin problems (rash, pigmentation defects, vasculitis, and leukocytocalcitis), cataract, hearing loss, supra-abdominal pain, nausea, diarrhea, gastrointestinal bleeding, Fanconi syndrome, acute renal failure, liver failure, increased creatinine, protein in urine, sore throat, and fever have all been reported as side effects of DFX.3,4 As a result, meticulous monitoring of the medication concentration in plasma or other bodily fluids is required to optimize the dose regimen and reduce the risk of adverse effects. HPLC-UV,5 MS (mass spectrometry),6 and CE (capillary electrophoresis)7 methods were developed to detect DFX in serum or plasma. Although the majority of the methods discussed are effective approaches, a lot of effort is being made in this field for enhancing the detection limit, boosting accuracy, and lowering the cost of analytical procedures. As a result, to obtain a low detection limit, minimize disruptions, and offer a robust and repeatable approach that is not sensitive to the sample tissue, a preparation and pre-concentration phase is required.8,9 These analytical procedures should use less solvent and produce cleaner samples so that the concentration of the analyte can be appropriately determined using analytical instruments in the final step.10Solid-phase extraction is one of the most extensively used procedures for organic and mineral sample extraction and preconcentration.11–13 The solid-phase extraction (SPE) process has many great benefits, but it still uses a lot of hazardous and costly inorganic or organic solvents in relatively high concentrations.14,15 As a result, researchers have recently thought about using solid-phase microextraction (SPME). The ease and speed of efficient extraction, the high concentration factor, the achievement of a low detection limit, the reduction of the extracting solvent's volume from milliliters to microliters, and the method's compatibility with analytical equipment are all advantages of these techniques.16,17 Dispersive solid-phase microextraction (DSPME) is one of the solid-phase microextraction techniques. This approach involves dispersing a little quantity of a suitable solid phase into a few milliliters of sample solution, which quickly absorbs the sample.18,19 The adsorbed sample is then deadsorbed using a few microliters of a suitable solvent, and the result is quantified.20,21 Adsorbents play a crucial role in DSPME, and nanomaterials are frequently utilized as adsorbents. In many activities, such as magnetic recycling and adsorbent reusability, magnetic nanoadsorbents have an unrivaled advantage over ordinary adsorbents.22 However, due to their large specific surface area and magnetic characteristics, magnetic nanoparticles readily self-agglomerate.23,24 To overcome this drawback, making their composite with other materials is one of the efficient ways to increase their scattering.25 Monohydroxy aluminium oxide, often known as boehmite (γ-AlOOH), is employed in industrial ceramics as a preservative and absorbent due to its low cost, excellent chemical resistance, large level area, comparatively strong conductivity, and predictable synthesis method. As a result of its thermal stability, affordability, and surface-printability, γ-AlOOH is the perfect support for the catalytic sector.26–28
To address the present adsorbents’ low adsorption effectiveness, poisonous nature, and complicated glucose-assisted synthesis of production methods, the creation of composites consisting of common components such as alumina and carbon would be highly important. In this work, a hydrothermal process was used for the glucose-assisted synthesis of a magnetic monohydroxy aluminium oxide @carbon (γ-AlOOH/Fe3O4@C) nanocomposite, which was used as the magnetic sorbent in the ultrasonic-assisted dispersive solid-phase microextraction (UA-DSPME) method for the extraction and pre-concentration of highly minute quantities of DFX present in plasma and urine biological samples.
2. Experimental
2.1. Chemicals and reagents
All chemicals and reagents were purchased from Sigma Aldrich Co. (St. Louis, Missouri, USA) and used without further purification. Ortho-phosphoric acid (H3PO4, 85%), acetonitrile (anhydrous, CH3CN, 99.8%), methanol (anhydrous, CH3OH, 99.8%), formic acid (HCOOH, ≥95%), ethylenediaminetetraacetic acid (EDTA), aluminum nitrate nonahydrate (Al(NO3)3·9H2O, ≥98.0%), sodium hydroxide (NaOH, ≥97.0%, pellets), ammonium iron(II) sulfate hexahydrate ((NH4)2Fe(SO4)2·6H2O, 99%), hexamethylenetetramine ((CH2)6N4, ≥99.0%), anhydrous sodium sulfate (Na2SO4, ≥99.0%), and anhydrous glucose (C6H12O6, 99%) were used.2.2. Instrumentation and analytical conditions
X-Ray diffraction analysis (XRD; Philips X'Pert MPD, Netherlands, Cu Kα radiation) was performed at 2θ = 10–60° using Cu Kα radiation (λ = 1.5406 Å). Fourier transform infrared spectroscopy (FTIR; Thermo Nicolet, Avatar 360, USA) was performed in the wavenumber range of 400–4000 cm−1 using pressed KBr pellets. The field emission scanning electron microscopy (FESEM; Zeiss, SIGMA VP-500, Germany) coupled with energy-dispersive X-ray spectroscopy (EDX; Oxford Instrument, Oxford, UK) was used. The textural characteristics of the sample were studied using nitrogen adsorption/desorption isotherms along with the Barrett–Joyner–Halenda (BJH) and Brunauer–Emmett–Teller (BET) methods (BEL, Belsorp-mini II. Japan) at 77 K. The magnetic properties of the sample were investigated using a vibrating sample magnetizer (VSM; Lake Shore, 735 VSM, model 7304, USA) at 300 K in a field of 5000 Oe to −5000 Oe. Chromatographic analysis was performed on an HPLC system (Knauer, Germany), equipped with a quaternary pump and degasser. A reverse-phase Knauer C18 chromatography column (4.6 mm × 250 mm, 5 μm, Eurospher 100-5 C18) including a 20 μL sample loop and a UV-Vis detector which was set at 248 nm wavelength was used for detection of the DFX. The mobile phase was composed of a mixture of solutions (0.1% orthophosphoric acid)–acetonitrile (50![[thin space (1/6-em)]](https://www.rsc.org/images/entities/char_2009.gif) :
:![[thin space (1/6-em)]](https://www.rsc.org/images/entities/char_2009.gif) 50, v/v%). The flow rate of the mobile phase was always kept constant at 1.0 mL min−1. All experiments were carried out at room temperature.
50, v/v%). The flow rate of the mobile phase was always kept constant at 1.0 mL min−1. All experiments were carried out at room temperature.
2.3. Preparation of standard solution, plasma and urine samples
A DFX stock solution of 1 mg mL−1 concentration was made in methanol. The DFX standard working solutions were prepared with concentrations ranging from 0.1 to 800 μg mL−1 by the appropriate dilution of stock solutions with a mixture of methanol and ultrapure water (50![[thin space (1/6-em)]](https://www.rsc.org/images/entities/char_2009.gif) :
:![[thin space (1/6-em)]](https://www.rsc.org/images/entities/char_2009.gif) 50, v/v). Before usage, all solutions were warmed to room temperature from their storage location temperature of −20 °C.
50, v/v). Before usage, all solutions were warmed to room temperature from their storage location temperature of −20 °C.
Human plasma and urine samples were obtained from Shahid Beheshti Hospital (Kohgiluyeh and Boyer-Ahmad Province, Yasuj, Iran) during a period of 4 h and frozen at 4 °C. To extract deferasirox from human plasma, a suitable protein precipitation technique was developed. 200 μL of human plasma was immediately transferred to a 2 mL Eppendorf tube and vortexed for 5 seconds. To precipitate the protein, 800 μL of acetonitrile was added. After 3 min of vortexing, the mixture was centrifuged at 14![[thin space (1/6-em)]](https://www.rsc.org/images/entities/char_2009.gif) 500 rpm for 5 min. A 40 μL aliquot of the μsupernatant was vortexed for 10 seconds after being diluted with 120 μL of 0.1% formic acid containing 0.04 mM EDTA buffer. The prepared liquid was preserved for examination.29
500 rpm for 5 min. A 40 μL aliquot of the μsupernatant was vortexed for 10 seconds after being diluted with 120 μL of 0.1% formic acid containing 0.04 mM EDTA buffer. The prepared liquid was preserved for examination.29
The blank samples were kept in a refrigerator at 5 degrees Celsius. Stock solutions were made in methanol (10 mL) at a concentration of 10 mg L−1 DFX. Working solutions were prepared by adequately diluting stock standard solutions and were used as calibration standards and quality control samples.
2.4. Synthesis methods
2.5. Optimization of the sorption independent variables
To quantify the independent variables influencing the extraction recovery (ER%) of DFX with the γ-AlOOH/Fe3O4@C sorbent, the central composite design (CCD) was utilized in the quadratic model. The CCD is comparable to the summarized factorial design, which is extensively employed in experimental design by researchers.31 A factorial design is the aggregation of all conceivable states of independent variables that impact the dependent variable alone in a direct, exponential, or joint manner (interactions). But due to the flaws of factorial design, this design was made simpler and the CCD was obtained.32 Therefore, the fitting response levels, process optimization, and variance analysis were performed on a quadratic model using Design-Expert software, and independent variables were optimized by a completely random method with CCD along with the response surface method (RSM(. Each variable in this model was studied at three different levels (−1, 0, and +1) and two pivot points (−α and +α). Table S1 (ESI†) shows the independent variables [pH (X1), sorbent mass (X2), ultrasound time (X3), and eluent volume (X4)] and their values in order to check the effect of the conditions on ER% of DFX with the γ-AlOOH/Fe3O4@C sorbent.3. Results and discussion
3.1. Characterization of the sorbent
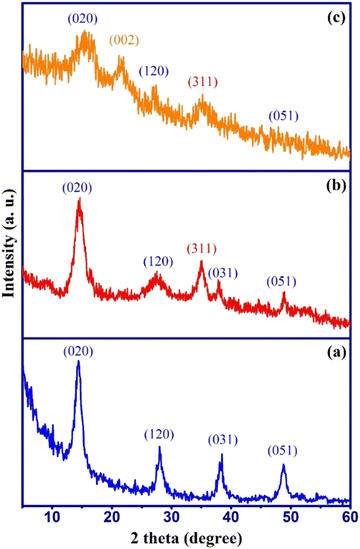
The phase purity and crystallinity of the prepared samples were studied by XRD analysis and the results are shown in Fig. 1 along with their corresponding crystal planes.The XRD pattern of γ-AlOOH (Fig. 1a) shows the main diffraction peaks around 2θ = 14.5°, 28.1°, 38.3°, and 48.7°, which well-matched with the reference peaks of the pure γ-AlOOH sample (JCPDS card no. 21-1307). The XRD pattern of γ-AlOOH/Fe3O4 (Fig. 1b) shows an additional diffraction peak at 2θ = 35.1° related to the cubic spinel phase of Fe3O4 (JCPDS no. 88-0866) along with the γ-AlOOH diffraction peaks without any impurities. This indicated that Fe3O4 nanoparticles were successfully formed in the presence of γ-AlOOH nanoparticles and the synthesis of γ-AlOOH/Fe3O4 nanocomposite was successful. The XRD pattern of γ-AlOOH/Fe3O4@C (Fig. 1c) shows a semi-broad diffraction peak at 2θ = 21.9° along with the main peaks of γ-AlOOH/Fe3O4, which is attributed to the presence of amorphous carbon (002) in the sorbent structure. Also, no additional peaks related to impurities are observed, which indicates the successful synthesis of the AlOOH/Fe3O4@C nanocomposite.
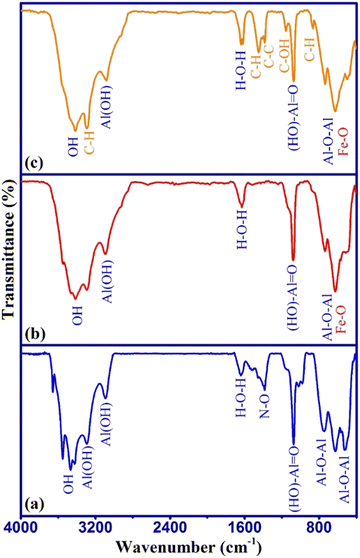
The surface functional groups of the samples were studied from the FTIR spectra as shown in Fig. 2.
The FTIR spectrum of γ-AlOOH (Fig. 2a) shows the main absorption peaks related to Al–O–Al (510–760 cm−1), (HO)–Al![[double bond, length as m-dash]](https://www.rsc.org/images/entities/char_e001.gif) O (1070 cm−1), and Al(OH) (3080–3290 cm−1) stretching vibrations. The N–O absorption peak around 1385 cm−1 may have appeared due to the incomplete washing of the remaining aluminum nitrate in the synthesis process.30 In the FTIR spectrum of γ-AlOOH/Fe3O4 (Fig. 2b), the absorption peaks around 550–680 cm−1 were broader, which is attributed to the overlap of Fe–O absorption peaks with the Al–O–Al peak at the same place. Also, other main absorption peaks related to γ-AlOOH were seen with a slight shift in their wavelengths, which indicated the interaction of surface functional groups of γ-AlOOH with Fe3O4 in the γ-AlOOH/Fe3O4 structure. In the FTIR spectrum of γ-AlOOH/Fe3O4@C (Fig. 2c), the absorption peaks of C–H bending (858 cm−1), C–OH stretching (1145 cm−1), C–C stretching (1376 cm−1), CH2 bending (1450 cm−1), and CH2 stretching (3270 cm−1) can be observed along with the γ-AlOOH/Fe3O4 peaks, which confirms the presence of glucose-related carbon in the sorbent structure. These results were in line with XRD data. The surface morphology, particles size, and elemental composition of γ-AlOOH/Fe3O4@C were studied by FESEM-EDX analysis as shown in Fig. 3.
O (1070 cm−1), and Al(OH) (3080–3290 cm−1) stretching vibrations. The N–O absorption peak around 1385 cm−1 may have appeared due to the incomplete washing of the remaining aluminum nitrate in the synthesis process.30 In the FTIR spectrum of γ-AlOOH/Fe3O4 (Fig. 2b), the absorption peaks around 550–680 cm−1 were broader, which is attributed to the overlap of Fe–O absorption peaks with the Al–O–Al peak at the same place. Also, other main absorption peaks related to γ-AlOOH were seen with a slight shift in their wavelengths, which indicated the interaction of surface functional groups of γ-AlOOH with Fe3O4 in the γ-AlOOH/Fe3O4 structure. In the FTIR spectrum of γ-AlOOH/Fe3O4@C (Fig. 2c), the absorption peaks of C–H bending (858 cm−1), C–OH stretching (1145 cm−1), C–C stretching (1376 cm−1), CH2 bending (1450 cm−1), and CH2 stretching (3270 cm−1) can be observed along with the γ-AlOOH/Fe3O4 peaks, which confirms the presence of glucose-related carbon in the sorbent structure. These results were in line with XRD data. The surface morphology, particles size, and elemental composition of γ-AlOOH/Fe3O4@C were studied by FESEM-EDX analysis as shown in Fig. 3.
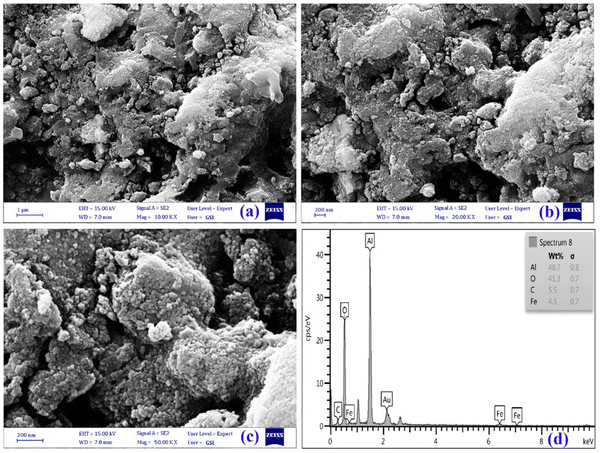 | ||
| Fig. 3 FESEM images of γ-AlOOH/Fe3O4@C under different magnifications (a) 10 KX, (b) 20 KX, and (c) 50 KX. (d) EDX spectrum of γ-AlOOH/Fe3O4@C. | ||
The FESEM images of γ-AlOOH/Fe3O4@C (Fig. 3a–c) are presented under different magnifications and exhibit an uneven agglomerated surface morphology which shows the accumulation of non-uniform nanoparticles with an approximate size of sub 50 nm. The uneven surface of γ-AlOOH/Fe3O4@C may provide beneficial conditions for the sorption of more DFX molecules around the adsorption active sites and improve the sorption rate.33 The elemental composition of γ-AlOOH/Fe3O4@C was investigated by EDX spectrum analysis (Fig. 3d), which confirmed the existence of aluminum (Al), oxygen (O), carbon (C), and iron (Fe) elements in the nanocomposite structure. The texture characteristics of γ-AlOOH/Fe3O4@C were studied using nitrogen adsorption/desorption isotherms along with the BET and BJH methods.
From the shape of the N2 adsorption desorption isotherm (Fig. 4a), it was classified as a type III isotherm with an H3-type hysteresis loop, which indicated that most of the pores in the sorbent were of the type meso (2–50 nm) and macro (greater than 50 nm),34 and also the texture structure of the sample consisted of agglomerate particles with a non-uniform size and shape.35 Also, the pore-size distribution of γ-AlOOH/Fe3O4@C is shown in the BJH plot (Fig. 4a, inset) which indicates that the majority of pores were sub 10 nm. According to the BET method, γ-AlOOH/Fe3O4@C displayed a specific surface area of 156.68 m2 g−1, and a total pore volume of 0.36 cm3 g−1. This porous nature along with an acceptable specific surface area can provide multiple ways to DFX molecules for more access to active sorption sites of the sorbent. The magnetic property of the γ-AlOOH/Fe3O4@C composite was studied by the VSM analysis as presented in Fig. 4b. The saturation magnetization (Ms) was about 15.5 emu g−1, which was a suitable value in order to magnetically separate the sorbent from the reaction medium by applying a magnetic field.
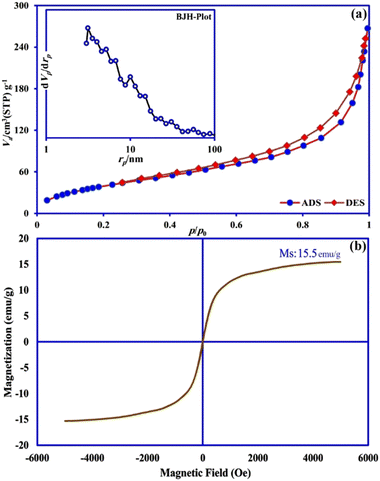 | ||
| Fig. 4 (a) N2 adsorption desorption isotherm and BJH pore size distribution plot (inset), and (b) VSM curve of γ-AlOOH/Fe3O4@C. | ||
3.2. Effect of the elution solvent
A suitable solvent is a key parameter in the extraction process and must be capable of recovering the largest quantity of the target sample. Under the same circumstances, dimethyl sulfoxide (DMSO), dimethylformamide (DMF), methanol (MeOH), ethanol (EtOH), acetone (AC), acetonitrile (ACN), and tetrahydrofuran (THF) solvents were used in this study to choose the best solvent for DFX extraction. According to Fig. S1 (ESI†), methanol was more efficient in extraction of DFX and so was chosen as the DFX recovery solvent.3.3. ANOVA study
Based on the entries given in Table S1 (ESI†) for the independent variables [including pH (X1), sorbent mass (X2), ultrasound time (X3), and eluent volume (X4)] and also the response variable (extraction percentage of DFX), eqn (1) was obtained to predict the ER% of DFX. | (1) |
The analysis of variance related to the central composite design (CCD) model is presented in Table S2 (ESI†). The results of the table show that the predicted model was significant (P < 0.05). In the linear part of the model, the effect of all variables (X1, X2, X3, and X4) on ER% of DFX was significant. In the second degree part of the model, the effects of variables X12 and X42 and also the interaction between variables X1X4, X2X4, and X3X4 were significant. The ability of the predicted model has been tested using the correlation coefficient (R2 = 0.9847), which shows that more than 98.47% of the sample change corresponds to the presented model.36 The coefficient of variation (CV = 4.09%) indicates that the tests are accurate and reliable. Precision Adeq measures the signal-to-noise ratio, the desirable value of which is 34.07.37 The Pareto diagram depicts the influence of each CCD model, as well as their significance level for each variable (Fig. S2a, ESI†). Among the investigated variables, pH had the greatest influence on DFX extraction. Fig. S2b (ESI†) shows the normal distribution probability diagram of the data in the model space. The linear distribution of modeling errors is shown in diagrams. This linear dispersion means the normal distribution of errors in the space of the design matrix of the experiments. Therefore, the possibility of random errors and the effect of the order of conducting experiments (known as the blocking effect of experiments) in modeling the behavior of parameters are greatly reduced.38 The CCD model optimally estimated the percentage of observed DFX measurements (Fig. S2c, ESI†). Based on the predicted value of the R2 coefficient using the CCD model, it can be said that 91.87% changes in DFX measurement can be explained using this model. Also, based on Fig. S2d (ESI†), the distribution of the residual values of the CCD model is normal and based on the sign (positive or negative) of the residual values of the model, it can be concluded that the said model has random statistics.39
3.4. Contour and three-dimensional surface plots
The influence of interaction of independent variables of pH–eluent volume and sorbent mass–ultrasound time on the extraction recovery of DFX (ER% DFX) was studied using the three-dimensional response surface plots and the corresponding contour plots as shown in Fig. 5. As can be observed, addition of an eluent solvent increased the extraction effectiveness of DFX, although the dilution effect causes a reduction in extraction efficiency at increasing quantities. The influence of pH was investigated in the range of 2 to 10 and it was shown that the largest ER% DFX was observed at low pH values, while the ER% DFX declined as pH increased from 2 to 10. The reason for this could be that the active sites on the sorbent surface are protonated under acidic pH conditions, and the charge density on the surface rises. The DFX molecules prefer to interact with positive charges due to their molecular structure (contain polar groups and are negatively charged) and the existence of hydroxide and amine linkages; therefore, the ER% of DFX increased as the pH dropped due to the electrostatic attraction. The increase in ER% DFX with an increase of sorbent mass can be due to an increase in the specific surface area and thus the availability of more empty active sorption sites.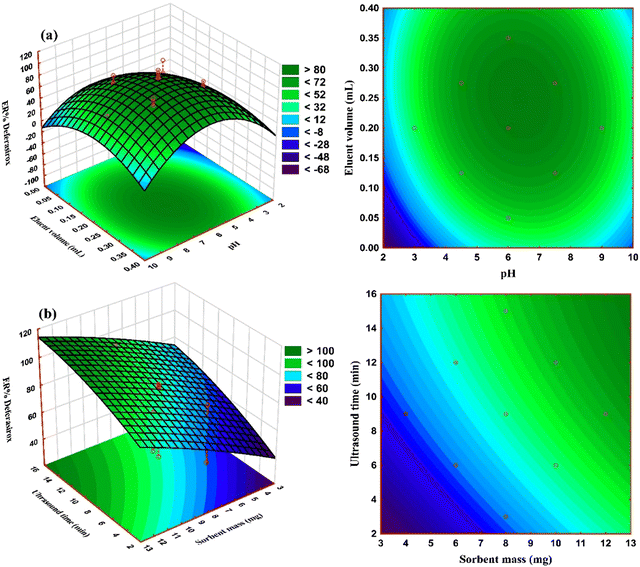 | ||
| Fig. 5 3D response surface and 2D contour plots for determining the simultaneous effects of (a) pH–eluent volume, and (b) sorbent mass–ultrasound time on ER% of DFX. | ||
Furthermore, the results demonstrated that using ultrasonic power boosts extraction efficiency. This is related to acoustic cavitation, a physical phenomenon that includes the formation, development, and collapse of micrometric bubbles induced by pressure wave transmission in a liquid. Ultrasound waves promote mass transfer through convection and the reactivation of the sorbent surface. Microturbulence can be caused by shock waves in the surface layers that surround the nearby solid particles. By reducing the affinity between the sorbent and adsorbate, ultrasonic sample irradiation increases mass transfer processes.40
3.5. Response optimization
The optimal values for independent variables that were derived from the experimental design and CCD analysis are shown in Fig. S3 (ESI†). According to the results, the pH 6, a sorbent mass of 12 mg, an ultrasound time of 12 min, and an eluent volume of 0.2 mL were determined as the optimal conditions. Also, top right corner of Fig. S3 (ESI†) shows that ER% DFX of 99.56%, 66.04%, and 32.52% was obtained with desirability scores of 1.0, 0.5, and 0.0, respectively.3.6. Analytical validation and performance characteristics
The validity of the new method was tested under ideal circumstances. The calibration curve varied from 10–3500 ng mL−1, with a coefficient of determination (R2) >0.99, as shown in Table S3 (ESI†). The LOD was found to be between 0.163 ng mL−1 (based on a signal-to-noise ratio of 3). Also, from the perspectives of repeatability and reproducibility, the relative standard deviations (RSD, %) ranged from 2.09% to 5.22%. These fair figures of merit attest to the developed UA-DSPME/HPLC-UV method's suitable validity, high efficacy, and good precision in the effective extraction and pre-concentration of DFX.3.7. Equilibrium sorption isotherm studies
Surface sorption isotherms are important in describing how the solute interacts with the sorbent and providing a suitable sorption model plays a fundamental role in optimizing the sorption process. In this research, the experimental equilibrium isotherm along with the Langmuir and Freundlich model fits was evaluated as shown in Fig. S4 (ESI†) and the related results are summarized in Table S4 (ESI†). For monolayer sorption on a surface with a specific number of locations, the Langmuir isotherm is represented. For sorption on a heterogeneous surface, the Freundlich isotherm is used. With more sorption, the surface's heat dissipates more slowly. According to the correlation coefficient obtained from the Langmuir (R2 = 0.996) and Freundlich (R2 = 0.975) models, DFX in this method follows the monolayer Langmuir isotherm model. Also, the theoretical maximum adsorption capacity (Qm) is estimated using the Langmuir model to be 40.28 mg g−1.3.8. Sorption identification
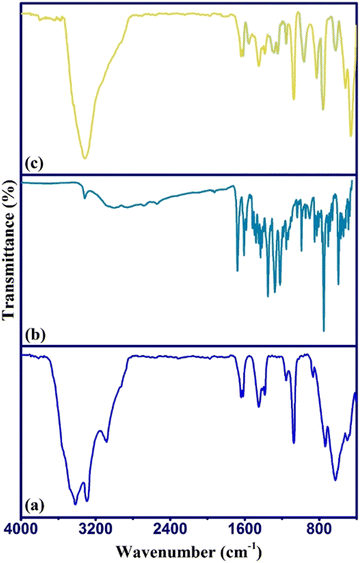
The sorption of DFX by γ-AlOOH/Fe3O4@C was identified and approved by FTIR analysis of the sorbent before and after the sorption process as presented in Fig. 6. As can be seen, after the sorption process, the main absorption peaks of DFX appeared in the γ-AlOOH/Fe3O4@C spectrum, which indicated that DFX sorption had occurred. Also, a slight shift of the sorbent peaks and an appearance of strong characteristic DFX peaks indicated the occurrence of sorption process through chemisorption.413.9. Application to real samples
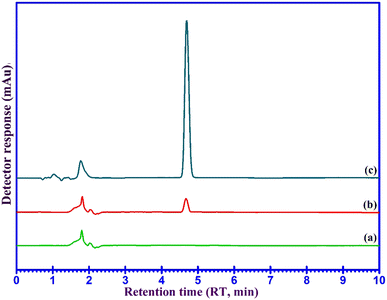
The developed UA-DSPME method was used for the concentration, isolation, and measurement of DFX in ultrapure water, plasma, and urine samples and the results are given in Table 1. The results show that DFX was extracted in the range of 96.1 to 105% from different samples. No interference peaks were visible within the retention time frame for any of the samples in the representative chromatograms of the blank and spiked water samples as shown in Fig. 7, indicating that the established procedure was accurate and dependable. The findings, therefore, show that the devised approach can accurately and precisely isolate and detect the DFX present in water, human urine, and human plasma samples.| Real samples | Added | Found | RR%a | RSD (%) |
|---|---|---|---|---|
| ng mL−1 | ||||
| a Relative recovery. b Not detected. | ||||
| Ultrapure water | 0.00 | NDb | — | — |
| 100 | 99.92 | 99.92 | 2.43 | |
| 300 | 295.19 | 98.40 | 2.76 | |
| 500 | 497.59 | 99.52 | 2.40 | |
| 1000 | 980.76 | 98.08 | 2.78 | |
| Plasma | 0.00 | ND | — | — |
| 100 | 100.28 | 100.28 | 3.07 | |
| 300 | 307.39 | 102.46 | 5.22 | |
| 500 | 480.32 | 96.06 | 3.43 | |
| 1000 | 1032.3 | 103.2 | 4.74 | |
| Urine | 0.00 | ND | — | — |
| 100 | 97.50 | 97.50 | 4.32 | |
| 300 | 295.7 | 98.56 | 3.35 | |
| 500 | 523.4 | 104.7 | 2.84 | |
| 1000 | 973.8 | 97.38 | 2.09 | |
3.10. Comparison of the proposed method to other relevant methods
Table 2 compares the efficacy of the provided strategy to that of the other alternatives. As can be observed, the developed UA-DSPME method using γ-AlOOH/Fe3O4@C sorbent produced acceptable LOD values when compared to other research papers. As previously stated, the proposed developed method is simple, affordable, and effective. It should be noted that the extraction duration is only 12 min, making this process extremely rapid.| Instrument | Sample preparation | Matrix | LOD | LOQ | Linear range | Precision (RSD%) | Extraction time (min) | Extractant volume (μL) | Ref. |
|---|---|---|---|---|---|---|---|---|---|
| (ng mL−1) | |||||||||
| HPLC-UV: High performance liquid chromatography coupled with ultraviolet detection. HILIC–ESI–MS: Hydrophilic interaction liquid chromatography/positive ion electrospray mass spectrometry. LLE: Liquid–liquid extraction. SI–sweeping–FASS–MEKC: Short-end injection and sweeping with a field-amplified sample stacking and micellar electrokinetic chromatography. LC–MS/MS: Liquid chromatography with tandem mass spectrometry. DLLME–SFO: Dispersive liquid–liquid microextraction based on solidification of floating organic drops. | |||||||||
| HPLC-UV | — | plasma | 78.1 | 150 | 78.1–40![[thin space (1/6-em)]](https://www.rsc.org/images/entities/char_2009.gif) 000 000 |
4.64 | 16 | 750 | 5 |
| HILIC–ESI–MS | LLE | Human plasma | 61 | 200 | 200–12![[thin space (1/6-em)]](https://www.rsc.org/images/entities/char_2009.gif) 0000 0000 |
1.8 | <15 | 2000 | 42 |
| HPLC-UV | Human Breast Milk | 2.6 | 8.6 | 10–1000 | <2 | 7 | 300 | 8 | |
| HPLC-UV | — | Plasma | 70 | 160 | 28.84–5774.93 | — | 7.38 | — | 43 |
| Fluorimetric Method | — | Urine | 2500 | 6400 | 20![[thin space (1/6-em)]](https://www.rsc.org/images/entities/char_2009.gif) 000–1 000–1![[thin space (1/6-em)]](https://www.rsc.org/images/entities/char_2009.gif) 20 20![[thin space (1/6-em)]](https://www.rsc.org/images/entities/char_2009.gif) 000 000 |
1.1 | 70 | — | 10 |
| Fluorescence Method | — | Milk | 21 | 69 | 50–600 | <15 | — | — | 44 |
| SI–sweeping–FASS–MEKC | LLE | Human plasma | 300 | 1000–20![[thin space (1/6-em)]](https://www.rsc.org/images/entities/char_2009.gif) 000 000 |
4.13–6.22 | 110 | 1000 | 2 | |
| LC–MS/MS | — | Human plasma | 10 | 40 | 40–40![[thin space (1/6-em)]](https://www.rsc.org/images/entities/char_2009.gif) 000 000 |
3.70–11.8 | <10 | 800 | 45 |
| HPLC-UV | DLLME –SFO | Blood of patients | 0.060 | 0.200 | 0.2–200 | 3.80 –5.70 | 20 | 1 | |
| HPLC-UV | UA-DSPME | Plasma, Urine | 0.163 | 5.421 | 10–3500 | 2.09–5.22 | 12 | 200 | This study |
3.11. Stability and reusability of the sorbent
The reusability of the sorbent is a critical parameter for assessing continuity of its effectiveness that proves the economic feasibility of the sorbent. For this purpose, the spent γ-AlOOH/Fe3O4@C was regenerated with methanol and reused in the adsorption–desorption experiments. The ER%DFX was studied in each cycle and the results are shown in Fig. S5 (ESI†). The results demonstrated that the γ-AlOOH/Fe3O4@C was able to extract more than 85% of the DFX until the eighth cycle, which was indicative of sorbent effectiveness in reuse and its good stability.4. Conclusions
In this work, a novel γ-AlOOH/Fe3O4@C nanocomposite was successfully synthesized and used as an effective sorbent in the UA-DSPME method for the extraction and pre-concentration of deferasirox present in plasma and urine samples combined with the HPLC-UV technique. The chemical and structural characteristics of the sorbent were investigated by XRD, FTIR, FESEM, EDX, VSM, and BET-BJH analysis. Additionally, CCD-RSM was used to optimize the independent variables in the UA-DSPME method to maximize the DFX extraction efficiency. Furthermore, the limit of detection (LOD) was found to be 0.163 ng mL−1 (based on a signal-to-noise ratio of 3) producing an acceptable LOD value compared to those of other reports. The proposed method in this work provides a unique approach for DFX molecular detection while also meeting the criteria of high sensitivity and accuracy.Conflicts of interest
The authors declare that they have no known competing financial interests or personal relationships that could have appeared to influence the work reported in this paper.Acknowledgements
The authors acknowledge the financial support from the Yasuj University of Medical Sciences, Yasuj, Iran.References
- M. R. Golpayegani, R. Akramipour and N. Fattahi, J. Pharm. Biomed. Anal., 2021, 193, 113735 CrossRef CAS
.
- H.-J. Lin, K.-P. Hsieh, S.-S. Chiou, H.-S. Kou and S.-M. Wu, J. Pharm. Biomed. Anal., 2016, 131, 497–502 CrossRef CAS PubMed
.
- W. T. Lindsey and B. R. Olin, Clin. Pharmacol., 2007, 29, 2154–2166 CAS
.
- R. N. Sharma and S. Pancholi, J. Curr. Pharm. Res., 2010, 1, 1–7 Search PubMed
.
- S. De Francia, D. Massano, F. M. Piccione, E. Pirro, S. Racca, F. Di Carlo and A. Piga, J. Chromatogr. B: Anal. Technol. Biomed. Life Sci., 2012, 893, 127–133 CrossRef PubMed
.
- M. Iqbal, E. Ezzeldin, M. K. Anwer and F. Imam, Separations, 2021, 8, 146 CrossRef CAS
.
- C.-C. Wang, P.-T. Huang, H.-S. Kou and S.-M. Wu, Sens. Actuators, B, 2020, 311, 127916 CrossRef CAS
.
- C. Onal, S. E. K. Tekkeli and A. A. Sagiroglu, Chromatographia, 2020, 83, 1329–1333 CrossRef CAS
.
- H. Tabani, S. Nojavan, M. Alexovič and J. Sabo, J. Pharm. Biomed. Anal., 2018, 160, 244–267 CrossRef CAS
.
- J. L. Manzoori, A. Jouyban, M. Amjadi, V. Panahi-Azar, A. R. Karami-Bonari and E. Tamizi, Food Chem., 2011, 126, 1845–1849 CrossRef CAS
.
- G. P. Mashile and P. N. Nomngongo, Crit. Rev. Anal. Chem., 2017, 47, 119–126 CrossRef CAS
.
- E. Ghasemi and M. Sillanpää, Talanta, 2014, 130, 322–327 CrossRef CAS PubMed
.
- H. Akhlaghi, M. Ghorbani, N. A. Lahoori, A. Shams and O. Seyedin, J. Anal. Chem., 2016, 71, 641–647 CrossRef CAS
.
- L. M. Madikizela, N. T. Tavengwa and L. Chimuka, J. Pharm. Biomed. Anal., 2018, 147, 624–633 CrossRef CAS
.
- M. A. Farajzadeh, M. Nemati, N. Altunay, M. Tuzen, S. Kaya, F. Kheradmand and M. R. Afshar Mogaddam, Microchem. J., 2022, 177, 107291 CrossRef CAS
.
-
J. Pawliszyn, Solid phase microextraction: theory and practice, John Wiley & Sons, 1997 Search PubMed
.
- H. Lord and J. Pawliszyn, J. Chromatogr. A, 2000, 885, 153–193 CrossRef CAS PubMed
.
- E. Marzi Khosrowshahi, M. R. Afshar Mogaddam, Y. Javadzadeh, N. Altunay, M. Tuzen, S. Kaya, M. Ghalkhani, M. A. Farajzadeh and M. Nemati, Microchem. J., 2022, 178, 107331 CrossRef CAS
.
- M. Nemati, M. Tuzen, M. A. Farazajdeh, S. Kaya and M. R. Afshar Mogaddam, Anal. Chim. Acta, 2022, 1199, 339570 CrossRef CAS
.
- R. Khani, S. Sobhani and T. Yari, Microchem. J., 2019, 146, 471–478 CrossRef CAS
.
- M. Dastkhoon, M. Ghaedi, A. Asfaram, R. Jannesar and F. Sadeghfar, J. Colloid Interface Sci., 2018, 513, 240–250 CrossRef CAS PubMed
.
- A. Asfaram, M. Arabi, A. Ostovan, H. Sadeghi and M. Ghaedi, New J. Chem., 2018, 42, 16144–16153 RSC
.
- P. D. Stevens, G. Li, J. Fan, M. Yen and Y. Gao, Chem. Commun., 2005, 4435–4437 RSC
.
- J. Park, J. Joo, S. G. Kwon, Y. Jang and T. Hyeon, Angew. Chem., Int. Ed., 2007, 46, 4630–4660 CrossRef CAS
.
- H. Yang, S. Ji, X. Liu, D. Zhang and D. Shi, Sci. China: Chem., 2014, 57, 866–872 CrossRef CAS
.
- S. Tao, G. Xingzhong and Y. Hui, Rare Met. Mater. Eng., 2008, 37, 73–75 Search PubMed
.
- L. Zhang, W. Lu, L. Yan, Y. Feng, X. Bao, J. Ni, X. Shang and Y. Lv, Microporous Mesoporous Mater., 2009, 119, 208–216 CrossRef CAS
.
- W. Cai, J. Yu and S. Mann, Microporous Mesoporous Mater., 2009, 122, 42–47 CrossRef CAS
.
- E. Alipanahpour Dil, M. Ghaedi, A. Asfaram, L. Tayebi and F. Mehrabi, J. Chromatogr. A, 2020, 1613, 460695 CrossRef CAS PubMed
.
- P. Arabkhani, H. Javadian, A. Asfaram and M. Ateia, Chemosphere, 2021, 271, 129610 CrossRef CAS
.
- Z. Moradi, E. Alipanahpour Dil and A. Asfaram, Analyst, 2019, 144, 4351–4361 RSC
.
-
S. R. Schmidt and R. G. Launsby, Understanding industrial designed experiments, Air Academy Press, 1989 Search PubMed
.
- N. Habibi, Spectrochim. Acta, Part A, 2014, 131, 55–58 CrossRef CAS
.
- C. Li, L. Kong, M. Ostadhassan and T. Gentzis, Energy Fuels, 2019, 33, 6008–6019 CrossRef CAS
.
- E. N. Alvar, M. Rezaei and H. N. Alvar, Powder Technol., 2010, 198, 275–278 CrossRef CAS
.
- F. Mehrabi, A. Vafaei, M. Ghaedi, A. M. Ghaedi, E. Alipanahpour Dil and A. Asfaram, Ultrason. Sonochem., 2017, 38, 672–680 CrossRef CAS PubMed
.
- M. F. Lanjwani, N. Altunay and M. Tuzen, Food Chem., 2023, 400, 134085 CrossRef CAS
.
- A. Asfaram, E. A. Dil, P. Arabkhani, F. Sadeghfar and M. Ghaedi, Talanta, 2020, 218 Search PubMed
.
- A. Asfaram, H. Sadeghi, A. Goudarzi, E. Panahi Kokhdan and Z. Salehpour, Analyst, 2019, 144, 1923–1934 RSC
.
- P. P. Mashile and P. N. Nomngongo, Gels, 2021, 7, 190 CrossRef CAS
.
- P. Arabkhani and A. Asfaram, J. Hazard. Mater., 2022, 429, 128289 CrossRef CAS PubMed
.
- H. Pligoropoulou, A. Vonaparti and I. Panderi, J. Chromatogr. B: Anal. Technol. Biomed. Life Sci., 2012, 893, 114–120 CrossRef
.
- M.-Y. Lu, N. Wang, W.-H. Wu, C.-W. Lai, P.-H. Kuo, P.-H. Chiang, K.-H. Lin and T.-H. Wu, Clin. Ther., 2015, 37, 1751–1760 CrossRef CAS
.
- S. Ershadi, A. Jouyban and A. Shayanfar, Food Anal. Methods, 2017, 10, 3607–3614 CrossRef
.
- T. Li, Z. Cui, Y. Wang, W. Yang, D. Li, Q. Song, L. Sun and L. Ding, J. Pharm. Biomed. Anal., 2018, 151, 145–150 CrossRef CAS
.
Footnote |
| † Electronic supplementary information (ESI) available. See DOI: https://doi.org/10.1039/d2nj04107c |
| This journal is © The Royal Society of Chemistry and the Centre National de la Recherche Scientifique 2023 |

