
Isolation, structural elucidation, and bioactivity of cholestane derivatives from Ypsilandra thibetica†
Jing
Xie
ab,
Shi-Juan
Zhang
ab,
Grace Gar-Lee
Yue
cd,
Ling-Ling
Yu
ab,
Hui
Liu
a,
Wen-Yi
Ma
ab,
Huan
Yan
a,
Wei
Ni
a,
Clara Bik-San
Lau
*cd and
Hai-Yang
Liu
 *ae
*ae
aState Key Laboratory of Phytochemistry and Plant Resources in West China, and Yunnan Key Laboratory of Natural Medicinal Chemistry, Kunming Institute of Botany, Chinese Academy of Sciences, Kunming 650201, China. E-mail: haiyangliu@mail.kib.ac.cn
bUniversity of Chinese Academy of Sciences, Beijing, 100049, China
cInstitute of Chinese Medicine, The Chinese University of Hong Kong, Shatin, New Territories, Hong Kong SAR, China. E-mail: claralau@cuhk.edu.hk
dState Key Laboratory of Research on Bioactivities and Clinical Applications of Medicinal Plants, The Chinese University of Hong Kong, Shatin, New Territories, Hong Kong SAR, China
eYunnan Characteristic Plant Extraction Laboratory, Kunming 650106, China
First published on 16th November 2022
Abstract
Phytochemical investigation on the whole plant of Ypsilandra thibetica led to the isolation of five new cholestane derivatives. The structures of 1–5 were elucidated by comprehensive spectroscopic analyses of their data and chemical methods. The absolute configurations of compounds 1–3 were ambiguously assigned by single crystal X-ray diffraction analysis. Compound 1 is the first cholestane glycoside with two oxygen bridges between C-16/C-23 and C-18/C-23. Compound 2 is the first 23-spirocholestane derivative with a six-membered ring between C-24/C-23 of the aglycone moiety and C-1′/C-2′ of the D-arabinose ligand, while compounds 3–5 are new 23-spirocholestane derivatives with a D-fucose ligand. The cytotoxic, anti-inflammatory, and anti-angiogenic activities of these isolated compounds were evaluated. Compound 5 showed anti-angiogenic activity in zebrafish embryos.
Introduction
Steroidal saponins are rich in approximately 90 plant families, particularly in monocotyledons, such as Liliaceae, Melanthiaceae, Convallariaceae, Dioscoreaceae, Agavaceae, Smilacaceae, and Amaryllidaceae.1 Various pharmacological activities of these saponins have been investigated, including their antitumor,2–5 anti-inflammatory,6 antifungal,7,8 and platelet aggregation inducing activities.9Ypsilandra thibetica Franch (Melanthiaceae), a perennial herb used as a famous Yi nationality medicine,10,11 has been used to treat lymphatic tuberculosis, hemostasis, and disorders of hemostasis and thrombus.12,13 Our previous investigations on this species uncovered a series of structurally diverse steroidal saponins including spirostanol-, furostanol-, and cholestanol-glycosides, more importantly, some of which were revealed to show antibacterial, anticancer, and anti-HIV activities.6,14–21 In order to obtain more structurally interesting steroidal glycosides, we further investigated the phytochemicals of this species. As a result, five rare cholestane derivatives were isolated and structurally characterized. Herein, we report the isolation, structural elucidation, and bioactivities of these isolated compounds. In the present study, we aimed to evaluate the newly isolated saponins from Ypsilandra thibetica for their potential cytotoxicities in esophageal cancer cells EC109, anti-inflammatory activities in RAW 264.7 macrophages, as well as anti-angiogenic activities of these compounds in zebrafish embryos.Results and discussion
Compound 1 was isolated as a prismatic crystal. Its molecular formula was determined to be C33H52O9 based on its quasi-molecular ion peak at m/z 615.3514 [M + Na] + (calcd 615.3504) in HR-ESI-MS and 13C NMR data (Table 2). The IR spectrum showed characteristic absorption bands at 3424 cm−1 and 1709 cm−1, indicating the presence of hydroxyl and carbonyl, respectively. From its HSQC and DEPT spectra, the 13C and 1H NMR spectra of 1 exhibited 33 carbon signals, including five methyls at δC 13.2 (C-19), 24.1 (C-21), 22.7 (C-26), 19.2 (C-27), and 17.3 (C-6′), and the corresponding proton signals at δH 0.71 (s, CH3-19), 1.20 (d, J = 7.2 Hz, CH3-21), 1.24 (d, J = 6.8 Hz, CH3-26), 1.19 (d, J = 6.8 Hz, CH3-27), and 1.51 (br d, J = 6.4 Hz, CH3-6′); nine methylenes including one oxygenated signal at δC 66.0 (C-18) and proton signals at δH 3.92 (br d, J = 13.2 Hz, CH2-18a) and 3.32 (br d, J = 13.2 Hz, CH2-18b); fifteen methines with one acetal signal at δC 106.6 (C-1′) and seven oxymethine signals at δC 70.0 (C-3), δC 74.3 (C-16), δC 89.6 (C-24), δC 73.1 (C-2′), δC 75.6 (C-3′), δC 72.7 (C-4′), and δC 71.5 (C-5′), corresponding to the proton signals at δH 3.82 (m, H-3), δH 4.65 (dd, J = 7.7, 2.9 Hz, H-16), δH 3.66 (d, J = 3.7 Hz,H-24), δH 4.86 (d, J = 7.7 Hz, H-1 H-δH 4.31, (t, J = 8.6 Hz, H-2′), δH 4.04 (dd, J = 9.4, 3.4 Hz, H-3′), δH 3.96 (br d, J = 2.6 Hz, H-4′), and δH 3.72 (br q, J = 6.1 Hz, H-5′); one carbonyl signal at δC 209.8 (C-6); three quaternary carbons, among which is a ketal signal at δC 104.4 (C-23). These spectroscopic data suggested that 1 should be a cholestanol glycoside.15 The carbonyl group accounted for one degree of unsaturation, and the remaining seven degrees of unsaturation implied compound 1 could be heptacyclic (rings A–G). Furthermore, 1H–1H COSY correlations of H2-1/H2-2/H-3/H2-4/H-5, H2-7/H-8/H-9/H2-11/H2-12 and H-8/H-14/H2-15/H-16/H-17/H-20/H2-22, as well as H-20/CH3-21, H-24/H-25/CH3-26, H-25/CH3-27, and H-1′/H-2′/H-3′/H-4′/H-5′/CH3-6′ revealed four spin system (a–d) as shown in Fig. 2. Moreover, the connectivity of the substructures a–c to C-6 (δC 209.8)/C-10 (δC 40.8)/C-13 (δC 47.5)/C-23 (δC 104.4) and two tertiary methyls with six rings were verified based on the HMBC correlations (Fig. 2): from H2-18 (δH 3.92 and 3.32) to C-12 (δC 34.5)/C-13 (δC 47.5)/C-14 (δC 53.4)/C-17 (δC 52.9)/C-23 (δC 104.4); from CH3-19 (δH 0.71) to C-1 (δC 36.9)/C-5 (δC 57.0)/C-9 (δC 54.4)/C-10 (δC 40.8); from H2-4 (δH 2.31 and 1.88)/H-5 (δH 2.26)/H2-7 (δH 2.43 and 2.07)/H-8 (δH 2.11) to C-6 (δC 209.8); from H-16 (δH 4.65)/H-20 (δH 2.05)/H-24 (δH 3.66)/H-25 (δH 2.22) to C-23 (δC 104.4). The above evidence revealed that E- and F-rings shared the oxygen bridge of C-16/C-23, and F- ring possessed an additional rare oxygen bridge of C-18/C-23 as shown in Fig. 1. In addition, a set of six signals corresponding to the D-fucopyranosyl moiety22 were observed at δC 106.6 (C-1′), δC 73.1 (C-2′), δC 75.6 (C-3′), δC 72.7 (C-4′), δC 71.5 (C-5′), and 17.3 (C-6′), while the HSQC spectrum showed the corresponding proton signals at δH 4.86 (d, J = 7.7 Hz, H-1′), δH 4.31 (t, J = 8.6 Hz, H-2′), δH 4.04 (dd, J = 9.4, 3.4 Hz, H-3′), δH 3.96 (br d, J = 2.6 Hz, H-4′), δH 3.72, (br q, J = 6.1 Hz, H-5′), and δH 1.51 (br d, J = 6.4 Hz, CH3-6′). The HMBC correlations of H-5′ (δH 3.72)/C-1′ (δC 106.6) and H-1′ (δH 4.86)/C-24 (δC 89.6) were assigned for the connectivity of the substructure d and the glycosylated site. As a result, the G-ring has one oxygen bridge between C-1′/C-5′ and C-1′ is connected to C-24. | ||
| Fig. 1 Chemical structures of 1–5 and X-ray single crystal structures of 1–3. | ||
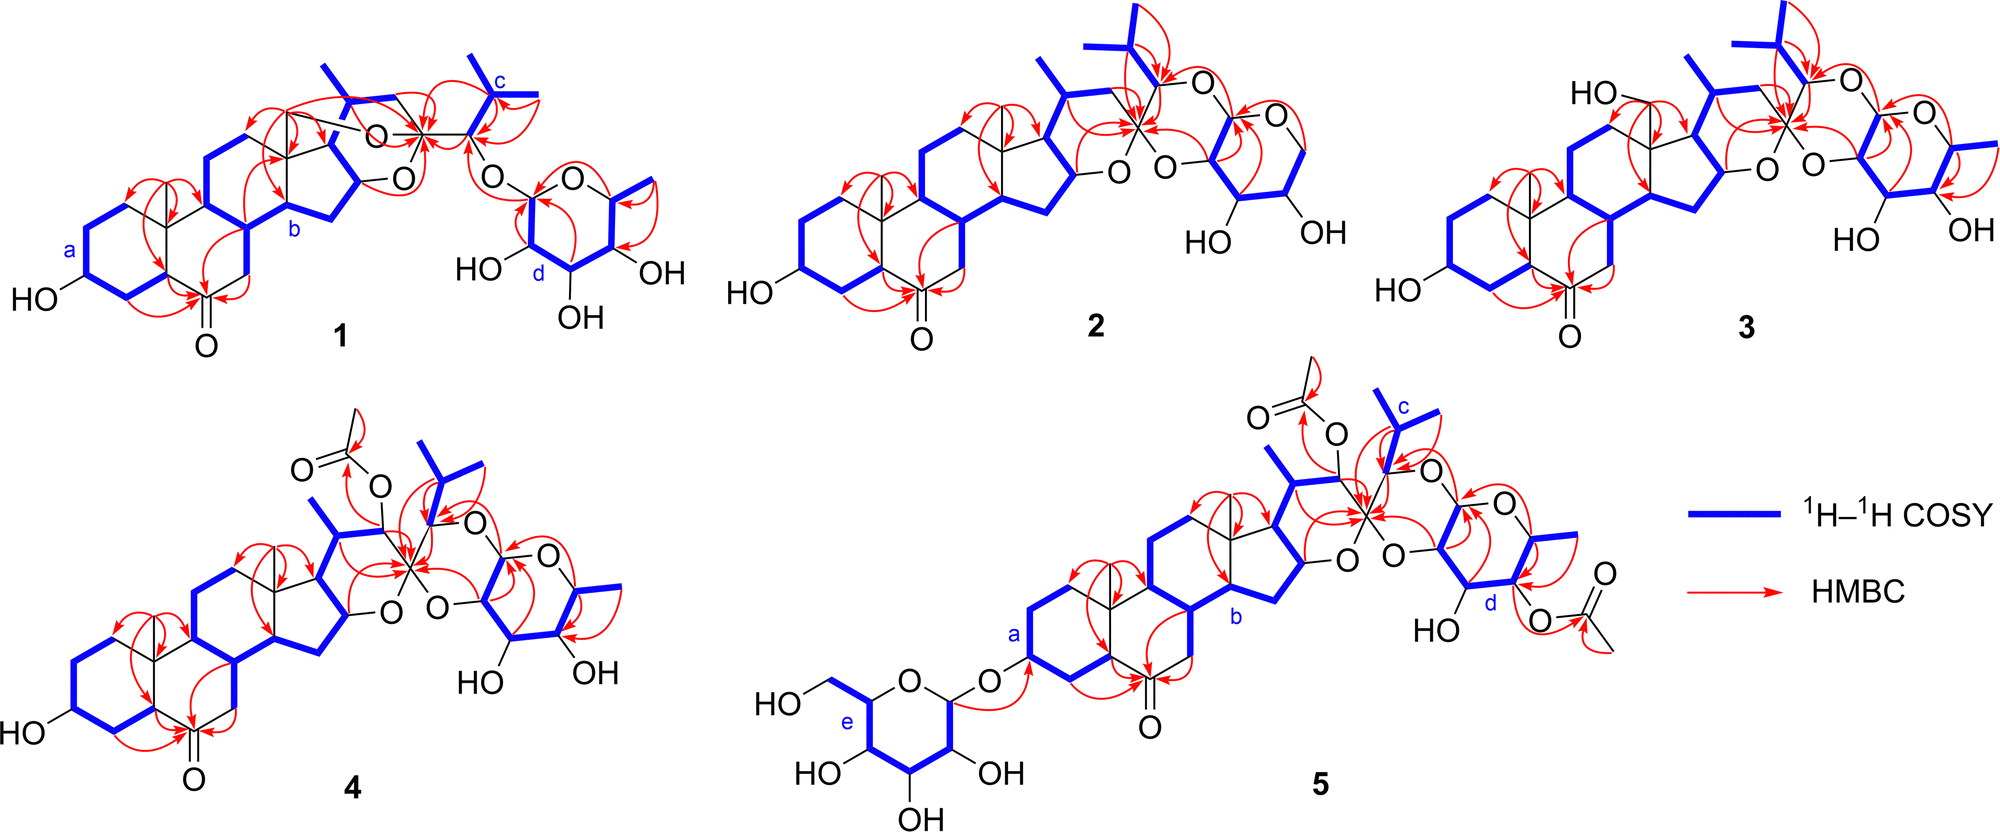 | ||
| Fig. 2 The 1H–1H COSY and key HMBC correlations of 1–5. | ||
The relative configuration of 1 was established by the ROESY experiment (Fig. 3). The ROESY correlations of H-1β/CH3-19/H-8/H-15β/H-20 revealed that these protons were β-oriented. The following protons were α-oriented based on the observed ROESY correlations of H-1α/H-3/H-5/H-9, H- 15α/H-14/H-16/H-17, and H-16/CH3-21. The ROESY correlations of H-1′ with H-3′, H-4′, and H-5′ indicated that they were co-facial and were arbitrarily assigned to be β-oriented. Fortunately, we obtained the crystal of 1. The structure and the absolute configuration of 1 were further confirmed by single crystal X-ray diffraction with Cu Kα radiation described in Fig. 1. In conclusion, the structure of 1 was elucidated as (23R,24S)-5α-cholest-16β,23:18,23-diepoxy-3β,24-diol-6-one-24-O-β-D-fucopyranoside.
 | ||
| Fig. 3 Key ROESY correlations of 1, 2, and 4. | ||
Compound 2 was obtained as a colorless needle crystal. The positive HR-ESI-MS showed an [M + H] + ion peak at m/z 563.3584 (calcd 563.3578), corresponding to the molecular formula of C32H50O8. The 1H and 13C NMR data (Tables 1 and 2), with the assistance of DEPT and HSQC spectra, exhibited the presence of 32 carbon resonances, including five cholestane-type steroid methyl signals at δC 14.9 (C-18), 13.3 (C-19), 20.9 (C-21), 22.8 (C-26), and 18.2 (C-27), and the corresponding proton signals at δH 0.73 (s, CH3-18), 0.77 (s, CH3-19), 0.78 (d, J = 7.1 Hz, CH3-21), 1.15 (d, J = 6.7 Hz, CH3-26), and 1.10 (d, J = 6.7 Hz, CH3-27). Detailed comparison of its 1H, 13C NMR data (Tables 1 and 2) and 1H–1H COSY spectra (Fig. 2) with those of 1 revealed that 2 was similar to 1, with the main differences being the disappearance of oxygenated methines replaced by the oxygenated methylene C-5′ (δC 69.6), disappearance of oxygenated methylene replaced by methyl C-18 (δC 14.9), upfield shift of C-23 (δC 104.4 → 100.3 ppm), C-24 (δC 89.6 → 86.0 ppm), C-2′ (δC 73.1 → 74.0 ppm), and C-3′ (δC 75.6 → 71.8 ppm). Furthermore, compared with 1, the observed HMBC correlations (Fig. 2) from H-16 (δH 4.46)/H-20 (δH 1.58)/H-22 (δH 2.25 and δH 1.10)/H-24 (δH 3.58)/H-25 (δH 2.06)/H-2′ (δH 4.19) to C-23 (δC 100.3) indicated that compound 2 forms an oxygen bridge of C-2′/C-23 and lacks the oxygen bridge of C-18/C-23. As for the sugar moiety, fragment d showed an acetal proton signal at δH 4.52 (br d, J = 7.7 Hz) and an acetal carbon signal at δC 102.2. The HMBC correlations from H2-5′ (δH 4.39 and 3.82) to C-1′ (δC 102.0), H-1′ (δH 4.52) to C-24 (δC 86.0), and H-2′ (δH 4.19) to C-23 (δC 100.3) revealed that the connectivity of the F-ring by two oxygen bridges of C-2′/C-23 and C-1′/C-24 and G-ring had one oxygen bridge of C-1′/C-5′. The relative configuration of the aglycone moiety of 2 was identical to that of 1 by the ROESY experiments. The ROESY correlations of H-24/H-1′/H-3′/H-5hβ/H-4′ disclosed that they were β-oriented, on the contrary, H-2′/H-5′α was α-oriented. Its structure and absolute configuration were equivalently confirmed by X-ray single crystal diffraction with Cu Kα radiation as shown in Fig. 1. Thus, the structure of 2 was elucidated as (23R,24S)-5α-cholest-16β,23-epoxy-23,24-(β-D-arabinopyranose-2,1-di-O-yl)-3β-ol-6-one.
| No. | 1 | 2 | 3 | 4 | 5 |
|---|---|---|---|---|---|
| s, singlet; d, doublet; t, triplet; br, broad; m, multiple; o, overlapped. | |||||
| 1a | 1.58, o | 1.64, o | 1.62, o | 1.63, o | 1.52, o |
| 1b | 1.14, m | 1.16, o | 1.17, o | 1.15, o | 1.01, o |
| 2a | 2.04, m | 1.65, o | 2.00, o | 2.03, o | 2.05, o |
| 2b | 1.64, m | 2.05, o | 1.61, o | 1.64, o | 1.59, o |
| 3 | 3.82, m | 3.82, o | 3.84, o | 3.81, o | 3.98, m |
| 4a | 2.31, o | 2.31, m | 2.30, o | 2.30, br d (13.2) | 2.40 br d (12.9) |
| 4b | 1.88, m | 1.91, o | 1.88, o | 1.91, m | 1.74, o |
| 5 | 2.26, o | 2.25, o | 2.27, o | 2.25 br d (12.4) | 2.05, o |
| 7a | 2.43, dd (12.3,3.7) | 2.38, dd (12.9,4.7) | 2.41, m | 2.36, dd (12.9,2.4) | 2.34, dd (13.0,4.5) |
| 7b | 2.07, o | 1.98, m | 2.00, o | 2.01, o | 1.99, o |
| 8 | 2.11, m | 1.81, m | 2.00, o | 1.80, o | 1.75, o |
| 9 | 1.20, o | 1.14, o | 1.24, o | 1.15, o | 1.11, o |
| 11a | 1.54, o | 1.51, dd (13.4,3.5) | 1.54, m | 1.51, o | 1.45, m |
| 11b | 1.03, o | 1.26, o | 1.24, o | 1.25, o | 1.20, o |
| 12a | 1.67, o | 1.75, dd (12.4,2.9) | 2.80, dt (12.5,3.4) | 1.75, o | 1.75, o |
| 12b | 1.03, o | 1.07, o | 0.96, o | 1.06, m | 1.02, o |
| 14 | 1.19, o | 0.90, m | 1.08, o | 0.90, m | 0.84, o |
| 15a | 2.02, o | 1.83, o | 1.91, o | 1.78, o | 1.77, o |
| 15b | 1.84, m | 1.19, o | 1.22, o | 1.15, o | 1.14, o |
| 16 | 4.65, td (7.7, 2.9) | 4.46, m | 4.61, dd (7.2,2.4) | 4.55, m | 4.51, q (7.8) |
| 17 | 1.29, br d (7.1) | 0.81, o | 0.96, o | 0.81, d (10.3) | 0.83, o |
| 18a | 3.92, br d (13.2) | 0.73, s | 3.91, s | 0.74, s | 0.73, s |
| 18b | 3.32, br d (13.2) | 3.91, s | |||
| 19 | 0.71, s | 0.77, s | 0.71, s | 0.79, s | 0.67, s |
| 20 | 2.05, o | 1.58, m | 2.34, o | 1.97, m | 1.99, o |
| 21 | 1.20, d (7.2) | 0.78, d (7.1) | 1.09, d (6.2) | 0.86, d (6.4) | 0.89 d (6.4) |
| 22a | 2.24, o | 2.25, o | 2.33, o | 5.23, d (11.6) | 5.25 d (11.7) |
| 22b | 1.91, m | 1.10, o | 1.12, d (6.8) | ||
| 24 | 3.66, d (3.7) | 3.58, d (5.4) | 3.65, br d (4.3) | 3.54, d (8.7) | 3.56, d (8.8) |
| 25 | 2.22, m | 2.06, o | 2.24, m | 2.62, m | 2.63, m |
| 26 | 1.24, d (6.8) | 1.15, d (6.7) | 1.12, d (6.8) | 1.25, d (6.7) | 1.26, d (8.3) |
| 27 | 1.19, d (6.8) | 1.10, d (6.7) | 1.06, d (6.8) | 1.19, d (6.7) | 1.20, d (8.3) |
| 24-Fuc | 24-Ara | 24-Fuc | 24-Fuc | 24-Fuc | |
| 1′ | 4.86, d (7.7) | 4.52, br d (7.7) | 4.60, dd (7.2,2.4) | 4.51, br d (7.9) | 4.56, m |
| 2′ | 4.31, t (8.6) | 4.19, td (9.7,2.0) | 4.17, dd (9.9,7.6) | 4.30, t (8.7) | 4.26, o |
| 3′ | 4.04, dd (9.4, 3.4) | 4.13, m | 4.11, br d (10.6) | 4.07, d (9.3) | 4.26, o |
| 4′ | 3.96, br d (2.6) | 4.26, br d (4.4) | 4.06, br s | 3.96, br s | 5.54, br s |
| 5′a | 3.72, br q (6.1) | 4.39, dd (12.5,1.9) | 3.86, o | 3.81, o | 3.92, dd (13.3,6.3) |
| 5′b | 3.82, br d (12.4) | ||||
| 6′ | 1.51, br d (6.4) | 1.58, br d (6.3) | 1.48, br d (6.4) | 1.25, br d (4.5) | |
| 22-OAc | 2.09, s | 2.20, s | |||
| 4′-OAc | 2.28, s | ||||
| 3-Glc | |||||
| 1′′ | 5.06, br d (7.7) | ||||
| 2′′ | 4.07, t (8.2) | ||||
| 3′′ | 4.29, o | ||||
| 4′′ | 4.26, o | ||||
| 5′′ | 4.02, o | ||||
| 6′′a | 4.62, dd (13.4,3.6) | ||||
| 6′′b | 4.41, dd (11.8,5.6) | ||||
| No. | 1 | 2 | 3 | 4 | 5 |
|---|---|---|---|---|---|
| 1 | 36.9, CH2 | 37.0, CH2 | 37.0, CH2 | 36.9, CH2 | 36.6, CH2 |
| 2 | 31.8, CH2 | 31.8, CH2 | 31.8, CH2 | 31.9, CH2 | 29.5, CH2 |
| 3 | 70.0, CH | 70.0, CH | 70.0, CH | 70.0, CH | 76.6, CH |
| 4 | 31.3, CH2 | 31.3, CH2 | 31.3, CH2 | 31.3, CH2 | 27.0, CH2 |
| 5 | 57.0, CH | 57.0, CH | 57.0, CH | 57.0, CH | 56.4, CH |
| 6 | 209.8, C | 210.1, C | 210.1, C | 210.0, C | 209.5, C |
| 7 | 46.7, CH2 | 46.9, CH2 | 47.2, CH2 | 46.9, CH2 | 46.8, CH2 |
| 8 | 37.3, CH | 37.0, CH | 37.2, CH | 36.9, CH | 36.8, CH |
| 9 | 54.4, CH | 53.8, CH | 54.0, CH | 53.7, CH | 53.6, CH |
| 10 | 40.8, C | 41.0, C | 41.1, C | 41.0, C | 40.9, C |
| 11 | 21.8, CH2 | 21.6, CH2 | 21.7, CH2 | 21.6, CH2 | 21.5, CH2 |
| 12 | 34.5, CH2 | 40.2, CH2 | 34.6, CH2 | 40.2, CH2 | 40.1, CH2 |
| 13 | 47.5, C | 42.2, C | 46.9, C | 42.7, C | 42.7, C |
| 14 | 53.4, CH | 52.6, CH | 52.5, CH | 52.7, CH | 52.6, CH |
| 15 | 38.3, CH2 | 32.7, CH2 | 32.8, CH2 | 32.8, CH2 | 32.7, CH2 |
| 16 | 74.3, CH | 71.4, CH | 71.8, CH | 70.1, CH | 70.2, CH |
| 17 | 52.9, CH | 58.8, CH | 59.5, CH | 55.3, CH | 55.3, CH |
| 18 | 66.0, CH2 | 14.9, CH3 | 59.9, CH2 | 14.8, CH3 | 14.8, CH3 |
| 19 | 13.2, CH3 | 13.3, CH3 | 13.3, CH3 | 13.3, CH3 | 13.1, CH3 |
| 20 | 21.9, CH | 26.1, CH | 27.1, CH | 33.1, CH | 33.0, CH |
| 21 | 24.1, CH3 | 20.9, CH3 | 21.9, CH3 | 16.3, CH3 | 16.2, CH3 |
| 22 | 31.1, CH2 | 37.3, CH2 | 37.7, CH2 | 79.6, CH | 79.7, CH |
| 23 | 104.4, C | 100.3, C | 100.6, C | 99.9, C | 100.2, C |
| 24 | 89.6, CH | 86.0, CH | 86.0, CH | 87.4, CH | 87.3, CH |
| 25 | 28.5, CH | 28.2, CH | 28.1, CH | 28.8, CH | 28.7, CH |
| 26 | 22.7, CH3 | 22.8, CH3 | 23.1, CH3 | 22.8, CH3 | 22.7, CH3 |
| 27 | 19.2, CH3 | 18.2, CH3 | 17.9, CH3 | 20.2, CH3 | 20.2, CH3 |
| Fuc | Ara | Fuc | Fuc | Fuc | |
| 1′ | 106.6, CH | 102.0, CH | 101.5, CH | 101.6, CH | 101.0, CH |
| 2′ | 73.1, CH | 74.0, CH | 73.7, CH | 73.5, CH | 73.2, CH |
| 3′ | 75.6, CH | 71.8, CH | 72.3, CH | 72.6, CH | 70.5, CH |
| 4′ | 72.7, CH | 70.3, CH | 73.0, CH | 72.8, CH | 74.4, CH |
| 5′ | 71.5, CH | 69.6, CH2 | 73.5, CH | 73.5, CH | 71.6, CH |
| 6′ | 17.3, CH3 | 17.2, CH3 | 17.1, CH3 | 16.7, CH3 | |
| 22-OAc | 170.0, C | 170.2, C | |||
| 21.2, CH3 | 21.3, CH3 | ||||
| 4′-OAc | 171.1, C | ||||
| 20.9, CH3 | |||||
| 3-Glc | |||||
| 1′′ | 102.2, CH | ||||
| 2′′ | 75.4, CH | ||||
| 3′′ | 78.7, CH | ||||
| 4′′ | 71.9, CH | ||||
| 5′′ | 78.7, CH | ||||
| 6′′ | 63.0, CH2 |
Compound 3 was obtained as a colorless needle crystal. By the HR-ESI- MS at m/z 615.3512 [M + Na]+ (calcd 615.3504) and 13C NMR data (Table 2) analysis, we deduced 3 possessed the same molecular formula as 1. Comparison the NMR (Tables 1 and 2) and 1H–1H COSY spectra (Fig. 2) of 3 with those of 1 suggested that 3 was similar to 1 except for the obviously different chemical shift signals for C-18 (δC 66.0 → 59.9), C-23 (δC 104.4 → 100.6), C-24 (δC 89.6 → 86.0), C-2′(δC 73.1 → 73.7), and C-3′ (δC 75.6 and C-3 Furthermore, the HMBC correlations (Fig. 2) from H-16 (δH 4.61)/H-20 (δH 2.34)/H-24 (δH 3.65)/H-25 (δH 2.24)/H-2′ (δH 4.17) to C-23 (δC 100.6) and H-1′ (δH 4.60) to C-24 (δC 86.0) revealed that compound 3 has two oxygen bridges of C-1′/C-24 and C-2′/C-23, however, it lacks the oxygen bridge of C-18/C-23. The relative configuration of 3 was confirmed by ROESY correlations and was identical to 2. The absolute stereochemistry of 3 was unambiguous substantiated by X-ray single crystal diffraction with Cu Kα radiation as shown in Fig. 1. Based on the above evidence, the structure of 3 was elucidated as (23R,24S)-5α-cholest-16β,23-epoxy-23,24-(β-D-fucopyranose-2,1-di-O-yl)-3β,18-diol-6-one, named 18-hydroxylypsilanogenin.
The molecular formula of compound 4 was deduced as C35H54O10 according to the ion peak at m/z 657.3616 [M + Na]+ (calcd 657.3609) and 13C NMR data (Table 2). The IR absorptions at 3440, 1712, and 1742 cm−1 implied the existence of hydroxy, carbonyl, and esteryl groups, respectively. Compounds 4 and 3 had similar structures by contrastive analyses of the 1H and 13C NMR data (Tables 1 and 2), 1H–1H COSY and HMBC spectra (Fig. 2). However, detailed analyses of the NMR signals of 4 lead to finding the absences of a methylene replaced by an oxymethine δC 79.6 (C-22), an oxymethylene replaced by a methyl δC 14.8 (C-18), and the appearance of an acetyl group (δC 170.0 and 21.2). The acetoxyl group connected to C-22 proved the correlations of H-14/H-16/CH3-21/H-22 (Fig. 3). The rest by HMBC correlation from H-22 (δH 5.23)/δH 2.09 (CH3) to δC 170.0 (Fig. 2) and the acetoxyl group was β-oriented by the ROESY stereochemistry of 4 and was found to be identical to 3 by the ROESY experiment. In a nutshell, the structure of compound 4 was elucidated as (23S,24S)- 5α-cholest-16β,23-epoxy-22β-acetoxy-23,24-(β-D-fucopyranose-2,1-di-O-yl)-3β-ol-6-one, and named 22β-acetoxylypsilanogenin.
Compound 5, a white amorphous solid, has a molecular formula of C43H66O16 hinged on its ion peak at m/z 861.4251 [M + Na] + (calcd. 861.4243) in the HR-ESI-MS spectrum and 13C NMR data (Table 2). Based on the analyses of its 1H and 13C NMR spectra as well as 1H–1H COSY and HSQC experiments (Fig. 2), compound 5 has the same aglycone moiety with 4, but the differences are an additional acetyl group (δC 171.1 and 20.9) and D-glucopyranosyl moiety at δC 102.2 (C-1′′), 75.4 (C-2′′), 78.7 (C-3′′), 71.9 (C-4′′), 78.7 (C-5′′), and 63.0 (C-6′′), which was confirmed by acid hydrolysis experiment. The β-anomeric configuration for the D-glucopyranosyl moiety was confirmed by the coupling constant 3J1,2 (7.7 Hz) of anomeric proton.23 The HMBC correlation between H-1′′ (δH 5.06) and δC 76.6 (C-3) revealed that the D-glucopyranosyl moiety was connected to C-3. The additional acetyl group was attached at C-4′ deduced by the HMBC correlations from δH 5.54 (H-4′)/δH 2.28 (CH3) to δC 171.1. The stereochemistry of 5 was identical to compound 4 by the ROESY experiment (Fig. 3). Consequently, the structure of 5 was identified as (23S,24S)-5α-cholest-16β,23-epoxy-22β,4′-diacetoxy-23,24-(β-D-fucopyranose-2,1-di-O-yl)-3β-ol-6-one-3-O-β-D-glucopyranoside, and named 22β,4′,-diacetoxylypsilanogenin 3-O-β-D-glucopyranoside.
The possible biosynthetic pathways of compounds 1–5 are proposed in Scheme 1. From the biosynthetic perspective, compound 1–5 had the same synthetic precursor, acetyl-CoA. As deduced in Scheme 1, acetyl-CoA may undergo muti-step reaction to give the intermediate isofucosterol. Then isofucosterol may undergo stepwise oxidization, elimination, and hydrolysis reaction to yield compound VIII. Furthermore, X with fucose or arabinose was obtained through glycosylation and oxidization reaction from VIII. Ketalization reaction of compound X could yield compound 2 and XI (ypsilanogenin) with a different sugar respectively. Subsequently, XI may afford compound 3 by further oxidation. The OH-18 of 3 undergoes ketal exchange reaction to obtain compound 1, which possesses a new ketal carbon and a new hydroxy. Furthermore, ypsilanogenin (XI) undergoes stepwise oxidation, acetylation, and glycosylation to generate compounds 4 and 5.
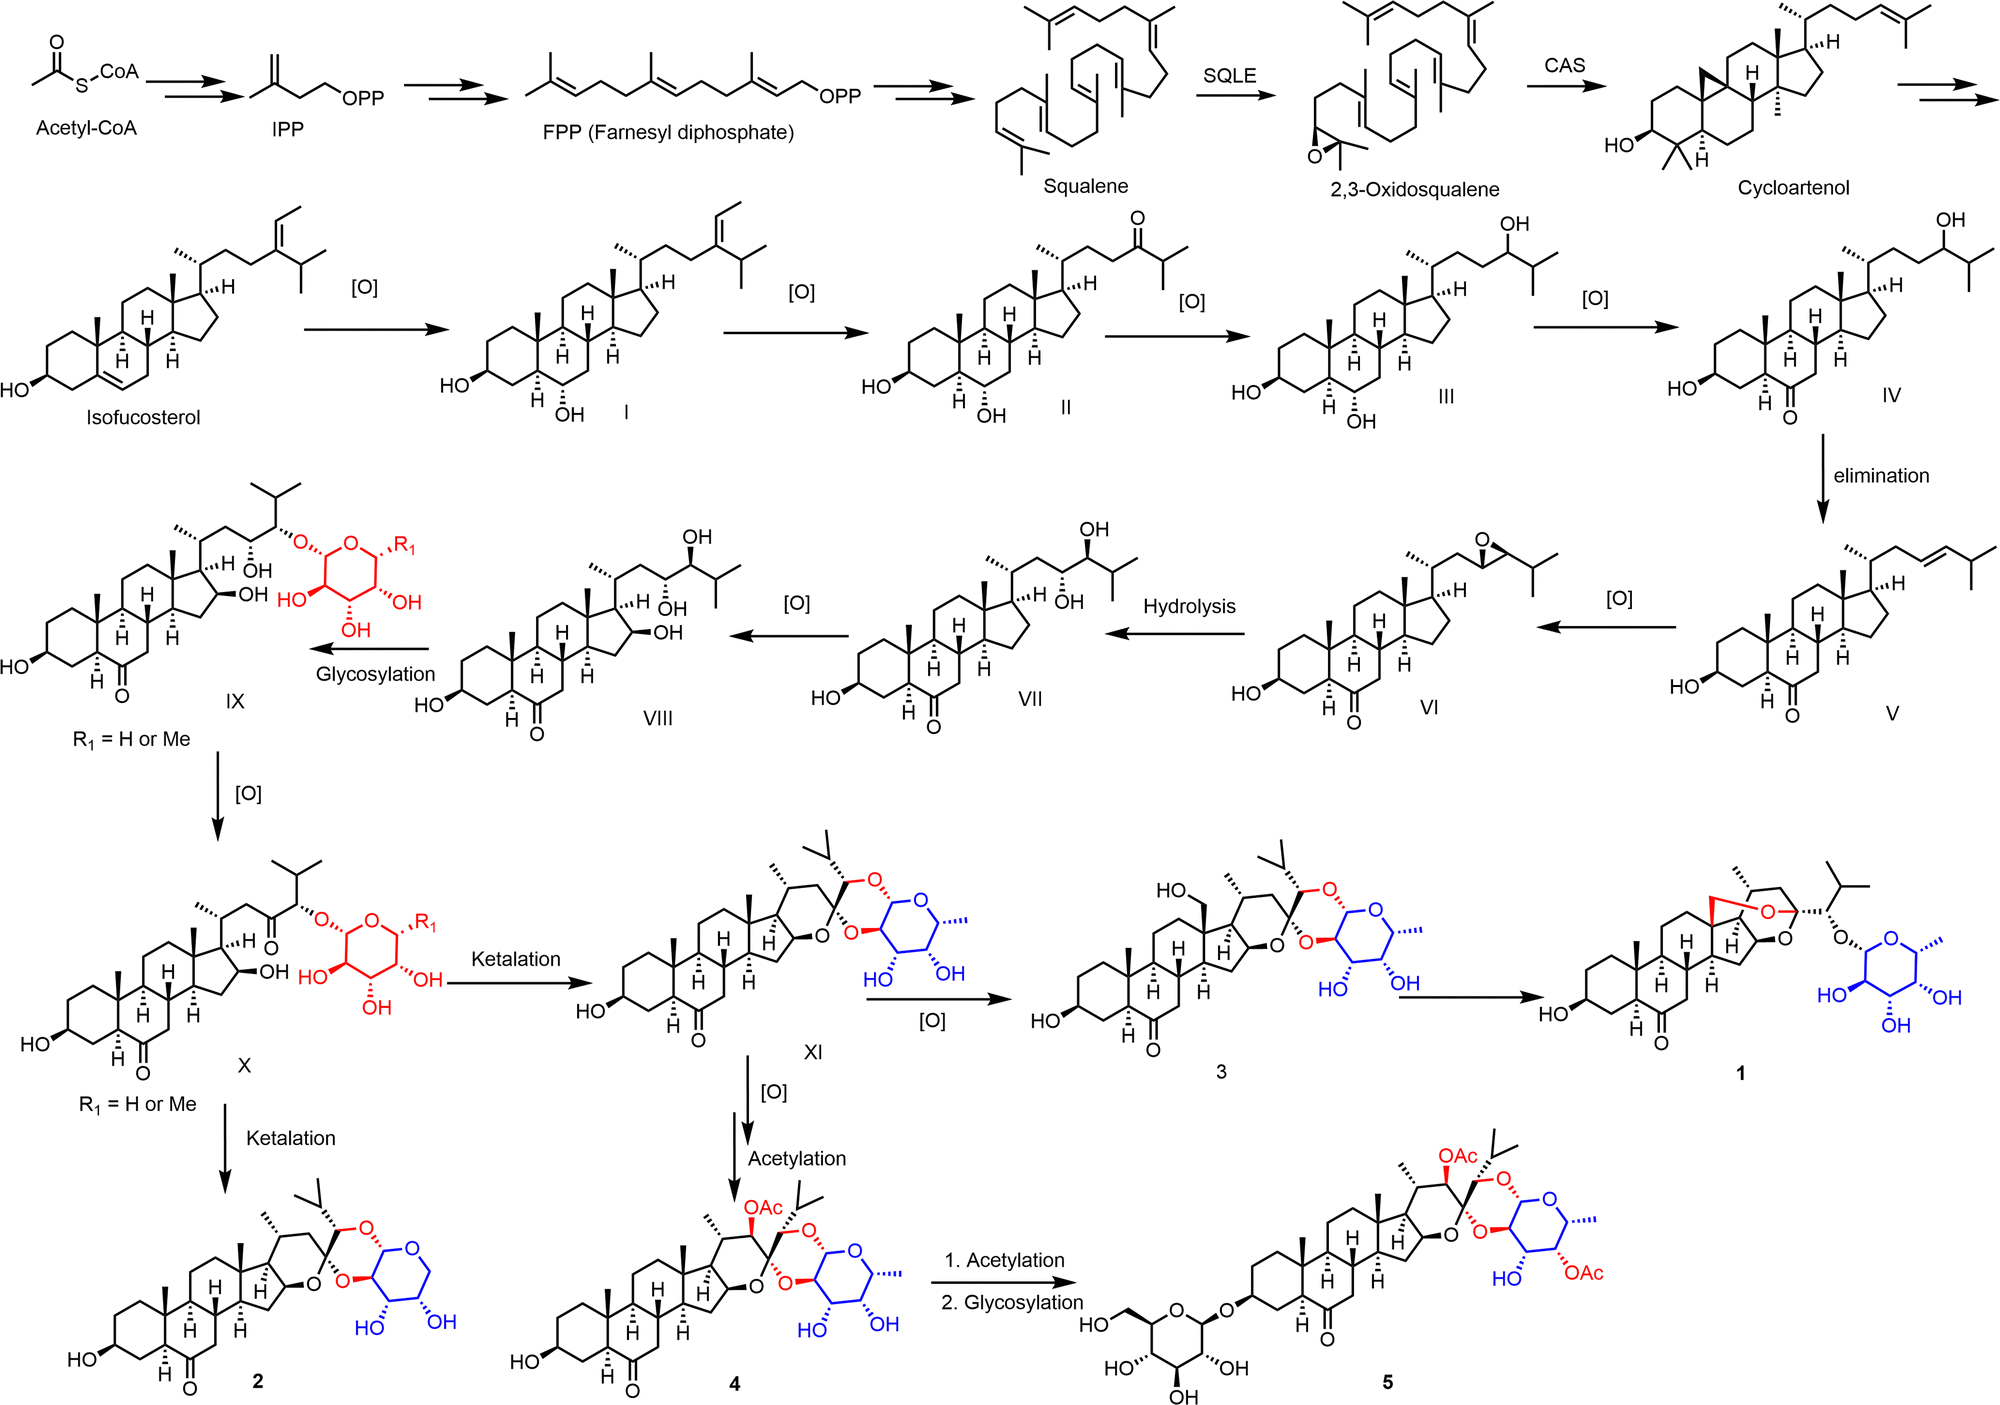 | ||
| Scheme 1 The possible biosynthetic pathways of 1–5. | ||
Many cholestanol glycosides have shown cytotoxic activities24 and antibacterial activities.25 Therefore, all these isolated compounds were evaluated in vitro for their cytotoxic activity against esophageal cancer cells EC109 and anti-inflammatory activity in RAW 264.7 macrophages. Furthermore, the inhibitory effect of these compounds on the formation of sub-intestinal vessels (SIV) in zebrafish embryos were also evaluated. Unfortunately, none of these tested compounds showed cytotoxic effects (IC50 > 50 μM) on EC109 cells as compared with the positive drug cisplatin. On the other hand, compounds 1 and 2 exhibited weak inhibitory activities (17.6% and 18.5%, respectively) at a concentration of 50 μM against LPS-induced nitric oxide (NO) production in RAW 264.7 macrophages. The formation of SIV in zebrafish embryos was shown to be inhibited by compound 5 (10 μM) as the length of SIV was significantly decreased after treatment as shown in Fig. 4.
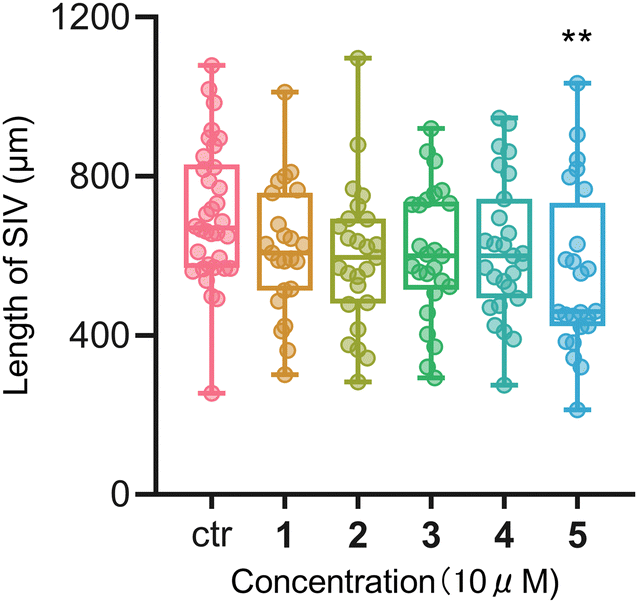 | ||
| Fig. 4 The length of SIV in zebrafish embryos after being treated with isolates. | ||
Experimental
General experimental procedures
HR-ESI-MS data were recorded on an Agilent 1290 UPLC/6540 Q-TOF mass spectrometer. The NMR spectra were recorded on a Bruker AVANCE III 500. IR spectra were recorded on a Bruker FT-IR Tensor-27 infrared spectrophotometer with KBr disks. X-ray diffraction was conducted using a Bruker APEX DUO diffractometer with graphite-monochromated Cu Kα radiation. Silica gel (200–300 mesh, Qingdao Marine Chemical Co., Ltd, China), RP-18 (50 μm, Merck, Germany), and Sephadex LH-20 (GE Healthcare, USA) were used for column chromatography (CC). An Agilent 1260 system (Agilent Corp., America) with a Zorbax SB-C18 column (5 μm, 9.4 × 250 mm) was used for HPLC separation. TLC was carried out on silica gel HSGF254 plates (Qingdao Marine Chemical Co., China) or RP-18 F254 (Merck, Darmstadt, Germany).Plant materials
The plant materials of Y. thibetica, identified by Prof. Xin-Qi Chen (Institute of Botany, Chinese Academy of Sciences, Beijing) were collected in August 2010 from Zhaotong City, Yunnan Province, China A voucher specimen (No. HY0002) was deposited at the State Key Laboratory of Phytochemistry and Plant Resources in West China, Kunming Institute of Botany, Chinese Academy of Sciences.Extraction and isolation
110 kg of dried whole plants of Y. thibetica were ground into powder and fully extracted three times with 70% EtOH under reflux for 3 h, 2 h, and 2 h. Then, the combined extract was concentrated under reducing pressure to yield 30 kg of crude extract. The extract was dispersed in water and extracted using water-saturated n-butanol three times. The n-BuOH soluble fractions were combined and concentrated. The n-BuOH extract (13 kg) was subjected to column chromatography over silica gel with a mixture (CHCl3–MeOH–H2O, 20![[thin space (1/6-em)]](https://www.rsc.org/images/entities/char_2009.gif) :1:0.05 → 7:3:0.5, v/v/v) to give eleven fractions (Fr. 1–Fr. 11). Fr. 1 (2 kg) was subjected to a polyamide column chromatography, eluting with a gradient system of EtOH–H2O (20% → 60%, v/v) to afford four main fractions (Fr. 1.1–Fr. 1.4). Fr. 1.3 (800 g) was separated using silica gel column and further fractionated by a RP-C18 silica gel column (MeOH–H2O, 30% → 100%, v/v) to afford Fr. 1.3.1–Fr. 1.3.11. Fr. 1.3.3 was applied to a Sephadex LH-20 column (MeOH), and further purified by semi-preparative HPLC (35–55% MeCN in H2O within 30 min, 4 mL min−1) to afford 1 (273 mg, 21.3 min) and 2 (38.6 mg, 26.5 min). Fr. 1.3.5 was repeatedly purified by semi-preparative HPLC (30–65% MeCN in H2O within 40 min, 4 mL min−1) to afford 3 (88 mg, 20.5 min) and 4 (179 mg, 22.1 min) and 5 (89 mg, 27.2 min).
:1:0.05 → 7:3:0.5, v/v/v) to give eleven fractions (Fr. 1–Fr. 11). Fr. 1 (2 kg) was subjected to a polyamide column chromatography, eluting with a gradient system of EtOH–H2O (20% → 60%, v/v) to afford four main fractions (Fr. 1.1–Fr. 1.4). Fr. 1.3 (800 g) was separated using silica gel column and further fractionated by a RP-C18 silica gel column (MeOH–H2O, 30% → 100%, v/v) to afford Fr. 1.3.1–Fr. 1.3.11. Fr. 1.3.3 was applied to a Sephadex LH-20 column (MeOH), and further purified by semi-preparative HPLC (35–55% MeCN in H2O within 30 min, 4 mL min−1) to afford 1 (273 mg, 21.3 min) and 2 (38.6 mg, 26.5 min). Fr. 1.3.5 was repeatedly purified by semi-preparative HPLC (30–65% MeCN in H2O within 40 min, 4 mL min−1) to afford 3 (88 mg, 20.5 min) and 4 (179 mg, 22.1 min) and 5 (89 mg, 27.2 min).
Compound 1
Colorless prismatic crystal. [α]25D 12.86 (c 0.07, MeOH). IR (KBr) νmax 3424, 2934, 2872, 1709, 1633, 1424, 1330, 1273, 1134, 1068 cm−1; 1H NMR (500 MHz, C5D5N) and 13C NMR (125 MHz, C5D5N) data see Tables 1 and 2; HR-ESI-MS m/z 615.3514 [M + Na] + (calcd for C33H52O9Na, 615.3504).Compound 2
Colorless needle crystal. [α]25D −22.75 (c 0.08, MeOH). IR (KBr) νmax 3438, 2931, 2870, 1707, 1634, 1452, 1339, 1285, 1148 cm −1; 1H NMR (500 MHz, C5D5N) and 13C NMR (125 MHz, C5D5N) data see Tables 1 and 2; HR-ESI-MS 563.3584 [M + H]+ (calcd for C32H51O8, 563.3578).Compound 3
Colorless needle crystal. [α]25D −19.71 (c 0.07, MeOH). IR (KBr) νmax 3441, 2934, 2870, 1708, 1633, 1453, 1332, 1284, 1141 cm−1; 1H NMR (500 MHz, C5D5N) and 13C NMR (125 MHz, C5D5N) data see Tables 1 and 2; HR-ESI-MS at m/z 615.3512 [M + Na]+ (calcd for C33H52O9Na, 615.3504).Compound 4
White amorphous solid. [α]25D −5.72 (c 0.07, MeOH). IR (KBr) νmax 3440, 2966, 2937, 2874, 2854, 1742, 1712, 1633, 1442, 1382, 1236, 1066 cm−1; 1H NMR (500 MHz, C5D5N) and 13C NMR (125 MHz, C5D5N) data see Tables 1 and 2; HR-ESI-MS at m/z 657.3616 [M + Na] + (calcd for C35H54O10Na, 657.3609).Compound 5
White amorphous solid. [α]25D −61.00 (c 0.10, MeOH). IR (KBr) νmax 3431, 2967, 2939, 2873, 1738, 1716, 1633, 1427, 1373, 1249, 1173 cm−1; 1H NMR (500 MHz, C5D5N) and 13C NMR (125 MHz, C5D5N) data see Tables 1 and 2; HR-ESI-MS at m/z 861.4251 [M + Na]+ (calcd for C43H66O16Na, 861.4243).Crystallographic data for 1
C33H52O9·CH4O, M = 624.78, a = 12.2949(3) Å, b = 9.7000(2) Å, c = 14.6302(3) Å, α = 90°, β = 110.8410(10)°, γ = 90°, V = 1630.65(6) Å3, T = 100.(2) K, space group P1211, Z = 2, μ(Cu Kα) = 0.752 mm−1, 30722 reflections measured, 6401 independent reflections (Rint = 0.0363). The final R1 values were 0.0279 (I > 2σ(I)). The final wR(F2) values were 0.0702 (I > 2σ(I)). The final R1 values were 0.0280 (all data). The final wR(F2) values were 0.0703 (all data). The goodness of fit on F2 was 1.046. Flack parameter = −0.02(3). The crystallographic data for the structure of 1 were deposited in the Cambridge Crystallographic Data Centre as supplementary publication CCDC 2201542.†
Crystallographic data for 2
C32H50O8·H2O, M = 580.73, a = 6.70730(10) Å, b = 11.6828(3) Å, c = 38.5757(8) Å, α = 90°, β = 90°, γ = 90°, V = 3022.79(11) Å3, T = 100. (2) K, space group P212121, Z = 4, μ (Cu Kα) = 0.747 mm−1, 27775 reflections measured, 5969 independent reflections (Rint = 0.0969). The final R1 values were 0.0372 (I > 2σ(I)). The final wR(F2) values were 0.0845 (I > 2σ(I)). The final R1 values were 0.0479 (all data). The final wR(F2) values were 0.0898 (all data). The goodness of fit on F2 was 1.041. Flack parameter = 0.14(9). The crystallographic data for the structure of 2 were deposited in the Cambridge Crystallographic Data Centre as supplementary publication CCDC 2201543.†
Crystallographic data for 3
C33H52O9·CH4O·H2O, M = 642.80, a = 12.0479(3) Å, b = 7.6358(2) Å, c = 17.9880(5) Å, α = 90°, β = 94.9550(10)°, γ = 90°, V = 1648.63(8) Å3, T = 100.(2) K, space group P1211, Z = 2, μ(Cu Kα) = 0.781 mm−1, 19289 reflections measured, 6224 independent reflections (Rint = 0.0359). The final R1 values were 0.0285 (I > 2σ(I)). The final wR(F2) values were 0.0726 (I > 2σ(I)). The final R1 values were 0.0289 (all data). The final wR(F2) values were 0.0731 (all data). The goodness of fit on F2 was 1.056. Flack parameter = 0.03(4). Crystallographic data for the structure of 3 have been deposited in the Cambridge Crystallographic Data Centre as supplementary publication CCDC 2201544.†
Acid hydrolysis of compound 5 and determination of the absolute configuration of the sugar by HPLC
Compounds 5 (1.0 mg) was added to 6 M CF3COOH (1,4-dioxane-H2O 1:1, 1.0 mL) and heated for 2 h at 99 °C. The reaction mixture, diluted with H2O (1 mL), was extracted with EtOAc (3 × 2 mL). Next, the dried residue of the aqueous layer was dissolved in pyridine (1.0 mL) mixed with L-cysteine methyl ester hydrochloride (1.0 mg) (Aldrich, Japan) and heated for 1 h at 60 °C. Then, O-tolyl isothiocyanate (5.0 μL) (Tokyo Chemical Industry Co., Ltd, Japan) was added to the mixture and followed by heating for 1 h at 60 °C. Each reaction mixture was directly analyzed by analytical HPLC on a Poroshell 120 SB-C18 column (4.6 × 100 mm, 2.7 μm, Agilent) using an elution of MeCN-H2O (20:75 → 40:60, v/v) at a flow rate of 0.6 mL min−1. Under UV detection at 254 nm, the retention time for the standard monosaccharides were: D-glucose (13.85 min) was used for comparison with retention times from reaction mixtures for the saponin. The absolute configuration of the sugar for 5 was identified as D-glucose (13.95 min).
Cytotoxicity in human esophageal cancer cells
The evaluation of cytotoxicity was performed in human esophageal cancer cells EC109 by the MTT [3-(4,5-dimethylthiazol-2-yl)-2,5-diphenyltetrazolium bromide] assay as previously described.26 Cisplatin was used as the positive control. The experiments were conducted for three independent replicates, and IC50 > 50 μM was considered to be inactive.Anti-inflammatory activities in mouse macrophages
Anti-inflammatory activities of compounds 1–5 were tested in vitro by measuring the LPS-induced NO production in RAW 264.7 mouse macrophages, and cell viability was determined using the MTT method.27 Cells were seeded in 96-well culture plates and treated with compounds at 50 μM with LPS (1 μg mL−1) for 24 h. The cell culture supernatant was collected and then mixed with an equal volume of Griess reagent I and Griess reagent II, and the absorbance of the samples was read at 540 nm with a microplate reader. The results were described as mean ± SD of two independent experiments.Anti-angiogenic activities in zebrafish embryos
Transgenic zebrafish Tg (fli1: EGFP) y1, which express enhanced Green Fluorescent Proteins (eGFP) in endothelial cells, were purchased from Zebrafish International Resource Center, Univerisity of Orgeon, USA for the experiments.28,29 The use of zebrafish for the experiments was approved by the Animal Experimentation Ethics Committee of The Chinese University of Hong Kong (Ref No. 21/247/MIS). At 1-hour post-fertilization, embryos were collected and transferred into a 24-well microplate, with 15 embryos per well. Under the treatment of compounds 1–5 (5 or, 10 μM) for 72 h, photos of the sub-intestinal vessels (SIV) of embryos were taken under a fluorescent microscope (Olympus IX71) by a digital camera (Diagnostic Instruments, Inc., USA) at 100× magnification. The length of the SIV was measured using ImageJ software.28 Experiments were performed twice. Data were expressed as mean ± SEM. Differences among treated groups were determined by one-way ANOVA with Tukey’s post-hoc test.Conclusions
In summary, five rare cholestane derivatives were isolated from the whole plant of Y. thibetica. Compound 1 is the first cholestane glycoside with two oxygen bridges of C-16/C-23 and C-18/C-23. Compound 2 is the first 23-spirocholestane derivative with a ketal carbon at the C-23 link to C-16 and C-2′ of the D-arabinose ligand, and an oxygen bridge between C-24 and C-1′ of the D-arabinose ligand, whereas compounds 3–5 are rare 23-spirocholestane derivatives with a D-fucose ligand. Cytotoxic assays showed that all isolated saponins did not show any cytotoxic effects on EC109 cells. On the other hand, anti-inflammatory assays showed that compounds 1 and 2 exhibited weak inhibitory activities (17.6% and 18.5%, respectively) at a concentration of 50 μM against LPS-induced NO production in RAW 264.7 macrophages. Furthermore, the formation of SIV in zebrafish embryos was blocked by compound 5 at a concentration of 10 μM, suggesting its potential anti-angiogenic activity.Conflicts of interest
There are no conflicts to declare.Acknowledgements
This work was financially supported by the National Natural Science Foundation of China (U1802287, 32000280, and 32170408), the Ten Thousand Talents Plan of Yunnan Province for Industrial Technology Leading Talents (YNWR-CYJS-2019-011), Yunnan Revitalization Talent Support Program “Top Team” Project, and the Project of Yunnan Characteristic Plant Screening and R&D Service CXO Platform (2022YKZY001). This study was also partly supported by a grant from the State Key Laboratory of Research on Bioactivities and Clinical Applications of Medicinal Plants from Hong Kong SAR, China.References
- S. G. Sparg, M. E. Light and J. V. Staden, J. Ethnopharmacol., 2004, 94, 219–243 CrossRef CAS PubMed.
- X. J. Qin, Y. A. Si, Y. Chen, H. Liu, W. Ni, H. Yan, T. Shu, Y. H. Ji and H. Y. Liu, Bioorg. Med. Chem. Lett., 2017, 27, 2267–2273 CrossRef CAS PubMed.
- Z. H. Liu, H. Yan, Y. A. Si, W. Ni, Y. Chen, C. X. Chen, L. He, Z. Q. Zhang and H. Y. Liu, Fitoterapia, 2015, 105, 210–214 CrossRef CAS.
- Y. S. Chen, Y. He, C. Chen, Y. Zeng, D. Xue, F. Y. Wen, L. Wang, H. Zhang and J. R. Du, Steroids, 2014, 83, 39–44 CrossRef CAS PubMed.
- Y. S. Wen, W. Ni, X. J. Qin, H. Yan, C. X. Chen, Y. Hua, Y. C. Cheng, L. He and H. Y. Liu, Phytochem. Lett., 2015, 12, 31–34 CrossRef CAS.
- Y. A. Si, H. Yan, W. Ni, Z. H. Liu, T. X. Lu, C. X. Chen and H. Y. Liu, Nat. Prod. Bioprospect., 2014, 4, 315–318 CrossRef CAS PubMed.
- D. W. Deng, D. R. Lauren, J. M. Cooney, D. J. Jensen, K. V. Wurms, J. E. Upritchard, R. D. Cannon, M. Z. Wang and M. Z. Li, Planta Med., 2008, 74, 1397–1402 CrossRef CAS.
- X. J. Qin, W. Ni, C. X. Chen and H. Y. Liu, J. Ethnopharmacol., 2018, 224, 134–139 CrossRef CAS.
- Z. H. Liu, H. Yan, Y. A. Si, W. Ni, Y. Chen, L. He and H. Y. Liu, Steroids, 2016, 106, 86–92 CrossRef CAS PubMed.
- The Editorial Board of Flora of China, Flora of China, Science Press, Beijing, 1980, p 17.
- D. Z. Li, The families and genera of Chinese vascular plants, Science Press, 2020, vol. 1, pp. 354–355 Search PubMed.
- State Administration of Chinese Medicine, Chinese Material Medica (VIII), Shanghai Science and Technology Press, 1999, p. 149 Search PubMed.
- Jiangsu New Medical College, Dictionary of Traditional Chinese Crude Drugs, Shanghai Science and Technology Press, 1977, p. 1841 Search PubMed.
- B. B. Xie, H. Y. Liu, W. Ni and C. X. Chen, Steroids, 2009, 74, 950–955 CrossRef CAS PubMed.
- B. B. Xie, C. X. Chen, Y. H. Guo, Y. Y. Li, Y. J. Liu, W. Ni, L. M. Yang, N. B. Gong, Y. T. Zheng, R. R. Wang, Y. Lu and H. Y. Liu, Planta Med., 2013, 79, 1063–1067 CrossRef CAS.
- Y. Lu, B. B. Xie, C. X. Chen, W. Ni, H. Yan and H. Y. Liu, Helv. Chim. Acta, 2011, 94, 92–97 CrossRef CAS.
- Y. Lu, C. X. Chen, W. Ni, H. Yan and H. Y. Liu, Steroids, 2010, 75, 982–987 CrossRef CAS.
- W. T. Gao, L. L. Yu, J. Xie, L. G. Xiao, S. J. Zhang, W. Y. Ma, H. Yan and H. Y. Liu, Nat. Prod. Bioprospect., 2022, 12, 17 CrossRef.
- T. X. Lu, T. Q. Shu, J. Xu, W. Ni, Y. H. Ji, Q. R. Chen, A. Khan, Q. Zhao and H. Y. Liu, Steroids, 2017, 123, 55–60 CrossRef CAS.
- Y. Chen, Y. A. Si, W. Ni, H. Yan, X. J. Qin, C. X. Chen and H. Y. Liu, Nat. Prod. Bioprospect., 2016, 6, 173–182 CrossRef CAS PubMed.
- X. D. Zhang, C. X. Chen, Y. J. Yang, W. Ni and H. Y. Liu, Helv. Chim. Acta, 2012, 95, 1087–1093 CrossRef CAS.
- T. Asano, T. Murayama, Y. Hiral and J. Shoji, Chen. Pharm. Bull., 1993, 41, 566–570 CrossRef CAS PubMed.
- P. K. Agrawal, Phytochemistry, 1992, 31, 3307–3330 CrossRef CAS.
- T. Iguchi, M. Kuroda, R. Naito, T. Watanabe, Y. Matsuo, A. Yokosuka and Y. Mimaki, Molecules, 2017, 22, 1243 CrossRef.
- Shamsuzzaman, M. S. Khan, M. Alam, Z. Tabassum, A. Ahmad and A. U. Khan, Eur. J. Med. Chem., 2010, 45, 1094–1097 CrossRef CAS.
- T. Mosmann, J. Immunol. Methods, 1983, 65, 55–63 CrossRef CAS PubMed.
- D. Li, H. Liu, W. Ni, W. L. Xiao, L. He, Z. Y. Guo, X. J. Qin and H. Y. Liu, Phytochemistry, 2019, 168, 1–10 CrossRef PubMed.
- G. G. L. Yue, B. C. L. Chan, H. F. Kwok, Y. L. Wong, H. W. Leung, C. J. Ji, K. P. Fung, P. C. Leung, N. H. Tan and C. B. S. Lau, Eur. J. Med. Chem., 2013, 59, 243–252 CrossRef CAS.
- P. Li, G. G. L. Yue, H. F. Kwok, C. L. Long, C. B. S. Lau and E. J. Kennelly, J. Agric. Food Chem., 2017, 65, 8348–8355 CrossRef CAS.
Footnote |
| † Electronic supplementary information (ESI) available: IR, HRESIMS, and NMR (1H NMR, 13C NMR, DEPT, 1H−1H COSY, HSQC, HMBC, and ROESY) spectra of compounds 1–5. CCDC 2201542–2201544. For ESI and crystallographic data in CIF or other electronic format see DOI: https://doi.org/10.1039/d2nj04576a |
| This journal is © The Royal Society of Chemistry and the Centre National de la Recherche Scientifique 2023 |