Fluorometric detection of a chemical warfare agent mimic (DCP) using a simple hydroxybenzothiazole–diaminomaleonitrile based chemodosimeter†
Manas Kumar
Das
a,
Tanushree
Mishra
a,
Subhajit
Guria
a,
Debojyoti
Das
a,
Juheli
Sadhukhan
a,
Sushmita
Sarker
c,
Koushik
Dutta
b,
Arghya
Adhikary
 c,
Dipankar
Chattopadhyay
 b and
Susanta Sekhar
Adhikari
 *a
*a
aDepartment of Chemistry, University of Calcutta, 92, A. P. C. Road, Kolkata, 700 009, West Bengal, India. E-mail: adhikarisusanta@yahoo.com; Fax: +91-33-23519755; Tel: +91-332-3509937
bDepartment of Polymer Science and Technology, University of Calcutta, 92 A. P. C Road, Kolkata, 700009, India
cCenter for Research in Nanoscience and Nanotechnology, Technology Campus, University of Calcutta, JD-2, Sector-III, Salt Lake, Kolkata, 700106, West Bengal, India
First published on 15th November 2022
Abstract
Diethyl chlorophosphate (DCP) has similar reactivity to sarin, which is widely known as a nerve agent that is often used in terrorist attacks. As DCP lacks high toxicity, it can be used as a model compound for sarin detection. Besides their use as chemical warfare agents (CWAs), organophosphorus compounds (OPs) also have greater implications for human health. To maintain the balance in global security the first and most in demand work is to establish efficient detection methods for monitoring CWAs. The work presented here reports a benzothiazole-based fluorescent chemodosimeter (BZ-DAM) for the fluorogenic detection of DCP via the ESIPT assisted ICT mechanism. The benzothiazole unit serves as a fluorophore, whereas the phenolic and imine groups act as a recognition unit for DCP. In this mechanistic path, the phenol group in BZ-DAM is phosphoesterified by DCP, which leads to a significant fluorescence change and assists the hydrolysis of the aldemine of BZ-DAM. The detection limit was found to be 0.43 μM by the fluorescence method. BZ-DAM is also stable in biological mediums and a physiological pH range and can be successfully used to detect intracellular DCP in living cells. Scanning electron microscopy (SEM) studies of a polycaprolactone (PCL)-BZ-DAM composite also revealed partial deformation of the surface of the nanomaterials upon the adsorption of DCP, indicating a DCP-mediated chemical transformation.
Introduction
Chemical warfare nerve agents (CWNAs) are a family of organophosphorus compounds (OPs) that have a highly toxic phosphate or a phosphite group. They are either volatile liquids or gases and are the most dangerous class of synthetic chemical weapons used for global mass destruction.1 OPs, containing a chemically reactive phosphate ester side chain, are primarily used as agricultural pesticides and herbicides.2 Nerve agents such as sarin (GB), soman (GD), and tabun (GA) are extreme lethal organophosphates. The reactive phosphate group in these molecules can interact with the hydroxyl groups of the enzyme acetylcholinesterase (AChE). AChE hydrolyzes the neurotransmitter acetylcholine (ACh) in postsynaptic membranes and neuromuscular junctions. Blocking the decomposition of acetylcholine creates a neurological imbalance, leading to dysfunction of the central nerve system, organ destruction, and ultimately death in a few seconds.3,4 These colorless, odorless, and tasteless volatile liquid or gaseous OPs possess a high risk of being used as a tool of mass destruction in war or through terrorist attacks.5–7 Due to the massive threats posed by these nerve agents in our environment, and for the issue of global security, there is an utmost need to develop a reliable, facile, and rapid method for distinctly detecting CWAs. An associated compound, diethyl chlorophosphate (DCP), is broadly used to mimic sarin for scientific research purposes. DCP has similar reactivity but has lower toxicity when compared to actual nerve agents.8To date, a variety of traditional analytical methods and devices have been developed to detect nerve agent mimics. These include mass spectrometry,9,10 electrical sensors,11–13 enzyme-based biosensors,14 enzymatic assays,15,16 photoacoustics,17 ion mobility spectroscopy,18 lanthanide luminescence,19–21 photonic crystals,22,23 optical-fiber arrays,24 and nanomaterials (nanotubes or nanowires).25,26 However, these analytical methods require expensive instruments or complicated pre-treatment and suffer from low specificity, inadequate selectivity, reduced sensitivity, non-portability, and difficulties in real-time monitoring. To overcome these drawbacks, organic fluorescent sensors are becoming important for the optical detection of DCP.27,28 Fluorescent sensors are termed as a chemodosimeter when the interactions between the host and the guest (analyte) are based on irreversible chemical reactions. They are preferred over chemosensors for their high selectivity and sensitivity and they show distinct ratiometric fluorescent responses in presence of DCP.29–32
The general design strategy for sensing is the nucleophilic attack by the chemodosimeter molecule (bearing –NH2/–OH functional groups) to the electrophilic phosphorous center of DCP, to form a phosphate ester or phosphamide compounds, then suppressing the photo induced electron transfer process and affording fluorescence turn-on signals. It exactly mimics the reaction of AChE with nerve agents. The resultant phosphate ester of the probe molecule could then undergo intramolecular transformations to generate detectable species. In addition, most of the fluorescence chemodosimeter probes have been developed based on phosphorylation, phosphamide formation or intramolecular cyclization reactions. It has also been noted that these well-known chemodosimeter probes follow the ICT, PET or FRET mechanism. In addition, the ESIPT based fluorescence chemodosimeters that detect organophosphorus compounds like DCP are very rare. Therefore, designing both ESIPT and ICT based probes for DCP sensing is a great challenge for us in modern research.
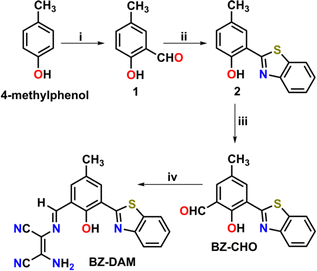
Taking inspiration from this above phenomenon and considering its environmental impact, we have synthesized a facile “ESIPT assisted ICT” based fluorogenic chemodosimeter probe, derived from a simple Schiff base from the reaction between hydroxybenzothiazole aldehyde and diaminomaleonitrile, for discriminative sensing of DCP in an aqueous acetonitrile medium. In this BZ-DAM probe, we observed both the ESIPT and ICT mechanisms which bring about the fluorescence. The most interesting part of this probe is that it is beyond common general limitations (i.e., phosphorylation and phosphamide formation). The whole pathway is uncommon in fluorescence sensing by the guest DCP. All probes were characterized using 1H-NMR, 13C-NMR, electrospray ionization mass spectrometry (ESI-MS) Scheme 1.
Results and discussion
Steady-state absorption and fluorescence spectra of a BZ-DAM (20 μM) (ACN/H2O, 1![[thin space (1/6-em)]](https://www.rsc.org/images/entities/char_2009.gif) :
:![[thin space (1/6-em)]](https://www.rsc.org/images/entities/char_2009.gif) 1 v/v) derivative were carefully examined in the presence and absence of DCP. The absorption spectrum for BZ-DAM shows strong absorption bands at ∼311 nm and ∼400 nm. However, the addition of DCP does not alter the band positions or structure of the ligand, even at high concentrations (Fig. 1a). Similarly, the fluorescence emission spectroscopic analyses of BZ-DAM in presence of DCP at various concentrations were carried out and are displayed in Fig. 1b. Initially, a red fluorescence is displayed with broad emission bands at ∼540 nm and at ∼600 nm, upon excitation at 365 nm. Upon gradual addition of DCP (up to 1 mM), the intensity of the emission band at 540 nm gradually increased, with the fluorescence of the solution, changing from red to yellowish-green (Fig. 1b, inset).
1 v/v) derivative were carefully examined in the presence and absence of DCP. The absorption spectrum for BZ-DAM shows strong absorption bands at ∼311 nm and ∼400 nm. However, the addition of DCP does not alter the band positions or structure of the ligand, even at high concentrations (Fig. 1a). Similarly, the fluorescence emission spectroscopic analyses of BZ-DAM in presence of DCP at various concentrations were carried out and are displayed in Fig. 1b. Initially, a red fluorescence is displayed with broad emission bands at ∼540 nm and at ∼600 nm, upon excitation at 365 nm. Upon gradual addition of DCP (up to 1 mM), the intensity of the emission band at 540 nm gradually increased, with the fluorescence of the solution, changing from red to yellowish-green (Fig. 1b, inset).
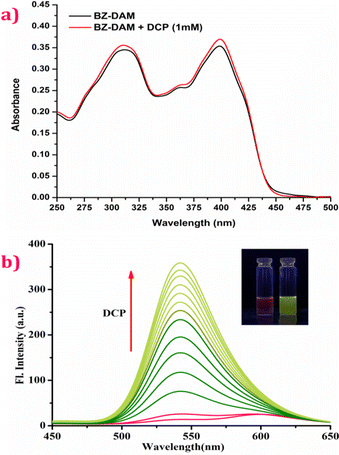 | ||
Fig. 1 (a) UV-Vis absorption spectra and (b) fluorescence emission spectra (λex = 365 nm) of BZ-DAM (20 μM) in the presence and absence of DCP in CH3CN–H2O (1![[thin space (1/6-em)]](https://www.rsc.org/images/entities/char_2009.gif) : :![[thin space (1/6-em)]](https://www.rsc.org/images/entities/char_2009.gif) 1 v/v) solution at 25 °C. 1 v/v) solution at 25 °C. | ||
DCP contains a highly reactive chlorophosphate group, which can react with the hydroxyl group to form an organophosphate. Herein, we have designed a novel chemodosimeter BZ-DAM for DCP by virtue of this reaction mechanism, in which the benzothiazole serves as a fluorophore and the phenol and imine groups serve as a recognition unit for DCP.33 We anticipate that the phenol group in BZ-DAM is first phosphoesterified by DCP, which leads to a significant fluorescence change and thereby assists the hydrolysis of the aldemine of BZ-DAM via a six-membered intermediate ring formation (ESI,† Fig. S15). The total time expenditure for this hydrolysis process (deimination of the DAM unit) is approximately 28 minutes (ESI,† Fig. S16) and also the concentration of the guest (DCP) at the saturation end point is 40 μM (ESI,† Fig. S17).
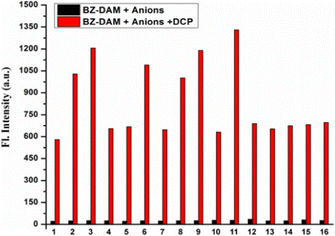
Fig. 2a displays a plot of the fluorescence intensity of the probe against various concentrations of DCP ranging from 0 to 40 μM. From the linear fit of the titration data, the detection limit of BZ-DAM for DCP was calculated to be 0.43 μM (ESI,† Fig. S18). The response rate of the chemodosimeter is also an important factor for determining the easy usability of the probe. From the kinetic data for the reactions of BZ-DAM (10.0 mM) with DCP (4 eq.), over a period of 10 min, the pseudo-first-order rate constant was calculated to be 0.1 min−1 (Fig. 2b). The fluorescence response of BZ-DAM with other analytes like anions and neutral molecules, were investigated to determine its selectivity for DCP. BZ-DAM did not display any changes in the fluorescence spectra in presence of other analytes such as S2−, SO3−, SO42−, HSO3−, F−, Cl−, I−, Br−, NO2−, NO3−, N3−, N2H4, H2O2, HPO42−, H2PO42−, OCl−. Upon subsequent addition of DCP to the above solutions of the analytes, a noticeable change was observed in the fluorescence intensity of BZ-DAM (Fig. 3). Our results show that BZ-DAM is highly selective towards DCP. A comparison of the fluorescent probe (BZ-DAM) with a few previously reported DCP-detecting probes is shown in Table S1 (ESI†) to validate the effectiveness of the probe.
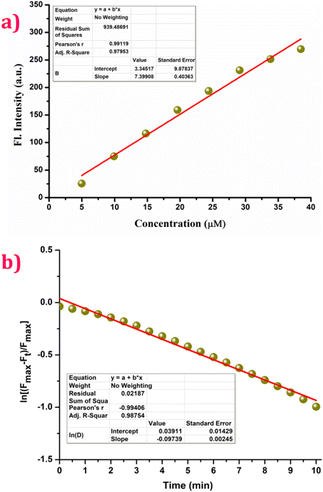 | ||
| Fig. 2 (a) Plot of fluorescence intensity at 540 nm vs. conc. λex = 365 nm; (b) kinetic profile of BZ-DAM (20 μM) in the presence of 4 eq. of DCP for determining the pseudo-first-order rate constant. | ||
UV-Vis and fluorescence study of BZ-DAM
Steady-state absorption and fluorescence spectra of BZ-DAM were carefully examined using various solvents with different polarities in the presence and absence of triethylamine (ESI,† Fig. S6 and S7). The absorption spectrum shows a strong absorption band at ∼400 nm in all solvents. In the case of DCM and DMSO an additional small hump at ∼475 nm and ∼550 nm was observed, respectively. Because the ligand has a phenolic OH, flanked between the two electronegative nitrogen atoms, the possible generation of an anionic species may take place. To verify this, Et3N (2 equiv.) was added to the BZ-DAM solution. Except for the 1,4-dioxane medium, a red shifted band at ∼500–550 nm was observed in all solvents, indicating the formation of an anionic species in presence of the base. The fluorescence spectra of BZ-DAM show much more complex behavior in solvents of varying polarities (ESI,† Fig. S7). In halogenated solvents like dichloromethane (DCM) and 1,2-dichloroethane (DCE), the ligand has three bands at 450 nm, 540 nm and 600 nm. Addition of Et3N results in a decrease in the emission band at 600 nm, followed by an increase in the emission band at 540 nm. The situation is similar for ethanol, which is a polar protic solvent. For polar aprotic solvents like acetonitrile (ACN) and dimethylsulfoxide (DMSO) initially the ligand has two bands at 450 nm and 600 nm. Addition of Et3N results in an increase in the emission intensity at 600 nm for both solvents. However, a new band at 540 nm arises in DMSO. We have also observed a change in fluorescence emission spectra of BZ-DAM in presence of 4 equiv. of triethylamine during the successive addition of water in an acetonitrile medium (ESI,† Fig. S8). The anionic band at 625 nm is gradually decreased and is shifted towards the left (blue shifted) at 600 nm. However, no new band at 540 nm is formed, thereby indicating that a simple anionic species is not responsible for the green emission upon addition of DCP.Influence of pH
At different pH ranges (pH 2.0–12.0), the emission intensity of BZ-DAM in the presence and in the absence of DCP was investigated (Fig. 4). Between pH 4.0 to 12.0, the ligand shows strong fluorescence in the 600 nm region, as indicated by the low intensity ratio. On addition of DCP, hydrolysis of the DAM unit takes place and a strong green ratiometric response was observed, as indicated by a 6 times increase in the intensity ratio. This trend extends well into the biological pH range, and encouraged us to use the ligand for imaging DCP concentrations in live cells. However, this trend breaks at pH 2.0, indicating acid hydrolysis of the DAM unit can take place, giving rise to strong green fluorescence, even in absence of DCP.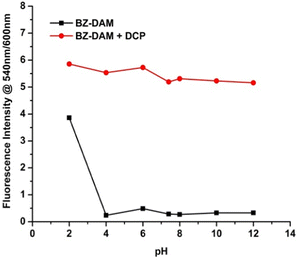 | ||
| Fig. 4 Changes in the intensity ratio of fluorescence in the presence and absence of DCP at different pH values. | ||
TCSPC experiments
The results of the time-correlated single photon counting (TCSPC) experiments of BZ-DAM in the presence and absence of DCP are shown in Fig. 5. An average lifetime of 0.33 ns was observed at 540 nm. However, an average lifetime of 0.17 ns was observed at 600 nm and no lifetime was observed at 625 nm, indicating the predominant effect of fast non-radiative decay channels. The addition of DCP changes the decay profile at 540 nm from tri- to bi-exponential. Correspondingly, the average lifetime was also increased to 3.46 ns. Similarly, a radiative decay was also observed at 600 and 625 nm with the corresponding lifetimes of 1.4 ns and 0.83 ns respectively.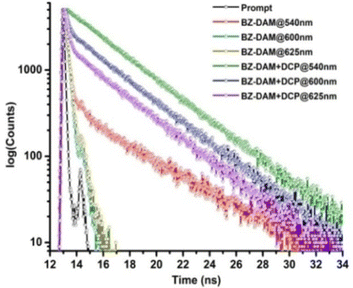 | ||
Fig. 5 TCSPC of BZ-DAM in the absence and presence of DCP in CH3CN–H2O (1![[thin space (1/6-em)]](https://www.rsc.org/images/entities/char_2009.gif) : :![[thin space (1/6-em)]](https://www.rsc.org/images/entities/char_2009.gif) 1 v/v) at 404 nm excitation. 1 v/v) at 404 nm excitation. | ||
The average lifetime and the decay profile in the presence and absence of acid for DCP are summarized in Table S2 (ESI†).
NMR titration and probable sensing mechanism
A 1H NMR titration experiment was performed in DMSO-d6 with a trace amount of D2O to understand the hypsochromic shift in the fluorescence spectrum of BZ-DAM with DCP (from ∼600 nm to ∼530 nm). The ligand shows a phenolic OH signal (a) at ∼12.73 ppm, which vanishes upon the addition of 0.5 equiv. of DCP with a trace amount of D2O. Similarly, the signal for the amine (NH2) proton (g) also vanishes, indicating its interaction with the phosphorus center of the DCP. Upon increasing the concentration of DCP, an upfield shift of the proton signals (e) (from 8.2 ppm to 8.1 ppm), and (h) (from 7.9 ppm to 7.8 ppm) was observed (Fig. 6). The methyl signal (l) is also upfield shifted from ∼2.4 ppm to ∼2.3 ppm (ESI,† Table S3). Again, with the addition of more than 1 equiv. of DCP, the 1H NMR spectrum shows the generation of an aldehyde proton signal resulting from hydrolysis of the imine bond in BZ-DAM. As the probe acts as a chemodosimeter both the imine signal of BZ-DAM (c) at ∼8.6 ppm, and the aldehyde signal (b) (produced by hydrolysis) at ∼10.3 ppm are seen in the NMR spectra. However, the intensity ratio of the b/c signal increases from 0 to 0.3 during the course of the NMR titration. Therefore, hydrolysis of the imine bond results in a hypsochromic shift of the fluorescence spectrum of BZ-DAM. The formation of the hydrolyzed compound of BZ-DAM (i.e. BZ-CHO) generated by the reaction with DCP is also demonstrated from its mass spectrum which shows m/z [M + H]+ = 270.0590, in addition to the two cyclized adducts that appear at m/z 371.0521 and 192.9646 (ESI†, Fig. S10).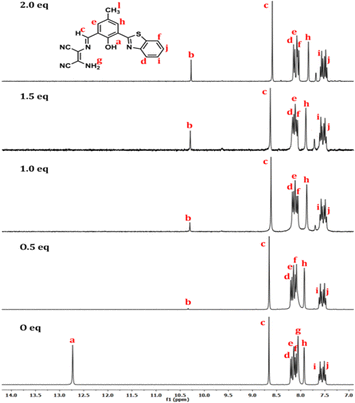 | ||
| Fig. 6 1H NMR (300 MHz) titration of BZ-DAM in DMSO-d6 showing the shift of aromatic protons upon addition of an increasing amount of DCP (0, 0.5, 1, 2 equivalent, respectively). | ||
Theoretical study
Theoretical calculations using density functional theory (DFT), as implemented in the Gaussian 09 software,34 were carried out to understand the hypsochromic shift in the fluorescence of BZ-DAM. Becke's three-parameter hybrid functional with an LYP correlation functional (B3LYP), along with a 6-31G (d,p) basis set in an acetonitrile medium using a conductor-like polarizable continuum model (C-PCM), was used for geometry optimization and TDDFT calculations. The geometry optimized ground state structures (enol form) for both compounds along with the Mulliken charges on the atoms of interest are shown in Fig. S9 (ESI†). The hydrogen atom of the phenolic –OH is flanked between the electronegative oxygen and the nitrogen atom of the benzothiazole unit. This nitrogen is more electronegative than the imine nitrogen (in BZ-DAM) and the aldehyde oxygen (in BZ-CHO). Thus, there is a possibility of a selective ESIPT assisted ICT process occurring between the phenolic –OH, the benzothiazole and the diaminomaleonitrile unit.35 Initially, both the ESIPT and ICT mechanisms are operative in BZ-DAM. Therefore, we can see two fluorescence bands: one at ∼540 nm at another at ∼600 nm. The red-shifted band (∼600 nm) can be ascribed to the ESIPT-assisted ICT which can facilitate the delocalization of electrons on the DAM group (ESI,† Fig. S19). Vertical excitation values corresponding to the first excited states are summarized in Table S4 (ESI†). The percentage that a given transition contributes to the excited state is given by 2x2, where x represents the normalized coefficient of the transition. The ground state of BZ-DAM (GS-enol form) was comprised of three transitions, having a major contribution (77%) from the HOMO → LUMO transition with an oscillator strength of 0.48.The corresponding wavelength is ∼414 nm which is close to the experimental wavelength of ∼400 nm (Fig. 1a). The first excited state of BZ-DAM (EX-enol form) is again comprised of three transitions, having a major contribution (92%) from the HOMO → LUMO transition with an oscillator strength of 0.87. The corresponding theoretical wavelength is ∼497 nm while the experimental wavelength is found to be ∼450 nm (Fig. 1b). In the excited state, proton transfer takes place between the phenolic –OH and the nitrogen of the benzothiazole unit as shown in Fig. 7. The first excited state of BZ-DAM (EX-Keto form) consists of a purely HOMO → LUMO transition with 98% contribution and has an oscillator strength of 0.75. The corresponding theoretical wavelength is ∼613 nm which is in good agreement with the experimental value of ∼595 nm, giving rise to the red fluorescence of the ligand. Upon addition of DCP, BZ-DAM is decomposed to form BZ-CHO, as seen from the NMR (Fig. 6) and mass spectroscopy study (ESI†). A detailed theoretical calculation was also performed for BZ-CHO to understand the origin of the band at ∼540 nm. Theoretical calculations revealed that the excited state keto-form of BZ-CHO is responsible for the hypsochromic shift in the fluorescence spectrum. The theoretical value of ∼513 nm is in close agreement with the experimental value. Details of the transition are summarized in Fig. 7 and in Table S4 (ESI†).
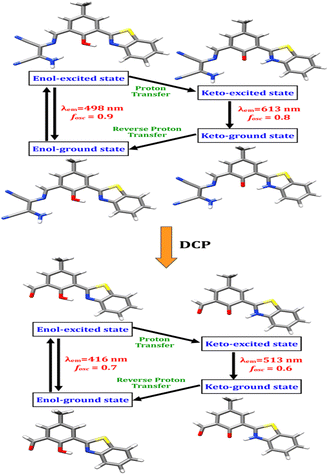 | ||
| Fig. 7 Schematic representation of the species involved in the ESIPT process of BZ-DAM in the presence and absence of DCP. | ||
Polycaprolactone (PCL) nanofiber composite
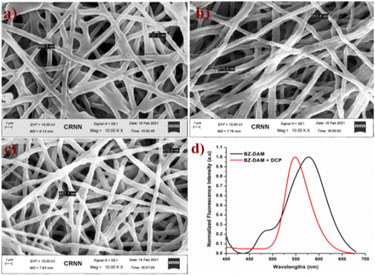
Scanning electron microscope (SEM) images of BZ-DAM/PCL nanofibers before and after exposure to DCP are shown in Fig. 8. The BZ-DAM/PCL fiber has a smooth wire-like, regular arrangement with an average diameter of 797 nm (Fig. 8a). After 30 minutes of exposure to CH3CN:H2O, the uniform architecture became irregular and the surface of the fiber became rough (Fig. 8b). In the meantime, the diameter of the fiber also decreased to 564 nm. This was performed to see the effect of solvent on the PCL film, before treating it with DCP.The same experiment was performed in the presence of DCP (40 μM in CH3CN:H2O). The film was kept in the solution for 30 minutes and it was observed that the surface of the film became rough with a spherical texture. Partial deformation of the film surface suggested that BZ-DAM reacted with DCP to form BZ-CHO and the diameter decreased further to 487 nm (Fig. 8c). The polymeric fiber containing BZ-DAM displayed the same fluorescence change as in solution, upon exposure to the aqueous solution of DCP. The fluorescence spectra of the embedded nanofiber in the presence of DCP showed a similar response as shown in Fig. 8d.
Intracellular live-cell imaging study
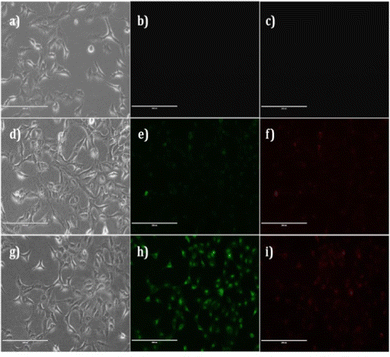
Imaging experiments were conducted for fluorescent visualization of intracellular DCP in a live A549 cell line. In vitro imaging of DCP in live cells was executed according to our reported methods.36 Briefly, cells were incubated in the presence of 20 μM of BZ-DAM for 2 h at 37 °C and 5% CO2 in the culture medium. After washing with PBS (× 3), to remove the remaining probe, the cells were incubated with 50 μM of DCP for another 30 minutes. The cells were then washed again with PBS (× 3), and fluorescent images of the cells were collected. No fluorescence was observed in cells (control cells; Fig. 9b and c) that were not exposed to either ligand or DCP. Upon incubation with ligand BZ-DAM, slight fluorescence in the green and the red channels were observed (Fig. 9e and f). However after incubation with DCP, a significant enhancement of fluorescence in the green channel was observed. This observation is in accordance with the solution phase behavior of the ligand. Thus, it can be seen that the probe is cell permeable and can detect DCP in the cellular system. The ligand itself is highly stable in the cellular system; Fig. S12 (ESI†) showed that BZ-DAM is a highly efficient biomarker for imaging DCP, without any significant cytotoxic effect.Practical application by dip-stick method
Whatman filter paper and TLC plates, both being low-cost, abundantly available, and disposable substrates, were used to test the practical applicability of sensing by a useful dip-stick method. In this method, BZ-DAM solution was absorbed onto a strip of Whatman filter paper and a TLC plate and dried. The strip was kept inside wall of a glass chamber so that it remained above the base line. Under UV light, the BZ-DAM coated filter paper strip showed red fluorescence. Interestingly, when a few drops of DCP were added into the glass chamber, an emission color change was observed on the strip from red to yellow. This type of dipstick method is very helpful to gain instant qualitative information without the requirement of time consuming instrumental analysis (Fig. 10).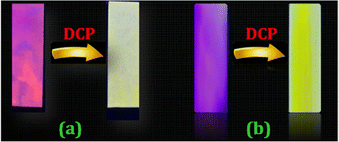 | ||
| Fig. 10 Photograph of the fluorescence change of BZ-DAM upon exposure to DCP (a) filter paper (b) TLC plate. | ||
Conclusions
In conclusion, we have designed and synthesized a simple benzothiazole based fluorescent chemodosimeter probe (BZ-DAM) used for detection of the nerve agent mimic DCP via a hydrolysis reaction. This chemodosimeter probe exhibits a fluorescence change and an enhancement response at 540 nm towards DCP with high selectivity, high sensitivity including biological pH range stability (pH 4.0–12.0) and a detection limit of 0.43 μM. Moreover, the reaction-based sensing phenomenon is also supported by 1H NMR titrations and DFT calculations. We have also demonstrated that the probe is applicable for cell imaging with exposure of DCP in living cellular systems. Furthermore, a BZ-DAM loaded polymeric thin film and dipstick method with different test strips proved to be practically low-cost solid platforms, and reliable and useful tools for the selective detection of DCP.Experimental
Materials and instruments
4-Methylphenol, 2-aminothiophenol, sodium hydroxide, acetic acid, ethanol, DMSO, hexamine, diaminomaleonitrile, HCl were purchased from the chemical suppliers and diethyl chlorophosphate, anions and analytes were purchased from Sigma-Aldrich. The 1H NMR and 13C NMR spectra were recorded on a Bruker 300, 400 and 500 MHz NMR spectrometer. Tetramethylsilane (TMS) was used as the internal standard. Multiplicity was indicated as follows: s (singlet), d (doublet), t (triplet), q (quartet), m (multiplet), dd (doublet of doublet), bs (broad singlet). Coupling constants were reported in Hertz (Hz). High resolution mass spectra were obtained on a Xevo-G2-S Q-TOF of Waters spectrometer. For thin layer chromatography (TLC), Merck pre-coated TLC plates (Merck 60 F254) were used, and compounds were visualized with a UV light at 254 nm. UV-Vis absorption spectra were measured on a Hitachi UH-5300 spectrometer. Fluorescence spectra were recorded on a Hitachi F-7100 fluorometer.Synthetic procedure
Author contributions
Manas Kumar Das: design and synthesis of the compounds, manuscript preparation, analysis of the spectral data and wrote the supporting information. Tanushree Mishra: data acquisition, NMR titration and proposed the probable mechanism. Subhajit Guria: DFT studies and helped to write the manuscript. Debojyoti Das: TCSPC experiments and formal analysis. Juheli Sadhukhan: formal analysis, data curation, and helped to write the supporting information. Sushmita Sarker: cell imaging study. Koushik Dutta: preparation of the PCL thin film. Dipankar Chakraborty: supervised the visualization, formal analysis, provided the resources. Arghya Adhikary: supervised the MTT assay, the cell imaging study, and provided resources. Susanta Sekhar Adhikari: the conceptualization, supervision, project administration, funding acquisition, and writing – reviewing and editing.Conflicts of interest
There are no conflicts to declare.Acknowledgements
M. K. D. is grateful to the DSKPDF for financial support (sanction no.: F.4-2/2006(BSR)/CH/17-18/0063). S. G. acknowledges the CSIR for financial support (sanction no.: 09/028(0955)/2015-EMR-I). S. A. thankfully acknowledges the SERB-DST, New Delhi, India (project no. EMR/2017/002140), for financial support, and T. M. also acknowledges the SERB-DST, New Delhi, India for a JRF fellowship. The authors are also grateful to the central facility of the University of Calcutta at CRNN for the SEM experiments.Notes and references
- K. Kim, O. G. Tsay, D. A. Atwood and D. G. Churchill, Chem. Rev., 2011, 111, 5345–5403 CrossRef CAS.
- M. S. J. Khan, Y. W. Wang, M. O. Senge and Y. Peng, J. Hazard. Mater., 2018, 342, 10–19 CrossRef CAS.
- N. B. Munro, K. R. Ambrose and A. P. Watson, Environ. Health Perspect., 1994, 102, 18–38 CrossRef CAS.
- S. Costanzi, J. H. Machado and M. Mitchell, ACS Chem. Neurosci., 2018, 9, 873–885 CrossRef CAS PubMed.
- K. Ganesan, S. Raza and R. Vijayaraghavan, J. Pharm. BioAllied Sci., 2010, 2, 166 CrossRef CAS PubMed.
- L. K. Sydnes, Nature, 2020, 583, 28–29 CrossRef CAS.
- Y. C. Yang, Acc. Chem. Res., 1998, 32, 109–115 CrossRef CAS.
- J. Yao, Y. Fu, W. Xu, T. Fan, Y. Gao, Q. He, D. Zhu, H. Cao and J. Cheng, Anal. Chem., 2016, 88, 2497–2501 CrossRef CAS PubMed.
- F. Zydel, J. R. Smith, V. S. Pagnotti, R. J. Lawrence, C. N. Mcewen and B. R. Capacio, Drug Test. Anal., 2012, 4, 308–311 CrossRef CAS PubMed.
- Y. Bao, Q. Liu, J. Chen, Y. Lin, B. Wu and J. Xie, J. Chromatogr. A, 2012, 1229, 164–171 CrossRef CAS PubMed.
- V. V. Singh, Electroanalysis, 2016, 28, 920–935 CrossRef CAS.
- P. Kubáň, A. Seiman, N. Makarõtševa, M. Vaher and M. Kaljurand, J. Chromatogr. A, 2011, 1218, 2618–2625 CrossRef PubMed.
- M. H. Hammond, K. J. Johnson, S. L. Rose-Pehrsson, J. Ziegler, H. Walker, K. Caudy, D. Gary and D. Tillett, Sens. Actuators, B, 2006, 116, 135–144 CrossRef CAS.
- J. Orbulescu, C. A. Constantine, V. K. Rastogi, S. S. Shah, J. J. DeFrank and R. M. Leblanc, Anal. Chem., 2006, 78, 7016–7021 CrossRef CAS PubMed.
- D. Yu, J. Volponi, S. Chhabra, C. J. Brinker, A. Mulchandani and A. K. Singh, Biosens. Bioelectron., 2005, 20, 1433–1437 CrossRef CAS PubMed.
- S. Jin, Z. Xu, J. Chen, X. Liang, Y. Wu and X. Qian, Anal. Chim. Acta, 2004, 1, 117–123 CrossRef.
- K. P. Gurton, M. Felton and R. Tober, Opt. Lett., 2012, 37, 3474–3476 CrossRef CAS.
- W. E. Steiner, S. J. Klopsch, W. A. English, B. H. Glowers and H. H. Hill, Anal. Chem., 2005, 77, 4792–4799 CrossRef CAS.
- J. R. Schwierking, L. W. Menzel and E. R. Menzel, Sci. World J., 2004, 4, 948–955 CrossRef CAS.
- A. L. Jenkins, O. M. Uy and G. M. Murray, Anal. Chem., 1998, 71, 373–378 CrossRef.
- Z. Abbas, U. Yadav, R. J. Butcher and A. K. Patra, J. Mater. Chem. C, 2021, 9, 10037–10051 RSC.
- J. Xu, C. Yan, C. Liu, C. Zhou, X. Hu and F. Qi, IOP Conf. Ser.: Mater. Sci. Eng., 2017, 167, 012024 Search PubMed.
- J. P. Walker, K. W. Kimble and S. A. Asher, Anal. Bioanal. Chem., 2007, 389, 2115–2124 CrossRef CAS PubMed.
- S. R. Cordero, H. Mukamal, A. Low, E. P. Locke and R. A. Lieberman, Chem. Biol. Sensors Ind. Environ. Monit. II, 2006, 6378, 63780U Search PubMed.
- G. Liu and Y. Lin, Anal. Chem., 2006, 78, 835–843 CrossRef CAS.
- F. Wang, H. Gu and T. M. Swager, J. Am. Chem. Soc., 2008, 130, 5392–5393 CrossRef CAS PubMed.
- L. Chen, D. Wu and J. Yoon, ACS Sens., 2017, 3, 27–43 CrossRef.
- M. Sathiyaraj and V. Thiagarajan, RSC Adv., 2020, 10, 25848–25855 RSC.
- S. Goswami, S. Das and K. Aich, RSC Adv., 2015, 5, 28996–29001 RSC.
- X. Guo, C. X. Liu, Y. Lu, Y. W. Wang and Y. Peng, Molecules, 2022, 27, 489 CrossRef CAS PubMed.
- R. Gotor, A. M. Costero, P. Gaviña and S. Gil, Dyes Pigm., 2014, 108, 76–83 CrossRef CAS.
- S. S. Ali, A. Gangopadhyay, A. K. Pramanik, U. N. Guria, S. K. Samanta and A. K. Mahapatra, Dyes Pigm., 2019, 170, 107585 CrossRef CAS.
- (a) H. C. Zhang, D. H. Tian, Y. L. Zheng, F. Dai and B. Zhou, Spectrochim. Acta, Part A, 2021, 248, 119264 CrossRef CAS; (b) L. Tang, L. Zhou, X. Yan, K. Zhong, X. Gao, X. Liu and J. Li, Dyes Pigm., 2020, 182, 108644 CrossRef CAS; (c) Z. Chen, X. Zhong, W. Qu, T. Shi, H. Liu, H. He, X. Zhang and S. Wang, Tetrahedron Lett., 2017, 58, 2596–2601 CrossRef CAS.
- M. J. Frisch, G. W. Trucks, H. B. Schlegel, G. E. Scuseria, M. A. Robb and J. R. Cheeseman, et al., Gaussian 09, Revis. A.02, Gaussian, Inc.; Wallingford CT, 2009 Search PubMed.
- A. Bhattacharyya, S. K. Mandal and N. Guchhait, J. Phys. Chem. A, 2019, 123, 10246–10253 CrossRef CAS PubMed.
- S. Guria, A. Ghosh, P. Upadhyay, M. K. Das, T. Mishra, A. Adhikary and S. Adhikari, ACS Appl. Bio Mater., 2020, 3, 3099–3113 CrossRef CAS PubMed.
Footnote |
| † Electronic supplementary information (ESI) available. See DOI: https://doi.org/10.1039/d2nj04260f |
| This journal is © The Royal Society of Chemistry and the Centre National de la Recherche Scientifique 2023 |

