Spin-crossover in the Fe(4X-pyridine)2[Fe(CN)5NO] series with X = Cl, Br, and I. Role of the distortion for the iron atom coordination environment†
Y.
Avila
 ab,
R.
Mojica
 a,
M. C.
Vázquez
 a,
L.
Sánchez
 a,
M.
González
 c,
J.
Rodríguez-Hernández
 *d and
E.
Reguera
 *a
*a
aInstituto Politécnico Nacional, Centro de Investigación en Ciencia Aplicada y Tecnología Avanzada, Unidad Legaria, Ciudad, México, Mexico. E-mail: edilso.reguera@gmail.com
bDepartamento de Polímeros, Instituto de Investigaciones en Materiales, Universidad Nacional Autónoma de México, Mexico
cCONACyT-Instituto Politécnico Nacional, Centro de Investigación en Ciencia Aplicada y Tecnología Avanzada, Unidad Legaria, Ciudad México, Mexico
dCentro de Investigación en Química Aplicada, Saltillo, Coahuila, Mexico. E-mail: joelis.rodriguez@ciqa.edu.mx
First published on 21st November 2022
Abstract
This contribution reports the thermally induced spin crossover (SCO) in the titled series of hybrid solids from the magnetic (SQUID), DSC, IR, Raman, and Mössbauer data. The onset temperature for the high-to-low spin transition follows the order Cl (217 K) > Br (210 K) > I (155 K). This order is inverse to the one known for the halogen-bond propensity, Cl < Br < I. Their crystal structure for the high-spin (HS) phase was solved and refined from the powder XRD data, complemented with the IR spectra and TG curves. For the low-spin (LS) phase, the crystal structure was obtained by periodic DFT calculations, relaxing the room temperature (HS) structure. At room temperature, the CN–ON distance for these dangling ligands in the interlayer region follows the order Cl (5.03 Å) < Br (5.08 Å) < I (5.70 Å). The repulsive electrostatic interaction between these charge centers is responsible for a certain kinetic effect observed in the recorded magnetic data. This interaction was also detected in the recorded Mössbauer spectra. For the 3X-pyridine analogs, the thermally induced spin-crossover was observed only for X = F. This study discusses the nature of that difference in the behavior between the two subseries from three probes for the stabilization energy (SE) of the LS phase. Notably, (1) the effect of the substituent position on the deformation of the iron atom coordination environment; (2) the Mössbauer quadrupole splitting (ΔQS) value; and (3) the onset of the a1g → eg(eg) band absorption in the UV-vis-NIR spectrum. For a non-distorted octahedron, the value of SE coincides with 10Dq (the energy splitting between eg and t2g orbitals for the iron atom). This study is part of an effort to rationalize those structural features affecting the SCO in 2D ferrous nitroprussides.
1. Introduction
Spin-crossover (SCO) is observed in 3d4–3d7 ions with octahedral coordination. It can be induced by a temperature or pressure change, under applied electric and magnetic fields, including light incidence.1–5 That transition can be modified or tuned by incorporating a guest species within the material framework.6,7 SCO has received considerable attention in the last few decades for two reasons: (1) it modifies the physical properties of a solid, which opens up the possibility of its applications as a functional material;8–16 (2) it involves basic concepts within the coordination chemistry of transition metals, and the effect illustrates how relevant each of them could be. For iron(2+), the SCO involves four electrons, and the observed changes in the physical properties are the most pronounced within the four metal ions where the effect is observed because of this Fe(2+)-containing solids with SCO have attracted attention within the materials with this behavior.The high spin (HS) to low spin (LS) transition is observed when the energy splitting (10Dq) between the iron atom eg and t2g orbitals is large enough to favor high stability for the LS electronic configuration (eg0t2g6). A stronger metal–ligand interaction, related to a σ → Fe charge donation, and probed by a larger 10Dq value, results in the appearance of a LS phase at a higher temperature. The role of that bond (σ) is appreciated, for instance, in the Fe(L)2[M(CN)4] series with M = Ni, Pd, Pt, where the onset temperature for the HS → LS follows the order of the electron density found at the CN5σ orbital.17 In layered coordination polymers, for instance, the ability of the axial organic ligand (L) to donate electron density to the iron atom contributes to determining the value for the stabilization energy (SE) of the LS phase. A factor to be considered for the occurrence of SCO in a given material is the local symmetry of the coordination environment for the iron atom. When it is highly symmetric, enough considerable value for the 10Dq stabilizes the LS electronic configuration. For a trigonal distorted coordination geometry (D3d), the t2g energy levels split, and the energy separation (Δ) between the anti-bonding and non-bonding orbitals of the highest energy decreases. If this energy separation (Δ) is insufficient to stabilize the LS electronic configuration, the HS → LS transition is not observed (discussed below). This distorted coordination geometry could be considered as representative of the materials herein considered.
This contribution reports the thermally induced SCO in the Fe(4X-pyridine)2[Fe(CN)5NO] subseries of ferrous nitroprussides, with X = Cl, Br, and I, from the SQUID magnetic, DSC, IR, Raman, and Mössbauer data. In the following, 4X-pyridine will be labeled as 4XPy. For X = F, the hybrid solid was not formed. Unlike the 3XPy subseries (F, Cl, Br, and I), where the spin-crossover was only observed for X = F,18 the herein discussed results indicate that the SCO in ferrous nitroprussides is favorable when the substituent is found in the 4th position. In ferrous nitroprusside, the thermally induced SCO has been observed for pyridine19 and its 4-substituted derivatives as axial ligands,20–23 and rarely with 3-substituted derivatives.18 The nature of this behavior is herein discussed from the refined crystal structure for the two subseries, their d–d absorption band, and the corresponding Mössbauer spectra. This study represents an effort of a progressive approach to understanding those factors that determine the appearance of SCO behavior in a given Fe(2+)-containing solid.
2. Experimental
The subseries of materials herein considered were prepared by the precipitation method. Mohr salt, Fe(NH4)2(SO4)2(H2O)6 (0.5 mmol), is dissolved in 20 mL of deionized water; separately, a sodium nitroprusside salt, Na2[Fe(CN)5NO]·2H2O (0.5 mmol) is dissolved in 20 mL of deionized water. Both solutions were mixed in an ultrasonic bath for 30 minutes until the formation of a brownish precipitate, Fe[Fe(CN)5NO]·xH2O is achieved. After that, an excess of 4X-Pyridine (1.5 mmol) dissolved in 10 mL of deionized water is added to the suspension of ferrous nitroprusside. That mixture of reagents is sonicated for one hour for two days until observing the color change from brown to a gray color and then aged in the darkness for three days. The formed precipitate is separated from the mother liqueur by centrifugation and washed with deionized water several times to remove the accompanying species, and finally dried under darkness until reaching a constant weight. The obtained solid is left in the dark for drying in air until it has a constant weight. The resulting powder was analyzed in terms of its nature and purity from XRD, TG, IR, Raman, and Mössbauer data, and chemical analysis (Table S1, ESI†). This simple preparative route produces samples of pillared ferrous nitroprussides appropriate for studies on thermally induced spin crossover.18–24Elemental analysis for C, N, and O was carried out on a 2400 CHNS/O Series II system from PerkinElmer. The metal content in the solid was determined by ICP analysis using an ICP-OES Optima 8000 spectrometer from PerkinElmer. Raman spectra were recorded at 77 and 300 K in the 3500–50 cm−1 spectral range, with a 532 nm laser, at 1 mW power, with a DXR Raman microscope (from ThermoScientific Co.). IR spectra were run at 77 and 300 K using an ATR device coupled to a Spectrum One (from PerkinElmer) spectrophotometer. Powder XRD patterns used for the structural study were recorded at 300 K, using a D8-Advance diffractometer (from Bruker), operated in the Bragg-Brentano geometry with CuKα radiation. The recorded patterns were indexed with the DicVol algorithm.25 The structural model to be refined was obtained using a global optimization process in the direct space (simulated annealing) implemented in the EXPO09 program from an initially proposed asymmetric cell.26 The Le Bail method was used for the space group assignment verification.27 Structural refinement was carried out by the Rietveld method implemented in the FullProf program.28 A third-order polynomial was used to model the pattern background. Additional details on the XRD data collection and processing are available in Table S2, ESI†. Peak profiles (pseudo-Voigt type) were calculated up to ten times the full width at half maximum (FWHM). For the series of solids herein considered, the refined structural information was deposited in the CCDC database, through CIF files: 2212702 (Cl), 2212701 (Br) and 2212703 (I).
The crystal structure for the LS phase was calculated, relaxing the refined structure for the HS phase, under the hypothesis that the unit cell symmetry is preserved. This calculation was performed in the periodic DFT scheme using the Vienna ab initio simulation package (VASP) code.29,30 Spin-polarized based computations were carried out in the projector augmented-wave method (PAW) of Blöchl.31,32 The Perdew–Burke–Ernzerhof (PBE) exchange–correlation functional, which is based on the general gradient approximation, was employed to perform the calculations.33 PBE has been reported as an excellent option to explore HS → LS energetic and structural transitions at reasonable computational cost when Hubbard U-parameter is incorporated.34 This is because its addition allows the treatment of a strong correlation between the d electrons on iron atoms. A plane-wave basis set was used with a kinetic cutoff energy of 600 eV, and the Brillouin zone sampling was restricted to the Γ-point. The van der Waals interactions were incorporated using the Grimme PBE-D2 approach.35,36
Zero field-cooling (ZFC) and field-cooling (FC) magnetic data were recorded with an MPMS-3 magnetometer (Quantum Design) in the 1.8–300 K temperature range with an applied magnetic field of 100 Oe, at different cooling/warming rates, of 0.25, 0.5, 2, 8, and 16 K min−1. The effective magnetic moment (μeff) was calculated according to μeff = 2.828 sqrt(χT).37 The experimental magnetic susceptibility (χ) values were previously corrected for the diamagnetic contribution according to the reported Pascal constant for the involved elements.37
57Fe Mössbauer spectra were recorded using a 57Co/Rh radiation source in a SeeCo spectrometer coupled to a Janis closed cycle He cryostat to maintain the sample under isothermal conditions in the 4.2–300 K temperature range. All the samples for the Mössbauer data recording were prepared under the condition of a thin absorber where the absorption line area (intensity) is directly proportional to the concentration of iron atoms in the corresponding structural site or valence state. The recorded spectra were fitted as a superposition of quadrupole splitting doublets using a fitting program available in the Mosswinn software package.38 The values for the isomer shift (δ, in mm s−1) are reported relative to sodium nitroprusside at room temperature (300 K).
3. Results and discussion
3.1. IR, and TG data of Fe(4X-pyridine)2[Fe(CN)5NO] series with X = Cl, Br, I
Fig. 1 shows the IR spectra for ferrous nitroprusside (3D phase), 4-iodopyridine, and the reaction product between the organic ligand and coordination polymer. The IR spectrum for the formed solid results from the superposition of the spectra for ferrous nitroprusside and the one corresponding to the organic molecule, except for the absence of ν(OH) and δ(HOH) absorption bands from water molecules at 3360 and 1617 cm−1, respectively. The absence of these bands suggests that the organic ligand replaces the water molecules coordinated to the iron atom, resulting in the formation of an anhydrous hybrid material. The ν(CN) band shifts from 2181 cm−1 in ferrous nitroprusside to 2173 cm−1 in the hybrid solid, which corresponds to a weakening of the equatorial CN–Fe bond, probing the organic molecule coordination of the iron atom. The frequency shift for the ν(NO) stretching is even larger, from 1940 to 1907 cm−1. This frequency shift reveals that the hybrid solid formation involves an increase in the π-back donation from the iron atom in the nitroprusside ion to the NO group. This frequency shifting results from rupturing the axial CN–Fe coordination bond to form a 2D ferrous nitroprusside. These events inform us that the organic ligand occupies the axial coordination sites for that iron atom. During the new solid formation, the IR spectrum for the organic ligand undergoes notable changes related to the charge donation to the iron atom via the pyridinic N atom and the molecule confinement in the interlayer region. The IR absorption bands for the molecule are mainly found in the 1600–500 cm−1 spectral region. In the reagent, the IR bands in that spectral region appear with pronounced broadening, accompanied by shoulders, probably related to the presence of intermolecular interactions. This spectral feature disappears when the molecule is found forming pillars (Fig. 1). The solids formed with the remaining pyridine derivatives follow the same regularity (see Fig. S1 and S2, ESI†).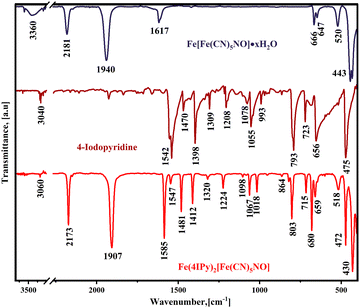 | ||
| Fig. 1 IR spectra for ferrous nitroprussides (cubic phase), 4-iodopyridine, and the solid formed by the precipitation reaction of sodium nitroprusside, ferrous ammonium sulfate, and this organic ligand. Similar IR spectra were obtained for the Cl and Br analogs (Fig. S1 and S2, ESI†). | ||
The formation process of a hybrid inorganic–organic 2D transition metal nitroprussides remains well documented for pyridine and its derivatives,18–21 pyrazine,22 and 4,4′-azopyridine,23 and 1-methyl-2-pyrrolidone.24 The hybrid solid is obtained using both a precipitation reaction, as mentioned above, or exfoliating the 3D phase under sonication in an aqueous suspension containing the organic ligand.24 This suggests that the formed hybrid solid corresponds to the thermodynamic product of that reaction and not to a kinetic product.
In solids formed by the assembling of blocks of inorganic and organic nature with different thermal stability, the TG curve and the related weight loss on heating have the potential to inform us about the inorganic:organic species ratio in the sample. The TG curves for the solids formed with 4X-pyridines herein considered are available from Fig. S3–S5, ESI.† These TG curves correspond to anhydrous solids, which agrees with the recorded IR spectra (Fig. S1 and S2, ESI†). The temperature region below 150 °C, where transition metal nitroprussides dehydrate,39 is free of weight loss (Fig. S3–S5, ESI†). The organic molecule evolves from that temperature (150 °C), with a maximum sample decomposition rate at 240 °C. From slightly above 250 °C, the weight loss curve shows a slow decay, probably related to the diffusion of the molecule fragments and decomposition products in the collapsed solid framework. The evolution of the organic molecule is followed by the rupture of the dangling ligands (NO and axial CN), and finally, the equatorial CN ligands also evolve. The thermal decomposition of metal nitroprussides is well-documented.39 From the combined information derived from the IR spectrum and TG curve, the proposed formula unit for this series of hybrid solids results in Fe(4XPy)2[Fe(CN)5NO]. This formula unit is in correspondence with the results obtained from the structural study (discussed below). The above-discussed evidence from IR and TG data, regarding the formula unit of this series of hybrid solids, was corroborated by chemical analysis (Table S1, ESI†).
3.2. Crystal structure
The series of hybrid solids herein considered crystallizes in a monoclinic unit cell in the P21 space group. Table 1 summarizes the corresponding unit cell parameters. Fig. 2 shows the experimental, fitted XRD patterns and their difference from the refined crystal structure in that space group for 4BrPy. Analog powder XRD patterns were obtained for the 4ClPy and 4IPy derivatives (Fig. S6 and S7, ESI†). The inset of Fig. (2) shows the morphology of the crystallites for the solid from 4BrPy. The platelet-like shape and the geometry of these crystallites are congruent with their layered structure and the monoclinic unit cell where it crystallizes. The unit cell volume follows the order I > Br >Cl, which is related to the halogen atom size. That unit cell volume is occupied by 2 molecules (Z = 2) for a volume per molecule of 521.38 (Cl), 525.70 (Br), and 539.05 (I) Å3. This value is similar to the one observed for the analog solid formed with 4-methylpyridine (4MPy).20 This difference in volume per molecule is related to a larger separation between adjacent layers for the halogen derivatives. This is congruent with the difference in the CN–ON distance between them, 4.40 and 5.08 Å, for 4MPy and 4BrPy, respectively (discussed below). That difference is similar to the one observed for the c parameter of the unit cell (7.38 in 4MPy vs 10.306 Å for X = Br).| X | Phase, temp. (K) | a , in Å | b , in Å | c , in Å | β, in ° | V, in Å3 | Volume contraction, % |
|---|---|---|---|---|---|---|---|
| The crystal structure for the LS phase was calculated using periodic DFT, relaxing the crystal structure for the room temperature phase. | |||||||
| Cl | HS, 300 | 7.3377(5) | 14.8736(7) | 10.2038(5) | 110.55(3) | 1042.8(2) | 1.47 |
| LS calculated | 7.0979 | 14.7517 | 10.1774 | 107.80 | 1014.6 | ||
| Br | HS, 300 | 7.3553(4) | 14.8367(6) | 10.3066(5) | 110.81(5) | 1051.4(2) | 1.75 |
| LS calculated | 7.3036 | 14.7619 | 10.2385 | 110.57 | 1033.5 | ||
| I | HS, 300 | 7.3881(7) | 14.7798(6) | 10.5338(7) | 110.40(5) | 1078.1(2) | 1.35 |
| LS calculated | 7.2880 | 14.5611 | 10.6696 | 110.06 | 1063.5 | ||
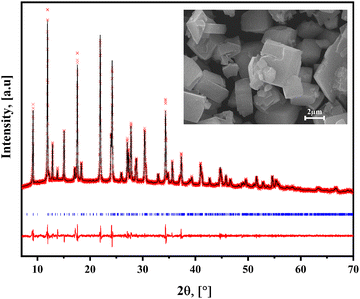 | ||
| Fig. 2 Experimental and fitted XRD powder patterns and their difference for Fe(4BrPy)2[Fe(CN)5NO]. Similar XRD patterns were obtained for the analogs of 4ClPy and 4IPy (Fig. S6 and S7, ESI†). Inset: Morphology for the crystallites of the obtained solid. | ||
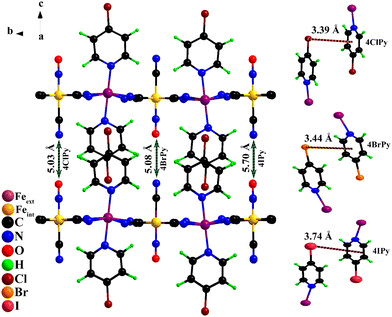
The crystal structure for the Fe(4XPy)2[Fe(CN)5NO] series was solved and refined in the monoclinic unit cell, P21 space group. Fig. 3 shows the atom packing according to the refined crystal structures. The refined atomic positions and thermal (isotropic) and occupation factors are available in Tables S2–S5, (ESI†), and the calculated interatomic distances and bond angles (Tables S6–S8, ESI†). The organic ligand is found occupying the axial coordination sites for the iron atom linked to the equatorial CNs of the nitroprusside ion, which is supported by information derived from IR and TG data. The axial CN ligand and the NO group are dangling ligands and occupy the interlayer region with a CN–ON distance of 5.03 (Cl), 5.08 (Br), and 5.70 (I) Å (Fig. 3). Two neighboring molecules remain coupled through intermolecular interactions to form a bimolecular pillar. That intermolecular coupling is possible through three contributions: dipolar forces, an X⋯ring interaction, and dispersive forces. Fig. 3 indicates the distance between the halogen atom and the molecule ring.
Table 2 summarizes the values for relevant bond distances and two distortion index parameters (Σ, and Θ) that measure the iron atom coordination environment deviation from the perfect octahedron. As expected, the HS → LS transition involves a reduction for the bond distance between the iron atom and its ligands. The value of Σ is calculated according to,  where αi are the twelve cis-N–Fe–N angles about the iron atom, and
  where θi are the unique N–Fe–N angles corresponding to the projection of two faces of the octahedron along their common pseudo-threefold axis.40 The value for the continuous shape measure (CShM) index was also calculated. This index quantifies the deviation of a given structure from an expected symmetry relative to the corresponding point-group, and provides an accurate descriptor for the molecular structure, in this case of the iron atom coordination enviroment.41 For a perfect octahedron, the values for Σ, Θ, and CShM are 0.00. When comparing the values of Σ and Θ for the HS and LS phases, without exception, the LS phase corresponds to the structure with a minor deviation from the ideal octahedral symmetry. This is a regularity during the HS → LS transition.40 The same regularity was observed from the values of CSHM; the lower value of this index was obtained for the LS structure. These three parameters (Σ, Θ, and CShM) were also calculated for Fe(Py)2[Fe(CN)5NO] and Fe(3FPy)2[Fe(CN)5NO], two materials with well-known crystal structures for both, the HS and LS phases,18,19 and their values (Table S9, ESI†) were congruent with the ones obtained for the Fe(4XPy)2[Fe(CN)5NO] series.
| X | Phase | Fe–N4XPy | Fe–NCN | Σ | Θ | CShM |
|---|---|---|---|---|---|---|
| Cl | HS (300 K), XRD | 2.13(2) | 2.17(1) | 79.90 | 100.33 | 1.23 |
| LS calculated | 2.08(1) | 1.87(1) | 49.94 | 85.34 | 0.76 | |
| Br | HS (300 K), XRD | 2.16(2) | 2.18(1) | 79.89 | 100.79 | 1.23 |
| LS calculated | 2.09(1) | 1.90(1) | 45.13 | 63.36 | 0.77 | |
| I | HS (300 K), XRD | 2.21(2) | 2.21(1) | 88.09 | 116.06 | 1.13 |
| LS calculated | 2.19(1) | 2.00(1) | 52.75 | 90.67 | 0.54 |
3.3. Thermally-induced spin crossover
The Fe(4XPy)2[Fe(CN)5NO] series herein considered shows SCO in the 140–250 K range (Fig. 4). The simple test, in that sense, is the sample immersion in an N2 bath. In the presence of thermally induced SCO, the sample shows a reversible color change, from orange-yellow to red-purple, during its cooling and warming (Fig. S8, ESI†). This is congruent with the absence of d–d transitions in LS Fe(II), and the light absorption in metal nitroprussides is dominated by the 2b2(xy) → 7e(π*NO) electronic transition, characterized by a strong absorption band at 498 nm.39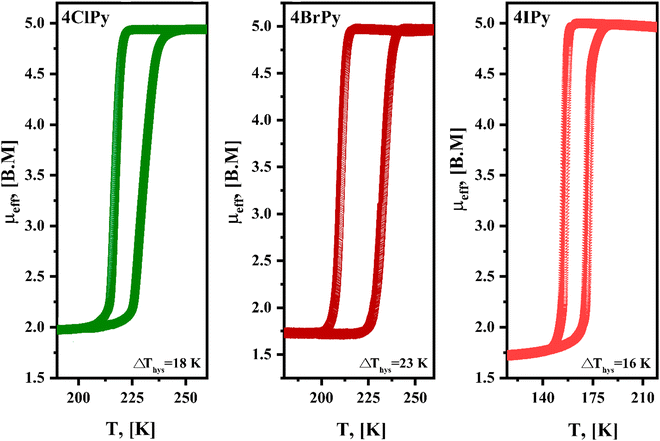 | ||
| Fig. 4 Effective magnetic moment (μeff) versus temperature for Fe(4XPy)2[Fe(CN)5NO] with X = Cl, Br, I, from magnetic data recorded at a cooling and heating rate of 1 K min−1. | ||
Fig. 4 shows the μeffversus temperature curves for the series. In concordance with the evidence of the sample color at 80 K (Fig. S8, ESI†), the HS → LS saturates in the 1.5–2.0 B.M. range, indicating that a sample fraction remains in the HS state. An analog behavior was already observed for Fe(3FPy)2[Fe(CN)5NO].18 The presence of that sample fraction in the paramagnetic state was ascribed to a kinetic effect and not to the existence of iron(2+) species with a 10Dq value inappropriate for stabilizing the LS phase. The Mössbauer spectra recorded at 5 K (discussed below) correspond to a complete spin transition. The onset temperature for the HS → LS transition (Fig. 4), follows the order in K: Cl (217) > Br (210) > I (155). This order does not correspond to the electronegativity of the halogen atom (Cl > Br > I), and its withdrawing ability. According to that order, the lower electron density at the N atom is expected for Cl, and in consequence, the weaker σ interaction with the iron atom, but this tendency does not correspond to the experimental evidence. An alternative explanation could be found in the known halogen-bond propensity, Cl < Br < I.42 It seems the halogen substituent subtracts electron density from the molecule ring via the σ-hole mechanism, resulting in a decrease in electron density at the pyridinic N atom. A lower electron density at the N atom weakens the NL–Fe bonding interaction, reducing its contribution to the value for the energy splitting between the eg and t2g orbitals of the iron atom. In consequence, the stabilization of the LS phase requires a lower sample temperature. This explains the observed order for the onset temperature of the HS → LS transition. The hysteresis loop width, in K, follows the order Br (23) > Cl (18) > I (16) at 1 K min−1, and it is more significant for Br. This informs us on the kinetics of the structural change related to the spin crossover and depends on the sample structural features. It seems for Br the sample naturally favors the presence of a certain delay in the nucleation and growth process of the LS phase.
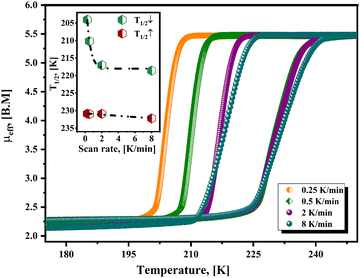
Fig. 5 shows the hysteresis loops, recorded at different values of scan rate, for the material containing 4ClPy. For lower values of scan rate, the repulsive electrostatic CN–ON interaction leads to a broadening of the hysteresis loop.43 This repulsive interaction delays the nucleation and growth process for the structure corresponding to the LS phase; it opposes the unit cell contraction. The crystal structure for the Fe(4XPy)2[Fe(CN)5NO] series is similar to the one reported for the 4MPy analog but with a larger CN–ON distance.20 For 4MPy, that distance is 4.40 Å, and in 4ClPy, it is 5.03 Å. This results in a weaker but detectable kinetic effect on the recorded magnetic data. Contrary to the observed kinetic effect on the sample cooling, this repulsive interaction between charge centers tends to restore the crystal structure of the HS phase, favoring the LS → HS transition. The repulsive interaction promotes the nucleation and growth process of the high-temperature structure. This explains the observed difference in the kinetic effect during the sample cooling and then on its warming (Fig. 5, inset). The kinetic effect is relevant during the sample cooling but could be imperceptible during its warming. This repulsive interaction reduces the electron density at the π*(NO), which is detected by the Mössbauer parameters for the iron atom in the nitroprusside ion (discussed below). The effect of that repulsive interaction can be ignored when the distance between these charge centers is close to or above 10 Å.43 The repulsive CN–ON interaction as the main cause of the observed kinetic effect does not discard certain contributions from the overlapping of the halopyridine ligands, as reported by Neville et al.44,45
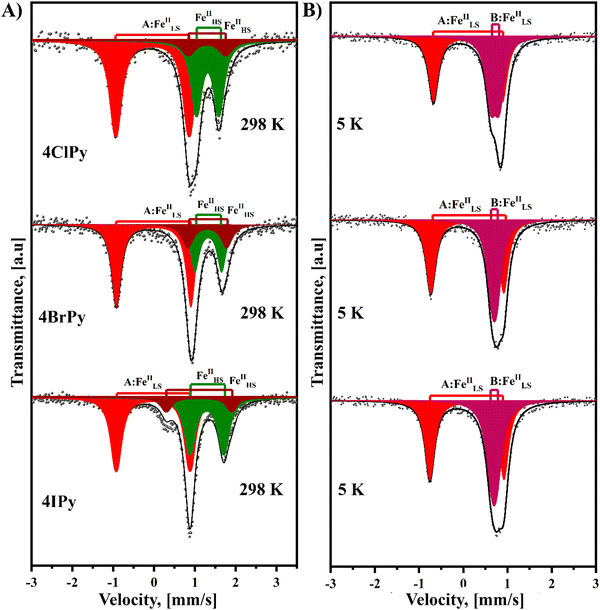
Fig. 6 shows the Mössbauer spectra recorded at room temperature for the Fe(4XPy)2[Fe(CN)5NO] series. These spectra result from the superposition of three quadrupole splitting doublets. The doublet of the larger quadrupole splitting (ΔQS) value, above 1.70 mm s−1 (Table 3), corresponds to the iron atom in the nitroprusside ion, [Fe(CN)5NO]. The isomer shift (δ) value of this doublet is close to 0.0 mm s−1, relative to sodium nitroprusside (Table 3). The remaining two doublets are characterized by δ values typical of HS Fe(2+) atoms (Table 3), in this case, with Fe(NC)4(NL)2 coordination environments. The existence of two doublets, with different values of ΔQS for this last iron species, reveals the existence of two slightly different coordination environments for the iron atom. This feature could be ascribed to the presence of different amounts of structural defects in the second coordination sphere of the iron species. The refined crystal structure for the series has a single site for the iron with that coordination sphere, Fe(NC)4(NL)2. The relative area for the LS and HS iron species is close to 50![[thin space (1/6-em)]](https://www.rsc.org/images/entities/char_2009.gif) :
:![[thin space (1/6-em)]](https://www.rsc.org/images/entities/char_2009.gif) 50, in agreement with the solids formula unit, Fe(4XPy)2[Fe(CN)5NO].
50, in agreement with the solids formula unit, Fe(4XPy)2[Fe(CN)5NO].
| Ligand | Temp. (K) | δ , mm s−1 | Δ QS, mm s−1 | Γ, mm s−1 | Area (%) |
|---|---|---|---|---|---|
| a The value of δ is reported relative to sodium nitroprusside at room temperature. | |||||
| 4ClPy | 298 | −0.039 | 1.798 | 0.334 | 54 |
| 1.316 | 0.548 | 0.296 | 36 | ||
| 1.298 | 0.917 | 0.395 | 10 | ||
| 5 | 0.068 | 1.489 | 0.266 | 53 | |
| 0.759 | 0.276 | 0.248 | 47 | ||
| 4BrPy | 298 | −0.010 | 1.823 | 0.279 | 53 |
| 1.329 | 0.655 | 0.276 | 29 | ||
| 1.306 | 0.950 | 0.343 | 18 | ||
| 5 | 0.021 | 1.513 | 0.255 | 54 | |
| 0.784 | 0.293 | 0.244 | 46 | ||
| 4IPy | 298 | −0.023 | 1.807 | 0.302 | 51 |
| 1.293 | 0.828 | 0.310 | 39 | ||
| 1.100 | 1.603 | 0.307 | 10 | ||
| 5 | 0.014 | 1.542 | 0.268 | 54 | |
| 0.781 | 0.310 | 0.253 | 46 | ||
When the Mössbauer spectra for these three solids are recorded at 5 K, the two doublets for the Fe(NC)4(NL)2 species appear superposed with similar δ values corresponding to LS Fe(II) species and were fitted as a narrow doublet. Unlike magnetic data, which correspond to an incomplete spin transition, these Mössbauer spectra reveal that the spin transition is complete; all the iron (2+) species participate in the HS → LS transition. This feature for the magnetic data is probably related to the above-discussed kinetic effect induced by the CN–ON repulsive interaction, which delays the HS → LS transition. The difference in the value of δ in these two LS Fe(II) species, [Fe(CN)5NO] and Fe(NC)4(NL)2, is related to the nature of their ligands. The NO group in the nitroprusside ion is characterized by a strong π-back bonding interaction with the iron atom, which subtracts a large amount of electron density, resulting in an effective valence close to Fe(IV).46 This explains the large difference in the value of δ for these two species of LS iron(II) atoms. The value of ΔQS for the iron atom in the nitroprusside ion, [Fe(CN)5NO], suffers a significant decrease during the HS → LS transition (Table 3). This suggests that such a transition is accompanied by a decrease in the π-back bonding interaction of the nitrosyl group with the iron atom. This behavior could be ascribed to an enhancement of the NO–NC repulsive interaction in the LS phase related to the unit cell volume contraction. That repulsive interaction reduces the electron density in the π*(NO) orbitals located at the O end, which is probed as a lower ΔQS value. This is congruent with the observed slightly larger value of δ for the LS phase (Table 3), corresponding to an increase in the electron density of the iron atom.
The DSC curves also probe thermally induced spin crossover in the series of hybrid 2D materials herein considered. The SCO involves a variation of the free energy (ΔG), through enthalpy (ΔH) and entropy (ΔS) contributions, ΔG = ΔH −TΔS. The value of ΔH is mainly related to the bonding interactions, which are enhanced by the sample cooling. This leads to a stronger local crystal field and a more considerable value for 10Dq, resulting in the electron migration from the anti-bonding eg orbitals toward the t2g non-bonding orbitals, and consequently, stabilizing the LS electronic configuration. From this fact, the value of ΔH determines the temperature where the HS → LS transition is observed. In the DSC curve, an exothermic peak, corresponding to the formation of a most stable phase. The value of ΔS results from the electronic configuration, ΔSSpin = Rln[(2S + 1)H.S./(2S + 1))L.S.], which for Fe(2+) amounts to 13.4 J mol−1 K−1, and the activation of new vibrational modes in the solid on the sample heating. This is appreciated as the appearance of an endothermic peak during the sample warming. The LS → HS transition is favored by the entropic term. Fig. 7 shows the recorded DSC curves for the Fe(4XPy)2[Fe(CN)5NO] series under a cooling and warming rate of 1 K min−1. As expected, the substituent nature determines the temperature values where the exothermic and endothermic peaks appear. The enthalpy change was obtained by integrating the heat flow versus the temperature curve. The value of ΔS was estimated by dividing the value for ΔH between the temperature corresponding to the peak. The values for ΔH and ΔS are in the ranges of 10–19 kJ mol−1 and 50–89 J mol−1 K−1, respectively, and are close to the ones obtained for Fe(3FPy)2[Fe(CN)5NO].18 These values of ΔS suggest that the activation of vibrational modes in the solid framework dominates the entropic contribution to ΔG during the sample warming. The hysteresis between these two thermal events results in 18, 24, and 18 K, for Cl, Br, and I, respectively. These values are like the ones obtained for the magnetic measurements, in K, 18, 23, and 16, for Cl, Br, and I, respectively. The recorded DSC curves show a specific fine structure, more pronounced for 4ClPy. That fine structure, appreciated as overlapped thermal effects, coincides with the derivative curve for the magnetic data (Fig. 7, inset). This suggests that within the sample, the iron atom is found with two slightly different distorted coordination geometry, both susceptible to SCO. This evidence coincides with the Mössbauer spectra recorded at 298 and 5 K. For the high-temperature phase (at 298 K), these spectra contain two doublets of HS Fe(II) but on the sample cooling, the two HS Fe(II) species undergo a HS → LS spin transition (Fig. 6).
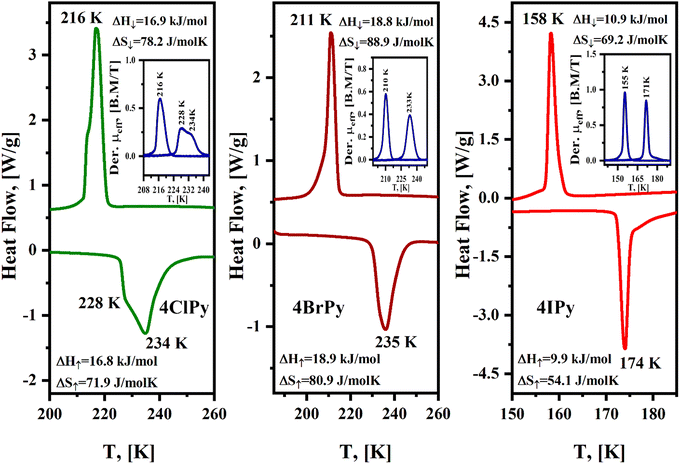 | ||
| Fig. 7 DSC curves for Fe(4XPy)2[Fe(CN)5NO] with X = Cl, Br, I, in the temperature region where the spin transitions are observed. Insets: Derivative of the μeffversus temperature curves. | ||
The variation in the vibrational spectra on the sample cooling and then, on its warming, inform us of the presence or not of a spin transition. Fig. 8 shows the ν(CN) vibration region for the IR and Raman spectra of the Fe(4XPy)2[Fe(CN)5NO] series recorded at 77 and 295 K. In both the IR and Raman spectra, the spin transition leads to a positive frequency shift for that vibration. During the HS → LS transition (eg2t2g4 → eg0t2g6), the eg anti-bonding orbitals for the iron atom are depopulated. This favors an increase in the electron density received from the CN5σ orbital. Since this molecular orbital has a certain anti-bonding character for the C![[triple bond, length as m-dash]](https://www.rsc.org/images/entities/char_e002.gif) N bond, the ν(CN) vibration increases its frequency. The σ donation from the organic ligand is competing by the eg orbital (z2), and from this fact, the frequency shift in the CN stretching vibration is only about +5 cm−1 but enough to probe the occurrence of an HS → LS transition. The ν(NO) vibration, detected in the IR spectrum, shows a slight increase of about +3 cm−1. The enhanced CN5σ → eg donation promotes an increase for the charge subtraction, via CN π-back donation, from the iron atom in the nitroprusside ion. The resulting decrease of the electron density at the iron atom weakens the π-back bonding interaction with the NO group. This combined effect is detected as a slight increase, of about 3 cm−1, in the frequency of the ν(NO) vibration (Fig. S9, ESI†).
N bond, the ν(CN) vibration increases its frequency. The σ donation from the organic ligand is competing by the eg orbital (z2), and from this fact, the frequency shift in the CN stretching vibration is only about +5 cm−1 but enough to probe the occurrence of an HS → LS transition. The ν(NO) vibration, detected in the IR spectrum, shows a slight increase of about +3 cm−1. The enhanced CN5σ → eg donation promotes an increase for the charge subtraction, via CN π-back donation, from the iron atom in the nitroprusside ion. The resulting decrease of the electron density at the iron atom weakens the π-back bonding interaction with the NO group. This combined effect is detected as a slight increase, of about 3 cm−1, in the frequency of the ν(NO) vibration (Fig. S9, ESI†).
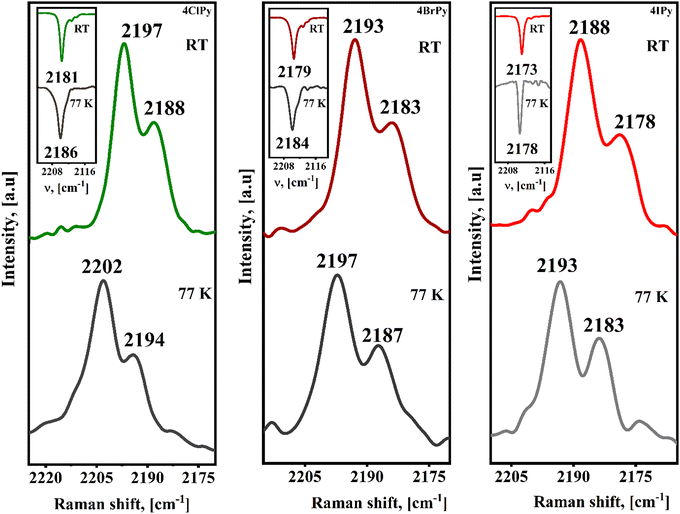 | ||
| Fig. 8 Raman spectra, ν(CN) stretching region only, for the Fe(4XPy)2[Fe(CN)5NO] series with X = Cl, Br, I, recorded at 77 and 295 K. Insets: ν(CN) stretching region in the IR spectra. | ||
3.4. Calculated crystal structure for the low spin phase
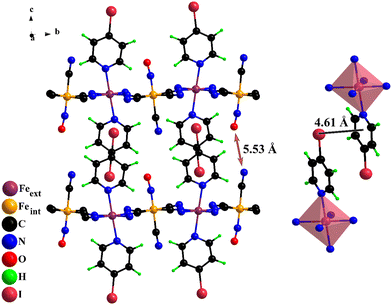
2D ferrous nitroprussides with bimolecular pillars have a flexible framework. The unit cell volume contraction on the spin transition remains below 1% for Fe(Py)2[Fe(CN)5NO] and Fe(3FPy)2[Fe(CN)5NO], according to the refined crystal structures using powder XRD patterns recorded with synchrotron radiation.18,19 The DFT method mentioned above used to calculate the crystal structure for the low-temperature was validated from the refined crystal structures for the HS and LS phases of these two materials (see Fig. S10 and S11 and Tables S3–S8, ESI†). Once reproduced the room temperature crystal structure for the Fe(4XPy)2[Fe(CN)5NO] series, the calculation procedure, including the required constraints, were used to calculate the crystal structure for the low-temperature (LS) phase. This really consists of a relaxation procedure from the room temperature structure. Fig. 9 shows the obtained crystal structure for the LS phase of Fe(4IPy)2[Fe(CN)5NO]. Similar results were obtained for X = Cl and Br (Figures S8 and S9, ESI†). Table 1 contains the calculated unit cell parameters for these low-temperature phases. The unit cell volume contraction remains close to 1.7%, which is a good result according to the structural features of this series of 2D materials. The calculated atomic positions and the related interatomic distance and bond angles are available in Tables S2–S8, ESI†. Table 2 summarizes the relevant structural change for the iron atom coordination environment. The reduction for the CN–ON distance accompanying the HS → LS transition remains within the expected values (about 3%) for 2D ferrous nitroprussides.18,19 The unit cell contraction mainly involves a reduction in the separation of adjacent layers, related to a shortening of the Fe–NL bond distance and a stronger intermolecular interaction in the interlayer region.3.5. On the role of the iron atom coordination environment distortion
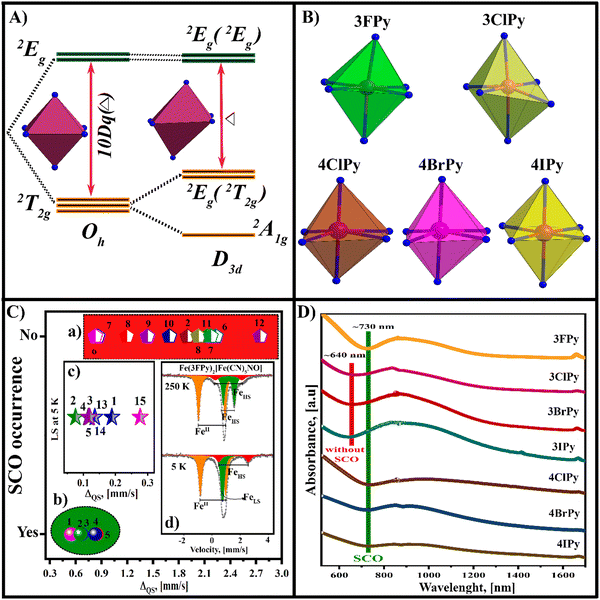
The stabilization of the LS electronic configuration for the iron atom (eg0t2g6) supposes a large separation in energy between the eg and t2g orbitals. This separation is provided by a strong metal–ligand interaction, which favors the eg → t2g electron migration. The thermally induced HS → LS transition is observed on the sample cooling; when the vibrational energy of the solid is reduced, making a stronger metal–ligand interaction and stabilization of the LS electronic configuration for the iron atom possible. Then, on the sample warming, the vibrational modes are activated, and the inverse LS → HS transition is observed. The perfect octahedral geometry for the coordination environment of the iron atom is a limit case. The SCO is also possible for the iron atom with a slightly distorted coordination environment. Fig. 10A illustrates the change in the energy diagram for trigonal distortion,47 indicating that the distortion reduces the energy gap (Δ) available to stabilize the LS electronic configuration.The nitroprusside ion has an axially distorted geometry and from this fact, its coordination polymers adopt an undulated configuration. This generates a certain distortion for the coordination geometry for the metal bound to the N end of the equatorial CNs. In 2D transition metal (T) nitroprussides, the axial coordination sites for the metal (T) are occupied by an organic molecule, which behaves as a pillar between adjacent layers.39 Since the equatorial CNs and the organic pillar do not necessarily have similar bonding properties, the resulting coordination environment for the metal appears with an axial elongated or compressed geometry. The steric impediments and intermolecular interactions in the interlayer region are an additional source for a deviation of the coordination geometry from an octahedral geometry. Fig. 10B shows the coordination geometry for 2D ferrous nitroprussides with 3FPy, 3ClPy, and the 4XPy as pillars, according to the refined crystal structure. Except for 3ClPy, the remaining four solids show thermally induced SCO. A moderate distortion of the coordination environment does not prevent observing the spin transition, e.g. in the Fe(4XPy)2[Fe(CN)5NO] series, and Fe(3FPy)2[Fe(CN)5NO].18
The Mössbauer spectrum, through its quadrupole splitting (ΔQS) value, is a probe for the coordination geometry of the iron atom. The value of ΔQS contributes asymmetry for both the coordination geometry, known as the lattice effect ΔQS(L), and the electronic configuration of the iron atom ΔQS(e). When the iron atom is found with a LS state, its value of ΔQS has no electronic contribution. In the HS state, these two contributions cannot be separated because a deformation in the coordination geometry determines the splitting of the 3d orbitals (Fig. 10A). However, within a given family of materials, for instance ferrous nitroprussides, from the value of ΔQS at room temperature, the possibility that SCO may occur can be inferred, as a trend. Fig. 10C shows a plot in that sense with the value of ΔQS at room temperature for a series of ferrous nitroprussides.48 For ΔQS > 0.90 mm s−1, the iron atom usually remains in the HS state even at 5 K (Fig. 10C, a). When that parameter is found with a value below 0.90 mm s−1, a thermally induced SCO is observed (Fig. 10C, b). For instance, the values of ΔQS in 3FPy, 4ClPy, 4BrPy, and 4IPy, as pillars, are 0.665, 0.548, 0.655, and 0.828 mm s−1, respectively, and the HS → LS transition is observed. Ferrous nitroprusside with 3FPy as a pillar has two coordination environments for the iron atom, and on its cooling, the site with ΔQS = 0.665 mm s−1 undergoes a SCO transition (HS → LS). However, the site with ΔQS = 1.898 mm s−1 remains in the HS state even at 5 K (Fig. 10C, d). In ferrous nitroprusside with SCO behavior, the value of ΔQS at 5 K remains below 0.3 mm s−1 (Fig. 10C, c). This corresponds to a moderate distortion for the iron atom coordination geometry. Table 3 and Tables S10–S12 (ESI†) summarize the values for the Mössbauer parameters used to prepare (Fig. 10C).
The d–d transitions may be used to predict SCO, which remains well documented for the octahedral coordination.49 The d–d transition in the UV-vis spectrum is a probe for the distortion of the iron atom coordination environment. This absorption band in octahedral Fe(2+) compounds results from t2g → eg orbital electronic transitions. For an octahedron with trigonal distortion (D3d), the t2g energy levels appear to be split, and the d–d absorption band involves the a1g →eg(eg), eg(t2g) → eg(eg), and a1g → eg(t2g) transitions. This explains why a broad band is observed, which hinders precise determination of the lambda value corresponding to the maximum absorption for these three sub-bands. The a1g → eg(eg) transition corresponds to a larger energy, observed at a smaller wavelength in the UV-vis-NIR spectrum (Fig. 10D). The onset for that transition appears as an appropriate probe for the coordination environment distortion of the iron(2+) atom. The difference in wavelength for the 3XPy series with and without SCO is 90 nm. For the 4XPy series, where SCO is observed, the predictive character from the a1g → eg(eg) transition coincides with the experimental results from the magnetic, DSC, IR, Raman, and Mössbauer data. At least, in ferrous nitroprussides, the onset for the a1g →eg (eg) transition appears as a predictive probe for the SCO in iron(II) containing compositions. The information summarized in Fig. 10 reveals the role of the distortion of the coordination environment for the iron atom in its SCO crossover behavior.
4. Conclusions
The Fe(4XPy)2[Fe(CN)5NO] series shows a thermally induced SCO behavior. The onset temperature for the HS → LS transition follows the order Cl > Br > I. This order cannot be explained in terms of the halogen atom electronegativity and its withdrawing ability to subtract electron density from the molecule ring. It could be rationalized through the σ-hole mechanism, resulting in a decrease in electron density available at the pyridinic N atom. According to the Mössbauer spectra, in the Fe(4XPy)2[Fe(CN)5NO] series, all the Fe(2+) atoms participate in the SCO, unlike those observed from the magnetic data. This difference finds an explanation in the kinetic effects related to the CN–ON repulsive interaction between adjacent layers. In the Mössbauer spectrum recorded at room temperature, the ΔQS value appears as a probe to predict the possibility of observing SCO. The structural sites with ΔQS < 0.90 mm s−1 are susceptible to HS → LS transition upon sample cooling. The structural sites where the iron atom undergoes SCO on the sample cooling are characterized by a ΔQS value below 0.3 mm s−1 (a lattice contribution). The UV-vis-NIR spectrum, through the onset for the a1g → eg(eg) transition, has the same potentiality. In 2D ferrous nitroprussides without SCO, the onset for that electronic transition appears at a higher energy, ∼80 nm shorter wavelength, related to a larger distortion for the iron atom coordination environment. These two probes, Mössbauer and UV-vis-NIR spectra, contribute to predicting the possibility of observing the SCO in 2D ferrous nitroprussides from room temperature data.Author contributions
Y. Avila: synthesis, characterization, and artwork; H.R. Mojica: computational calculations; M. C. Vázquez: spectroscopic studies; L. Sánchez: Mössbauer spectra recording and fitting; J. Rodríguez-Hernández: structural studies; M. González: magnetic data recording; E. Reguera: design, data analysis, writing and revision.Conflicts of interest
The information reported in this contribution has an essential (basic) character since it corresponds to new scientific knowledge. The authors have no conflict of interest to declare.Acknowledgements
The authors also thank LNCAE (Laboratorio Nacional de Conversión y Almacenamiento de Energía) for access to its experimental facility. This study was partially supported by the SECITI/185/2021 project. R. Mojica and E. Reguera acknowledge LANCAD (Laboratorio Nacional de Cómputo de Alto Desempeño) for the use of supercomputer facilities through the 21-2022 project.References
- E. König, G. Ritter and S. K. Kulshreshtha, Chem. Rev., 1985, 85, 219–234 CrossRef
.
- E. König, Prog. Inorg. Chem., 1987, 35, 527–622 Search PubMed
.
- P. Gütlich, A. B. Gaspar and Y. Garcia, Beilstein J. Org. Chem., 2013, 9, 342–391 CrossRef PubMed
.
- O. Kahn, J. Kröber and C. Jay, Adv. Mater., 1992, 4, 718–728 CrossRef CAS
.
- K. S. Kumar and M. Ruben, Coord. Chem. Rev., 2017, 346, 176–205 CrossRef
.
- T. Romero-Morcillo, N. de la Pinta, L. M. Callejo, L. Piñeiro-López, M. C. Muñoz, G. Madariaga, S. Ferrer, T. Breczewski, R. Cortés and J. A. Real, Chem. – Eur. J., 2015, 21, 12112–12120 CrossRef CAS PubMed
.
- J. W. Shin, A. R. Jeong, S. Jeoung, H. R. Moon, Y. Komatsumaru, S. Hayami, D. Moond and K. S. Min, Chem. Commun., 2018, 54, 4262–4265 RSC
.
- G. Molnár, S. Rat, L. Salmon, W. Nicolazzi and A. Bousseksou, Adv. Mater., 2018, 30, 1703862 CrossRef
.
- J. Linares, E. Codjovi and Y. García, Sensors, 2012, 12, 4479–4497 CrossRef CAS
.
- H. J. Shepherd, I. Gural'skiy, C. M. Quintero, S. Tricard, L. Salmon, G. Molnár and A. Bousseksou, Nat. Commun., 2013, 4, 2607 CrossRef PubMed
.
- T. Jasper-Toennies, M. Gruber, S. Karan, H. Jacob, F. Tuczek and R. Berndt, Nano Lett., 2017, 17, 6613–6619 CrossRef CAS PubMed
.
- J.-F. Létard, P. Guionneau and L. Goux-Capes, Top. Curr. Chem., 2004, 236, 221–249 CrossRef
.
- G. Molnár and A. Bousseksou, Compt. Rendus Chemie, 2003, 6, 1175–1183 CrossRef
.
- C. Lefter, V. Davesne, L. Salmon, G. Molnár, P. Demont, A. Rotaru and A. Bousseksou, Magnetochemistry, 2018, 2, 18 CrossRef
.
- K. S. Kumar and M. Ruben, Coord. Chem. Reviews, 2017, 346, 176–205 CrossRef
.
- P. O. Ribeiro, B. P. Alho, R. M. Ribas, E. P. Nóbrega, V. S. R. de Sousa and P. J. von Ranke, J. Magn. Magn. Mater., 2019, 489, 165340 CrossRef CAS
.
- R. Terrero, Y. Avila, R. Mojica, A. Cano, M. Gonzalez, M. Avila and E. Reguera, New J. Chem., 2022, 46, 9618–9628 RSC
.
- Y. Avila, P. M. Crespo, Y. Plasencia, H. R. Mojica, J. Rodríguez-Hernández and E. Reguera, J. Solid State Chem., 2020, 286, 121293 CrossRef CAS
.
- Y. Avila, Y. Plasencia, H. Osiry, L. Martínez-dlCruz, M. González and E. Reguera, Eur. J. Inorg. Chem., 2019, 4966–4973 CrossRef CAS
.
- Y. Avila, P. M. Crespo, Y. Plasencia, H. R. Mojica, J. Rodríguez-Hernández and E. Reguera, New J. Chem., 2020, 44, 5937–5946 RSC
.
- K. Scanda, Y. Avila, R. Mojica, A. Cano, M. González, J. Rodríguez-Hernández and E. Reguera, J. Inorg. Organomet. Polym. Mater., 2022, 32, 3677–3690 CrossRef CAS
.
- Y. Plasencia, Y. Avila, J. Rodriguez-Hernandez, M. Avila and E. Reguera, J. Phys. Chem. Solids, 2021, 150, 109843 CrossRef CAS
.
- Y. Avila, K. Scanda, R. Mojica, J. Rodriguez-Hernández, L. A. Cruz-Santiago, M. Gonzalez and E. Reguera, J. Solid Sate Chem., 2020, 310, 123054 CrossRef
.
- Y. Avila, H. Osiry, Y. Plasencia, A. E. Torres, M. Gonzalez, A. A. Lemus-Santana and E. Reguera, Chem. – Eur. J., 2019, 25, 11327–11336 CAS
.
- A. Boultif and D. Louer, Indexing of powder diffraction patterns for low-symmetry lattices by the successive dichotomy method, J. Appl. Crystallogr., 1991, 24, 987–993 CrossRef CAS
.
- A. Altomare, C. Cuocci, C. Giacovazzo, A. Moliterni, R. Rizzi, N. Corriero and A. Falcicchio, J. Appl. Crystallogr., 2013, 46, 1231 CrossRef CAS
.
- A. Le Bail, H. Duroy and J. L. Fourquet, Mater. Res. Bull., 1988, 23, 447–452 CrossRef CAS
.
- J. Rodríguez-Carvajal, FullProf Suite 2013, Institute Leon Brillouin, Saclay, 2013.
- G. Kresse and J. Hafner, Phys. Rev. B: Condens. Matter Mater. Phys., 1993, 47, 558–561 CrossRef CAS
.
- G. Kresse and J. Furthmüller, Phys. Rev. B: Condens. Matter Mater. Phys., 1996, 54, 11169–11186 CrossRef CAS
.
- P. E. Blöchl, Phys. Rev. B: Condens. Matter Mater. Phys., 1994, 50, 17953–17979 CrossRef
.
- G. Kresse and D. Joubert, Phys. Rev. B: Condens. Matter Mater. Phys., 1999, 59, 1758–1775 CrossRef CAS
.
- J. P. Perdew, K. Burke and M. Ernzerhof, Phys. Rev. Lett., 1996, 77, 3865–3868 CrossRef CAS PubMed
.
- J. C. Wojdeł, I. de, P. R. Moreira and F. Illas, J. Chem. Phys., 2009, 130, 014702 CrossRef
.
- S. Vela, M. Fumanal, J. Cirera and J. Ribas-Arino, Phys. Chem. Chem. Phys., 2020, 22, 4938–4945 RSC
.
- S. Vela, M. Fumanal, J. Ribas-Arino and V. Robert, Phys. Chem. Chem. Phys., 2015, 17, 16306–16314 RSC
.
-
R. S. Drago, Physical Methods for Chemists, Saunders College Publishing, Gainesville, 2nd edn, 1962, ch. 11 Search PubMed
.
-
Z. Klencsár, MossWin 4.0: a software package for Mössbauer spectrum analysis, https://www.mosswinn.com
.
- L. Reguera, Y. Avila and E. Reguera, Coord. Chem. Rev., 2021, 434, 213764 CrossRef CAS
.
- M. A. Halcrow, Chem. Soc. Rev., 2011, 40, 4119–4142 RSC
.
- S. Alvarez, Dalton Trans., 2021, 50, 17101 RSC
.
- E. Engelage, D. Reinhard and S. M. Huber, Chem. – Eur. J., 2020, 26, 3843–3861 CrossRef CAS
.
- Y. Avila, K. Skanda, L. A. Diaz-Paneque, L. A. Cruz-Santiago, M. González and E. Reguera, Eur. J. Inorg. Chem., 2022, e202200252 CAS
.
- A. T. Brennan, K. A. Zenere, H. E. A. Brand, J. R. Price, M. M. Bhadbhade, G. F. Turner, S. A. Moggach, F. J. Valverde-Muñoz, J. A. Real, J. K. Clegg, C. J. Kepert and S. M. Neville, Inorg. Chem., 2020, 59, 14296–14305 CrossRef CAS
.
- A. T. Brennan, K. A. Zenere, C. J. Kepert, J. K. Clegg and S. M. Neville, Inorg. Chem., 2021, 60, 3871–3878 CrossRef CAS
.
- A. Cano, L. Lartundo-Rojas, A. Schukarev and E. Reguera, New J. Chem., 2019, 43, 4835 RSC
.
- M. Gerloch, J. Lewis, G. G. Phillips and P. N. Quested, J. Chem. Soc. A Inorg., Phys. Theor., 1970, 1941–1955 RSC
.
- Y. Avila, J. Rodríguez-Hernández, P. M. Crespo, M. González and E. Reguera, J. Coord. Chem., 2021, 74, 695–713 CrossRef CAS
.
- A. Hauser, Top. Curr. Chem., 2004, 233, 49–58 CrossRef CAS
.
Footnote |
| † Electronic supplementary information (ESI) available. CCDC 2212702 (Cl), 2212701 (Br), and 2212703 (I). For ESI and crystallographic data in CIF or other electronic format see DOI: https://doi.org/10.1039/d2nj05141a |
| This journal is © The Royal Society of Chemistry and the Centre National de la Recherche Scientifique 2023 |

