Development of titanium doped hydroxyapatite for efficient removal of radioactive strontium from contaminated water†
Syeda Zil-e-Huma
Ejaz‡
ab,
Sajid
Iqbal‡
 *a,
Shabnam
Shahida
b,
Syed M.
Husnain
 a and
Muhammad
Saifullah
a
aChemistry Division, Pakistan Institute of Nuclear Science and Technology (PINSTECH), P. O. Nilore, Islamabad, Pakistan. E-mail: sajid1@alumni.kaist.ac.kr; Fax: +92-51-9248808; Tel: +92-51-9248412
bDepartment of Chemistry, University of Poonch, Rawalakot, Azad Jammu and Kashmir, Pakistan
First published on 16th November 2022
Abstract
The present study explores the potential of hydroxyapatite (HA) and titanium-doped hydroxyapatite (Ti-HA) for the efficient removal of radioactive strontium (Sr-90) from contaminated water. Both the HA and Ti-HA were synthesized by the wet chemical precipitation method and characterized by X-ray diffraction, surface area analysis and scanning electron microscopy coupled with energy dispersive X-ray (SEM–EDX) techniques. Results confirmed the successful synthesis of HA and Ti-HA without changing the intrinsic crystal structure. SEM–EDX results showed a change in the morphology of HA from a needle-like shape to agglomerated sphere-like particles and confirmed the Ti doping. HA and Ti-HA showed 60.2 ± 1.8% and 86.3 ± 1.0% removal efficiencies for Sr(II), respectively, at an initial concentration of 100 μg mL−1 in the pH range of 4 to 7. The adsorption data were well fitted with the Langmuir and Freundlich models. The kinetic data were in good agreement with the pseudo second-order model, indicating the chemisorption process. Thermodynamic data suggested the feasible, spontaneous, and endothermic adsorption of Sr(II) on HA and Ti-HA. The synthesized adsorbents were suitable for Sr(II) removal even in the presence of other interfering ions. Therefore, Ti-HA can be an efficient and promising adsorbent for the removal of Sr(II) from aqueous solutions.
1. Introduction
Without any doubt, nuclear energy is one of the important clean energy sources to meet the ever increasing demand of the global energy crisis. However, the leakage of radionuclides during the continuous operation of nuclear power plants, fuel fabrication, reprocessing facilities and storage of spent nuclear fuel rods or large-scale nuclear accidents (such as Chernobyl (1986), Ukraine or Fukushima (2011), Japan) pose a significant threat to the global ecosystem.1,2 Liquid radioactive waste containing various radionuclides of complex chemical composition is responsible for 85% of the total radioactive waste generated from the nuclear industry.3 Among various radionuclides (I-131, I-29, Cs-137, Cs-134, Se-77, etc.) generated during the nuclear fission reaction, strontium (Sr-90) is a beta radiation emitter and considered the most toxic radionuclide due to its high solubility, long half-life (28.8 years), high transferability, bioavailability, and easy bioaccumulation.4 Sr(II) is readily absorbed in plants via root uptake, leaches from the soil into drinking water sources and enters the human body through the food chain.5 Sr(II) can easily be incorporated into human bones due to its similar physicochemical properties to Ca(II).6 A higher dose of radioactive Sr(II) in the body may cause bone pain, leukemia, rickets, anemia, and genetic disorders.6,7 Therefore, the removal of Sr(II) from the ecosystem is necessary.To purify the water contaminated with the Sr(II) radionuclide, many physicochemical and biological processes have been reported such as precipitation, oxidation or reduction, filtration, ion exchange, electrochemical treatments, reverse osmosis, membrane-based techniques, microwave-assisted sorption, and physiochemical adsorption.8–16 Among these technologies, decontamination by adsorption is considered one of the most widely used methods being cost-effective, simple, efficient, and environmentally friendly.17–22 Therefore, research has been focused on the development of highly efficient and selective adsorbents for the removal of Sr(II) from contaminated water.
Secondary waste volume reduction is a crucial parameter for nuclear wastewater decontamination. For this purpose, materials having high removal capacity and chemical stability and are easily transformable to the solid monolith directly or by mixing with the least amount of external binders are considered promising materials. Various materials like bio-adsorbents,14,23–25 composites,26–29 magnetic materials30 and inorganic materials27,31,32 have been used for the removal of Sr(II) from contaminated water. Each of these materials has its own merits and demerits, for instance, bio-sorbents show limited removal efficiency for metal ions at low or trace level concentrations. Metal oxide nanoparticles have aggregation issues due to which active surface sites are blocked and ultimately an efficient water remediation process is hindered.33 In addition, silica-based adsorbents have stability problems in alkaline media.28 Among inorganic adsorbents, apatite minerals with special crystal characteristics are considered as most effective materials for the treatment of wastewater containing various metal ions and have the capability of transforming spent adsorbents into solid bricks without an external binding matrix.34–36
Calcium hydroxyapatite (HA: Ca10 (PO4)6(OH)2) is a robust apatite material having promising thermal, radiation and chemical stability. It has shown excellent removal efficiency for many metals and non-metals (Cd(II), Cr(III, VI), Cu(II), Co(II), Fe(II), Ni(II), Pb(II), Sr(II), Zn(II) F and I, etc.)1,37–39 and their surrogate radionuclides. To further enhance its catalytic properties, the calcium sites (Ca(I) and Ca(II)) and phosphate sites in HA have been substituted by monovalent (Na, K, Ag), divalent (Mg, Fe, Zn, Sr, Mn, Cd, Ga, etc.), trivalent (Al, Bi, Y, La, etc.), tetravalent (Zr) and pentavalent (Nb, V, Ta) cations.40–44 These studies have suggested that the substitution of other metal ions is one of the most effective ways to improve the properties of HA for environmental applications.
The present study is focused on exploring the adsorption potential of HA and Ti-doped HA (Ti-HA) to provide a sustainable solution to decontaminate radioactive wastewater containing Sr-90. HA and Ti-HA were prepared by the wet chemical precipitation method. The fabricated materials were investigated using XRD, BET, FESEM and EDX techniques. For practical application, adsorption parameters such as kinetics, isotherms, thermodynamics, pH and the effect of interfering ions were investigated.
2. Experimental
2.1 Materials
Analytical grade reagents were used and all the solutions were prepared in deionized water. Calcium nitrate tetrahydrate (Ca(NO3)2·4H2O) and diammonium hydrogen phosphate ((NH4)2·HPO4) with purity ≥99% were purchased from Merck Co. (Germany). Ammonium hydroxide (NH4OH; 30%), titanium(IV) chloride (TiCl4), strontium nitrate (Sr(NO3)2), sodium chloride (NaCl), potassium chloride (KCl), magnesium chloride (MgCl2) and nickel nitrate hexahydrate (Ni(NO3)2·6H2O) with purity ≥99% were procured from Sigma-Aldrich (Germany).2.2 Synthesis of pristine HA and Ti-HA
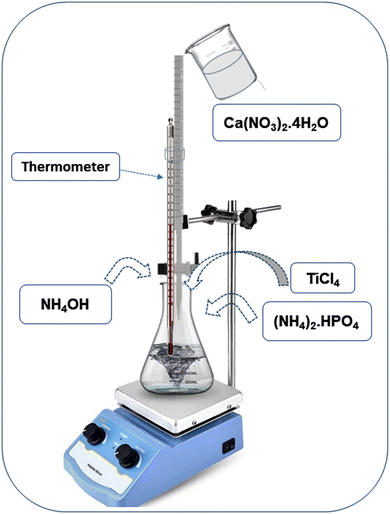
The wet chemical precipitation method was used for the synthesis of pristine HA and Ti-HA powders.44 The schematic diagram of the synthesis process is shown in Fig. 1. Briefly, 150 mL of a 0.6 M solution of (NH4)2·HPO4 was prepared, continuously stirred at 200 rpm and maintained at 40 °C using a hot plate. Then 150 mL of a 1 M solution of Ca(NO3)2·4H2O was prepared in a separate beaker, poured in a graduated burette and added drop-wise into the (NH4)2·HPO4 solution in 45 minutes. The pH of the mixture was maintained at 10.5 by the addition of NH4OH throughout the experiment. The stirring was stopped after 3 hours, the mixture was covered with aluminum foil and kept at 40 °C overnight. After 24 hours, heating was stopped and the precipitate was collected and washed five times with distilled water to remove excess ammonia and other impurities. Each time, the separation was done by centrifugation at 6000 rpm for five minutes. A white paste-like slurry was obtained which was then dried in an oven at 100 °C for 24 hours. The dried paste turned into solid agglomerates after heating, which were then crushed to a fine powder with a mortar and pestle. Ti-HA powder was synthesized under the same experimental conditions, except for the drop-wise addition of 5 mL of a 0.1 M solution of titanium(IV) chloride along with calcium solution into the reaction mixture during the last five minutes.2.3 Characterization techniques
The pristine HA and Ti-HA powders were characterized using different analytical techniques. Crystalline phase and structural identification of the powdered samples was carried out by X-ray diffraction (XRD) using an analytical diffractometer (Rigaku SmartLab, Japan) using a Cu Kα radiation source (λ = 1.5408 Å) operating at 45 kV. The step size was set at 0.05° with a 2θ scan range of 10–90°. The well-known PANalytical X’Pert HighScore Plus software was used to analyze the XRD data. The obtained patterns were compared to the standards compiled by the Joint Committee on Powder Diffraction and Standards (JCPDS) using card no. 01-076-0694 for HA and Ti-HA. High-resolution scanning electron microscopy (HR-SEM; EFI S50 Inspect, The Netherlands) was used to create images of the samples using an electron beam which was then used in the examination of surface morphology and topography. Energy dispersive X-ray (EDX) spectroscopy was used for elemental composition analysis.45 The concentrations of single metal ions and the mixture of metal ions were determined by inductively coupled plasma optical emission spectroscopy (ICP-OES; iCAP 6000 series, Thermo Scientific, USA). ICP-OES is a technique that can be used to determine the composition of elements in water-dissolved or acid-digested samples using plasma and a spectrometer. ICP-OES is rapid and provides an accurate analysis of multiple elements simultaneously. 10 mL of the supernatant from each sample in triplicate was subjected to ICP-OES for quantitative measurements throughout the batch experiments. All the data were plotted by using OriginPro 8 software.2.4 Adsorption methods and analytical equations
A 1000 μg mL−1 stock solution of stable isotope Sr(II) was prepared using Sr(NO3)2 salt in deionized water (Milli-Q ultrapure water system, ≤18.2 MΩ cm−1). The adsorption capacity of the synthesized adsorbents was investigated using various functional parameters including the solid-to-liquid ratio in the range of 2 to 5 g L−1, pH range (3–8), adsorbent–adsorbate contact time (3–180 minutes), initial concentration of the adsorbate (25–600 μg mL−1) and temperature (298–353 K). The solution pH was adjusted using 0.1 M HCl and 0.1 M NaOH solutions.Stock solutions of 100 μg mL−1 of NaCl, KCl, MgCl2, Sr(NO3)2 and Ni(NO3)2·6H2O were prepared to explore the effect of competing ions on Sr(II) removal. A mixture containing a 50 μg mL−1 concentration of each element such as Na, K, Sr, Mg, Ni, etc. was prepared in 100 mL of deionized water. The mixture was then shaken in an electrical shaker to achieve equilibrium at a speed of 150 rpm for one hour. For separation, the mixture was centrifuged at 6000 rpm. To avoid any remaining adsorbent particles after centrifugation, syringe filtration was performed using a micro filter of 0.22 μm pore size (MILEX GV, Darmstadt, Germany). The residual Sr(II) ion concentrations were determined by the ICP-OES technique.
The crystallite size of the synthesized materials was calculated using the Debye–Scherrer formula as shown in eqn (1):
 | (1) |
The adsorption capacity (mmol g−1) at any time and percentage removal (%) were calculated by using eqn (2) and (3):
| qt = (Ci − Cf) × V/m | (2) |
 | (3) |
To explore the detailed kinetic behavior of Sr(II) ions onto HA and Ti-HA, pseudo-first-order (PFO) and pseudo-second-order (PSO) kinetic models were applied using eqn (4) and (5).
The linear forms of these models can be expressed as follows:
ln(qe − qt) = ln![[thin space (1/6-em)]](https://www.rsc.org/images/entities/char_2009.gif) qe − k1t qe − k1t | (4) |
 | (5) |
In this study, the adsorption equilibrium of strontium ions onto HA and Ti-HA for adsorbate–adsorbent affinity was established and two isotherm models were tested, namely Langmuir and Freundlich adsorption isotherms.
The Langmuir model assumes that a fixed number of adsorption sites are available on the surface of the adsorbent; each site can take up one molecule only, that is, monolayer adsorption, and the energy of the adsorption is constant. The linear form of the Langmuir model is given by eqn (6).
 | (6) |
 | (7) |
To identify the best-fit isotherm model, isotherm model suitability was evaluated with linear Chi-square values (χ2) along with linear regression coefficients (R2). The Chi-square value is the sum of the squared errors of the differences between experimental data and the isotherm model's calculated data divided by the data obtained through the model. If the adsorption capacity (qe,cal) calculated using a model is similar to the experimental adsorption capacity (qe,exp) value, the χ2 value will approach zero. High χ2 values will be obtained if the difference between qe,cal and qe,exp is higher and vice versa. The mathematical expression of the Chi-square can be given using eqn (8) as follows:46
 | (8) |
 | (9) |
Thermodynamic parameters are important to predict the adsorption process (i.e. physical or chemical). In physical adsorption, molecules are held by weak intermolecular forces due to low activation energy, and multilayer and reversible adsorption; however, strong electrostatic interactions (chemical bonding) due to ion exchange, chelation or complexation with high activation energy are involved in chemisorption.28,47,48 Batch adsorption experiments were carried out at different temperatures such as 298 K, 313 K, 333 K, and 353 K to investigate the effect of temperature on Sr(II) uptake by HA and Ti-HA. Thermodynamic parameters are calculated through thermodynamic laws using eqn (10) and (11).
ΔG° = −RT![[thin space (1/6-em)]](https://www.rsc.org/images/entities/char_2009.gif) ln ln![[thin space (1/6-em)]](https://www.rsc.org/images/entities/char_2009.gif) Kc Kc | (10) |
| ΔG° = ΔH° − TΔS° | (11) |
The Van’t Hoff eqn (12) can be derived by comparing eqn (10) and (11).
 | (12) |
![[thin space (1/6-em)]](https://www.rsc.org/images/entities/char_2009.gif) Kc and 1/T. The thermodynamic equilibrium constant (Kc) is a dimensionless factor and is calculated by using eqn (13):47
Kc and 1/T. The thermodynamic equilibrium constant (Kc) is a dimensionless factor and is calculated by using eqn (13):47Kc = Mw × 55.5 × 10![[thin space (1/6-em)]](https://www.rsc.org/images/entities/char_2009.gif) 000 × KL 000 × KL | (13) |
To study the effect of competing ions on Sr(II) removal from water, a mixture of Na(I), K(I), Mg(II), Ni(II), and Sr(II) ions each at 50 μg mL−1 was prepared. An amount of 0.15 g of HA and Ti-HA were separately added into the mixture in two vials and kept under shaking at 150 rpm for 1 hour. The pH of the solution was maintained at 5. The supernatant was separated from the adsorbent by using centrifugation at 6000 rpm, followed by syringe filtration. Quantitative analysis of each metal ion was performed using the ICP-OES technique.
2.5 Statistical analysis
All the experiments were performed in triplicate and the average value with standard deviation was used to plot the pH, adsorbent dose, kinetics and adsorption isotherms. The experimental adsorption data were fitted to different isotherm and kinetic models using linear and non-linear regressions with Microsoft Excel and OriginPro 8 software. The Chi square test was conducted to check the best fit for adsorption models using Microsoft Excel software.3. Results and discussion
3.1 Characterization of the synthesized adsorbents
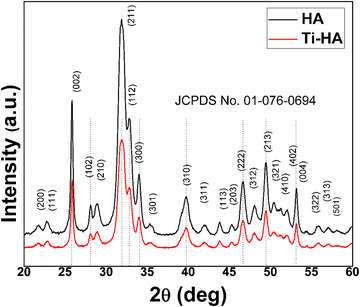
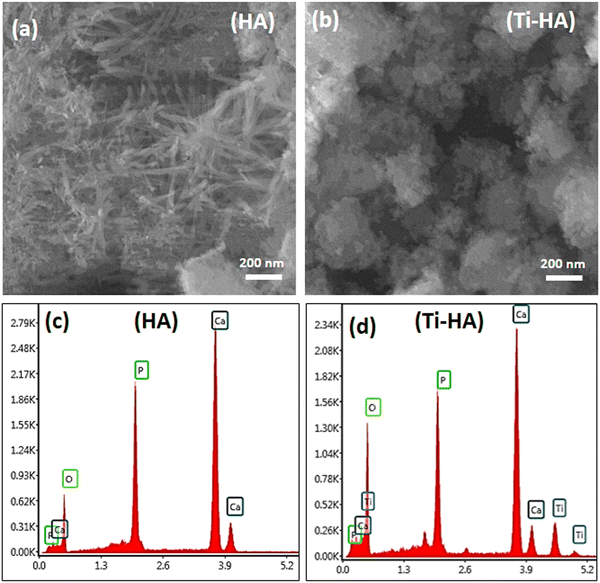
The X-ray diffraction spectra of the pristine HA and Ti-HA are displayed Fig. 2. The XRD reflections of both samples well matched with hydroxyapatite (Ca5(PO4)3OH) according to JCPDS card no. 01-076-0694 which shows a monoclinic structure with lattice parameters of a = 0.9422, b = 0.1884 and c = 0.6881 nm. For HA and Ti-HA, the major peaks present at 2θ values of 25.81°, 28.91°, 34.10°, 39.63°, 46.61°, 49.40° and 53.19° originate from the (002), (211), (300), (310), (222), (213) and (004) planes of their monoclinic structure, respectively. This confirmed the successful synthesis of HA and Ti-HA in their monoclinic phase without showing any major impurity peaks. No shift in the characteristic peaks of HA and Ti-HA compared to the respective peaks of PDF card no. 01-076-0694 in the standard database of the X’pert HighScore software showed that its unit cell experienced insignificant shrinkage and expansion. The added amount of Ti into Ti-HA, i.e. 1 at% in Ti-HA, seems to be insufficient to cause any shift in the XRD peaks of HA.2,36,49,50 The presence of Ti in Ti-HA however was confirmed by the EDX spectra shown in Fig. 3(d). The crystallite size of HA was found to be 12.9 ± 3.0; however, a slight increase in the crystallite size of up to 14.1 ± 4.9 was observed in the case of Ti-HA due to Ti doping.The morphological features of HA and Ti-HA were investigated by SEM. The SEM images and EDX elemental profiles of both samples are shown in Fig. 3(a–d). Pristine HA in Fig. 3(a) shows needles, whisker-like structures, and some agglomerated particles with various size distributions (∼50–200 nm). However, in Ti-HA (Fig. 3(b)) the needle-like morphology diminished due to the doping of Ti and a high degree of particle coalescence was observed with an irregular sphere-like morphology.51 This indicates that the doping of Ti significantly changes the morphology of HA. The EDX peaks in the HA spectra mainly consist of Ca, P and O groups. The elemental contents of Ca, P, and O in HA were found to be 19.45, 9.88 and 70.66 atomic%, respectively, and the Ca/P ratio was 1.53, which is slightly less than the ratio of these elements in pure HA (1.67). The EDX spectra of Ti-HA indicate the presence of Ti peaks along with the main peaks of Ca and P. The presence of these peaks in Ti-HA reveals the successful doping of Ti in HA.
3.2 Adsorption studies
![[thin space (1/6-em)]](https://www.rsc.org/images/entities/char_2009.gif) :
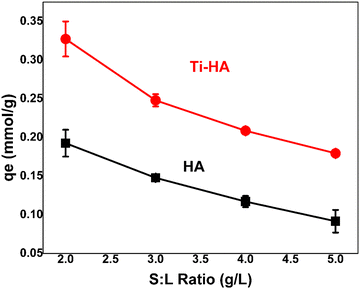
:![[thin space (1/6-em)]](https://www.rsc.org/images/entities/char_2009.gif) L) is also an important factor to decide the adsorption capacity of the synthesized adsorbent. The amount of adsorbent also decides the number of active sites available for the attachment of metal ions. The adsorption capacity at different S
L) is also an important factor to decide the adsorption capacity of the synthesized adsorbent. The amount of adsorbent also decides the number of active sites available for the attachment of metal ions. The adsorption capacity at different S![[thin space (1/6-em)]](https://www.rsc.org/images/entities/char_2009.gif) :
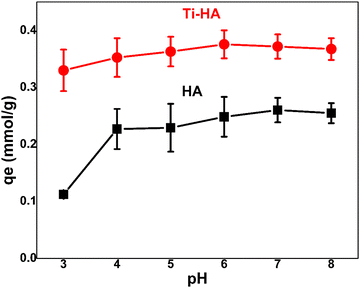
:![[thin space (1/6-em)]](https://www.rsc.org/images/entities/char_2009.gif) L ratios such as 2, 3, 4, and 5 g L−1 was examined at the optimal pH value of 6 (Fig. 5). It can be observed that Ti-HA showed much higher adsorption as compared to pristine HA in agreement with the pH results (Fig. 4). The maximum adsorption capacity (0.33 ± 0.02 mmol g−1) was obtained at an S/L ratio of 2 g L−1. By increasing the S
L ratios such as 2, 3, 4, and 5 g L−1 was examined at the optimal pH value of 6 (Fig. 5). It can be observed that Ti-HA showed much higher adsorption as compared to pristine HA in agreement with the pH results (Fig. 4). The maximum adsorption capacity (0.33 ± 0.02 mmol g−1) was obtained at an S/L ratio of 2 g L−1. By increasing the S![[thin space (1/6-em)]](https://www.rsc.org/images/entities/char_2009.gif) :
:![[thin space (1/6-em)]](https://www.rsc.org/images/entities/char_2009.gif) L ratio, the adsorption capacity decreased due to the availability of excess vacant sites on the adsorbent surface.
L ratio, the adsorption capacity decreased due to the availability of excess vacant sites on the adsorbent surface.
3.3 Kinetic studies
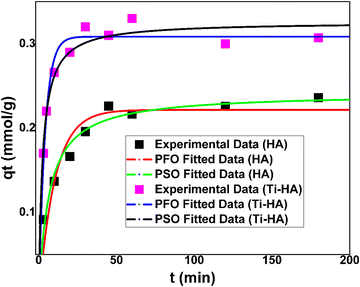
Adsorption kinetics is also a very important parameter to determine the efficiency of the synthesized adsorbents. Therefore, batch experiments were designed by varying the adsorbate–adsorbent contact time from 3 to 180 minutes while keeping the other parameters constant. Fig. 6 shows the effect of contact time on the adsorption capacity of HA and Ti-HA for the removal of Sr(II) ions. As the contact time increased to 50 min, the maximum adsorption capacities of 0.23 ± 0.01 mmol g−1 and 0.32 ± 0.03 mmol g−1 were achieved by HA and Ti-HA, respectively.The PFO and PSO models were applied to the experimental data to evaluate the kinetic behavior of HA and Ti-HA for the removal of Sr(II) as shown in Fig. 6. The values of kinetic fitting parameters and correlation coefficients (R2) are reported in Table 1. Based on the R2 values (0.9989 for HA and 0.9987 for Ti-HA) the PSO kinetic model was fitted better than the PFO model for strontium adsorption by HA as well as Ti-HA. Also, the calculated and experimental qe values for HA and Ti-HA are in close agreement in the case of the PSO model. The findings suggest that chemical adsorption can be a dominant mechanism of Sr(II) ions by HA and Ti-HA. The governing adsorption mechanism may be ion-exchange or electrostatic forces of attraction between the adsorbents and Sr(II). The relatively high adsorption by Ti-HA may be due to the smaller bandgap of Ti and easy electron transfer contributing to more surface reactivity.56
| Adsorbent | Parameters | PFO | PSO |
|---|---|---|---|
| HA | q e – experimental (mmol g−1) | 0.23 ± 0.06 | 0.23 ± 0.06 |
| q e – calculated (mmol g−1) | 0.09 | 0.24 | |
| Rate constants (k1 and k2) | −2.22 (min−1) | 596 (g mmol−1 min−1) | |
| R 2 | 0.6891 | 0.9989 | |
| Ti-HA | q e – experimental (mmol g−1) | 0.33 ± 0.01 | 0.33 ± 0.01 |
| q e – calculated (mmol g−1) | 0.07 | 0.31 | |
| Rate constants (k1 and k2) | −0.01 (min−1) | 4.70 (g mmol−1 min−1) | |
| R 2 | 0.1999 | 0.9987 |
3.4 Effect of adsorbate concentration and adsorption isotherms
The effect of the initial Sr(II) ion concentration (25, 50, 100, 200, 300, 400, 500, and 600 μg mL−1) on the adsorption capacity of the synthesized HA and Ti-HA was analyzed by keeping the S![[thin space (1/6-em)]](https://www.rsc.org/images/entities/char_2009.gif) :
:![[thin space (1/6-em)]](https://www.rsc.org/images/entities/char_2009.gif) L ratio, pH and other parameters constant. It is clear that the adsorption capacity of HA and Ti-HA was increased by increasing the Sr(II) concentration as shown in Fig. 7. The experimental data (denoted by black squares and green triangles in Fig. 7) were fitted to the Langmuir and Freundlich isotherm models and the fitting parameters are listed in Table 2. The correlation coefficients of the Langmuir model (R2 = 0.979 and 0.980) show a slightly better fitting as compared to the Freundlich model (R2 = 0.953 and 0.955) for HA and Ti-HA, respectively. These isotherms can be assumed as L-shaped according to Giles’ classification.57 Both the isotherms exhibited a sharp initial slope showing good adsorption efficiency for metal ions.
L ratio, pH and other parameters constant. It is clear that the adsorption capacity of HA and Ti-HA was increased by increasing the Sr(II) concentration as shown in Fig. 7. The experimental data (denoted by black squares and green triangles in Fig. 7) were fitted to the Langmuir and Freundlich isotherm models and the fitting parameters are listed in Table 2. The correlation coefficients of the Langmuir model (R2 = 0.979 and 0.980) show a slightly better fitting as compared to the Freundlich model (R2 = 0.953 and 0.955) for HA and Ti-HA, respectively. These isotherms can be assumed as L-shaped according to Giles’ classification.57 Both the isotherms exhibited a sharp initial slope showing good adsorption efficiency for metal ions.
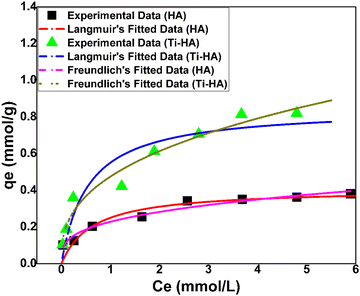 | ||
Fig. 7 Fitted adsorption isotherms for HA and Ti-HA (conditions: pH = 6, contact time = 60 min, S![[thin space (1/6-em)]](https://www.rsc.org/images/entities/char_2009.gif) : :![[thin space (1/6-em)]](https://www.rsc.org/images/entities/char_2009.gif) L ratio = 2 g L−1, temperature = 298 K and shaking speed = 150 rpm). L ratio = 2 g L−1, temperature = 298 K and shaking speed = 150 rpm). | ||
![[thin space (1/6-em)]](https://www.rsc.org/images/entities/char_2009.gif) :
:![[thin space (1/6-em)]](https://www.rsc.org/images/entities/char_2009.gif) L ratio = 2 g L−1
L ratio = 2 g L−1
| Langmuir isotherm parameters | Freundlich isotherm parameters | ||||||||
|---|---|---|---|---|---|---|---|---|---|
| qmax (mmol g−1) | K L (L mg−1) | R L | χ 2 | R 2 | 1/n | K F (mmol g−1) | χ 2 | R 2 | |
| HA | 0.41 | 1.88 | 0.15 | 0.424 | 0.979 | 0.28 | 0.23 | 0.498 | 0.953 |
| Ti-HA | 0.88 | 1.79 | 0.07 | 0.005 | 0.960 | 0.38 | 0.47 | 0.003 | 0.955 |
The highest adsorption capacity (qmax) predicted by the Langmuir model was 0.43 mmol g−1 for HA and 0.88 mmol g−1 for Ti-HA. In the Freundlich model, the 1/n parameter indicates the adsorption intensity. It indicates normal adsorption if 1/n < 1 at the heterogeneous surface; however, when 1/n approaches 1, it means that the adsorbent has more homogeneous binding sites.28,58 The 1/n values for HA and Ti-HA were less than one, indicating that the adsorption was favorable. The KF values for Ti-HA are relatively high for Sr(II) (0.47 mmol g−1) than those for HA (0.23 mmol g−1), showing the higher adsorption capacity of Ti-HA. Furthermore, the separation factor (RL) is less than 1 which indicates the favorable adsorption of strontium for both HA and Ti-HA, respectively.
The qmax predicted by the Langmuir model was higher for Ti-HA than that for HA. The higher qmax shows that Ti doping has added the synergistic effect in Ti-HA and a greater adsorption potential was observed towards Sr(II) ions. The HA and Ti-HA adsorption was also well described by the Freundlich model showing heterogeneity of the synthesized adsorbents.
3.5 Thermodynamic studies
The Van’t Hoff plot of ln(Kc) vs. 1/T is a straight line with a negative slope having R2 values of 0.9998 and 0.9999 for HA and Ti-HA, respectively, as shown in Fig. 8a and b. The estimated values of thermodynamic parameters such as ΔH°, ΔS°, and ΔG° are presented in Table 3. The positive values of ΔH° for both HA (7.42 kJ mol−1) and Ti-HA (5.38 kJ mol−1) and the negative slope of the Van’t Hoff equation indicate the endothermic nature of Sr(II) adsorption. However, the low value of ΔH° (<10 kJ mol−1) suggests the physisorption phenomenon.47 The positive values of ΔS° for HA and Ti-HA delineate the disturbances at the solid–liquid interface, suggesting a dissociative mechanism of adsorption. Also, the positive value of ΔS° indicates a higher degree of freedom of Sr(II) in the aqueous system. ΔG° is a critical parameter for evaluating the degree of spontaneity of the adsorption process. It is worth noting that the positive value of ΔG° for HA indicates an endothermic process, while the negative value of ΔG° for Ti-HA indicates the spontaneous nature of the adsorption process.5,59 This shows the different behaviors of the Ti-HA surface for Sr(II) adsorption because of Ti doping. The increase in the negative ΔG° value with increasing temperature supports the energetically favorable adsorption at higher temperatures for Sr(II) as shown in Table 3. The removal capacity was observed to increase from 75 to 80% when increasing the temperature from 298 to 353 K for Ti-HA. Higher Sr(II) uptake was found by Ti-HA than HA with increasing temperature, thus making Ti-HA a favorable adsorbent for Sr(II).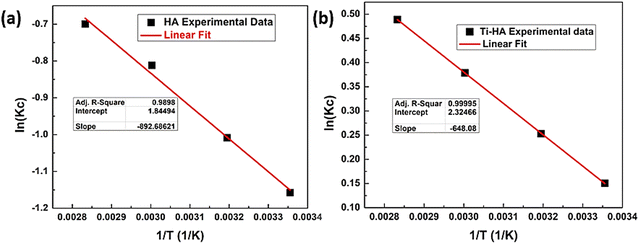 | ||
Fig. 8 Van’t Hoff plot for adsorption of strontium ions on HA (a) and Ti-HA (b) (conditions: Ci = 100 μg mL−1, pH = 6, contact time = 60 min, S![[thin space (1/6-em)]](https://www.rsc.org/images/entities/char_2009.gif) : :![[thin space (1/6-em)]](https://www.rsc.org/images/entities/char_2009.gif) L ratio = 2 g L−1, shaking speed = 150 rpm). L ratio = 2 g L−1, shaking speed = 150 rpm). | ||
| ΔH° (kJ mol−1) | ΔS° (J mol−1 K−1) | K c | T (K) | ΔG° (kJ mol−1) | |
|---|---|---|---|---|---|
| HA | 7.42 | 15.33 | 1![[thin space (1/6-em)]](https://www.rsc.org/images/entities/char_2009.gif) 04 04![[thin space (1/6-em)]](https://www.rsc.org/images/entities/char_2009.gif) 719 719 |
298 | 2.87 |
| 313 | 2.62 | ||||
| 333 | 2.24 | ||||
| 353 | 2.05 | ||||
| Ti-HA | 5.38 | 19.33 | 99![[thin space (1/6-em)]](https://www.rsc.org/images/entities/char_2009.gif) 403 403 |
298 | −0.37 |
| 313 | −0.65 | ||||
| 333 | −1.05 | ||||
| 353 | −1.43 |
3.6 Effect of competing ions on Sr(II) removal
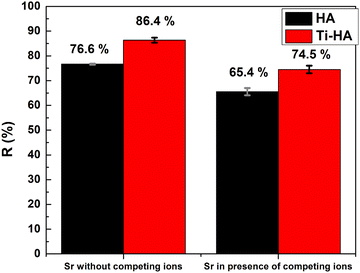
In the real scenario, there can be interferences due to the presence of multiple ions in the mixture which may hinder the Sr(II) removal for the same adsorbent sites. Therefore, experiments were performed to investigate the uptake of Sr(II) by HA and Ti-HA in the presence of various inorganic cations (Ni(II), Na(I), K(I), and Mg(II)) and the results are shown in Fig. 9. It can be seen that the removal capacity of Sr(II) slightly decreased from 86.4% to 74.5% in the case of Ti-HA in the presence of interfering ions. It is also important to note that the removal capacity of HA decreased from 76.6% to 64.4% in the presence of alkali and alkaline competing ion species. This indicates the higher affinity of Ti-HA to monovalent and divalent ions due to the doping effect of Ti and a slight increase in the surface area from 68.4 m2 g−1 to 84 m2 g−1 as measured by the multi-point BET method.603.7 Proposed adsorption mechanism
Apart from physical adsorption due to weak van der Waals forces, intra-particle diffusion, etc., HA has three basic replaceable sites such as Ca, phosphate, and OH− groups for modifications. It is reported that these structural modifications can be forced by substitution, complexation, precipitation or ion exchange mechanisms.61 Brazdis et al.62 attributed the substitution of divalent ions (M2+) at Ca2+ sites, oxyanions (AsO43−, VO43− and SiO44−) at phosphate sites and anions like F– and Cl– at OH– sites. However, the contribution of other protonated sites such as POH and CaOH2+ cannot be neglected.34,63 Chemisorption can be a dominant adsorption phenomenon based on kinetic data fitting with the PSO model and Ca site replacement by divalent ions suggested elsewhere.38,623.8 Comparison of Ti-HA with other adsorbents for the removal of Sr(II)
Different adsorbents used for Sr(II) removal from aqueous solution at different pH values are compiled in Table 4. From Table 4, it is clear that Ti-HA shows a higher adsorption capacity (0.88 mmol g−1) as compared to many reported adsorbents like hydroxyapatite, biogenic-HA, Fe3O4–HA, bone char-HA, MnO2 and MnO2–ZrO2. Furthermore, its ease of synthesis, high stability, fast equilibrium kinetics, performance in a wide pH range, and selectivity make it an ideal adsorbent for Sr(II) ion removal from aqueous solution. In addition, HA-based adsorbents are easy to solidify at low and high temperatures for permanent disposal of waste in a deep geological repository.34,364. Conclusions
The study investigated the synthesized HA and its engineered composite (Ti doped HA) as a potential adsorbent for the efficient removal of Sr(II) from contaminated water. The experimental data revealed that Ti-HA had better removal efficiency than pristine HA due to a higher surface area and tailored surface morphology. Moreover, the kinetics, isotherm models and the thermodynamic study revealed chemisorption as a dominant adsorption phenomenon. The maximum adsorption capacity was achieved in the first 50 minutes of contact time. The selectivity of any adsorbent for certain radionuclides is a very important parameter from a radioactive waste reduction point of view. Results showed that HA and Ti-HA are highly selective for Sr(II) removal from aqueous media in the presence of interfering cations. Thus, Ti-HA can be a promising adsorbent for the removal of Sr(II) and its solidification to remove it from the ecosystem by leaving a minimum amount of carbon footprint.Conflicts of interest
There are no competing financial or personal interests to declare.References
- S. Handley-Sidhu, T. K. Mullan, Q. Grail, M. Albadarneh, T. Ohnuki and L. E. Macaskie, Sci. Rep., 2016, 6, 23361 CrossRef CAS PubMed.
- S. Iqbal, M. U. Hassan, H. J. Ryu and J.-I. Yun, J. Nucl. Mater., 2018, 507, 218–225 CrossRef CAS.
- A. Ivanets, I. Shashkova, N. Kitikova, A. Dzikaya, N. Nekrasova, V. Milyutin, O. Baigenzhenov, K. Zaruba-Venhlinskaya and A. Radkevich, J. Cleaner Prod., 2022, 376, 134104 CrossRef CAS.
- B. Aguila, D. Banerjee, Z. Nie, Y. Shin, S. Ma and P. K. Thallapally, Chem. Commun., 2016, 52, 5940–5942 RSC.
- B. Ma, W. S. Shin, S. Oh, Y. J. Park and S. J. Choi, Sep. Sci. Technol., 2010, 45, 453–462 CrossRef CAS.
- U. Asim, S. M. Husnain, N. Abbas, F. Shahzad, A. R. Khan and T. Ali, J. Ind. Eng. Chem., 2021, 98, 375–382 CrossRef CAS.
- S. A. Jahan, M. Y. A. Mollah, S. Ahmed and M. A. B. H. Susan, J. Sci. Res., 2017, 9, 383–402 CrossRef CAS.
- K. Hardani, F. Buazar, K. Ghanemi, M. Kashisaz and M. Badri, AASCIT J. Nanosci., 2015, 1, 11–18 Search PubMed.
- H. S. Lim, W. Lim, J. Y. Hu, A. Ziegler and S. L. Ong, J. Environ. Manage., 2015, 147, 24–33 CrossRef CAS.
- Y. C. Sharma, Uma, S. N. Singh, Paras and F. Gode, Chem. Eng. J., 2007, 132, 319–323 CrossRef CAS.
- Z. V. P. Murthy and S. Parmar, Desalination, 2011, 282, 63–67 CrossRef CAS.
- T. A. Saleh, Environ. Technol. Innovation, 2021, 24, 101821 CrossRef CAS.
- T. A. Saleh, J. Mol. Liq., 2022, 359, 119340 CrossRef CAS.
- T. A. Saleh, Environ. Technol. Innovation, 2020, 20, 101067 CrossRef CAS.
- T. A. Saleh, Upstream Oil Gas Technol., 2022, 8, 100069 CrossRef.
- T. A. Saleh, Trends Anal. Chem., 2022, 149, 116543 CrossRef CAS.
- K. Sasaki, H. Nakano, W. Wilopo, Y. Miura and T. Hirajima, Colloids Surf., A, 2009, 347, 8–17 CrossRef CAS.
- P. Cakir, S. Inan and Y. Altas, J. Hazard. Mater., 2014, 271, 108–119 CrossRef CAS PubMed.
- G. N. Kousalya, M. Rajiv Gandhi, C. Sairam Sundaram and S. Meenakshi, Carbohydr. Polym., 2010, 82, 594–599 CrossRef CAS.
- M. Vila, S. Sánchez-Salcedo, M. Cicuéndez, I. Izquierdo-Barba and M. Vallet-Regí, J. Hazard. Mater., 2011, 192, 71–77 CAS.
- K. Narasimharao, L. P. Lingamdinne, S. Al-Thabaiti, M. Mokhtar, A. Alsheshri, S. Y. Alfaifi, Y. Y. Chang and J. R. Koduru, J. Water Process Eng., 2022, 47, 102746 CrossRef.
- G. K. R. Angaru, L. P. Lingamdinne, Y. L. Choi, J. R. Koduru, J. K. Yang and Y. Y. Chang, Mater. Today Chem., 2021, 22, 100577 CrossRef CAS.
- J. Long, H. Li, D. Jiang, D. Luo, Y. Chen, J. Xia and D. Chen, Process Saf. Environ. Prot., 2017, 111, 23–30 CrossRef CAS.
- K. V. Mahindrakar and V. K. Rathod, Environ. Technol. Innovation, 2018, 11, 371–383 CrossRef.
- A. Alkenani and T. A. Saleh, J. Mol. Liq., 2022, 120291 CrossRef CAS.
- Z. Chen, Y. Wu and Y. Wei, J. Radioanal. Nucl. Chem., 2014, 299, 485–491 CrossRef CAS.
- R. R. Sheha, S. I. Moussa and N. A. Tadros, Arab J. Nucl. Sci. Appl., 2013, 46, 28–39 Search PubMed.
- S. Iqbal and J. Il Yun, Microporous Mesoporous Mater., 2017, 248, 149–157 CrossRef CAS.
- K. Mumtaz, S. Iqbal, S. Shahida, M. A. Shafique, M. Wasim and B. Ahmad, Microporous Mesoporous Mater., 2021, 326, 111361 CrossRef CAS.
- A. D. Ebner, J. a Ritter and J. D. Navratil, Ind. Eng. Chem. Res., 2001, 40, 1615–1623 CrossRef CAS.
- I. Mironyuk, T. Tatarchuk, H. Vasylyeva, M. Naushad and I. Mykytyn, J. Environ. Chem. Eng., 2019, 7, 103430 CrossRef CAS.
- V. Kocherbitov and V. Alfredsson, Langmuir, 2011, 27, 3889–3897 CrossRef CAS.
- M. Hassan, R. Naidu, J. Du, Y. Liu and F. Qi, Sci. Total Environ., 2020, 702, 134893 CrossRef CAS PubMed.
- S. Iqbal, M. ul Hassan, H. J. Ryu and J.-I. Yun, J. Nucl. Mater., 2018, 507, 218–225 CrossRef CAS.
- S. Iqbal, M. ul Hassan, H. J. Ryu and J. Il Yun, RSC Adv., 2019, 9, 34872–34879 RSC.
- M. ul Hassan, S. Iqbal, J. Il Yun and H. J. Ryu, J. Hazard. Mater., 2019, 374, 228–237 CrossRef CAS PubMed.
- S. Iqbal, Y. Faiz, M. Harfouche, M. Saifullah and J. Il Yun, Int. J. Environ. Res., 2022, 16, 1–8 CrossRef.
- A. Corami, S. Mignardi and V. Ferrini, J. Colloid Interface Sci., 2008, 317, 402–408 CrossRef CAS PubMed.
- M. Ul Hassan and H. J. Ryu, J. Nucl. Mater., 2019, 514, 84–89 CrossRef.
- Y. Nishiyama, T. Hanafusa, J. Yamashita, Y. Yamamoto and T. Ono, J. Radioanal. Nucl. Chem., 2016, 307, 1279–1285 CrossRef CAS.
- K. M. T. Ereiba, A. G. Mostafa, G. A. Gamal and A. H. Said, J. Biophys. Chem., 2013, 04, 122–130 CrossRef.
- K. Kandori, M. Oketani, Y. Sakita and M. Wakamura, J. Mol. Catal. A: Chem., 2012, 360, 54–60 CrossRef CAS.
- A. Haider, S. Haider, S. S. Han and I. K. Kang, RSC Adv., 2017, 7, 7442–7458 RSC.
- T. J. Webster, E. A. Massa-Schlueter, J. L. Smith and E. B. Slamovich, Biomaterials, 2004, 25, 2111–2121 CrossRef CAS.
- T. A. Saleh, J. Cleaner Prod., 2018, 172, 2123–2132 CrossRef CAS.
- L. P. Lingamdinne, J. S. Choi, G. K. R. Angaru, R. R. Karri, J. K. Yang, Y. Y. Chang and J. R. Koduru, Chemosphere, 2022, 286, 131776 CrossRef CAS PubMed.
- H. N. Tran, S. J. You and H. P. Chao, J. Environ. Chem. Eng., 2016, 4, 2671–2682 CrossRef CAS.
- L. P. Lingamdinne, S. K. Godlaveeti, G. K. R. Angaru, Y. Y. Chang, R. R. Nagireddy, A. R. Somala and J. R. Koduru, Chemosphere, 2022, 299, 134457 CrossRef CAS PubMed.
- S. Iqbal, M. Younas, M. ul Hassan, H. J. Ryu, M. A. R. Anjum, M. A. Farhan, M. Nadeem and J. Il Yun, Chem. Phys. Lett., 2021, 771, 138507 CrossRef CAS.
- T. A. Saleh, Chem. Eng. J., 2021, 404, 126987 CrossRef CAS.
- J. S. Earl, D. J. Wood and S. J. Milne, J. Phys.: Conf. Ser., 2006, 26, 268–271 CrossRef.
- J. P. Gustafsson, Version 3.1, KTH, Stock. Sweden, 2013, 5 Search PubMed.
- E. Skwarek, Sep. Sci. Technol., 2014, 49, 1654–1662 CrossRef CAS.
- A. López-Macipe, J. Gómez-Morales and R. Rodríguez-Clemente, J. Colloid Interface Sci., 1998, 200, 114–120 CrossRef.
- G. Liu, J. W. Talley, C. Na, S. L. Larson and L. G. Wolfe, Environ. Sci. Technol., 2010, 44, 1366–1372 CrossRef CAS.
- U. Zahoor, M. I. Rameel, A. H. Javed, M. A. Khan, J. Y. Al-Humaidi, S. Iqbal, A. M. Aldawsari and A. Shah, Int. J. Environ. Res., 2022, 16(88) DOI:10.1007/s41742-022-00466-x.
- C. H. Giles and D. Smith, J. Colloid Interface Sci., 1974, 47, 755–765 CrossRef CAS.
- M. Li, M. Li, C. Feng and Q. Zeng, Appl. Surf. Sci., 2014, 314, 1063–1069 CrossRef CAS.
- H. S. Hassan, A. M. El-Kamash and H. A. S. Ibrahim, Environ. Sci. Pollut. Res., 2019, 26, 25641–25655 CrossRef CAS.
- I. Smičiklas, A. Onjia, S. Raičevi, Đ. Janakovi, M. Mitri, S. Raičević, Đ. Janaćković and M. Mitrić, J. Hazard. Mater., 2008, 152, 876–884 CrossRef.
- Q. Y. Ma, S. J. Tralna, T. J. Logan and J. A. Ryan, Environ. Sci. Technol., 1994, 28, 1219–1228 CrossRef CAS.
- R. I. Brazdis, I. Fierascu, S. M. Avramescu and R. C. Fierascu, Materials, 2021, 14, 1–30 CrossRef.
- L. Wu, W. Forsling and P. W. Schindler, J. Colloid Interface Sci., 1991, 147, 178–185 CrossRef CAS.
- J. Kim, N. S. Sambudi and K. Cho, J. Environ. Manage., 2019, 231, 788–794 CrossRef CAS.
- I. Smiciklas, S. Dimovic, M. Sljivic and I. Plecas, J. Environ. Sci. Health, Part A: Toxic/Hazard. Subst. Environ. Eng., 2008, 43, 210–217 CrossRef CAS PubMed.
- S. J. Ahmadi, N. Akbari, Z. Shiri-Yekta, M. H. Mashhadizadeh and M. Hosseinpour, Korean J. Chem. Eng., 2015, 32, 478–485 CrossRef CAS.
Footnotes |
| † Electronic supplementary information (ESI) available. See DOI: https://doi.org/10.1039/d2nj04860d |
| ‡ These authors have contributed equally to this work. |
| This journal is © The Royal Society of Chemistry and the Centre National de la Recherche Scientifique 2023 |

