
 Open Access Article
 This Open Access Article is licensed under a Creative Commons Attribution-Non Commercial 3.0 Unported Licence
Seed free synthesis of polyethylene glycol stabilized gold nanoprisms exploiting manganese metal at low pH†
Kanika
Bharti
 ,
Md Azimuddin
Sk
and
Kalyan K.
Sadhu
*
,
Md Azimuddin
Sk
and
Kalyan K.
Sadhu
*
Department of Chemistry, Indian Institute of Technology Roorkee, Roorkee 247667, Uttarakhand, India. E-mail: sadhu@cy.iitr.ac.in
First published on 20th June 2023
Abstract
Manganese powder with a suitable potential ( , −1.19 V) has never been investigated for the reduction of Au3+ (
 , 1.00 V). In this study, we have utilized
  and low pH dependent
  for the polyethylene glycol stabilized gold nanoprism synthesis by reducing AuCl−4 in the presence of thiol terminated polyethylene glycol as the stabilizing agent. The synthetic methodology for gold nanoprisms has been optimized by pH and Cl− ion combination. Time dependent absorbance studies have been conducted to demonstrate the role of various reaction parameters such as the stabilizing agent, HCl concentration, temperature, and Mn metal. The synthesized gold nanoprism has been further utilized as a seed for nucleic acid and selected amino acid mediated edge and surface growth, respectively.
1. Introduction
The journey of Mn metal as a reagent started 40 years ago through carbon–carbon bond formation reaction.1 Within these 40 years, few Mn metal-based attempts were made directly for chemical syntheses such as Barbier and Reformatsky like reactions,2 and adducts on fullerene.3 However, Mn metal as an additive to titanium has been known for 50 years4,5 and is currently also pursued in nickel6–8 catalyzed organic synthesis. Reactions exclusively with Mn metal are less in number as an oxide layer on the metal surface lowers the reducing ability of the Mn metal. The reducing ability was increased in freshly prepared Mn powder from the reduction on Mn2+ salts either with lithium naphthalenide9,10 or potassium graphite11 or by the addition of catalytic amounts of PbCl2 and Me3SiCl12 or LiCl, PbCl2 and InCl3 additives.13 In this current decade, the mechanochemical approach using ball milling for Mn metal has drawn significant attention for organic transformations.14–16 The limited performance of Mn metal in synthetic chemistry restricts its utilization in the reduction of Au3+. To the best of our knowledge, there is no report of gold nanoparticle synthesis using Mn metal powder.Seed mediated growth of gold nanoprisms has drawn significant attention due to their implication in biomedical applications.17 In this study, kinetically controlled growth has been found to be important. A very recent study has also focused on the Au56 nanocluster of a seed sized gold nanoprism.18 To date synthesis of nanoprisms without seeds remains challenging due to the parallel formation of rough gold nanoparticles.
Selective growth along the face, edge and corners was observed by controlling the reduction potential of the reducing agent and tuning the concentration of the reducing agent and stabilising agent.19 Efforts have been made to understand the synthesis mechanism of established traditional methods, overcome their limitations and modify the synthesis methodologies in order to improve the yield.20 Seed mediated21 and seedless synthetic methodologies22 are known for the synthesis of gold nanoprisms.
The growth mechanism of anisotropic nanoparticles has been influenced by reduction potential, which is indirectly governed by variations in seed concentration, pH, halide concentration, reducing agent, and surface passivating stabilizing agents.23 In our previous reports with Fe and Zn, seed-mediated syntheses produced gold-iron oxide24 or gold-zinc oxide nanocomposites.25 In this study, we aimed to synthesize nanoparticles without the incorporation of the reducing metal in the final nano-structure. Here, we have utilized a seed free methodology for the gold nanostructure synthesis. In order to achieve this, we have explored three half reactions for gold nanoparticle synthesis using Mn metal (eqn (1) and (2) and Scheme 1). Thiol modified PEG can reduce Au3+via thiol reduction and act as a stabilizing agent for the nanoparticle. Kinetically optimized condition produces gold nanoprisms as the major product by varying three reagents Mn metal, thiol containing polyethylene glycol (PEG) and pH of the solution for controlling Mn metal and Mn2+ in solution.
| Without HCl, 3Mn + 2Au3+ = 3Mn2+ + 2Au | (1) |
| With HCl, 3Mn2+ + 6H2O + 2Au3+ = 3MnO2↓ + 12H+ + 2Au | (2) |
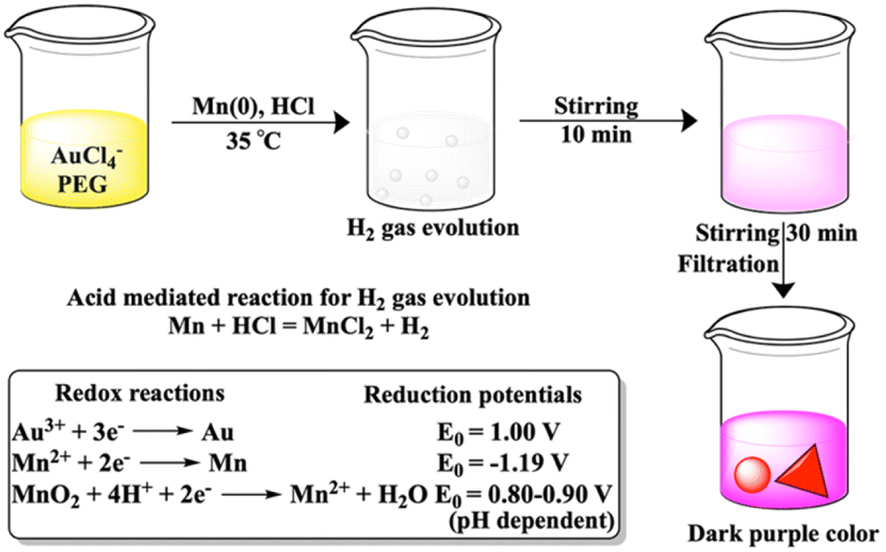 | ||
| Scheme 1 PEG-SH stabilized synthesis of gold nanoprisms through Mn metal-based reduction of Au3+. | ||
2. Results and discussion
The reduction potential vs. pH graph for the Mn/Mn2+ couple is independent of proton concentration within acidic to neutral pH.26 Considering the first two half reactions for Au3+ and Mn0, 1.5 equivalents of Mn metal is ideal for the gold nanoparticle formation. However, simple addition of 2 equivalents of Mn metal to the AuCl−4 aqueous solution shows no generation of surface plasmon resonance (SPR) peak in absorbance, which confirms no gold nanoparticle formation. Prior to checking the role of the stabilizing agent in the gold nanoparticle formation via Mn metal based reduction, 0.5 equivalents of PEG (Au![[thin space (1/6-em)]](https://www.rsc.org/images/entities/char_2009.gif) :PEG = 1:0.5) has been added to the Au3+ solution. The SPR peak has been generated at 630 nm within 10 min (Fig. S1a and S2, ESI†). This is possible due to the thiol-based reduction27 of Au3+ to Au0 and nucleation takes place in the presence of PEG. However, the SPR peak intensity becomes broad with time (Fig. S1b, ESI†), which suggests the aggregation of the nucleated particles. The absorption nature remains unchanged in the presence of HCl. However, no reaction takes place by Mn and HCl combination in the absence of PEG (Fig. S3, ESI†).
:PEG = 1:0.5) has been added to the Au3+ solution. The SPR peak has been generated at 630 nm within 10 min (Fig. S1a and S2, ESI†). This is possible due to the thiol-based reduction27 of Au3+ to Au0 and nucleation takes place in the presence of PEG. However, the SPR peak intensity becomes broad with time (Fig. S1b, ESI†), which suggests the aggregation of the nucleated particles. The absorption nature remains unchanged in the presence of HCl. However, no reaction takes place by Mn and HCl combination in the absence of PEG (Fig. S3, ESI†).
Addition of 2.0 equivalents of Mn metal in the presence of PEG without any HCl generates a stable peak at 575 nm due to the formation of gold nanoparticles (Fig. S4, ESI†). The intensity of the absorption peak has not been affected much by varying the PEG or Mn concentration in the solution. The pH independent Mn/Mn2+ couple along with PEG is responsible for the reduction of Au3+ to Au0 in the absence of HCl (eqn (1)). In order to inspect pH dependent behavior of redox reaction between Mn and Au(III),24 this has been added to the solution. Addition of 10 equivalents of HCl (Au:HCl = 1:10) to the reaction mixture shows the generation of effervescence as expected due to liberation of hydrogen gas after reaction with Mn metal (Scheme 1). The control reaction with separate treatment of hydrogen gas to the mixture of Au3+ and PEG does not show any SPR peak even after 1 h.
The SPR peak intensity at 536 increases significantly within 10 min (Fig. S5, ESI†). The time dependent studies for PEG reduction only and combination of all the three reagents PEG, Mn and HCl show the faster rate of SPR peak formation in the second case (Fig. S6, ESI†). Interestingly, an additional broad peak has been observed in the NIR range. Monitoring the reaction for 6 h shows clear declining nature of both the peaks in the visible and NIR regions (Fig. S7, ESI†). The additional broad peak in the NIR range is a characteristic peak of gold nanoprisms due to in-plane dipole mode and the peak position depends on the prism thickness, edge length and dielectric environment.28,29 Kitaev et al. have reported gold nanoprisms with a tuneable shift of the same absorption peak within the visible to NIR range based on thiol- and halide-mediated reduction with hydrogen peroxide.30
The reduction of Au3+ in the presence of Mn, HCl and PEG-SH develops dual absorption peaks, which are stable even after stirring the reaction mixture for 3 h (Fig. S5, ESI†). No SPR peak has been developed under the same reaction conditions in the absence of HCl and PEG as the stabilizing agent. In order to check the efficiency of the reduction in basic medium, we have also performed the reaction in the presence of NaOH. Absorbance spectra show a single SPR peak at 530 nm and the transmission electron microscopic (TEM) image after filtration confirms the formation of spherical gold nanoparticles at higher pH (Fig. S8 and S9, ESI†). In order to obtain a stable gold nanostructure with the maximum possible yield from the Mn metal-based reduction, concentrations of three reagents Mn, PEG and HCl have been further optimized.
In order to monitor the nanoparticle architecture in the presence of 10 equivalents of HCl, TEM images have been taken from the filtrate after 6 h of the reaction (Fig. S10, ESI†). TEM analysis confirms the polycrystalline behaviour of both larger spherical gold nanoparticles of 24.0 ± 1.4 nm diameter and smaller spherical gold nanoparticles of 10.9 ± 0.3 nm with fringe patterns (Fig. S11 and S12, ESI†).31 Increasing the HCl concentration from 14 to 32 equivalents, the SPR and NIR peaks have been found to be stable for long days. The pH working range for these stable peaks varies within 1.50 to 2.85, where the Mn2+/MnO2 redox couple shows a reduction potential of 0.8 to 0.9 V.26,32
TEM images in the presence of different concentrations of HCl confirm both the formation of spherical gold nanoparticles and their aggregation and nanoprisms (Fig. 1 and S13–S15, ESI†). These TEM images suggest that two parallel reactions have proceeded continuously within the solution. In one path spherical gold nanoparticles form with a SPR peak and their aggregation generates the NIR peak. On the other hand, a parallel process leads to the formation of 2D gold nanoprisms having dual absorption peaks. The height of gold nanoprisms has been confirmed from atomic force microscopic (AFM) images and found to be ∼10 nm (Fig. 1e and f), which is significantly lower than the edge dimension of the gold nanoprism. These two reaction pathways have been monitored through changes in absorption intensities at 536 nm and 850 nm for 3 h. The 536 nm absorption has originated from the spherical gold nanoparticles and gold nanoprisms, whereas the 850 nm absorption is attributed to gold nanoprisms and aggregation of spherical gold nanoparticles. Similar absorbance spectra with dual peaks have been reported by Kitaev et al. for the thiol mediated reduction synthetic approach.30 The 850 nm absorbance in the NIR range is a characteristic peak for gold nanoprisms due to in-plane dipole mode29 or aggregation of gold nanoparticles.33 These kinetic data for 3 h have been followed as a combination of two factors of the well explored KJMA model34–37 and fitted as per eqn (1).
| A = C1 (1 − ek1tn1) + C2 (1 − ek2tn2) | (3) |
| A = C1 (1 − ek1t2) + C2 (1 − ek2t) | (4) |
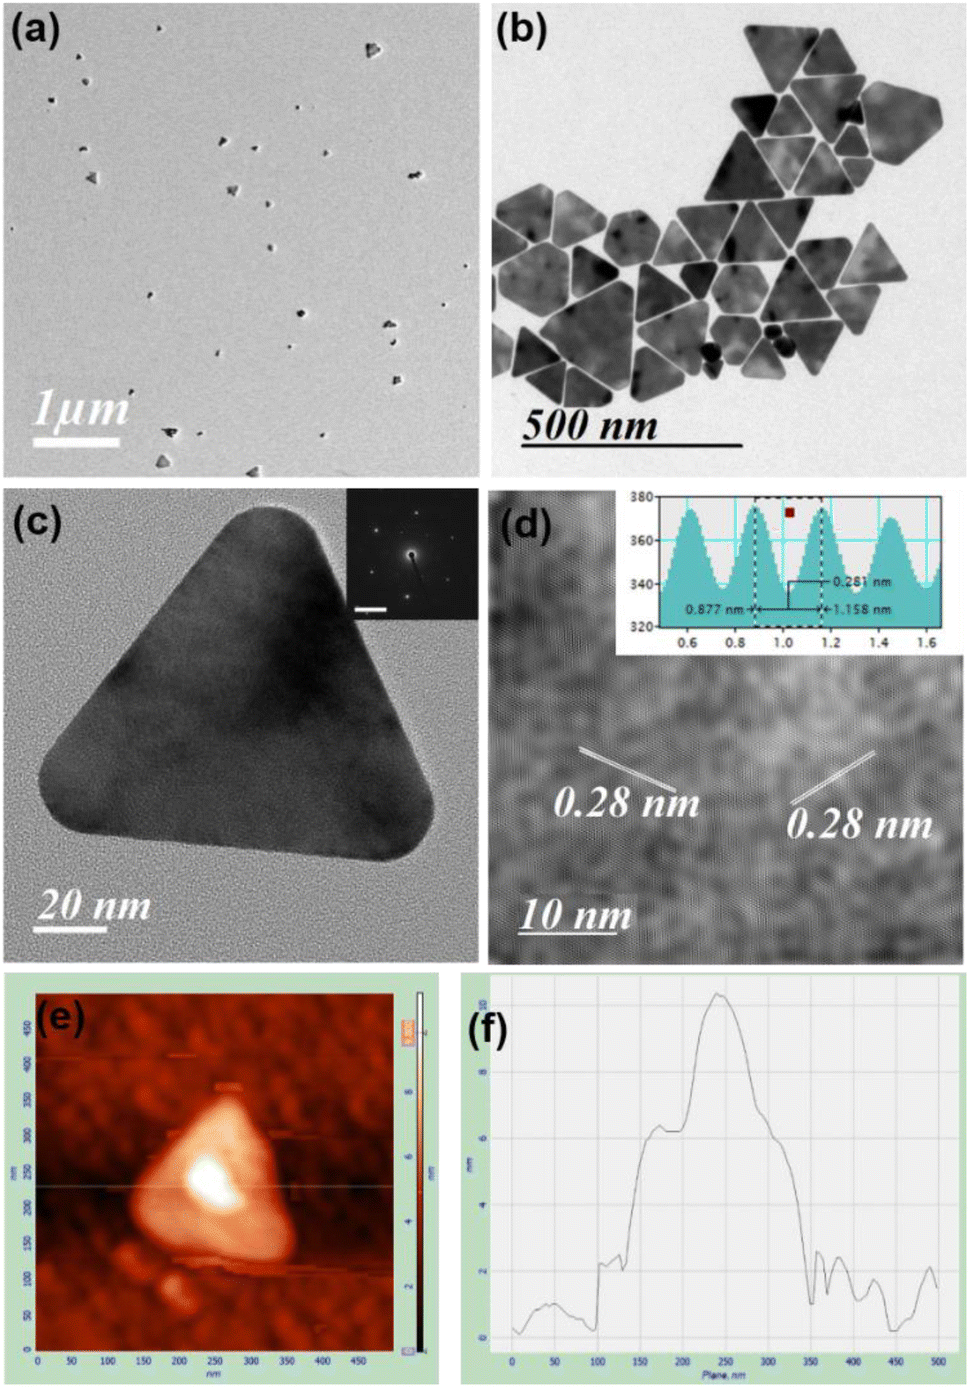 | ||
| Fig. 1 TEM image (a) before and (b) after purification of gold nanoprisms obtained from the reaction between Au:Mn:PEG:HCl in 1:2:0.5:26 after 30 min; (c) HRTEM and SAED (inset) images and (d) fringe lines of nanoprisms and (e and f) AFM image and its analysis for the thickness of nanoprisms. Scale bar: (a) 1000 nm, (b) 500 nm, (c) 20 nm and (d) 10 nm. | ||
HCl concentration dependent kinetics fitting (Fig. 2) with eqn (2) shows almost constant k1 values for 536 nm data (Table 1) within 14–26 equivalents of HCl. However, a significant enhancement of k1 values has been observed by increasing the HCl concentration to 29 equivalents. In the case of 850 nm kinetics, the k1 value decreases within 14–26 equivalents of HCl and has significantly enhanced at 29 equivalents HCl. On the contrary, k2 values are of a similar order for both 536 nm and 850 nm in the presence of 14–29 equivalents of HCl. Comparing these kinetic data with TEM images, it is clear that n1 = 2 deals with the spherical gold nanoparticles and n1 = 1 is associated with gold nanoprism formation. The k1 parameter for 850 nm decreases with the decreasing trend of aggregation of spherical gold nanoparticles in TEM. On the other hand, the k2 parameter decreases when a smaller number of nanoprisms have been observed in TEM. A recent review on the KJMA model34 suggests that the nanoprism formation in our case has been guided through diffusion-controlled growth without having any nucleation. Increasing the concentration of protons from 10 equivalents to 32 equivalents results in protonation of oxygen atoms in PEG, which is responsible for the continuous increase of ζ potential (Fig. S17, ESI†).
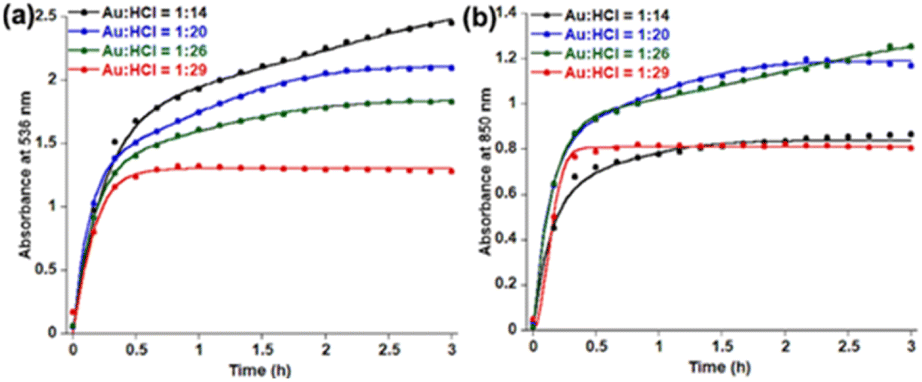 | ||
| Fig. 2 Fitting of time dependent absorbance data at (a) 536 nm and (b) 850 nm in the presence of varying HCl concentration using eqn (2). | ||
| Equiv. of HCl | 536 nm | 850 nm | ||
|---|---|---|---|---|
| Spherical nanoparticle formation | Nanoprism formation | Aggregation of spherical nanoparticle | Nanoprism formation | |
| k 1 (h−2) | k 2 (h−1) | k 1 (h−2) | k 2 (h−1) | |
| 14 | 0.14 | 3.89 | 1.11 | 6.67 |
| 20 | 0.58 | 7.19 | 0.72 | 7.34 |
| 26 | 0.51 | 5.95 | 0.16 | 6.51 |
| 29 | 23.31 | 6.29 | 35.97 | 6.82 |
In order to obtain nanoprisms as the predominant product the reaction with 26 equivalents of HCl has been filtered after 30 min, where kinetic data changes its pattern. However, spherical gold nanoparticle formation cannot be avoided in this condition (Fig. 1a). The gold nanoprism and few planar twinned prisms have been collected as the predominant product (Fig. 1b and S18, S19, ESI†) after few rounds of washing. The high-resolution TEM (HRTEM) for gold nanoprisms confirms the curvature around the tips and presence of fringe lines with 0.28 nm interplanar distance (Fig. 1c and d). Lowering down the temperature from 35 °C to 10 °C, the k2 value significantly decreases and the k1 value remains almost constant (Fig. S20 and Table S2, ESI†). This trend is confirmed via TEM imaging study, where mostly spherical gold nanoparticles have been formed at 10 °C (Fig. S21, ESI†).
Initial slope calculations from 10 min reactions show a decreasing trend of rate with increasing HCl concentration (Fig. S22, ESI†) due to pH dependent non-elementary reaction38 for nanoparticle formation. In order to check the end product of Mn in the reaction, the solution and insoluble precipitate have been analysed carefully. The point and area wise elemental mapping of gold nanoprisms in TEM confirms no significant incorporation of Mn in the solution (Fig. 3a–e) after filtration. XPS analysis of the insoluble product confirms the peaks at 641.9 eV and 653.7 eV for Mn 2p3/2 and 2p1/2, respectively, due to Mn4+ oxidation state (Fig. 3f).39 Survey scan of XPS confirms the presence of MnO2 and trace amount of PEG in the precipitate (Fig. S23, ESI†).
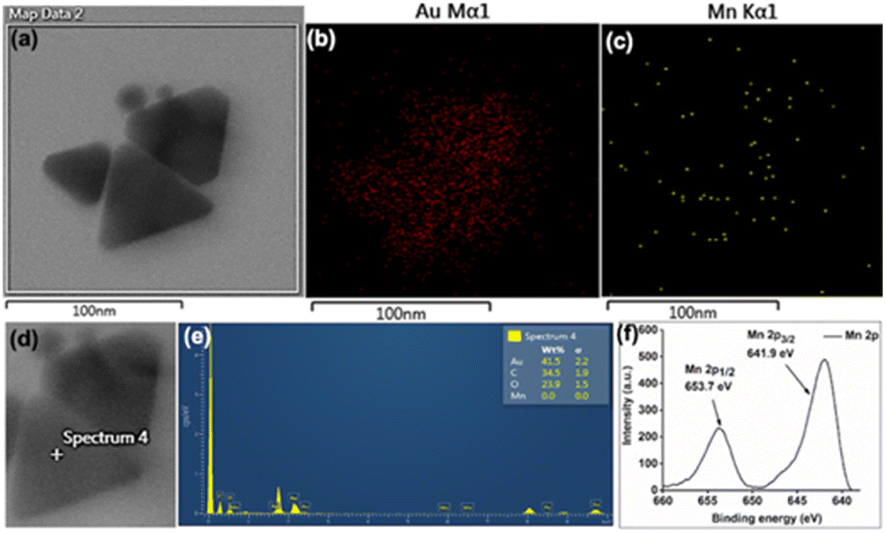 | ||
| Fig. 3 (a–c) Area wise mapping and (d and e) point wise EDX for Au and Mn in gold nanoprisms; (f) XPS data for Mn obtained from the residue after 3 h of reaction. Scale bar: (a–c) 100 nm. | ||
Addition of HCl not only makes the solution acidic, but also introduces more chloride ions in the solution. The pH has been reported to control the crystallographic orientation and growth.40 At lower pH, growth is predominating over nucleation. However, at very low pH reduction of Au3+ to Au0 has been inhibited.41 In our case, anisotropic gold nanoparticles have been formed in the acidic medium after the growth of the nucleated particle with time. In addition to controlling the pH of the solution by HCl, Cl− ion plays an important role through Au+-halide complexes.42 The Mn based reductions have been checked with other acids, such as HNO3, H2SO4 and HBr. In the presence of 26 mM HNO3 and H2SO4 the formation of isotropic gold nanoparticles as major products is confirmed in TEM images (Fig. S24 and S25, ESI†). Cl− ion from HAuCl4 in all these cases is responsible for few gold nanoprism formation. In the presence of 11 mM or higher HBr, the SPR peak has been destabilized (Fig. S26, ESI†). At 8 mM HBr concentration, both the spherical and prism shaped nanoparticles are observed after the synthesis (Fig. S27, ESI†). This study confirms the role of halide ions in the synthesis of anisotropic nanoparticles, similar to another report.43
In order to have better understanding of the growth mechanism, HRTEM images have been monitored at different time intervals. The TEM image after performing the reaction for 10 minutes shows the aggregated gold nanoparticles (Fig. 4a). Only a few nanoprisms have been observed at the same TEM grid. Aggregation and coalescence driven growth pathway44 have been clearly reflected in the TEM image (Fig. 4b). HRTEM analysis suggests oriented attachment along (200) crystallographic planes (Fig. 4c) as observed in another study by us.45 The growth takes place by assembling and merging46 and finally transforming into gold nanoprisms after continuing the reaction for 30 minutes (Scheme 2). The HRTEM of gold nanoprisms shows the presence of the (111) plane along the edges and the (200) plane along the surface (Fig. 4d and 5a).
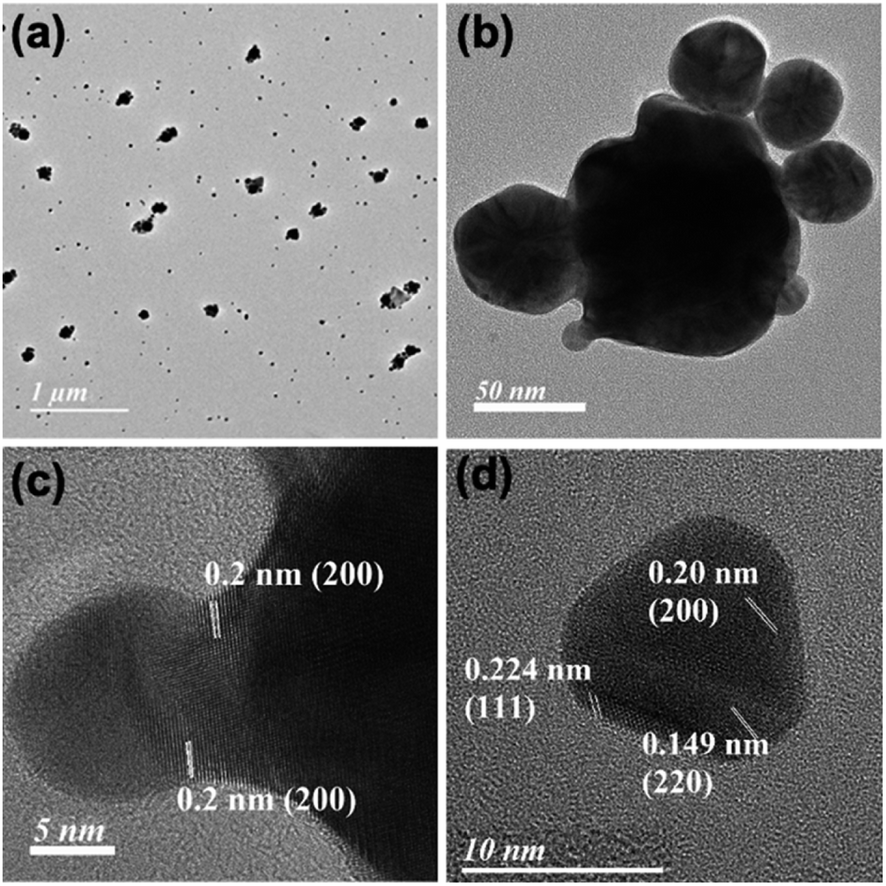 | ||
| Fig. 4 TEM analysis just after 10 min of the reaction showing (a) aggregates, (b) the formation of the spherical nucleated particle, (c) their merging assembly through (200) planes of the gold nanoparticle and (d) nanoprism with (200) and (111) planes along the face and edge, respectively. Scale bar: (a) 1 μm, (b) 50 nm, (c) 5 nm, and (d) 10 nm. | ||
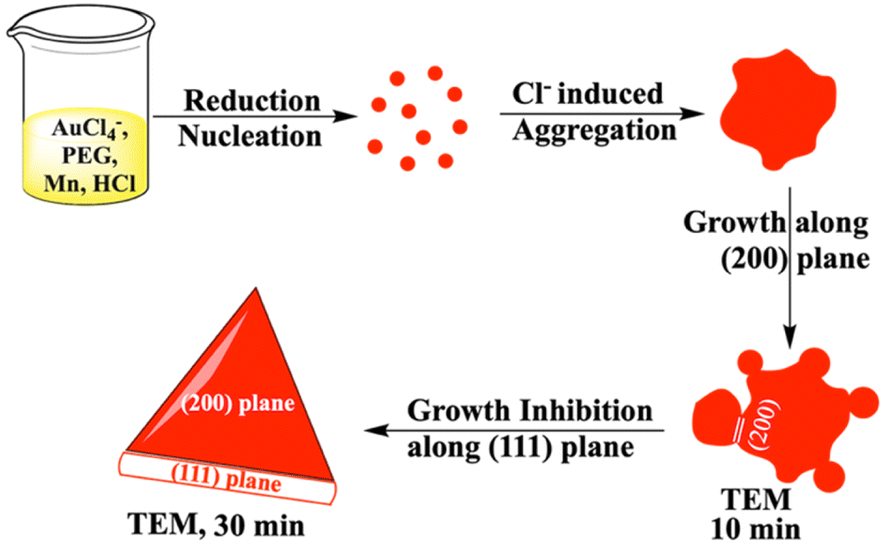 | ||
| Scheme 2 Mechanism of gold nanoprism synthesis from Mn based reduction in the presence of PEG and HCl. | ||
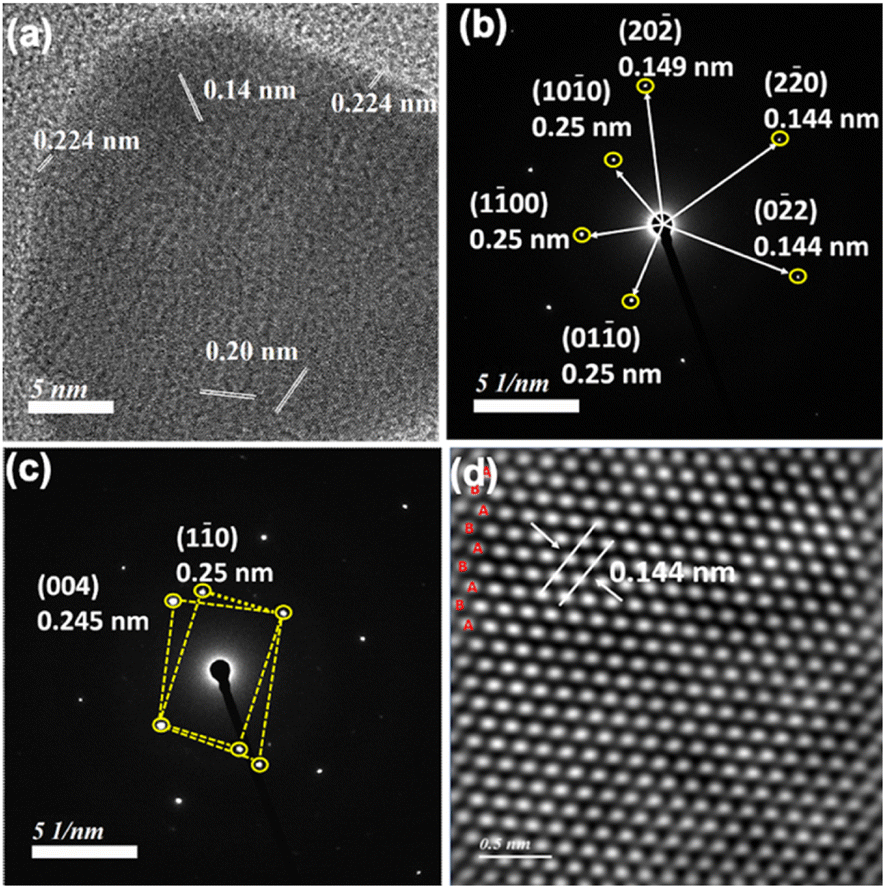 | ||
| Fig. 5 (a) HRTEM, (b) SAED, (c) twinned structure and (d) high-angle annular dark field (HAADF) images showing hcp (2H) unit cells with AB–AB stacking for nanoprisms obtained from Au:Mn:PEG:HCl in 1:2:0.6:26 after 30 min. Scale bar: (a) 5 nm and (d) 0.5 nm. | ||
The equivalent of PEG has been optimized by monitoring 536 nm and 850 nm absorbance in the presence of 0.5–1.2 equivalents of PEG with respect to Au3+ amount in the reaction mixture (Fig. S28, ESI†). Similar to the HCl variation, k1 and k2 values at both the wavelengths have been compared (Table S3, ESI†) and 0.6 equivalents of PEG has been optimized for nanoprism formation. HRTEM analysis of nanoprisms shows hexagonal close packed hcp (2H) unit cells with AB–AB type packing (Fig. 5).47–49 The SAED pattern (Fig. 5b) has been found to be similar to experimental data observed for a cubic Au cell and a hexagonal cell.49 The twinned structure provides a different SAED pattern due to its different crystal orientation. The interplanar distance for this packing has been found to be 0.14 nm, which arises due to (0![[2 with combining macron]](https://www.rsc.org/images/entities/char_0032_0304.gif) 2) planes.50 SAED patterns confirm the presence of the twinned structure.51,52 In the presence of 1.2 equivalents of PEG, the number of nanoprisms has significantly dropped down and small nanoclusters have been observed around the corner of the nanoprisms (Fig. S29, ESI†).
2) planes.50 SAED patterns confirm the presence of the twinned structure.51,52 In the presence of 1.2 equivalents of PEG, the number of nanoprisms has significantly dropped down and small nanoclusters have been observed around the corner of the nanoprisms (Fig. S29, ESI†).
An earlier report suggests that there is a strong influence of pH as well as halide on the nanoprism morphology.53 We have also observed that the optimized amount of HCl concentration is required to balance the pH and halide concentration for the maximum yield of nanoprisms. XRD analysis (Fig S30, ESI†) of the gold nanoprism obtained by varying HCl concentration shows similar planes (111), (002), (022), (311), and (222) corresponding to the fcc structure. Similar to the observed HAADF data (Fig. 5d), we have also observed (002 h) and (101 h) planes corresponding to the hcp structure reported47 for gold nanoparticles.
Similar to HCl variation, the initial rate of the reaction decreases with increasing concentration of PEG (Fig. S31, ESI†). Changing PEG (Mn = 2000) with other sulphur containing ligands such as terminated thiol in polystyrene, lipoic acid, oxidized and reduced glutathione, 3-mercaptopropanoic acid, 6-mercaptoheptanoic acid and other PEG (Mn = 800 and 6000) shows the generation of prominent SPR peaks in few cases. However, the characteristic dual peaks due to nanoprisms are missing for these ligands (Fig. S32, ESI†).
In order to check the role of Mn, Au:Mn has been varied from 1:1.5 to 1:20. A minimum of 1.5 equivalents of Mn has been introduced for reducing Au3+ to Au0. To overcome the poor stability of dual peaks by reduction with 1.5 equivalents of Mn, 2 equivalents of Mn metal has been added. A further increase up to 20 equivalents only increases the amount of spherical gold nanoparticles in the solution (Fig. S33–S35, ESI†). More interestingly, unlike with HCl or PEG variations, the initial rate of SPR peak formation does not vary by increasing Mn metal concentration (Fig. S36, ESI†).
Rough surface gold nanotriangles with abundant hotspots on their surface show better SER performance as compared to gold nanotriangles with a smooth surface.54 We have planned to utilize the nanoprism as a seed for further growth reaction with a standard reducing agent, such as hydroxyl amine. The growth reactions of gold nanoprisms were carried out in the presence of nucleic acids and amino acids with positively charged side chains. In contrast to the preferred ligand binding at the tip of the nanoprism,55 our studies show that growth of gold nanoprisms takes place around the edges or flat surface in the presence of an amine modified single strand nucleic acid sequence (NH2-(CH2)6-ACATCAGT) or amino acids (His, Lys and Arg) with positively charged side chains, respectively (Fig. 6a–d). After the growth reactions, only His shows almost no shift of visible and NIR peaks except enhanced absorbance (Fig. S37–S40, ESI†). The TEM image for His after growth shows formation of longer particles on the prism surface. This overall unique growth pattern in the case of His has been selectively reflected in Raman spectroscopy (Fig. 6e) for the characteristic τ tautomer and π tautomer with a hydrated or dehydrated amide around 1650 cm−1.56
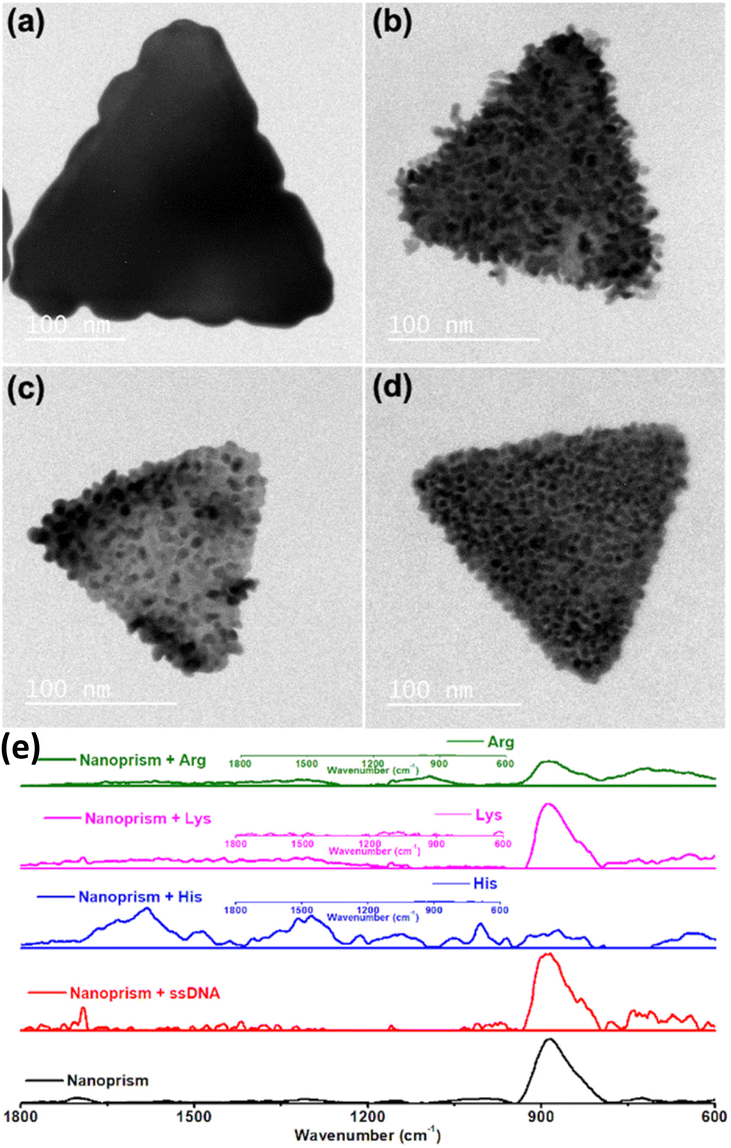 | ||
| Fig. 6 Growth of gold nanoprisms in the presence of (a) amine modified single strand nucleic acid, (b) His, (c) Lys and (d) Arg; (e) Raman spectra of the nanoprism before and after growth reactions. Scale bar: (a–d) 100 nm. | ||
In order to find out the mechanism of different growth reactions at the edge and face, we have carried out the ζ-potential measurement of the purified gold nanoprism. In order to avoid the repulsion, the edge of the negatively charged gold nanoprism (ζ-potential −28.2 mV) having less surface area of the (111) plane has been targeted by the negatively charged nucleic acids during incubation (Scheme 3). On the other hand, the face of the nanoprism with more surface area of the (200) plane has been targeted with amino acids having positively charged side chains (Scheme 3).
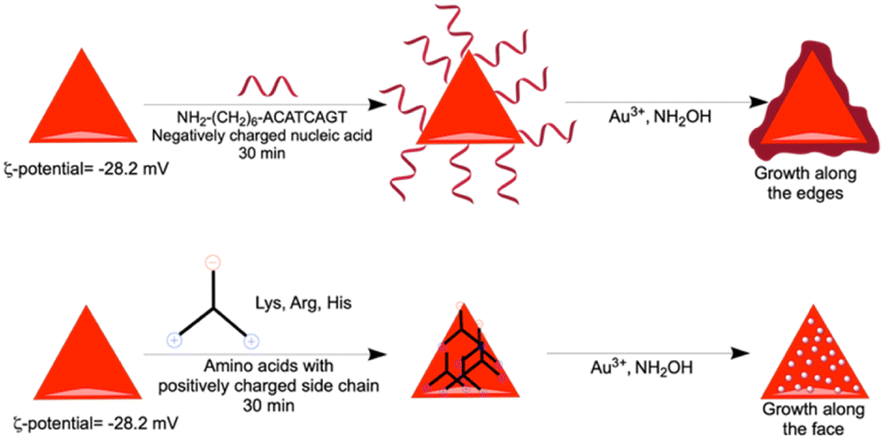 | ||
| Scheme 3 Nanoprism edge and face growth mechanism for nucleic acid and amino acids with positive charge, respectively. | ||
3. Conclusion
In summary, Mn metal has been activated by HCl at lower pH and in combination with PEG, AuCl−4 has been reduced to form PEG stabilized gold nanoprisms. Kinetic optimization study not only guides the better yield of nanoprisms from their competitive spherical nanoparticle synthesis, but also helps to find out the concentration window for HCl and PEG for this synthesis. Interesting morphologies are obtained after growth of the nanoprism around the edge or the surface in the presence of nucleic acid or positively charged amino acids, respectively, as ligands. Among the studied amino acids, the selective growth pattern in the presence of His clearly shows the typical amide vibrations through Raman spectroscopy.4. Experimental details
4.1 Materials required
The chemicals gold(III) chloride trihydrate, different polymers such as poly(ethylene glycol) methyl ether thiol (Mn = 2000, 800, and 6000), and polystyrene thiol terminated, 3-mercaptopropanoic acid, and 6-mercaptohexanoic acid were purchased from Sigma-Aldrich, and trisodium citrate dihydrate was purchased from Merck chemicals. α-Lipoic acid was purchased from TCI India. Hydroxylamine hydrochloride (NH2OH·HCl), glutathione (oxidized and reduced forms), and Mn, Fe, Cr and Zn metal powders were purchased from SISCO Research Laboratory. Lysine, arginine and histidine were purchased from Himedia Laboratories Pvt. Ltd. All the oligonucleotides used in the study were purchased from GeneX India Bioscience Pvt. Ltd.4.2 Characterization
All the kinetic experiments were performed using a Cary UV-Vis-Multicell Peltier (Agilent) within the 200–1100 nm range. The TEM images were taken using an FEI, Technai G2 20 STWIN. The ζ-potential was measured using a Zetasizer Nano ZS90 (Malvern Instruments). XPS experiments were performed with a PHI 5000 Versa Prob II, FEI Inc., and a C60 sputter gun was used for characterization. An FE-SEM (Zeiss Gemini SEM model) was used to analyze the morphological features of the nanoprism. A HRTEM with a ≥ 200 kV Schottky Field Emission Gun (FEG) including a High Voltage Supply Unit was used for taking high resolution TEM images of the nanoprism. HAADF, STEM detectors & imaging modes (maximum magnification up to ≥150 Mx, HAADF resolution = 0.15 nm) used to analyse the crystal packing.4.3 Reaction condition for time dependent absorbance studies
All the syntheses were performed in 3 mL UV cuvettes in a Cary UV-Vis spectrophotometer at 35 °C and 800 rpm adjusting the final reaction volume to 2.5 mL. Poly(ethylene glycol) methyl ether thiol (Mn = 2000) was used for all the kinetics.4.4 Synthesis of gold nanoprisms with varying HCl concentration
Time dependent absorbance studies were performed by varying HCl concentration from Au:HCl = 1:14 to 1:29 without a seed. PEG-SH solution was prepared in water (12 mg mL−1) and 260 mM HCl solution was prepared. 1 mg (0.0025 mmol) HAuCl4 was added in water and kept stirring. After that 250 μL of PEG-SH (3 mg) solution was added, followed by different volumes of 260 mM HCl concentration stock. 0.3 mg (0.005 mmol) Mn metal powder was added finally and the final reaction volume was maintained at 2.5 mL in each case. The absorbance spectra were recorded at an interval of 10 min with continuous stirring for 360 minutes. Similarly the reaction was performed at higher pH using Au:NaOH = 1:26. All the TEM images have been taken from the filtrate after filtration.
4.5 Synthesis of gold nanoprisms with varying PEG-SH amount
Time dependent absorbance studies were performed by varying the PEG-SH amount from 0.50 to 1.20 equivalents amount with respect to Au3+. PEG-SH solution was prepared in water (12 mg mL−1) and 260 mM HCl solution was prepared. 1 mg (0.0025 mmol) HAuCl4 was added in water and kept stirring. After that varying volume of PEG-SH solution was added, followed by 250 μL 260 mM HCl concentration from stock maintaining the final volume at 2.5 mL. The HCl concentration in the final reaction volume is 26 mM. Finally, 0.3 mg (0.005 mmol) Mn was added and absorbance spectra were recorded at an interval of 10 minutes for 360 minutes with continuous stirring. Control reactions were performed using other thiol containing stabilising agents such as α-lipoic acid, oxidised and reduced glutathione, PEG-SH (Mn = 800 and 6000), polystyrene thiol terminated, 3-mercaptopropanoic acid, and 6-mercaptohexanoic acid. The 0.0015 mmol concentration used was equivalent to 3 mg PEG-SH (Mn = 2000). All the TEM images have been taken from the filtrate after filtration.4.6 Synthesis of gold nanoprisms with varying Au![[thin space (1/6-em)]](https://www.rsc.org/images/entities/h3_char_2009.gif) :Mn ratio
:Mn ratio
Time dependent absorbance studies were performed by varying the Au:Mn ratio (1:1.5, 1:2, 1:4, 1:8, 1:14, and 1:20). PEG-SH solution was prepared in water (12 mg mL−1) and 260 mM HCl solution was prepared. 1 mg (0.0025 mmol) HAuCl4 was added in water and kept stirring. After that 250 μL PEG-SH solution (3 mg) was added, followed by 250 μL 260 mM HCl concentration. The HCl concentration in the final reaction volume was 26 mM. Finally varying amount of Mn was added and the final reaction volume was maintained at 2.5 mL in each case. The absorbance spectra were recorded at an interval of 10 minutes for 360 minutes with continuous stirring. All the TEM images have been taken from the filtrate after filtration.
4.7 Gold nanoprism synthesis on a large scale
20 mg (0.05 mmol) HAuCl4 was added to 40 mL water in a round bottom flask. The reaction mixture was stirred at 800 rpm and the temperature was maintained at 35 °C. 5 mL (60 mg) PEG-SH solution was added to the reaction during stirring followed by 5 mL 260 mM HCl such that the HCl concentration in the reaction was 26 mM. Finally, 6 mg Mn metal powder was added to the reaction mixture. The final reaction volume was maintained at 50 mL. The reaction was continued for 30 minutes. After filtration, the filtrate was centrifuged and washed several times with water. The FE-SEM and TEM images were taken before further growth reactions.4.8 Synthesis of gold nanoparticles with HNO3, H2SO4 and HBr
PEG-SH solution was prepared in water (12 mg mL−1) and 260 mM H2SO4 and HNO3 solution was prepared. 1 mg (0.0025 mmol) HAuCl4 was added in water and kept stirring. After that 250 μL of PEG-SH (3 mg) solution was added, followed by 250 μL of 260 mM acid concentration stock. The acid concentration was 26 mM in the final reaction volume. 0.3 mg (0.005 mmol) Mn metal powder was added finally and the final reaction volume was maintained at 2.5 mL in each case. The absorbance spectra were recorded at an interval of 10 min with continuous stirring. The TEM images were taken after filtering the reaction mixture. The reaction was performed using HBr following a similar procedure using 8 mM and 11 mM final concentrations. The absorbance spectra were recorded at an interval of 10 min with continuous stirring. The TEM image was taken after performing reaction using 8 mM HBr for 80 min.4.9 Growth reaction performed using DNA (amine-5′-ACATCAGT-3′) concentration
The gold nanoprism seed stock prepared was diluted with water such that the intensity of absorbance was kept constant at 0.45.20 mL 200 mM hydroxylamine hydrochloride (NH2OH·HCl) solution was prepared with the pH adjusted to 5 and stored in a refrigerator. 300 μL gold nanoprism seed was incubated with DNA (50 nM) for 30 minutes. 3 μL 200 mM NH2OH was added to the seed solution and vigorously stirred for 10 minutes. 5 μL of 0.8% w/v HAuCl4 was then added to the solution. More intense purple colour was observed after the reaction and absorbance spectra were recorded.4.10 Growth reaction performed in the presence of amino acids
300 μL gold nanoprism seed was incubated with 9 mM amino acid for 30 minutes. 3 μL 200 mM NH2OH was added to the seed solution and vigorously stirred for 10 minutes. 5 μL of 0.8% w/v HAuCl4 was added to the solution. More intense purple colour was observed after the reaction and absorbance spectra were recorded.Author contributions
K. K. S. has conceived the idea and written the manuscript. K. B. performed all the experiments related to nanoprism synthesis, Raman experiment and written the manuscript. M. A. S. performed the growth of gold nanoprism in presence of amino acids. All authors discussed the results and commented on the manuscript.Conflicts of interest
There are no conflicts to declare.Acknowledgements
K. K. S. acknowledges the SERB-DST grant (CRG/2018/000269) for funding.References
- T. Hiyama, M. Sawahata and M. Obayashi, Chem. Lett., 1983, 1237–1238 CrossRef CAS.
- G. Cahiez and P.-Y. Chavant, Tetrahedron Lett., 1989, 30, 7373–7376 CrossRef CAS.
- W. Si, X. Zhang, S. Lu, T. Yasuda, N. Asao, L. Han, Y. Yamamoto and T. Jin, Sci. Rep., 2015, 5, 13920 CrossRef PubMed.
- M. L. H. Green and C. R. Lucas, J. Chem. Soc., Dalton Trans., 1972, 1000–1003 RSC.
- R. S. P. Coutts, P. C. Wailes and R. L. Martin, J. Organomet. Chem., 1973, 47, 375–382 CrossRef CAS.
- F. Wang, Y. Chen, W. Rao, L. Ackermann and S.-Y. Wang, Nat. Commun., 2022, 13, 2588 CrossRef CAS PubMed.
- R. Río-Rodríguez, L. Blanco, A. Collado, J. A. Fernández-Salas and J. Alemán, Chem.–Eur. J., 2022, 28, e202201644 Search PubMed.
- Y.-Z. Yang, Y. Li, G.-F. Lv, D.-L. He and J.-H. Li, Org. Lett., 2022, 24, 5115–5119 CrossRef CAS PubMed.
- S.-H. Kim, M. V. Hanson and R. D. Rieke, Tetrahedron Lett., 1996, 37, 2197–2200 CrossRef CAS.
- R. D. Rieke and S.-H. Kim, J. Org. Chem., 1998, 63, 5235–5239 CrossRef CAS.
- A. Fürstner and H. Brunner, Tetrahedron Lett., 1996, 37, 7009–7012 CrossRef.
- K. Takai, T. Ueda, T. Hayashi and T. Moriwake, Tetrahedron Lett., 1996, 37, 7049–7052 CrossRef CAS.
- Z. Peng and P. Knochel, Org. Lett., 2011, 13, 3198–3201 CrossRef CAS PubMed.
- W. I. Nicholson, J. L. Howard, G. Margi, A. C. Seastram, A. Khan, R. R. A. Bolt, L. C. Morrill, E. Richards and D. L. Browne, Angew. Chem., Int. Ed., 2021, 60, 23128–23133 CrossRef CAS PubMed.
- A. C. Jones, J. A. Leitch, S. E. Raby-Buck and D. L. Browne, Nat. Synth., 2022, 1, 763–775 CrossRef.
- R. Takahashi, P. Gao, K. Kubota and H. Ito, Chem. Sci., 2023, 14, 499–505 RSC.
- S. Stangherlin, N. Cathcart, F. Sato and V. Kitaev, ACS Appl. Nano Mater., 2020, 3, 8304–8318 CrossRef CAS.
- Y. Song, Y. Li, M. Zhou, H. Li, T. Xu, C. Zhou, F. Ke, D. Huo, Y. Wan, J. Jie, W. W. Xu, M. Zhu and R. Jin, Nat. Commun., 2022, 13, 1235 CrossRef CAS PubMed.
- Y. Li, H. Lin, W. Zhou, L. Sun, D. Samanta and C. A. Mirkin, Sci. Adv., 2021, 7, eabf1410 CrossRef CAS PubMed.
- L. Scarabelli and L. M. Liz-Marzán, ACS Nano, 2021, 15, 18600–18607 CrossRef CAS PubMed.
- Z. Sun, A. Umar, J. Zeng, X. Luo, L. Song, Z. Zhang, Z. Chen, J. Li, F. Su and Y. Huang, ACS Appl. Nano Mater., 2022, 5, 1220–1231 CrossRef CAS.
- L. Chen, F. Ji, Y. Xu, L. He, Y. Mi, F. Bao, B. Sun, X. Zhang and Q. Zhang, Nano Lett., 2014, 14, 7201–7206 CrossRef CAS PubMed.
- M. A. Wall, S. Harmsen, S. Pal, L. Zhang, G. Arianna, J. R. Lombardi, C. M. Drain and M. F. Kirche, Adv. Mater., 2017, 29, 1605622 CrossRef PubMed.
- S. A. Lone, P. Sanyal, P. Das and K. K. Sadhu, ChemistrySelect, 2019, 4, 8237–8245 CrossRef CAS.
- K. Bharti, S. A. Lone, A. Singh, S. Nathani, P. Roy and K. K. Sadhu, Front. Chem., 2021, 9, 639090 CrossRef CAS PubMed.
- B. Douglas, D. McDaniel and J. Alexander, Concepts and Models of Inorganic Chemistry, Wiley & Sons, New York, 3rd edn, 1994, Chapter 8 Search PubMed.
- S. Palmal, S. K. Basiruddin, A. R. Maity, S. C. Ray and N. R. Jana, Chem.–Eur. J., 2013, 19, 943–949 CrossRef CAS PubMed.
- J. E. Millstone, S. J. Hurst, G. S. Me’traux, J. I. Cutler and C. A. Mirkin, Small, 2009, 5, 646–664 CrossRef CAS PubMed.
- L. Liu, C. A. Burnyeat, R. S. Lepsenyi, I. O. Nwabuko and T. L. Kelly, Chem. Mater., 2013, 25, 4206–4214 CrossRef CAS.
- S. Stangherlin, N. Cathcart, F. Sato and V. Kitaev, ACS Appl. Nano Mater., 2020, 3, 8304–8318 CrossRef CAS.
- S. I. Stoeva, B. L. V. Prasad, S. Uma, P. K. Stoimenov, V. Zaikovski, C. M. Sorensen and K. J. Klabunde, J. Phys. Chem. B, 2003, 107, 7441–7448 CrossRef CAS.
- S. Nijjer, J. Thonstad and G. M. Haarberg, Electrochim. Acta, 2000, 46, 395–399 CrossRef CAS.
- T. J. Norman, C. D. Grant, D. Magana, J. Z. Zhang, J. Liu, D. Cao, F. Bridges and A. V. Buuren, J. Phys. Chem. B, 2002, 106, 7005–7012 CrossRef CAS.
- J. S. Blázquez, F. J. Romero, C. F. Conde and A. Conde, Phys. Status Solidi B, 2022, 259, 2100524 CrossRef.
- T. S. Sabir, D. Yan, J. R. Milligan, A. W. Aruni, K. E. Nick, R. H. Ramon, J. A. Hughes, Q. Chen, R. S. Kurti and C. C. Perry, J. Phys. Chem. C, 2012, 116, 4431–4441 CrossRef CAS.
- S. P. Shields, V. N. Richards and W. E. Buhro, Chem. Mater., 2010, 22, 3212–3225 CrossRef CAS.
- P. N. Njoki, J. Luo, M. M. Kamundi, S. Lim and C.-J. Zhong, Langmuir, 2010, 26, 13622–13629 CrossRef CAS PubMed.
- V. Onesto, F. Gentile, M. Russo, M. Villani, P. Candeloro, G. Perozziello, N. Malara, E. D. Fabrizio and M. L. Coluccio, Langmuir, 2019, 35, 14258–14265 CrossRef CAS PubMed.
- J. Jiang and A. Kucernak, Electrochim. Acta, 2002, 47, 2381–2386 CrossRef CAS.
- M. R. Rahman, F. S. Saleh, T. Okajima and T. Ohsaka, Langmuir, 2011, 27, 5126–5135 CrossRef CAS PubMed.
- C. G. Yuan, C. Huo, S. Yu and B. Gui, Physica E Low Dimens Syst Nanostruct., 2017, 85, 19–26 CrossRef CAS.
- M. R. Langille, M. L. Personick, J. Zhang and C. A. Mirkin, J. Am. Chem. Soc., 2012, 134, 14542–14554 CrossRef CAS PubMed.
- J. S. DuChene, W. Niu, J. M. Abendroth, Q. Sun, W. Zhao, F. Huo and W. D. Wei, Chem. Mater., 2013, 25, 1392–1399 CrossRef CAS.
- B. Huang, L. Miao, J. Li, Z. Xie, Y. Wang, J. Chai and Y. Zhai, Nat. Commun., 2022, 13, 1402 CrossRef CAS PubMed.
- J. K. Sahu, S. A. Lone and K. K. Sadhu, Langmuir, 2022, 38, 5865–5873 CrossRef CAS PubMed.
- J. Lee, J. Yang, S. G. Kwon and T. Hyeon, Nat. Rev. Mater., 2016, 1, 16034 CrossRef CAS.
- X. Huang, S. Li, Y. Huang, S. Wu, X. Zhou, S. Li, C. L. Gan, F. Boey, C. A. Mirkin and H. Zhang, Nat. Commun., 2011, 2, 292 CrossRef PubMed.
- Z. Fan, M. Bosman, X. Huang, D. Huang, Y. Yu, K. P. Ong, Y. A. Akimov, L. Wu, B. Li, J. Wu, Y. Huang, Q. Liu, C. E. Png, C. L. Gan, P. Yang and H. Zhang, Nat. Commun., 2015, 6, 7684 CrossRef CAS PubMed.
- M. C. Mendoza-Ramirez, H. G. Silva-Pereyra and M. Avalos-Borja, Mater. Charact., 2020, 164, 110313 CrossRef CAS.
- W. Li, W. Tong, A. Yadav, E. Bladt, S. Bals, A. M. Funston and J. Etheridge, Chem. Mater., 2021, 33, 9152–9164 CrossRef CAS.
- X. Liu, T. H. Man, J. Yin, X. Lu, S. Q. Guo, T. Ohmura and D. H. Ping, Sci. Rep., 2018, 8, 14454 CrossRef CAS PubMed.
- Z. C. Canbek, R. Cortes-Huerto, F. Testard, O. Spalla, S. Moldovan, O. Ersen, A. Wisnet, G. Wang, J. Goniakowski and C. Noguera, Cryst. Growth Des., 2015, 15, 3637–3644 CrossRef CAS.
- T. H. Ha, H. J. Koo and B. H. Chung, J. Phys. Chem. C, 2007, 111, 1123–1130 CrossRef CAS.
- S. Z. Qu, Y. X. Zhao, H. S. Kang, J. W. Zou, L. Ma, S. J. Ding and X. B. Chen, ACS Omega, 2022, 7, 48438–48446 CrossRef CAS PubMed.
- A. Kim, S. Zhou, L. Yao, S. Ni, B. Luo, C. E. Sing and Q. Chen, J. Am. Chem. Soc., 2019, 141, 11796–11800 CrossRef CAS PubMed.
- A. Ghosh, M. J. Tucker and F. Gai, J. Phys. Chem. B, 2014, 118, 7799–7805 CrossRef CAS PubMed.
Footnote |
| † Electronic supplementary information (ESI) available: Supporting figures and tables. See DOI: https://doi.org/10.1039/d3na00292f |
| This journal is © The Royal Society of Chemistry 2023 |