
 Open Access Article
 This Open Access Article is licensed under a Creative Commons Attribution-Non Commercial 3.0 Unported Licence
In situ preparation of double gradient anode materials based on polysiloxane for lithium-ion batteries†
Siqi
Guan
 a,
Chen
Xu
a,
Yuanjiang
Chen
a,
Yongjin
Zhang
a,
Lixiang
Li
ab,
Han
Zhang
a,
Baigang
An
*ab,
Haiming
Yang
ab,
Weimin
Zhou
ab,
Chengguo
Sun
ac,
Dongying
Ju
b and
Xin
Geng‡
*ab
a,
Chen
Xu
a,
Yuanjiang
Chen
a,
Yongjin
Zhang
a,
Lixiang
Li
ab,
Han
Zhang
a,
Baigang
An
*ab,
Haiming
Yang
ab,
Weimin
Zhou
ab,
Chengguo
Sun
ac,
Dongying
Ju
b and
Xin
Geng‡
*ab
aInstitute of Energy Materials and Electrochemistry Research, University of Science and Technology Liaoning, Anshan 114051, PR China. E-mail: gengxin60@163.com; bgan@ustl.edu.cn
bHainan Provincial Key Lab of Fine Chemistry, School of Chemical Engineering and Technology, Hainan University, Haikou 570228, China
cSchool of Chemical Engineering, Nanjing University of Science and Technology, Nanjing 210094, China
First published on 22nd June 2023
Abstract
Although silicon has a high volumetric energy density as an anode material for Li-ion batteries, its volumetric expansion and sluggish Li+ migration kinetics need to be urgently addressed. In this work, cage-like structure materials (HRPOSS) derived from the in situ hydrogen reduction of polyhedral oligomeric silsesquioxane (T8-type POSS) were constructed as an Si@C anode for Li-ion batteries. Benefiting from the intriguing features of the Si/N double gradient and even-distributed silicon, HRPOSS-6 exhibited faint volume changes and fast ion-electron kinetics. Moreover, the uniformly immobilized nano-silicic and concentration gradient were favorable for accelerated ion migration. Therefore, HRPOSS-6 exhibited good electrochemical performances given that its cage structure could relieve the volume expansion. HRPOSS-6 demonstrated a high reversible capacity of 1814.1 mA h g−1 and long cycling performance after 200 cycles with 635 mA h g−1 at a current density of 0.5 A g−1. Accordingly, this Si/C/N composite exhibited great potential for high energy Li-ion batteries, where the corresponding full-cell (HRPOSS-6//LiNi0.6Co0.2Mn0.2O2) showed a cycle life of 200 cycles with over 80% capacity retention at rate of 1C. This work exploits the concentration gradients of dual elements for the capacity improvement of Si anodes and offers insight into the development of high-performance Si@C anode materials for advanced Li-ion batteries.
1. Introduction
For the extensive usage of Li-ion batteries in portable electronics such as mobile phones and laptops, and the automotive market, there is an urgent demand for high-energy density batteries.1,2 In this case, graphite anodes provide excellent stability and safety, but their capacity does not exceed the theoretical value of 372 mA h g−1.3 Furthermore, to meet the consumer demand for lighter, larger capacity and faster charging/discharging, there is still strong interest in developing new materials to achieve these goals.4–6 Among the different Li-ion storage hosts, silicon-based anode materials have the advantages of relatively low discharge potential plateau and exceptionally high theoretical specific capacity.7 However, they also suffer from large volume expansion/contraction (∼300%) during lithiation/delithiation, which leads to particle pulverization, higher resistance to ionic transport, and plummeting coulombic efficiency.8,9Thus, to solve the above-mentioned issues, several strategies have been carried out, such as (i) composites of nano-silicon particles, which were coated on matrix materials to inhibit the expansion of silicon (mechanical stress) or provide free space to alleviate volume expansion (tensile stress),10–13 (ii) interconnected conductive networks and hierarchical mesoporous structure of three-dimensional (3D) porous Si/C nanoarchitectures14–17 and (iii) space-confined catalytic strategy, which encapsulates uniformly silicon nanoparticles.9,18,19 However, despite the tremendous progress toward these strategies, these approaches exhibit some intrinsic drawbacks. Thus, it is necessary to discover new Si@C anode materials to realize a reversible capacity and maintain the electrochemical long-term cycle stability and rate performance.
Here, we propose a facile and efficient approach for the preparation of an Si anode, which was constructed using an Si/N double gradient and silicic even-distribution to simultaneously buffer the volume expansion during lithiation and expedite the charge/ion migration. Specifically, γ-aminopropyltriethoxysilane underwent hydrolysis and condensation reaction, two basic reactions to form a broken chain linear oligomer. Subsequently, monocycle, polycyclic and POSS with a cage-like structure (T8 type) were produced. As illustrated in Fig. 1, we fabricated these fascinating features via the hydrolysis of POSS, and then hydrogen reduction. The desired characteristics were derived simultaneously, namely, the Si/N double gradient structure, which is desirable to reduce the volume expansion, increase the electronic conductivity through silicic even-distribution and achieve the N@C@Si integral structure. The concentration gradient of HRPOSS was investigated by XPS relative atomic concentration with Ar-ion sputtering. The bonded silicon was uniformly anchored in the silicon oxycarbide (SiOxC4−x) and improved the particle agglomeration caused by the uneven volume expansion. Also, the concentration gradient also promoted the reaction kinetics.
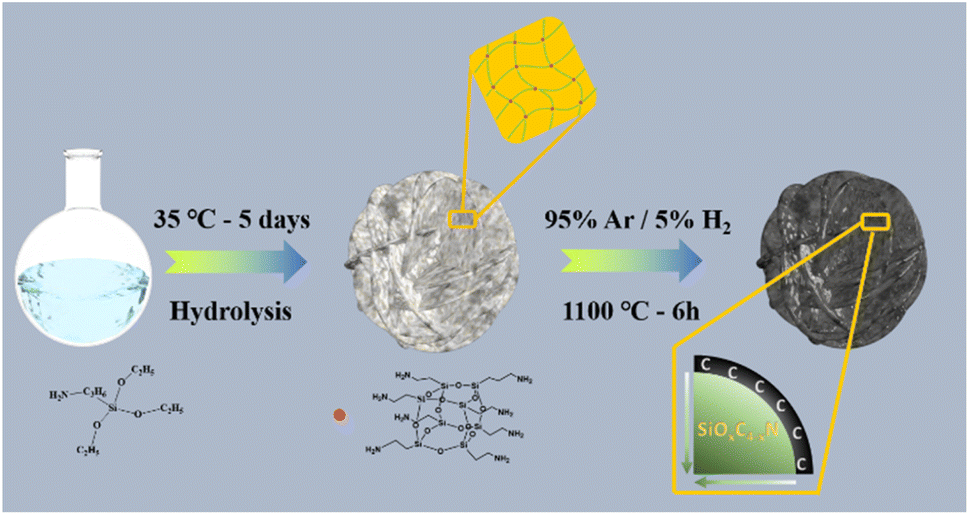 | ||
| Fig. 1 Schematic diagram for the synthesis of HRPOSS. | ||
2. Experimental
2.1 Synthesis of HRPOSS
In this work, the precursor was prepared via the hydrolysis and condensation processes of γ-aminopropyltriethoxysilane (C9H23NO3Si). Firstly, hexadecyl trimethyl ammonium bromide (CTAB, 1.6 g) and 720 mL of methyl-alcohol were mixed in a glass container, vigorously stirred for about 60 min, and then 30 mL C9H23NO3Si was added. Then, 80 mL hydrochloric acid (HCl) was slowly added to the mixture as a catalyst. The reaction was terminated by slowly adding 500 mL tetrahydrofuran (THF) after 5 days at ambient temperature together with the precipitation of white precipitates (POSS). The solution was filtered, and the white precipitate was gathered and dried at 75 °C under vacuum to remove the residual solvent.The precursor was calcined to form monolithic HRPOSS under 5% H2/Ar flow at 1100 °C for different sintering times of 1.5, 3, and 6 h. The products were denoted as HRPOSS-1.5, HRPOSS-3, HRPOSS-6, and HRPOSS-7.5, respectively.
2.2 Structural and microstructural characterization
X-ray diffraction (XRD) measurements of the samples were performed using a D8 Advance XRD (Bruker, Germany) with CuKα radiation. Micro-Raman spectra were recorded with a HORIBA Xplora Plus (Horiba, Japan), using an Ar-ion laser with a wavelength of 532.4 nm. Spectra were recorded in the Raman shift range of 0 to 4000 cm−1. The amount of free carbon in HRPOSS was estimated by thermogravimetric analysis (TGA) in an air flow. Thermogravimetric analysis (TGA) was performed using a TGA Q600 SDT (TA Instruments, America) at 2 °C min−1 in an air flow (100 mL min−1) up to 1100 °C. Functional group identification in the pyrolyzed HRPOSS samples was investigated by Fourier transform infrared (FT-IR) spectroscopy. FT-IR spectra were collected in transmission mode using an ALPHA II (Bruker, Germany) in the range of 4000–400 cm−1. The surface chemistry of HRPOSS was characterized by X-ray photoelectron spectroscopy (XPS), using an ESCALAB 250Xi XPS microscope (Thermo Scientific, USA). The relative atomic concentration of HRPOSS was measured by XPS at 4 min intervals with Ar-ions at 5 keV (five sites were randomly selected). 29Si solid-state nuclear magnetic resonance was performed using 29Si MAS-NMR (Bruker Avance III 400 MHz, Bruker). The specific surface area (SSA), porosity, and pore size of HRPOSS were investigated by N2 physisorption using an ASAP2020 instrument (Micromeritics, USA). The pore size distribution (PSD) curves were evaluated using DFT analysis (density functional theory) from the desorption isotherm. The structure of the composites was characterized by scanning electron microscopy (SEM, FEI Apreo) with an energy dispersive X-ray spectroscopy (EDS) analyser and transmission electron microscopy (TEM, JEM-2100F) equipped with a selected area electron diffraction (SAED) analyser.2.3 Electrochemical characterization
The working electrode was prepared by coating the slurry of sample, carbon black (Super P), and carboxymethyl cellulose (CMC) binder with mass ratio of 8![[thin space (1/6-em)]](https://www.rsc.org/images/entities/char_2009.gif) :1:1 on copper foil with a mass loading of 1.3–1.8 mg cm−2 by an automatic thick film coater. Subsequently, the working electrode was dried at 80 °C for 12 h under vacuum. The coin cells (CR2032 type) were assembled in a glove box (UNILAB Pro, MBRAUN, Germany) using Li foil as a counter electrode and 1 M LiPF6 in a mixture of ethylene carbonate/diethylene carbonate/methyl carbonate (1:1:1 v/v) as the electrolyte. The electrochemical measurements were carried out on a LANDCT3001A battery tester (Wuhan LAND Electronics Co., Ltd., China). Cyclic voltammetry (CV) and electrochemical impedance spectroscopy (EIS) were conducted on a Gamry Instruments (Reference 3000 Workstation, Gamry Instruments, USA). The CV curves were measured at a scan rate of 0.1 mV s−1 in the potential range of 0.005–1.5 V (vs. Li/Li+). EIS spectra were measured in the frequency range of 0.01–105 Hz with an AC perturbation of 5 mV. The full cells were assembled with prelithiated HRPOSS-6 as the anode and commercial Li(Ni0.6Co0.2Mn0.2)O2 (NCM622) as the cathode. The ratio of negative electrode and positive electrode capacity was about 1.1:1. To fabricate the coin cells, NCM622:PVDF:Super P (8:1:1 by weight) was used as the cathode with a mass loading of 2.6–3.3 mg cm−2. GCD was carried out to evaluate the electrochemical performance between 2.8 V and 4.35 V at 1C.
:1:1 on copper foil with a mass loading of 1.3–1.8 mg cm−2 by an automatic thick film coater. Subsequently, the working electrode was dried at 80 °C for 12 h under vacuum. The coin cells (CR2032 type) were assembled in a glove box (UNILAB Pro, MBRAUN, Germany) using Li foil as a counter electrode and 1 M LiPF6 in a mixture of ethylene carbonate/diethylene carbonate/methyl carbonate (1:1:1 v/v) as the electrolyte. The electrochemical measurements were carried out on a LANDCT3001A battery tester (Wuhan LAND Electronics Co., Ltd., China). Cyclic voltammetry (CV) and electrochemical impedance spectroscopy (EIS) were conducted on a Gamry Instruments (Reference 3000 Workstation, Gamry Instruments, USA). The CV curves were measured at a scan rate of 0.1 mV s−1 in the potential range of 0.005–1.5 V (vs. Li/Li+). EIS spectra were measured in the frequency range of 0.01–105 Hz with an AC perturbation of 5 mV. The full cells were assembled with prelithiated HRPOSS-6 as the anode and commercial Li(Ni0.6Co0.2Mn0.2)O2 (NCM622) as the cathode. The ratio of negative electrode and positive electrode capacity was about 1.1:1. To fabricate the coin cells, NCM622:PVDF:Super P (8:1:1 by weight) was used as the cathode with a mass loading of 2.6–3.3 mg cm−2. GCD was carried out to evaluate the electrochemical performance between 2.8 V and 4.35 V at 1C.
3. Results and discussion
Polymer-derived ceramics (PDCs) are a new class of ceramics, which are obtained through the solid-state pyrolysis of preceramic polymers.20 Silicon oxycarbide exhibits a superior electrochemical performance as a lithium-ion battery anode material.21 The uniformly immobilized nano-silicic and N@Si element gradient structure can promote the transport of both electrons and ions, and effectively relieve the volume expansion together with embedding Li+ in the Si anode. All the unique features originated from the process of hydrogen gas reduction at 1100 °C for POSS (morphological characteristics are shown in Fig S3a, ESI†). For instance, HRPOSS showed a weak electrochemical performance when the sinter temperature was less than 1100 °C (Fig S1, ESI†), indicating that the degree of crystallinity of Si is dependent on its sintering temperature and time. However, the electrochemical performance of POSS pyrolyzed at 1100 °C for 7.5 h decreased sharply, implying that the sintering time of 6 h is suitable. Therefore, we only analyzed the relationship between performance and structure for the sintering time of 1.5 h, 3 h and 6 h, and the samples were denoted as HRPOSS-1.5, HRPOSS-3, and HRPOSS-6, respectively. The crystalline structure of HRPOSS was characterized by XRD measurements (Fig. 2a). The XRD patterns of HRPOSS displayed a broad peak in the 2θ range of 18–30°, which can be assigned to amorphous SiOx and carbon.22,23 Meanwhile, it is notable that HRPOSS-6 exhibited a stronger peak intensity than the other two samples, demonstrating the higher crystallinity of amorphous silicon for HRPOSS-6 derived from a prolonged pyrolysis time of the polyaminosiloxane precursor. Meanwhile, the characteristic peak of graphitized carbon appeared obviously in the 2θ range of 40–50°, revealing better electron conductivity than other samples. In addition, we also evaluated the graphitization degree by Raman spectroscopy, which is a non-destructive tool for the integral examination of the microstructural features of the free carbon phase in HRPOSS. As shown in Fig. 2b, the most important bands are the so-called disorder-induced D-band at approx. 1338 cm−1 and the G-band at approx. 1589 cm−1, which are related to the C–C vibrational mode assigned to the doubly degenerate E2g. The weak band at 469 cm−1 is associated with amorphous silica.24,25 Deconvolution of the Raman spectra also yielded T and D′′ bands, which originated from the presence of sp2–sp3C–C/C![[double bond, length as m-dash]](https://www.rsc.org/images/entities/char_e001.gif) C and the conversion of amorphous carbon into graphitic carbon at around 1200 cm−1 and 1500 cm−1, respectively26 (Fig. S2a, ESI†). The intensity of the T and D′′ bands was enhanced with an increase in the sintering time, suggesting the presence of more graphite edges and defect sites, which will facilitate the transport of Li+ to Si.27 The intensity ratio (ID/IG) of HRPOSS-1.5, HRPOSS-3 and HRPOSS-6 samples was 1.24, 1.36 and 1.39, respectively.
C and the conversion of amorphous carbon into graphitic carbon at around 1200 cm−1 and 1500 cm−1, respectively26 (Fig. S2a, ESI†). The intensity of the T and D′′ bands was enhanced with an increase in the sintering time, suggesting the presence of more graphite edges and defect sites, which will facilitate the transport of Li+ to Si.27 The intensity ratio (ID/IG) of HRPOSS-1.5, HRPOSS-3 and HRPOSS-6 samples was 1.24, 1.36 and 1.39, respectively.
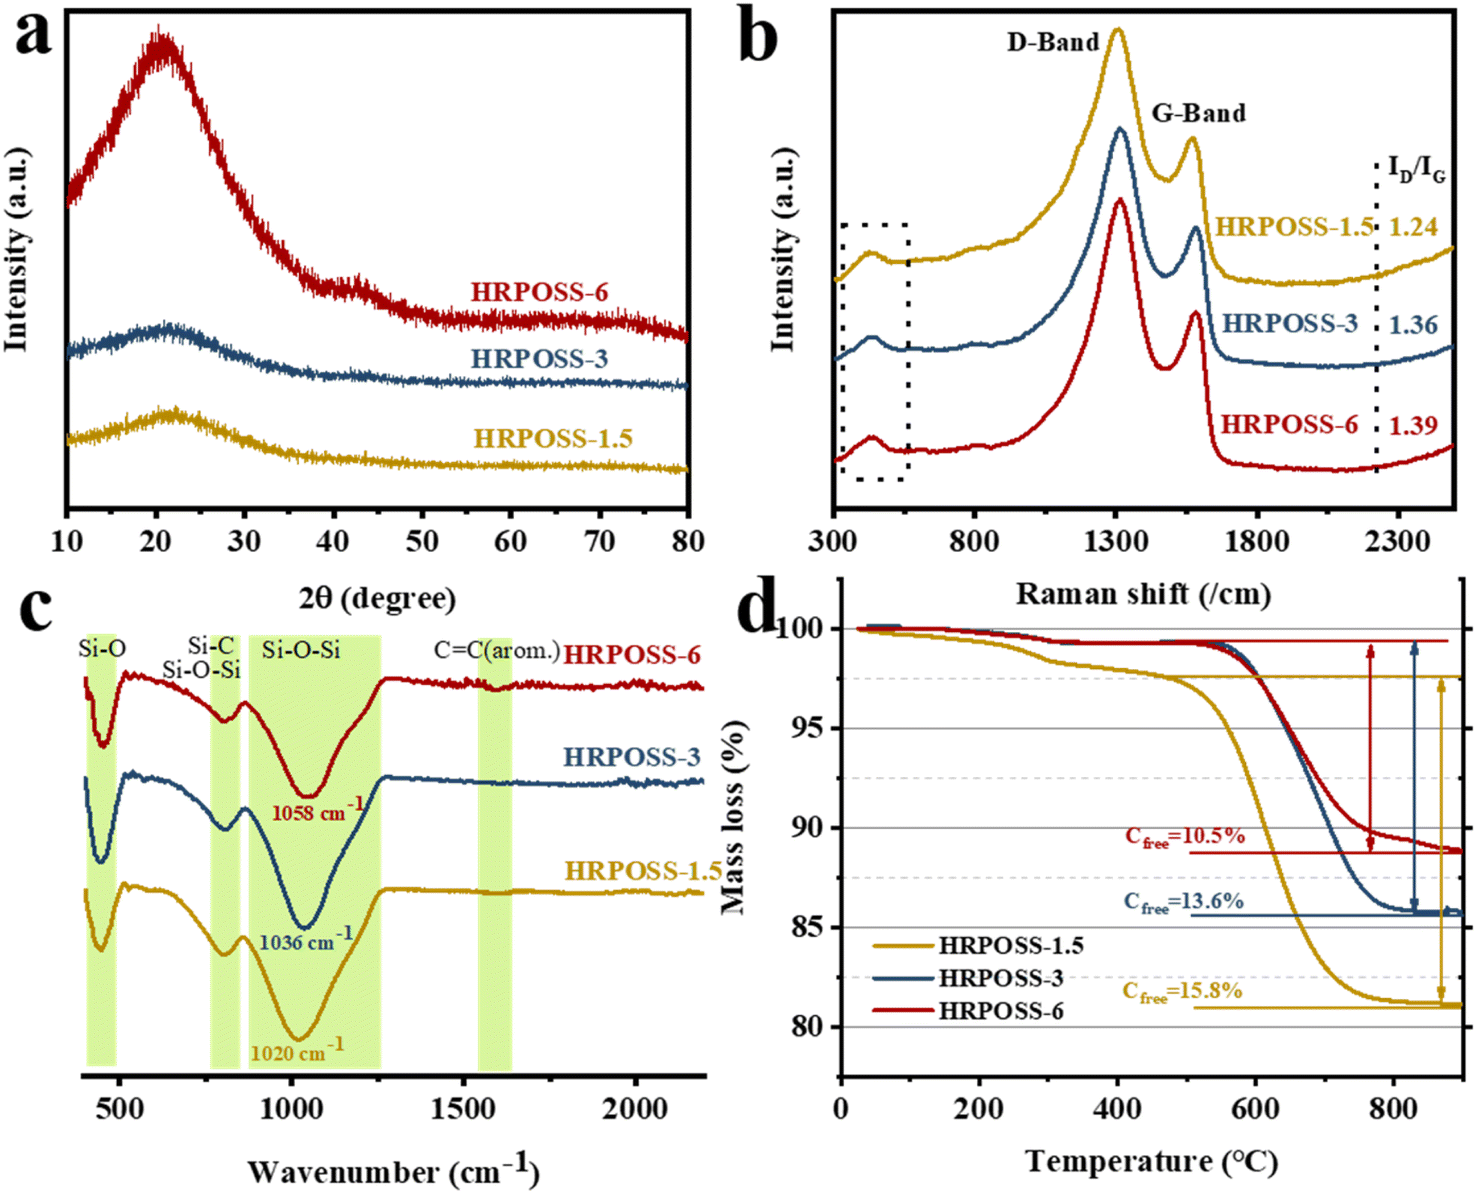 | ||
| Fig. 2 (a) XRD patterns, (b) Raman spectra, (c) FT-IR spectra, and (d) TGA curves of the HRPOSS composites synthesized at three different heat preservation temperatures. | ||
FT-IR and 29Si MAS-NMR further revealed the chemical structures of HRPOSS. As shown in Fig. 2c, the FT-IR spectra of HRPOSS-1.5, HPROSS-3, and HRPOSS-6 show peaks of Si–O bonds and asymmetric Si–O–Si stretching in the range of 410–490 cm−1 and 790–810 cm−1.28 The main peak corresponding to the stretching of the Si–O–Si bonds is located at 1020 cm−1 for HRPOSS-1.5, 1036 cm−1 for HRPOSS-3, and 1058 cm−1 for HRPOSS-6. The wavenumber shift is associated with the insertion of C atoms into the silica network, implying the formation of Si–C bonds and presence of an even-distributed SiOxC4−x network.29 The FT-IR spectra also showed a weak peak at around 1600 cm−1, which can be attributed to the vibration of the CC bonds of the Cfree phase.30 The 29Si MAS-NMR spectra also confirmed the FI-TR results by the simulation of five Gaussian peaks with δiso of around −108, −70, −36, 9, and −13 ppm, corresponding to the SiO4, SiO3C, SiO2C2, SiOC3, and SiC4 structural units, respectively (Fig. S2b, ESI†).31 These results clearly prove that the pyrolysis in H2 significantly changed the structure of POSS by destructing its O–Si–O bands and converting them into an SiOC network. Moreover, POSS was also converted to SiOxC4−x components during a longer sintering period. TGA measurements revealed that the amount of Cfree present in HRPOSS-6, HRPOSS-3, and HRPOSS-1.5 was 10.5 wt%, 13.6 wt%, and 15.8 wt%, respectively (Fig. 2d). The evaluation of the Cfree amount was not straightforward and strict given that some of the C atoms were engaged in Si–C bonds. We can only infer that the amount of segregated C in HRPOSS may be lower than the aforesaid results. All the curves show an initial small weight loss in the temperature range of 0 °C to approximately 250 °C due to the evaporation of adsorbed water. However, the differential curve of HRPOSS-1.5 was observed from 250 °C to 570 °C. This delay of oxidation of Cfree can be attributed to the stabilization of the free carbon phase, which is derived from the SiOC groups pyrolyzed in the atmosphere, together with silicon oxidized inside the SiOC groups.
As observed in the scanning electron microscopy (SEM) images (Fig. 3a), HRPOSS-6 presented a cage structure consisting of layers and a smooth surface and it retained the original structure during high-temperature sintering. Comparatively, HRPOSS-1.5 and HRPOSS-3 possessed different micro-surfaces, which are scabrate and porous (Fig. S3b and c, ESI†), respectively. The BET (Brunauer–Emmett–Teller) analysis indicates that HRPOSS-6 has only half the specific surface area of the other two samples and less than that of the commercial graphite anode (≤9.1 m2 g−1) (Fig. S4, ESI†).32 Moreover, the vibration density of HRPOSS-6 is close to that of the commercial graphite anode (≥0.9 cm3 g−1). The relative results of these samples are reported in Table S1.† HRPOSS-6 possesses a lamella and honeycomb morphology, which not only ensures full contact of the active materials with the electrolyte but also relieves the volume expansion during the lithiation/delithiation process.33 The distribution of Si, N, and C elements throughout HRPOSS-6 was explored by energy-dispersive X-ray spectroscopy (EDS) elemental mapping (Fig. 3b and c). Simultaneously, the transmission electron microscopy (TEM) images also confirmed the stratified structure of HRPOSS-6 (Fig. 3d). Its internal composition and structure do not exhibit any lattice fringes, indicating that HRPOSS-6 is amorphous, as confirmed by the selected area electron diffraction (SAED) pattern with the diffuse ring characteristic of an amorphous structure.34 Moreover, the high-resolution TEM (HRTEM) image distinctly displayed an increase in contrast with an increase in atomic deepness. Therefore, as shown in Fig. 3e, the dark part is uniformly distributed silicic species, while the bright part is carbon and a continuous thin film (around 4 nm) of turbostratic carbon.
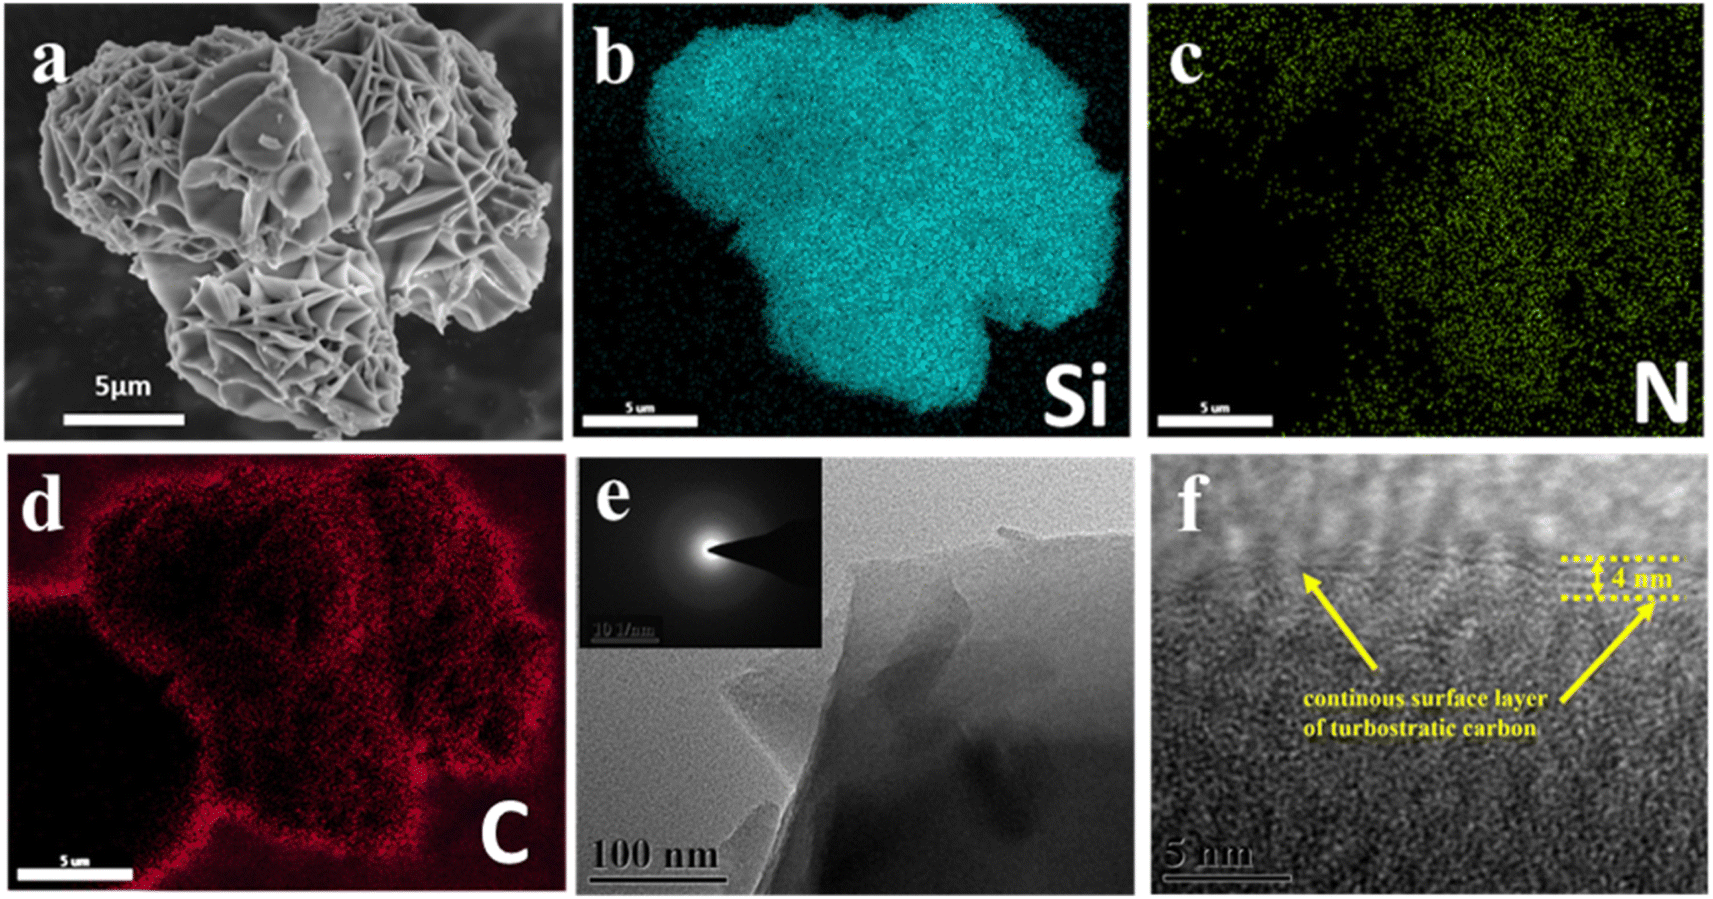 | ||
| Fig. 3 SEM images of (a) HRPOSS-6 and corresponding EDS elemental mapping images of (b) Si, (c) N, and (d) C, (e) TEM image and corresponding SAED pattern of HRPOSS-6, and (f) HRTEM image of HRPOSS-6. | ||
In the calcination process, the Si ions will be reduced by the carbon component. To confirm the valence states of various ions in HRPOSS, the full XPS spectra with five peaks of O 1s, C 1s, N 1s, Si 2s, and Si 2p3/2 could be clearly observed (Fig. S5, ESI†). In the Si 2p spectrum (Fig. 4b), the broad peaks were fitted with three small peaks, which are located at 98.79 eV, 99.7 eV, and 100.6 eV, corresponding to Si0+, Si1+, and Si2+, respectively.35 To investigate the element concentration gradient of HRPOSS, Ar-ion sputtering of XPS was performed. The surface elemental composition (Fig. S6a–e, ESI†) and the composition after different times of depth profiling with Ar-ion etching are shown in Table S3.†Fig. 4c shows that with an increase in the etching depth, the concentration of Si and N increased, while the concentration of C decreased, and then tended to be stable, that is, forming a double concentration gradient of Si/N. The Si0+ ratio in HRPOSS-6 increased gradually, which is much higher than that in the other two materials.
 | ||
| Fig. 4 (a) XPS survey spectrum, (b) high-resolution XPS spectrum of HRPOSS-6 nanocomposite in the Si 2p region, (c) XPS relative atomic concentration of each constituent of HRPOSS-6 surface and after etching, and (d–f) Si 2p XPS spectra of HRPOSS composites with different sputtering times. | ||
No obvious variation trend was observed between Si1+ and Si2+ (Fig. S7a–c, respectively, ESI†). The ratio of Si with different valence states was estimated from the respective areas of these peaks, and the results are listed in Table S2.† The average valence state of Si in the HRPOSS-6 sample is from 1.50 to 1.01, which is lower than that in HRPOSS-1.5 and HRPOSS-3, indicating that the appropriate pyrolysis time facilitates the carbothermal reduction of SiOxC4−x. This is consistent with the result from the Si 2p XPS spectra (Fig. 4d–f). Compared with HRPOSS-1.5, the Si peaks of the HRPOSS-3 and HRPOSS-6 samples shifted towards the lower energy side. The lower Si valence corresponds to a lower x value and higher electrochemical activity of SiOxC4−x. Also, the N peak strength of the three samples gradually increased (Fig. S7d–f, respectively, ESI†). The N 1s peak at 398.7 eV corresponds to the C–N bond and pyridinic-N.36 Especially, HRPOSS-6 has the highest Si and N contents among the three HRPOSS samples. Thus, the best electrical properties can be expected with HRPOSS-6.
Thereafter, the electrochemical performances of the three fabricated samples were tested. All the cells were cycled in the voltage range of 0.005–1.5 V. The voltage profiles (Fig. 5a) displayed their initial capacities and lithiation potentials. HRPOSS-6 exhibited the highest charge capacity of 1814.1 mA h g−1 and the lowest lithiation potential (defined as the potential at half discharge capacity) at 0.17 V versus Li/Li+, which is close to the discharge platform of graphite. Commonly, for LIB anode materials, high capacity with low lithiation potential is always expected. Based on the comprehensive trade-off of these two parameters, the HRPOSS-6 composite was originally considered to be a good anode candidate. Fig. 5b shows the discharge capacity distribution in different voltage ranges. We divided the first discharge process into six voltage ranges, and then calculated the capacity proportion of each range. Noticeably, HRPOSS-1.5 and HRPOSS-3 exhibited fairly high-capacity distribution (over 85%) in the top three voltage ranges, while the HRPOSS-6 electrode showed a uniform capacity distribution in the range of 0–0.4 V. The results indicated that a shorter sintering time can yield a high content of graphite-like carbon, while a longer sintering time is preferable to yield a greater silicon composition. Fig. 5c presents the typical cyclic voltammetry (CV) curves of HRPOSS-6 in the potential window of 0.005–1.5 V at a scan rate of 0.1 mV s−1 in the first three cycles. The cathodic part peak at 0.05 V and the anodic part peak at 0.51 V can be attributed to the reversible lithiation/delithiation reaction of Si.37 However, HRPOSS-1.5 and HRPOSS-3 exhibited undefined peaks in the delithiation process (Fig. S8a and b, respectively, ESI†). Also, HRPOSS-6 maintained excellent reversibility in the first three cycles, and no obvious polarization phenomenon appeared. Owing to the conversion kinetics promoted by the diffusion mechanism, HRPOSS-6 exhibited a superior rate capability with discharge specific capacities of 1026.7, 789.5, 666.3, 535.1, 358.4 and 196.5 mA h g−1 at 0.1, 0.3, 0.5, 0.8, 1 and 2 A g−1, respectively (Fig. 5d). Moreover, when the current was switched back to 0.1 A g−1, the high discharge capacity (812.7 mA h g−1) of HRPOSS-6 could be recovered, which confirmed the superb electrochemical reversibility. The cycling stability of HRPOSS-1.5, HRPOSS-3 and HRPOSS-6 at a current density of 0.5 A g−1 is shown in Fig. 5e. HRPOSS-6 with a high reversible capacity of 633.6 mA h g−1 after 200 cycles showed superior cycling stability compared to the other materials. To better understand the reason for this good cycling stability, post-cycling cross-sectional SEM analyses were carried out to explore the change in the morphology of the HRPOSS electrodes after 50 cycles. Based on the change in the electrode thickness before and after lithiation (Fig. 6), the volume expansion of the HRPOSS-6 microparticles were calculated to be only 13.7%, which is less than that of HRPOSS-3 (∼14.2%) and HRPOSS-1.5 (41.6%), where the cycling stability of HRPOSS-6 was superior.27 The migration rate of Li-ions in electrode materials is the key to the cell performance. The underlying effect of the Si concentration gradient is that the high concentration and low-valence silicon can be easily lithiated. Subsequently, the diffusion phenomenon will accelerate the migration of Li-ions to the external layer of low concentration zone in the process of delithiation, thus the electrode reaction kinetics was also sped up. The positive effect of the Si/N concentration gradient on the electrode reaction kinetics of the HRPOSS materials can be understood by the electrochemical impedance spectroscopy (EIS) results. The Nyquist plots in Fig. 7a–c show two semicircles in the high and medium frequency regions. The first semicircle at a high frequency is ascribed to lithium-ion diffusion through the solid–electrolyte interphase (SEI), corresponding to the phase angle peak at 103–105 Hz in the Bode plots (Fig. S9a–c, respectively, ESI†). The second semicircle at a medium frequency is associated with the phase angle peak at 102–103 Hz, representing the charge transfer resistance and double layer charge capacitance. The sloping line at low frequency is attributed to the lithium-ion diffusion impedance into the bulk. The interfacial impedance and charge transfer impedance of HRPOSS-1.5 and HRPOSS-3 decreased gradually with cycling, while the impedance for HRPOSS-6 was stable, indicating that there is a prelithiation process in the initial cycling. However, the impedance and peak patterns of HRPOSS-1.5 and HRPOSS-3 changed gradually during various cycles. This result shows that the electrolyte and active substances were continuously consumed to generate SEI layers. The Bode plots in Fig. S9a–c† show the similar phenomena, respectively. At low frequencies, the Warburg impedance overlaps with the other electrochemical reaction signals. Therefore, the derivative distribution function plots γ(τ) of relaxation time (DRT) in Fig. 7d–f were calculated, respectively, with the DRT tools on the Matlab platform developed by the Ciucci group38,39 to plainly compare to the dynamic process of the electrode reaction. The peaks in γ(τ) could be classified into different electrochemical processes based on the value of τ. The peak in the range of 10–100 s is attributed to the Li-ion diffusion in the active-Si bulk. The peaks located in the range of 1–10 s correspond to the Li+ diffusion process in the surface layer.11 The signals located at 10−3 to 1 s are related to the charge transfer between the surface layer and active-Si bulk.40 The peaks in γ(τ) below 10−3 s are attributed to the interface reaction process between the electrolyte and the surface layer. Based on the above-mentioned peaks, it is clear that great variations are observed at the peak position (τ = 10–100 s) for the HRPOSS-1.5 and HRPOSS-3 electrodes during 200 cycles. This was caused by the continuous growth of the SEI film.41 In contrast, for the HRPOSS-6 electrode, the stable lower peak after initial activation indicates its fast electrode reaction kinetics. This may be associated with the diffusion mechanism by concentration gradient, which enhances both the electronic and ionic conductivities of HRPOSS-6. The lithium-ion diffusion coefficients of the three samples were calculated using GITT (Fig. S10 and Fig. S11, details in the ESI†).42,43 The Li+ of HRPOSS-6 in the lithiation state ranged from 10.99 × 10⁻¹¹ to 10.99 × 10⁻⁹ cm2 s−1 and varied from 10.91 × 10⁻¹¹ to 8.93 × 10⁻⁹ cm2 s−1 at the delithiation, which slightly exceeds that of HRPOSS-1.5 and HRPOSS-3. The higher Li+ diffusion coefficient of HRPOSS-6 is attributed to the Si concentration gradient, which accelerated the ion diffusion velocity. On the one hand, the nitrogen gradient network facilitates electron conduction; on the other hand, a continuous turbostratic carbon film would relieve the stress during the lithiation/delithiation, which is helpful for the diffusion of Li+.
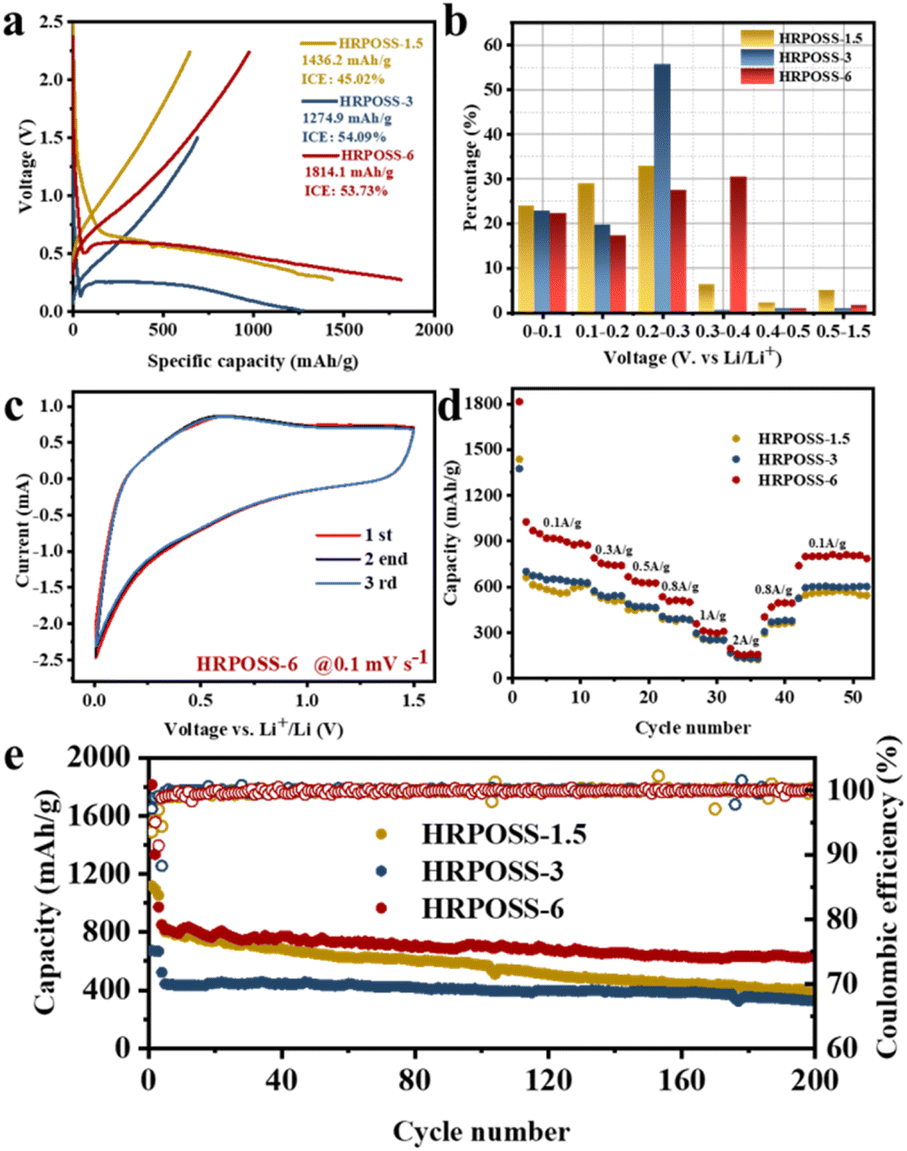 | ||
| Fig. 5 (a) Initial charge/discharge voltage profiles. (b) Capacity distribution in different voltage ranges. (c) CV curves. (d) Rate performance. (e) Long-term cycle performance at 500 mA g−1 of HRPOSS-1.5, HRPOSS-3 and HRPOSS-6. | ||
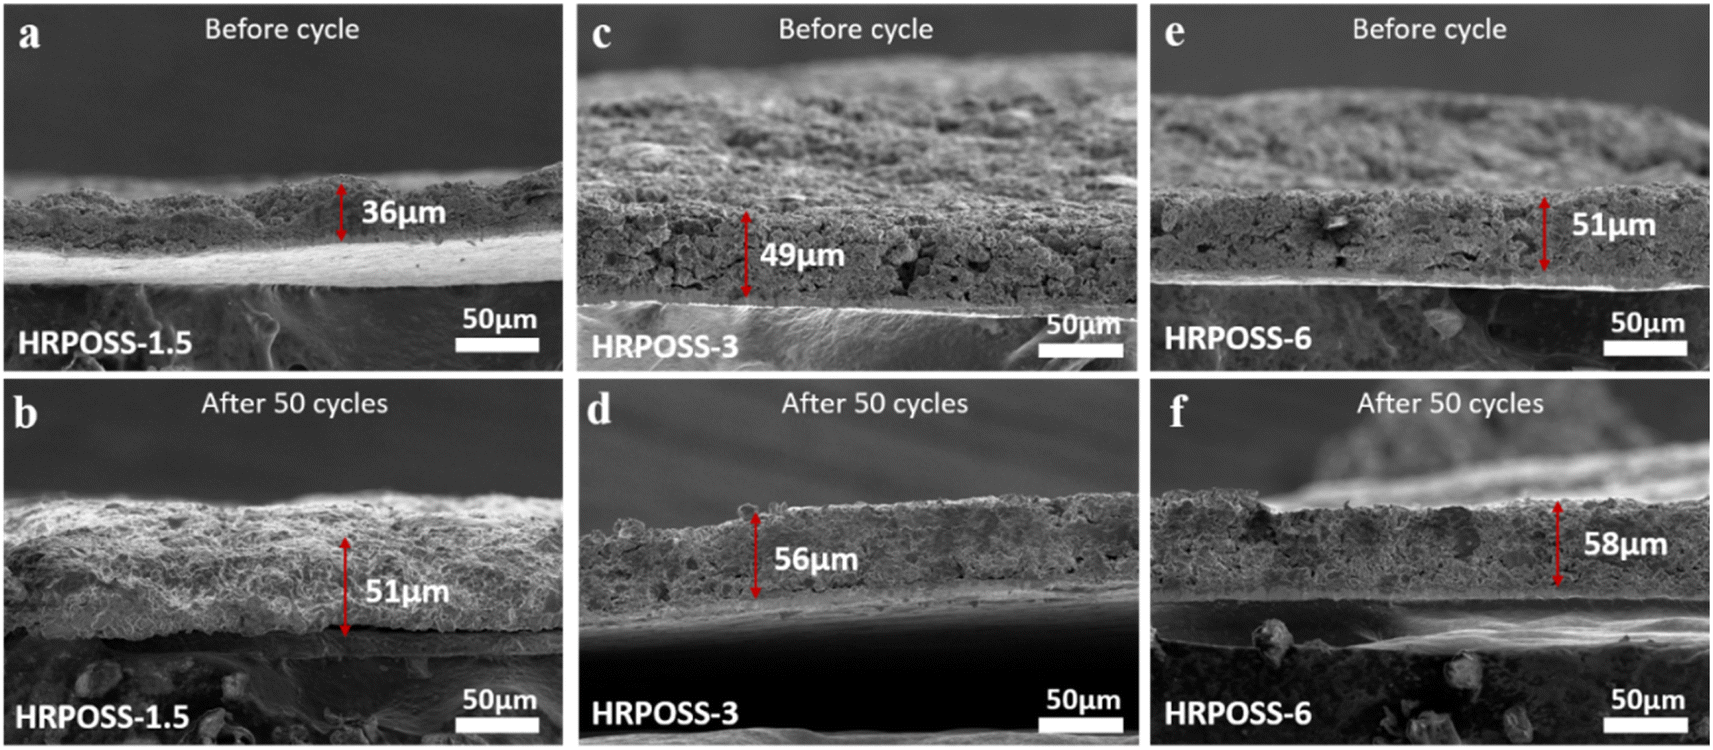 | ||
| Fig. 6 Series of SEM images showing the electrode changes before and after 50 cycles. Cross-sectional view of HRPOSS-1.5, HRPOSS-3 and HRPOSS-6 electrodes before cycling (a, c, and e) and after 50 cycles (b, d, and f), respectively (cross section of the electrode was taken from two halves of the same electrode). | ||
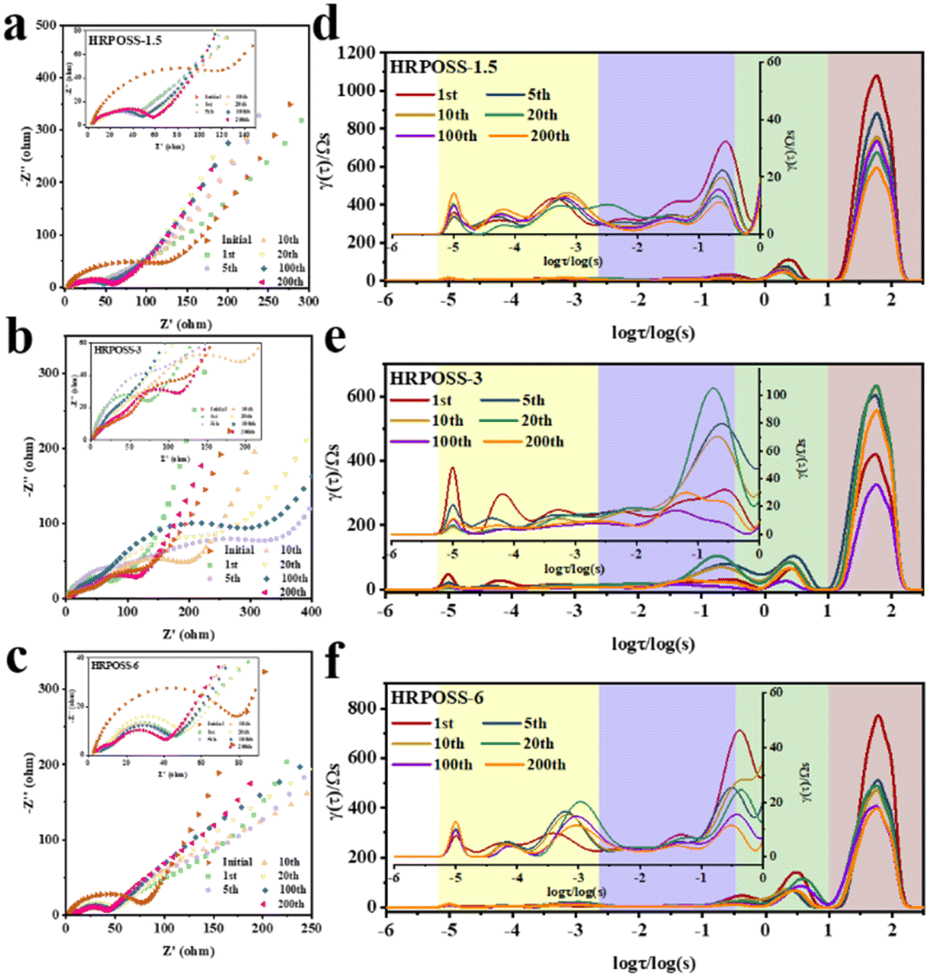 | ||
| Fig. 7 EIS characterization of the electrodes. Nyquist plots of after various cycles in (a) HRPOSS-1.5, (b) HRPOSS-3 and (c) HRPOSS-6 electrode. Distribution of relaxation time-related function γ(τ) after various cycles of (d) HRPOSS-1.5, (e) HRPOSS-3 and (f) HRPOSS-6 electrode. | ||
To further accurately understand the impedance changes in HRPOSS-6 during cycling, all the Nyquist plots (Fig. S12 and S13, ESI†) were composed of a plump semicircle in the discharge state and a depressed semicircle in the charge state followed by an inclined line, which can be fitted by an equivalent circuit (inset in Fig. 8). As shown in Fig. 8, the electrolyte resistance (Rs) was small and remained constant (3–5 Ω). The resistance of the SEI layer increased during the initial discharge process (maximum ≈ 145.7 Ω), and then decreased gradually to a stable value (around 70 Ω). Subsequently, the resistance of the SEI layer remained between 40–50 Ω after a few cycles. The DRT was also further confirmed by the formation of a stable SEI layer for HRPOSS-6 after the initial cycle process. The charge-transfer resistance, Rct, decreased from 61 Ω in the initial discharge process to 13 Ω in the second cycle charge process in the fully charged state (1.5 V). The regular change between the full discharge and charge states further demonstrated the excellent reversibility of HRPOSS-6. In addition, the Rct value decreased again in the third full charge, suggesting the improvement in the kinetics with the formation of a stable SEI layer.
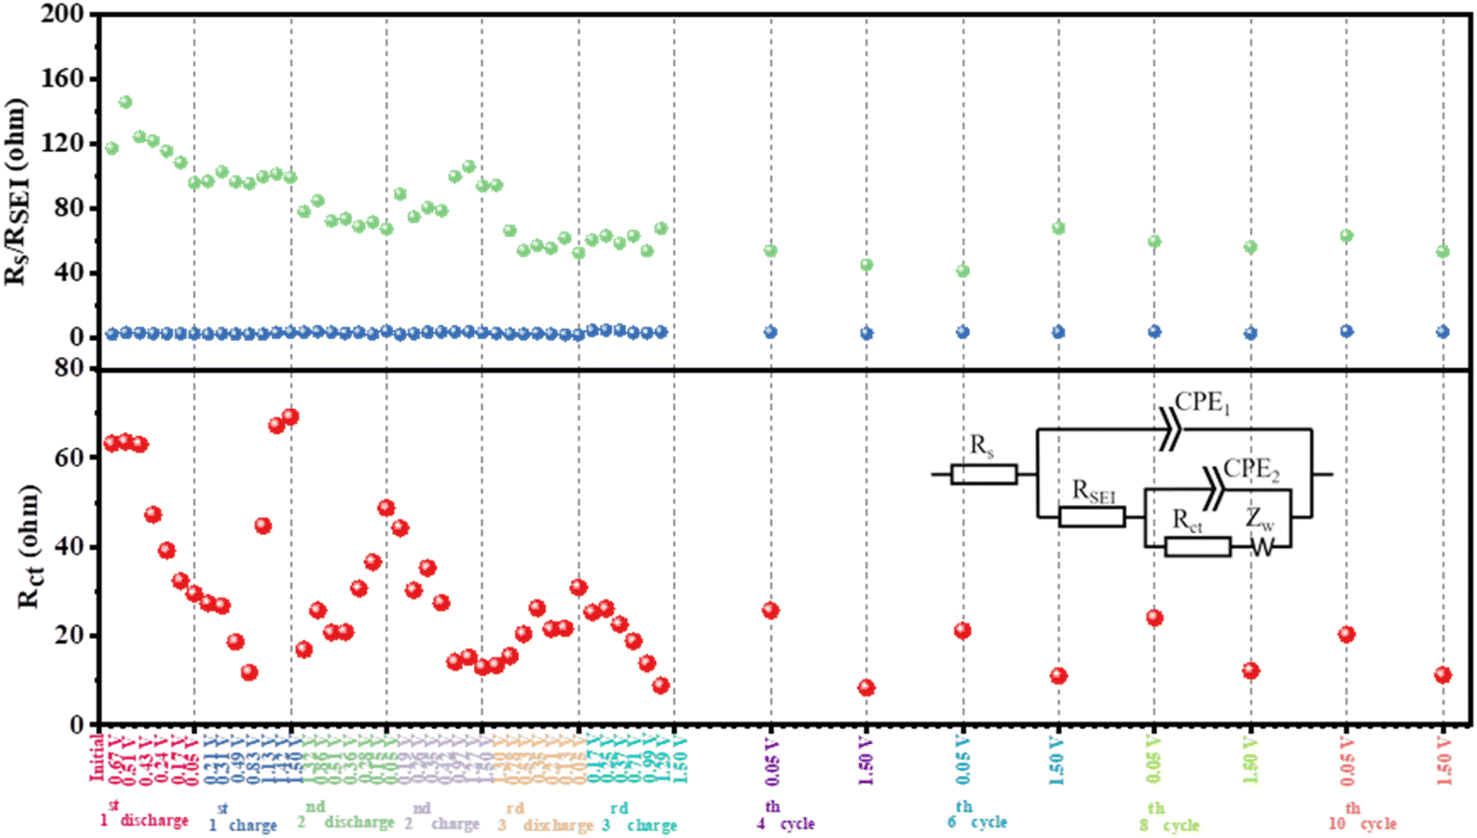 | ||
| Fig. 8 Fitted results of electrolyte resistance, Rs, resistance of the SEI layer, RSEI, and charge-transfer resistance, Rct. Inset: corresponding equivalent electrical circuit. | ||
4. Conclusion
A simple strategy was proposed to synthesize a silicic even-distribution and Si/N double concentration gradient via the hydrogen reduction of POSS. The Si/N concentration gradient could accelerate the kinetic process of lithium-ion diffusion and enhance the ionic conductivity. An external continuous thin film of turbostratic carbon could be used as an internal structural buffer, which provided good volume accommodation efficiency. In addition, silicic even-distribution could form a nanodomain, which served as an active site, providing good capacity and improving the volume change. The gradient feature and silicic uniformity of the Si@C anode material are effective to develop high-performance Si-based anode materials for next-generation high-energy lithium-ion batteries.Data availability
Data will be made available on request.Author contributions
Siqi Guan: investigation, conceptualization, data curation, methodology, project administration, formal analysis, writing – original draft.Chen Xu: conceptualization, methodology, physicochemical characterization.
Yuanjiang Chen: data curation, formal analysis.
Yongjin Zhang: data curation, formal analysis.
Lixiang Li: project administration, writing – review & editing, formal analysis.
Han Zhang: methodology, formal analysis.
Haiming Yang: formal analysis.
Baigang An: supervision, project administration, data curation, writing – review & editing.
Weimin Zhou: formal analysis.
Chengguo Sun: formal analysis.
Dongying Ju: methodology, formal analysis.
Xin Geng: supervision, project administration, methodology, writing – review & editing.
Conflicts of interest
The authors declare that they have no known competing financial interests or personal relationships that could have appeared to influence the work reported in this paper.Acknowledgements
The financial supports from National Natural Science Foundation of China (NSFC, No. 51872131, 51972156, 51672117, 51672118, 21701077 and 22109061), University of Science and Technology Liaoning Talent Project Grants (601010326), Talent Project of Revitalizing LiaoNing (2020LNQN17, 2019QN07) and the Distinguished Professor Project of Education Department of Liaoning are acknowledged.References
- J. Y. Park, S. J. Kim, K. Yim, K. S. Dae, Y. Lee, K. P. Dao, J. S. Park, H. B. Jeong, J. H. Chang, H. K. Seo, C. W. Ahn and J. M. Yuk, Adv. Sci., 2019, 6, 1900264 CrossRef PubMed.
- L. Zhai, K. Yang, F. Jiang, W. Liu, Z. Yan and J. Sun, J. Energy Chem., 2023, 79, 357–364 CrossRef CAS.
- B. Lung-Hao Hu, F. Y. Wu, C. T. Lin, A. N. Khlobystov and L. J. Li, Nat. Commun., 2013, 4, 1687 CrossRef PubMed.
- M. Ko, P. Oh, S. Chae, W. Cho and J. Cho, Small, 2015, 11, 4058–4073 CrossRef CAS PubMed.
- Y. Cen, Y. Fan, Q. Qin, R. D. Sisson, D. Apelian and J. Liang, J. Power Sources, 2019, 410–411, 31–37 CrossRef CAS.
- J. Shin, T.-H. Kim, Y. Lee and E. Cho, Energy Storage Mater., 2020, 25, 764–781 CrossRef.
- H. Shang, Z. Zuo, L. Yu, F. Wang, F. He and Y. Li, Adv. Mater., 2018, 30, 1801459 CrossRef PubMed.
- X. H. Liu, J. W. Wang, S. Huang, F. Fan, X. Huang, Y. Liu, S. Krylyuk, J. Yoo, S. A. Dayeh, A. V. Davydov, S. X. Mao, S. T. Picraux, S. Zhang, J. Li, T. Zhu and J. Y. Huang, Nat. Nanotechnol., 2012, 7, 749–756 CrossRef CAS PubMed.
- M. Chen, Q. Zhou, J. Zai, A. Iqbal, T. Tsegaye, B. Dong, X. Liu, Y. Zhang, C. Yan, L. Zhao, A. Nazakat, E. Sharel, C. Low and X. Qian, Nano Res., 2020, 14, 1004–1011 CrossRef.
- S.-H. Choi, G. Nam, S. Chae, D. Kim, N. Kim, W. S. Kim, J. Ma, J. Sung, S. M. Han, M. Ko, H.-W. Lee and J. Cho, Adv. Energy Mater., 2019, 9, 1803121 CrossRef.
- L. Li, C. Fang, W. Wei, L. Zhang, Z. Ye, G. He and Y. Huang, Nano Energy, 2020, 72, 104651 CrossRef CAS.
- N. Liu, J. Liu, D. Jia, Y. Huang, J. Luo, X. Mamat, Y. Yu, Y. Dong and G. Hu, Energy Storage Mater., 2019, 18, 165–173 CrossRef.
- J. Wang, C. Gao, Z. Yang, M. Zhang, Z. Li and H. Zhao, Carbon, 2022, 192, 277–284 CrossRef CAS.
- Q. Liu, Y. Ji, X. Yin, J. Li, Y. Liu, X. Hu and Z. Wen, Energy Storage Mater., 2022, 46, 384–393 CrossRef.
- G. Huang, J. Han, Z. Lu, D. Wei, H. Kashani, K. Watanabe and M. Chen, ACS Nano, 2020, 14, 4374–4382 CrossRef CAS PubMed.
- X. Zuo, Y. Wen, Y. Qiu, Y. J. Cheng, S. Yin, Q. Ji, Z. You, J. Zhu, P. Muller-Buschbaum, L. Ma, P. G. Bruce and Y. Xia, ACS Appl. Mater. Interfaces, 2020, 12, 43785–43797 CrossRef CAS PubMed.
- Y. Liu, L. Qin, F. Liu, Y. Fan, J. Ruan and S. Zhang, J. Power Sources, 2018, 406, 167–175 CrossRef CAS.
- B. Chen, L. Chen, L. Zu, Y. Feng, Q. Su, C. Zhang and J. Yang, Adv. Mater., 2022, e2200894, DOI:10.1002/adma.202200894.
- B. Chen, L. Zu, Y. Liu, R. Meng, Y. Feng, C. Peng, F. Zhu, T. Hao, J. Ru, Y. Wang and J. Yang, Angew. Chem., Int. Ed. Engl., 2020, 59, 3137–3142 CrossRef CAS PubMed.
- N. Yang and K. Lu, Carbon, 2021, 171, 88–95 CrossRef CAS.
- R. Wang, J. Wang, S. Chen, W. Bao, D. Li, X. Zhang, Q. Liu, T. Song, Y. Su and G. Tan, ACS Appl. Mater. Interfaces, 2021, 13, 5008–5016 CrossRef CAS PubMed.
- J. Wu, X. Zhang, Z. Li, C. Yang, W. Zhong, W. Li, C. Zhang, N. Yang, Q. Zhang and X. Li, Adv. Funct. Mater., 2020, 30, 2004348 CrossRef CAS.
- M. Han, Y. Mu, F. Yuan, J. Liang, T. Jiang, X. Bai and J. Yu, J. Mater. Chem. A, 2020, 8, 3822–3833 RSC.
- C. Smit, R. A. C. M. M. van Swaaij, H. Donker, A. M. H. N. Petit, W. M. M. Kessels and M. C. M. van de Sanden, J. Appl. Phys., 2003, 94, 3582–3588 CrossRef CAS.
- G. Mera, A. Navrotsky, S. Sen, H.-J. Kleebe and R. Riedel, J. Mater. Chem. A, 2013, 1, 3826–3836 RSC.
- S. H. Lee, C. Park, K. Do and H. Ahn, Energy Storage Mater., 2021, 35, 130–141 CrossRef.
- J. Wang, L. Liao, H. R. Lee, F. Shi, W. Huang, J. Zhao, A. Pei, J. Tang, X. Zheng, W. Chen and Y. Cui, Nano Energy, 2019, 61, 404–410 CrossRef CAS.
- M. A. Abass, A. A. Syed, C. Gervais and G. Singh, RSC Adv., 2017, 7, 21576–21584 RSC.
- A. Grill and D. A. Neumayer, J. Appl. Phys., 2003, 94, 6697–6707 CrossRef CAS.
- M. Narisawa, K. Terauds, R. Raj, Y. Kawamoto, T. Matsui and A. Iwase, Scr. Mater., 2013, 69, 602–605 CrossRef CAS.
- S. J. Widgeon, S. Sen, G. Mera, E. Ionescu, R. Riedel and A. Navrotsky, Chem. Mater., 2010, 22, 6221–6228 CrossRef CAS.
- Y. An, H. Fei, G. Zeng, L. Ci, B. Xi, S. Xiong and J. Feng, J. Power Sources, 2018, 378, 66–72 CrossRef CAS.
- C. Dong, H. Shao, Y. Zhou, W. Du, L. Li, J. Sun, Z. Yan, Z. Hu, S. Chou and F. Jiang, Adv. Funct. Mater., 2022, 33(9), 2211864 CrossRef.
- M. Graczyk-Zajac, D. Vrankovic, P. Waleska, C. Hess, P. V. Sasikumar, S. Lauterbach, H.-J. Kleebe and G. D. Sorarù, J. Mater. Chem. A, 2018, 6, 93–103 RSC.
- Z. Li, H. Zhao, P. Lv, Z. Zhang, Y. Zhang, Z. Du, Y. Teng, L. Zhao and Z. Zhu, Adv. Funct. Mater., 2018, 28(31), 1605711 CrossRef.
- Y. Zeng, Y. Huang, N. Liu, X. Wang, Y. Zhang, Y. Guo, H.-H. Wu, H. Chen, X. Tang and Q. Zhang, J. Energy Chem., 2021, 54, 727–735 CrossRef CAS.
- X. Zhou, Y.-X. Yin, L.-J. Wan and Y.-G. Guo, Adv. Energy Mater., 2012, 2, 1086–1090 CrossRef CAS.
- F. Ciucci and C. Chen, Electrochim. Acta, 2015, 167, 439–454 CrossRef CAS.
- J. P. Schmidt, P. Berg, M. Schönleber, A. Weber and E. Ivers-Tiffée, J. Power Sources, 2013, 221, 70–77 CrossRef CAS.
- P. Shafiei Sabet and D. U. Sauer, J. Power Sources, 2019, 425, 121–129 CrossRef CAS.
- J. Pan, Q. Zhang, J. Li, M. J. Beck, X. Xiao and Y.-T. Cheng, Nano Energy, 2015, 13, 192–199 CrossRef CAS.
- C. Hong, Q. Leng, J. Zhu, S. Zheng, H. He, Y. Li, R. Liu, J. Wan and Y. Yang, J. Mater. Chem. A, 2020, 8, 8540–8547 RSC.
- H. Zhang, P. Zong, M. Chen, H. Jin, Y. Bai, S. Li, F. Ma, H. Xu and K. Lian, ACS Nano, 2019, 13, 3054–3062 CrossRef CAS PubMed.
Footnotes |
| † Electronic supplementary information (ESI) available. See DOI: https://doi.org/10.1039/d3na00285c |
| ‡ Present address: Key Laboratory of Energy Materials and Electrochemistry Research Liaoning Province, School of Chemical Engineering, University of Science and Technology Liaoning, Anshan 114051, China. |
| This journal is © The Royal Society of Chemistry 2023 |