 Open Access Article
Active carbon based supercapacitors with Au colloids: the case of placing the colloids in close proximity to the electrode interface
H.
Grebel
 *a,
Shupei
Yu
b and
Yuanwei
Zhang
 b
b
aCenter for Energy Efficiency, Resilience and Innovation (CEERI), The ECE Department at the New Jersey Institute of Technology, Newark, NJ 07102, USA. E-mail: grebel@njit.edu
bDepartment of Chemistry and Environmental Science at the New Jersey Institute of Technology, Newark, NJ 07102, USA. E-mail: yuanwei.zhang@njit.edu
First published on 14th November 2022
Abstract
Supercapacitors (SCs) are short-term energy storage elements that find many applications, e.g., electronic charging devices and suppressors of power fluctuations in grids that are interfaced with sustainable sources. The capacitance of an ordinary capacitor increases when dispersing metallic colloids in its dielectric. A similar strategy for SCs means deployment of nano-scale metal colloids (in our case, Au nanoparticles, or AuNPs) at the very narrow interface between an electrolyte and a porous electrode (here, active carbon film, AC, on a grafoil current collector). Unlike previous studies, here we placed AuNPs at a small distance from the electrode. This was achieved by coating the AuNPs with a negatively charged ligand that also enables strong adhesion to the electrode. A very large specific capacitance amplification was demonstrated: for example, C–V data at a scan rate of 20 mV s−1 indicated a specific capacitance amplification of more than 10 when 30 μg of AuNPs was incorporated with 200 mg of active carbon while using a 1 M Na2SO4 electrolyte and a 5% cellulose acetate butyrate binder. Upon replacing the 1 M Na2SO4 electrolyte with 1 M KOH, and keeping the same set of electrodes, the amplification factor decreased but remained large, ∼3, as determined using C–V traces at the same scan rate. This proves that the AuNPs adhered well to the AC electrodes. Simulations indicated the importance of keeping the AuNPs in close proximity to the electrodes, but not in direct contact with them, in order to maintain a substantial amplified polarization effect. Unlike semiconductor embedded electrodes, optical effects were found to be minimal.
I. Introduction
Originally devised for microwave lenses, artificial dielectrics (ADs) are man-made materials that contain metal features much smaller than a characteristic propagating wavelength (e.g., sub-cm size ball bearings embedded in a dielectric and using a microwave wavelength of 3 cm to investigate them).1–3 These features alter the effective permittivity and permeability of the dielectric through creation of locally induced dipoles. Examples are a microwave lens1 and nano-size semiconductor embedded dielectrics.4,5 While there is a large body of work on ADs in the high-frequency range (of the order of GHz, or even in the visible range), little if any, has been investigated at the low frequency end (of the order of Hz or kHz). We note that for ADs to work, the induced dipoles need to be well-separated from the biasing electrodes (if any) and from one another.Supercapacitors (SCs) take advantage of the large capacitance at the narrow interface between a porous electrode and an electrolyte.6–11 Here, we concentrate on a carbon-based SC that exhibits an electrical double-layer. SCs are used in a wide-range of applications, such as consumer electronic products, memory back-up devices, hybrid electric vehicles, and power supply systems.12,13 They were also proposed as buffers for highly fluctuating power grids that are equipped with sustainable sources.14 Our intent is to gain basic knowledge on the capacitance changes when incorporating a very low dispersion of gold colloids with active carbon (AC) electrodes; these are deposited on a current-collector, made of grafoil. The AC electrode material consisted of relatively large particles with a size of ∼15 μm15 and the colloids may find themselves on its surface or within its pores owing to an electrostatic bond between the negatively charged ligand, coating the AuNPs and the conductive (yet neutral) AC. The very large ratio between the AC mass and the mass of the colloids (a ratio of more than 100 mg to 10 μg, or 100![[thin space (1/6-em)]](https://www.rsc.org/images/entities/char_2009.gif) 000
000![[thin space (1/6-em)]](https://www.rsc.org/images/entities/char_2009.gif) :
:![[thin space (1/6-em)]](https://www.rsc.org/images/entities/char_2009.gif) 10) makes it plausible that the observed ca. ×10 amplification may be attributed to near-field polarization effects at the electrolyte–electrode interface (see also simulations at the end of this manuscript).
10) makes it plausible that the observed ca. ×10 amplification may be attributed to near-field polarization effects at the electrolyte–electrode interface (see also simulations at the end of this manuscript).
ADs may be understood in terms of local-field theory.2 In a quasi-DC approach, one analyzes the effect of a single colloid per unit cell, which is made of two parallel conductors. The colloid is separated from the electrodes. Without the colloids, the electrode's charge is Q under a cell bias of Vin. Under a cell bias, the metal colloids act as dipoles (namely, the free electrons in the metal are displaced) and the colloids become polarized. This in turn induces an additional charge, q, on the cell's electrodes. For a given bias, the increased charge is translated into an increased capacitance. The unit cell is defined by the colloid spacing, a. The cell's capacitance is defined as C0 without the colloid and C′ with it. Assume that the colloid is spherical with a volume of d3; the cell dimension is a2b with an electrode spacing of b; and that the external potential Vin is expressed using the external field as E0b.2 One may assess the effective new capacitance in the presence of colloids using:
| C′ = C0(1 + q/Q) = C0(1 + CcollVcoll/C0Vin) − C0{1 + [(d2/d) × (E0d)]/[(a2/b) × (E0b)]} = C0(1 + Nd2) | (1) |
The last step is achieved when the lateral area of a unit cell is inversely proportional to the number of colloids, N = 1/a2 and there is one colloid per cell.
When adding more and more colloids, the local field at a particular colloid position is a linear combination of the external field and an interaction field. The local interaction field on a particular colloid is exerted by all other colloids excluding the colloid itself. The effect of all other colloids is characterized using an interaction parameter, C. At very low frequencies, the interaction field is mostly electric in nature. The polarization is summarized in a self-consistent form, the Clausius–Mossotti relation when the distance between colloids is much smaller than the wavelength of interest; this is easily achievable at low frequencies:
| p = NαeE0/(1 − αeC) | (2) |
| k = 1 + Nαe/(1 − αeC) | (3) |
Thus, a capacitance increase, which is related to the increase in the effective dielectric value is achieved with an increased number of dipoles and the interaction between them. At some point, adding more and more dipoles may not improve the dielectric increase due to mutual coupling between them. The questions are how many colloids does it take to make a large impact? Will too many mask the effect?
The surface of the porous electrode is a few orders of magnitude larger than its geometrical flat surface projection. It is of fractal nature16,17 with a typical dimensionality of 2.5. Several methods have been devised to increase its effect.18–21 The surface of the porous electrode is proportional to the geometrical volume of the sample, so it makes sense to normalize the capacitance results using the electrode volume for proper comparisons.22 In our case, volumetric specific capacitance amounts to gravitonic specific capacitance because the flat-surface area of all of our samples was the same.
Dispersions of Au nano-particles (AuNPs) have been known for a long time. Their preparation methods are well-established, as well as, the relationship between their size, as determined by SEM or TEM and their optical scattering properties.23,24 In order to ensure a good suspension, the colloids are functionalized with a negatively charged ligand. While the plasmonic peak absorption of uncoated AuNPs dramatically changes as a function of particle size,25 it is much less so for ligand coated particles.26 A well-established technique that correlates the particle size to their optical scattering is dynamic light scattering (DLS),27 which is used to determine the average particle size. The electrode itself is charge-neutral; nonetheless, there is an electrostatic bond between the neutral, yet conductive AC electrode and the negatively functionalized AuNPs. We use this bond to attach the AuNPs to the AC electrode. The strength of this bond is validated by exchanging the electrolyte (from Na2SO4 to KOH) while retaining the same AuNPs/AC electrodes. A thin ligand layer (of the order of nanometers) also keeps the AuNPs away from the electrode surface.
The paper is organized as follows:
In Section 2, Materials and methods we describe the preparation and characterization studies of the AuNPs, the titration procedure, the fabrication of the porous AC electrodes, the initial results and the case for volumetric normalization. In Section III, we describe the experimental results of the various structures and related simulations. The discussion is provided in Section IV and we make concluding remarks in Section V.
II. Materials and methods
a Preparation methods – gold colloids
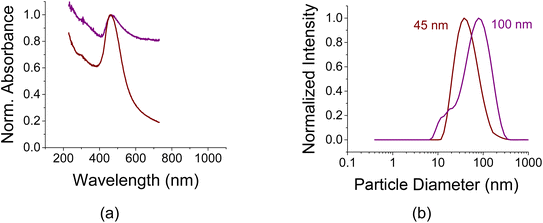
Nano-sized AuNPs were synthesized by following a well-established method;28 it employs citrate as a reducing agent and stabilizer. In brief, chloroauric acid (HAuCl4) in water solution (10 mg HAuCl4 in 90 mL of water) was heated to boiling and sodium citrate solution (0.5 mL of 250 mM) was introduced. The mixture was stirred for 30 min until the color turned wine red or purple-brown. AuNPs were then purified by centrifugation and washed with DI water three times. The concentration of AuNPs in water was 1 mg mL−1; the titration experiments were conducted with increasing amounts of 10 μL per batch and are translated to μg when referenced to the mass of AC in the batch; otherwise, they are quoted in μL.There were 2 batches of suspended AuNPs in water: medium sized nanoparticles of ca. 45 nm and aggregates of ca. 100 nm whose normalized light absorption curves are shown in Fig. 1a. As can be seen from Fig. 1a, the peak position for the aggregates is a bit red-shifted compared to the smaller particles. The peak is broader and exhibits a significantly slower spectral decaying tail. The corresponding DLS curves are shown in Fig. 1b indicating the particles' diameter distribution. The zeta potentials of the coated AuNPs were −31.1 mV and −43.9 mV for the 45 nm and 100 nm colloids, respectively.
b Preparation methods – the porous electrodes
(a) 100 mg of cellulose acetate butyrate binder (CAB, Aldrich Chemicals) was first dissolved in 20 mL of acetone. 2 g of active carbon (AC, specific surface area of 1100 m2 g−1, produced by General Carbon Company, GCC, Paterson, NJ, USA) was added and sonicated for 1 hour using a horn antenna. Six vials, each containing 1 mL, and sometimes 2 mL of the slurry were prepared. To these, successive amounts of 10 μL of AuNPs, suspended in water were added. Each mixture was further sonicated with the horn antenna for additional 30 min. The slurry was drop cast on grafoil electrodes (area of contact: 1.27 × 1.27 cm2, manufactured by Miseal and purchased through Amazon), baked on a hot plate at <90 °C and then soaked with an electrolyte (1 M of Na2SO4, NaCl, or KOH). A fiberglass filter (Whatman 1851-055) was used as a membrane. The Au colloid concentration was 1 mg mL−1. The Au colloids sizes were of the order of ∼45 nm (Fig. 1b).(b) Similar to (a) but with poly-vinyl alcohol (PVA provided by EastChem Labs) as a binder and dissolved in water; 1 M of NaCl as an electrolyte. The sizes of Au colloids were of the order of ∼100 nm, exhibited some sedimentation and deemed to be aggregates (Fig. 1b).
On average, the AC particulates' dimensions were ca. 15 microns15,29 and their specific surface area was rated as 1100 m2 g−1. Through mixing, the AuNPs would end up either on the AC particulate, in the binder, or in the electrolyte. We found out that incorporating the AuNPs in the electrolyte did not yield any capacitance increase. This is due to screening by the ions in the electrolyte. Adding the AuNPs to the polymeric binder before adding AC was not efficient, either. The more efficient way was to first mix AC with the polymer and only then add the AuNPs. Adding the AuNPs to a thin polymeric layer directly on the grafoil film resulted in a very poor capacitor because it blocked the collection of current.
c The samples
Cuts of 200 micron thick grafoil electrodes with back adhesive (1.27 cm × 2.54 cm) were placed on similar cut microscope slides. Before placing them on the slides, the grafoil electrodes were placed in a 1 M NaOH container and were exposed to 30 s of microwave radiation in a microwave oven to improve adhesion between the binder materials and grafoil. The two slides were held with tweezers (or plastic clips) and the boundaries of the sample were left unsealed while soaking it in the electrolyte. The sample configuration is shown in Fig. 2a and its picture in Fig. 2b. | ||
| Fig. 2 (a) A cross section of the sample with grafoil coated active carbon (AC) electrodes and (b) a picture of the cover area ca., 1.27 × 1.27 cm2. | ||
d Electrochemical techniques
A potentiostat/galvanostat (Metrohm) was used in a 2-electrode set-up. Each sample was tested using three electrochemical methods: cyclic voltammetry (C–V) at scan rates of 20, 50 and 100 mV s−1, charge–discharge (C–D) at applied currents of 0.5, 1 and 2 mA (translated to current densities of 0.31, 0.62 and 1.24 mA cm−2) and electrochemical impedance spectroscopy (EIS) between 50 kHz and 50 mHz. The results all agreed on the titration trends.e Initial characterization studies – the effect of the current collectors and light
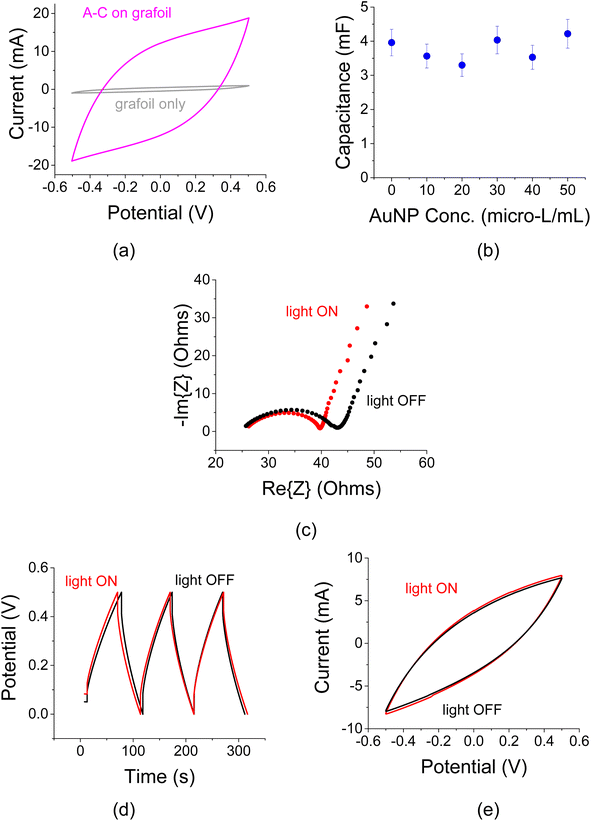
A cell interfaced with un-coated 200 μm thick grafoil electrodes exhibited very small capacitance values compared to an AC coated cell (Fig. 3a). The capacitive effect of the grafoil only electrode is less than 5% of the AC coated sample. Titration of AuNPs, drop-cast directly on grafoil-only electrodes exhibited little capacitance variation as a function of colloid concentration (Fig. 3b). The capacitance values were much smaller than those achieved when the AuNPs were interfaced with the AC films (see below). One may, therefore conclude that the effects of bare grafoil and AuNP coated grafoil (though without the AC film) are minimal. The concentration of the AuNPs was referenced in this case to their suspension in 1 mL of acetone and the electrolyte was 1 M NaCl.The AuNPs exhibited small response to optical radiation when exposed to a continuous white-light source. The AC films were depositing transparent and conductive current collectors (ITO) similarly to.15,29 Electrochemical impedance spectroscopy (EIS) curves shown in Fig. 3c revealed that there is a little change in the differential capacitance when the AuNP interfaced AC films were exposed to the 75 W incandescent light. Overall, the effective electrode resistance (the real impedance value at the knee of the curve; see also ref. 30) has changed by only 6%. This change is attributed to optical excitations in the AC film itself, to the temperature change and to a lesser extent to the optical effect of the ITO films. The corresponding C–D and C–V traces also exhibit a small change in the cell capacitance under the light exposure (Fig. 3d and e).
f Titration experiments
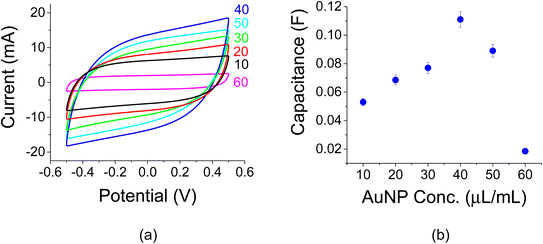
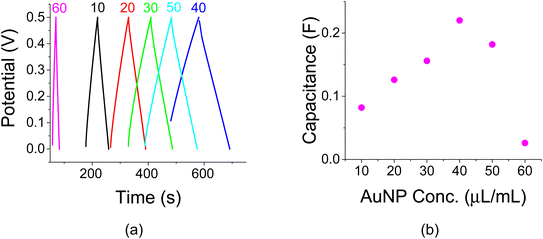
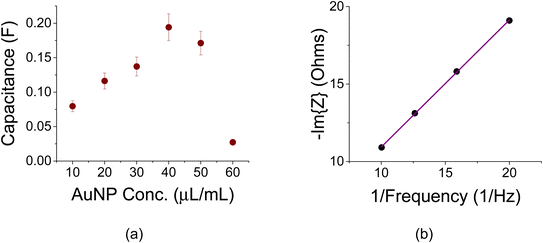
Titration experiments were carried out to study the effect of AuNP loading. The initial idea was that a higher AuNP concentration would lend itself to larger capacitance values as more colloids would find themselves at the electrolyte/electrode interface. Initial C–V experiments with 1 M of Na2SO4 at a scan rate of 100 mV s−1 were made as shown in Fig. 4a. These experiments exhibited a capacitance peak at a AuNP concentration of 40 μg mL−1. The related capacitances as a function of AuNP concentrations are shown in Fig. 4b. Note a capacitance increase by a factor of ∼2 as a result of that AuNP presence when compared to a reference sample without them (the sample with a 0 AuNP concentration). The amount of active carbon in each vial was 100 mg mL−1.The area of each sample was the same and the related capacitance values of Fig. 4a may be viewed as specific areal capacitance. For example, the peak capacitance of 110 mF at 40 μg/100 mg is translated to 110 mF/1.272 cm2 = 68.2 mF cm−2. The trend in Fig. 4 is also exhibited in Fig. 5a and b and 6a and b for C–D (I0 = 1 mA, J0 = 0.62 mA cm−2) and EIS experiments, respectively.
Two reference experiments were additionally conducted: (1) a repeat of the 50 μg experiment on another grafoil substrate to assess variations in sample preparation. The variation was estimated at ±5%. (2) 30 μg of AuNPs was added to the mixture having 30 μL of AuNPs (in total 60 μL of AuNPs in 1 mL) to assess an increase in the colloid concentration.
Electrochemical impedance spectroscopy (EIS) as a function of AuNP concentration is shown in Fig. 6a. The capacitance value was derived from the slope of the low-frequency points in the −Im{Z} vs. 1/frequency curve as shown in Fig. 6b for the peak capacitance at 40 μL mL−1. The slope of the curve is proportional to the inverse of the differential capacitance, Cdiff, according to 1/(2πCdiff).30 From Fig. 6b, Cdiff is assessed to be 194 mF, corroborating the value obtained from Fig. 2b. The electrode resistance (ca. 3–5 ohms for all samples) was rather small.
One could argue that values of film capacitance or even values of specific capacitance with respect to the area (in units of [F cm−2]), do not provide a full picture; as pointed out earlier, the effective (porous) film's surface scales with the sample's volume. Plots of the specific gravitonic capacitance in units of F g−1 were made for different sets of films under various conditions (various thicknesses, binders and electrolytes) as outlined below. As also outlined below, the gravitonic capacitance is directly related to the volumetric capacitance in our case
The area of each sample was the same, 1.61 cm2. The density of the composite film, dfilm, was assessed as the weighted density of its components: 95% of AC and 5% of polymeric binder. It was kept the same throughout all tests: dfilm = 0.95 × (dAC = 0.375 g cm−3) + 0.05 × (dpolymer = 1.21 g cm−3) − 0.42 g cm−3. The volume was assessed as A × t and the film thickness was t = wfilm/(dfilm × A) with wfilm being the film weight. The gravitonic specific capacitance in units of F g−1 is related to the volumetric specific capacitance in units of [F cm−3] as: [F cm−3] = [F (g cm−3)/g] = [F dfilm/g]. Therefore, gravitonic and volumetric specific capacitance values are proportional to one another through a constant: the film density, or, dfilm = 0.42 g cm−3.
III. Results
a Thin and thick samples
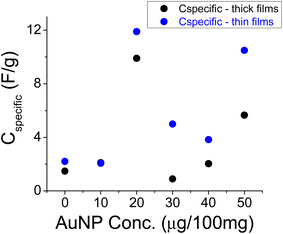
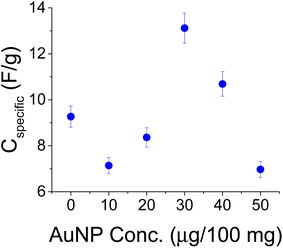
Two sets of experiments were first carried out: one for thicker (∼450 μm, with an electrode loading of 14 mg cm−2) and the other for thinner (∼75 μm, with an electrode loading of 6 mg cm−2) films. Their results are shown in Fig. 7. The thin films were obtained by further dilution of the original batches with 1 + 1 mL of acetone + ethanol for a total of 3 mL solution. The concentration of the AuNPs is referenced to the amount of the AC in the sample because both the AuNPs and the AC were diluted in the same way. The trend exhibited by the thicker and thinner films is the same, though the thinner films exhibited larger specific values.31 The consistent results for the reference sample (0 μg per 100 mg) allude to the repeatability of the experiments (note that the points for 10 μg per 100 mg coincide with each other). Of interest are the relatively large values at 20 and 50 μg per 100 mg. The large variability of values at 50 μg per 100 mg in Fig. 7 may be attributed to lower film integrity due to a mixture of hydrophobic and hydrophilic components; the AuNPs are suspended in water while the AC and the CAB binder are hydrophobic.Another set of tests was conducted with the smaller size AuNP colloids (∼45 nm of Fig. 1a), but with 1 M NaCl as an electrolyte. Better film homogeneity was achieved by first sonicating the AuNPs with AC in 1 mL of acetone followed by 1 mL of 6% CAB by weight in acetone, as well; the latter mixture was re-sonicated. The results shown in Fig. 8 are consistent with the previous results. The peak value seems to shift a bit towards a larger concentration.
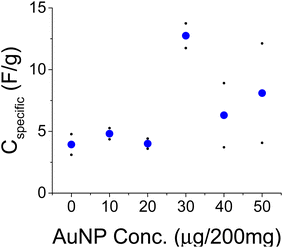
Another set of experiments was conducted with a PVA binder and a larger amount of AC (200 mg per 1 mL of water). These experiments were conducted with the larger size AuNPs (∼100 nm). Unlike the hydrophobic CAB, PVA is hydrophilic and better matches with the water suspended AuNPs as alluded to by ref. 32. PVA is less compatible with the hydrophobic current collector and the treatment with NaOH helped the adhesion of the film to grafoil. The electrolyte here was 1 M NaCl. Two sets of experiments were conducted and their averages are shown in Fig. 9 by the blue dots. The data are consistent up to 40 μg per 200 mg of AC after which film homogeneity due to charged AuNP packing could become an issue.
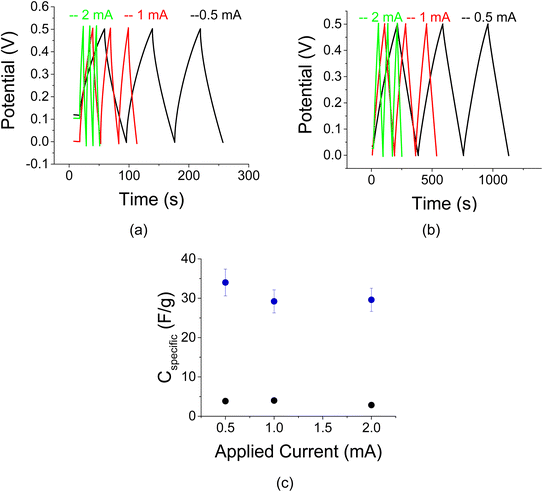
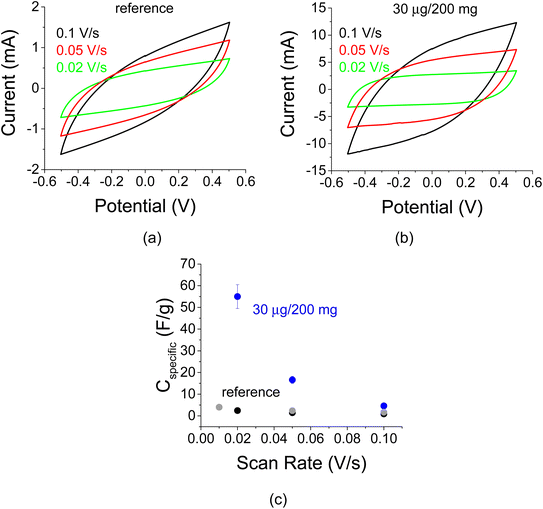
Complementary C–D and C–V data with a CAB binder and 1 M Na2SO4 electrolyte are shown in Fig. 10 and 11, respectively for a reference and 30 μg of AuNPs per 200 mg of AC. The C–D data revealed little change as a function of the applied current, I0. The enhancement factor due to the presence of the AuNPs is approximately 6.
C–V curves are shown in Fig. 11 for the sample in Fig. 10. As indicated by the inclination of the curve, the resistance of the sample decreases upon decreasing scan rates (Fig. 11 a and b). This information is also conveyed by the specific capacitance plot in Fig. 11c. The specific capacitance typically depends on the C–V scan rate due to the effect of electrolyte diffusion. The enhancement factor at a scan rate of 20 mV s−1 is more than 10-fold.
Multiple C–V scans were conducted on 30 μg of AuNPs per 200 mg of AC sample (Fig. 12). The open-edge sample (Fig. 2b) was immersed in a Na2SO4 electrolyte while the contacts with the current collectors were above the electrolyte level. This way, one avoids drying due to inappropriate sealing. The change between the first and last scan was less than 2%, exhibiting a small capacitance increase.
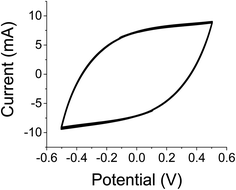 | ||
| Fig. 12 125 C–V scans for 30 μg of AuNPs per 200 mg of AC sample in 1 M Na2SO4 at a rate of 50 mV s−1 exhibited <2% change between the first and last scan. | ||
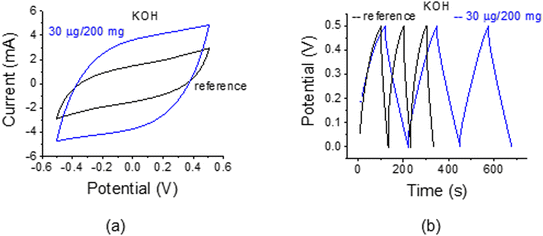
Finally, we replaced the 1 M Na2SO4 electrolyte with 1 M KOH (see also ref. 33–35). The open edge sample was thoroughly washed with water and the glassy filter was replaced with no visible damage to the electrodes. The C–V and C–D traces in Fig. 13 indicate a large enhancement factor of ca. 3 and 4.5, respectively for the specific capacitance. Indirectly, the experiments also point to the integrity of the electrodes and the strength of the bond between the AC and the AuNPs.
b Simulations
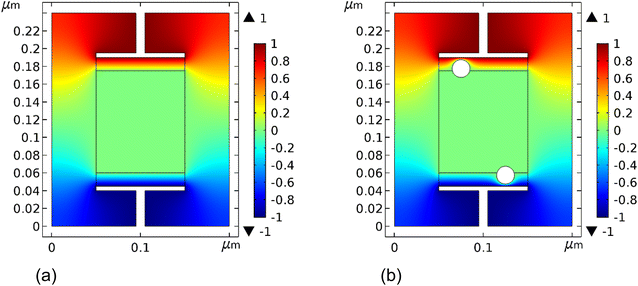
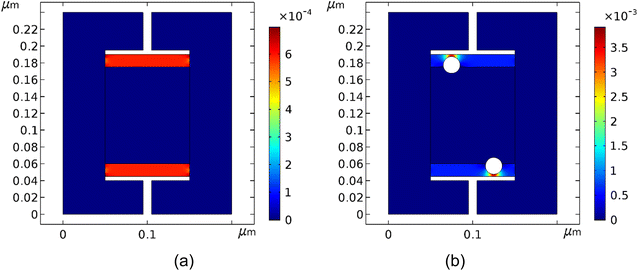
In the simulations, one compares two cases: (1) a cell without metal colloids; (2) a cell with colloids extruding into the neutral region. A portion of the SC was modelled using a parallel plate capacitor with a graphitic film of finite conductance that is deposited on top of a metallic current collector. A gold particle is partially embedded inside the graphic film. The neutral region is situated at the cell's center and a bias is provided between the two current collectors: ±Vin. The surface potential of the neutral region and the surface potential of the metal colloids are floating, and hence depend on the local field. As a result and as expected, the simulation indicates that the neutral region maintains zero potential when the electrodes are biased (Fig. 14). The colloid radius was 10 nm (particle size or particle diameter of 20 nm). Larger particles would result in larger polarization effect. The otherwise observed capacitance increase is diminished when the colloids are embedded away from the electrode. This corroborates the experiments; when the AuNPs were mostly part of the electrolyte, the efficiency of the capacitor was substantially diminished. The conductivity of the graphitic material matters only if its conductance is comparable to the current collectors' value; this is generally not the case since the current collector is treated as a perfect conductor and the graphite-like material has a much smaller conductivity.The local polarization in response to the external bias is shown in Fig. 15. The latter points to a large polarization increase in the cell in the presence of the AuNPs, specifically, between the sphere and the electrode.
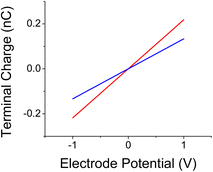
The capacitance of the cell is proportional to the charge on the electrode. Fig. 16 shows the change in the electrode charge as a function of the cell bias. The electrode charge, Q, is related to the bias, Vin, as, Q = CVin, with C, the cell capacitance. The cell capacitance is therefore, C = Q/Vin and it is constant since the charge on the electrode varies linearly with Vin. The slope of the curve (the capacitance) increases in the presence of the AuNPs. The curves of Fig. 12 are translated to cell capacitance values of: 0.133 and 0.22 nF, for respectively, cells without colloids and cells with them.
While not shown, packing more colloids, say two AuNPs on each surface, obviously increases the cell capacitance but only up to a point. The cell capacitance for very closely packed colloids on each surface is actually smaller than that when they are placed apart. Simulation wise, the change is not large (ca. 2.5%), yet noticeable and is attributed to a strong dipole–dipole interaction.
In the introduction we made the case that the metallic colloids on the surface of an electrode may be viewed as electrical dipoles – the free electronic charge enables the polarization of the metal colloid under an external field between the surface of the electrode (the AC film on the current collector) and the equal and opposite charge of the ions. The capacitance increase in this case was attributed to the formation of local dipoles and the interaction between them. Another point of view is to treat the colloids as small metallic capacitors. These are also polarized under an external bias. However, along with this view (a capacitor-within-capacitor, see ref. 36) the capacitance increase is attributed to the large polarization between the colloid and the nearest electrode surface as seen in Fig. 15b. Putting it simply, the smaller the distance between the colloid and electrode, the greater the effect.
IV. Discussion
Experimentation and simulations exhibited a substantial enhancement of specific capacitance upon treating active carbon electrodes with AuNPs. This effect occurred under various conditions (hydrophobic and hydrophilic polymeric binders, electrolytes and various AuNPs/AC mass ratios). The effect was quite strong exhibiting amplification factors of 10 despite the small mass of AuNPs with respect to the mass of AC – a ratio of four orders of magnitude. In addition, the concentration used for the AuNPs is three orders of magnitude smaller than the concentration used for the optically excited, yet neutral semiconductor colloids.15,29 Optical excitations of the semiconductor particles made their oscillator strength similar to that of metallic colloids; yet, the semiconductor particles were dispersed throughout the entire film, including the binder. This observation in addition to the simulations points to the effective role of placing the metallic colloids within the double layer region, close to the AC electrode.It was also found out that the cell's capacitance was not affected by adding the colloids to the electrolyte, most likely due to ion screening. The bare current collector exhibited small capacitance variations with respect to the AuNP concentration, which points to the important role played by the porous AC films. An increase in the AC mass (100 mg mL−1 in Fig. 8vs. 200 mg mL−1 in Fig. 9) did not affect the presence of a large specific capacitance peak in our experiments. This suggests that most if not all of the AuNPs were adsorbed by the porous electrode regardless of their initial concentration levels. This also reaffirms the use of gravitonic or volumetric specific capacitance because such a normalization method factors out contributions from the film thickness. One takes advantage of the negatively charged ligand coating of the AuNPs, which enabled better colloidal adherence to the active carbon electrode yet kept it at some distance from it. Proof that the interaction between AuNPs and the AC electrode was electrostatically strong was provided by Fig. 2 and 13. For Fig. 2, further dilution of the batch did not alter the titration trend; for Fig. 13, replacing the electrolyte did not diminish the presence of an enhancement factor.
Previous reports on AuNPs/AC electrodes were made at a much larger colloidal loading (that could lead to clustering) while obtaining a much smaller amplification factor.37,38 When the AuNPs become part of the electrode their major impact is to reduce the electrode conductance. Simulations, however, indicate the importance of separation between the AuNPs and the electrode for the amplified polarization effect (Fig. 15). The ligand that is coating the AuNPs acts as a separator. The negatively charged ligand maintains a homogeneous suspension; yet, too much colloidal loading affects their packing on the sample's surface. Indeed, beyond the specific capacitance peak one observes large specific capacitance fluctuations (e.g., Fig. 7 and 9), which suggest that the larger packing of AuNPs increases the inhomogeneous colloid dispersion throughout the AC electrode surface.
V. Conclusion
Incorporating negatively charged, functionalized gold particles (at the level of tens of μg) with active carbon (at the level of hundreds of mg) in aqueous based supercapacitors exhibited a large specific capacitance amplification (gravitonic or volumetric) that can reach ten-fold when compared to their reference. With the help of simulations, this was attributed to the large polarization effect between the colloids and the adjacent electrode. The metal colloids were held at some distance from the electrode due to a negatively charged coating that also acted as a separator. The amplification effect was somewhat diminished and large capacitance fluctuations were noted upon increasing the packing of colloids. Simulations suggested that clustering of AuNPs on the AC surface will result in a smaller polarization effect due to nearest-neighbor, dipole–dipole interactions. Light did not have a large effect on these samples.Conflicts of interest
There are no conflicts to declare.References
- B. John and W. Jackson, The properties of artificial dielectrics at centimetre wavelengths, Proceedings of the IEE-Part B: Radio and Electronic Engineering, 1955, 102(1), 11–16 Search PubMed.
- R. E. Collin, Field Theory of Guided Waves, Wiley-IEEE Press, 2nd edn, 1990 Search PubMed.
- S.-C. Wu and H. Grebel, Phase shifts in coplanar waveguides with patterned conductive top covers, J. Phys. D: Appl. Phys., 1995, 28, 437–439 CrossRef CAS.
- H. Grebel and P. Chen, Artificial dielectric polymeric waveguides: metallic embedded films, JOSA A., 1991, 8, 615–618, DOI:10.1364/JOSAA.8.000615.
- H. Grebel and P. Chen, Artificial dielectric polymeric waveguides: semiconductor-embedded films, Opt. Lett., 1990, 15, 667–669, DOI:10.1364/OL.15.000667.
- K.-C. Tsay, L. Zhang and J. Zhang, Effects of electrode layer composition/thickness and electrolyte concentration on both specific capacitance and energy density of supercapacitor, Electrochim. Acta, 2012, 60, 428–436 CrossRef CAS.
- Y. Li, X. Xu, Y. He, Y. Jiang and K. Lin, Nitrogen doped macroporous carbon as electrode materials for high capacity of supercapacitor, Polymers, 2017, 9, 2, DOI:10.3390/polym9010002.
- M. Kaempgen, C. K. Chan, J. Ma, Y. Cui and G. Gruner, Printable thin film supercapacitors using single-walled carbon nanotubes, Nano Lett., 2009, 9, 1872–1876 CrossRef CAS PubMed.
- M. Inagaki, H. Konno and O. Tanaike, Carbon materials for electrochemical capacitors, J. Power Sources, 2010, 195, 7880–7903 CrossRef CAS.
- S. Zhang and N. Pan, Supercapacitors performance evaluation, Adv. Energy Mater., 2015, 5, 1401401, DOI:10.1002/aenm.201401401.
- M. S. Rahmanifar, M. Hemmati, A. Noori, M. F. El-Kady, M. F. Mousavi and R. B. Kaner, Asymmetric supercapacitors: an alternative to activated carbon negative electrodes based on earth abundant elements, Mater. Today Energy, 2019, 12, 26–36, DOI:10.1016/j.mtener.2018.12.006.
- B. K. Kim, S. Sy, A. Yu and J. Zhang, Electrochemical supercapacitors for energy storage and conversion, Handbook of Clean Energy Systems, 2015, pp. 1–25 Search PubMed.
- X. Miao, R. Rojas-Cessa, A. Mohamed and H. Grebel, The Digital Power Networks: Energy Dissemination Through a Micro-Grid, Proceedings - IEEE 2018 International Congress on Cybermatics, pp. 230–235, DOI:10.1109/Cybermatics_2018.2018.00068.
- R. Rojas-Cessa, H. Grebel, Z. Jiang, C. Fukuda, H. Pita, T. S. Chowdhury, Z. Dong and Y. Wan, Integration of alternative energy sources into digital micro-grids, Environ. Prog. Sustainable Energy, 2018, 37, 155–164, DOI:10.1002/ep.
- H. Grebel, Optically Controlled Supercapacitors: Functional Active Carbon Electrodes with Semiconductor Particles, Materials, 2021, 14(15), 4183, DOI:10.3390/ma14154183.
- M. Jaroniec, R. K. Gilpin and J. Choma, Correlation between microporosity and fractal dimension of active carbons, Carbon, 1993, 31, 325–331 CrossRef CAS.
- F. E. Dolle, A. Lavancy and F. Stoeckll, Determination of the surface dimension of fractal dimension of active carbon by mercury porosimetry, J. Colloid Interface Sci., 1994, 166, 451–461 CrossRef.
- F. Li, B. Yan, J. Zheng, J. Chen, R. Wei, S. Jiang, W. Yang, Q. Zhang and S. He, Soybean protein-derived N, O co-doped porous carbon sheets for supercapacitor applications, New J. Chem., 2022, 46, 10844–10853, 10.1039/D2NJ01355J.
- Si Zheng, J. Zhang, H. Deng, Y. Du and X. Shi, Chitin derived nitrogen-doped porous carbons with ultrahigh specific surface area and tailored hierarchical porosity for high performance supercapacitors, J. Bioresour. Bioprod., 2021, 6, 142–151, DOI:10.1016/j.jobab.2021.02.002.
- M. Reza Saeb, N. Rabiee, F. Seidi, B. F. Far, M. Bagherzadeh, E. C. Lima and M. Rabiee, Green CoNi2S4/porphyrin decorated carbon-based nanocomposites for genetic materials detection, J. Bioresour. Bioprod., 2021, 6, 215–222, DOI:10.1016/j.jobab.2021.06.001.
- C. Du, P. Li, Z. Zhuang, Z. Fang, S. He, L. Feng and W. Chen, Highly porous nanostructures: Rational fabrication and promising application in energy electrocatalysis, Coord. Chem. Rev., 2022, 466, 214604, DOI:10.1016/j.ccr.2022.214604.
- Y. Gogotsi and P. Simon, True Performance Metrics in Electrochemical Energy Storage, Science, 2011, 334, 917, DOI:10.1126/science.1213003.
- J. Turkevich, Colloidal Gold. Part I: historical and preparative aspects, morphology and structure, Gold Bull., 1985, 18, 86–91 CrossRef CAS.
- J. Turkevich, Colloidal Gold. Part II: colour, coagulation, adhesion, alloying and catalytic properties, Gold Bull., 1985, 18, 125–131 CrossRef CAS.
- W. Haiss, N. T. K. Thanh, A. Jenny and D. G. Fernig, Determination of Size and Concentration of Gold Nanoparticles from UV-Vis Spectra, Anal. Chem., 2007, 79, 4215–4221 CrossRef CAS PubMed.
- X.-D. Zhang, D. Wu, X. Shen, P.-X. Liu, N. Yang, B. Zhao, H. Zhang, Y.-M. Sun, L.-A. Zhang and F.-Y. Fan, Size-dependent in vivo toxicity of PEG-coated gold nanoparticles, Int. J. Nanomed., 2011, 6, 2071–2081, DOI:10.2147/IJN.S21657.
- J. Stetefeld, S. A. McKenna and T. R. Patel, Dynamic light scattering: a practical guide and applications in biomedical sciences, Biophys. Rev., 2016, 8, 409–427, DOI:10.1007/s12551-016-0218-6.
- R. Mercado-Lubo, Y. Zhang, L. Zhao, K. Rossi, X. Wu, Y. Zou, A. Castillo, J. Leonard, R. Bortell, D. L. Greiner, L. D. Shultz, G. Han and B. A. McCormick, A Salmonella nanoparticle mimic overcomes multidrug resistance in tumours, Nat. Commun., 2016, 12225 CrossRef CAS PubMed.
- H. Grebel, Asymmetric supercapacitors: optical and thermal effects when active carbon electrodes are embedded with nano-scale semiconductor dots, C, 2021, 7, 7, DOI:10.3390/c70100072.
- B.-A. Mei, O. Munteshari, J. Lau, B. Dunn and P. Laurent, Physical Interpretations of Nyquist Plots for EDLC Electrodes and Devices, J. Phys. Chem. C, 2018, 122, 194–206, DOI:10.1021/acs.jpcc.7b10582.
- S. Lehtimäki, R. Anna, J. Keskinen, M. Kujala, S. Tuukkanen and D. Lupo, Performance, stability and operation voltage optimization of screen-printed aqueous supercapacitors, Sci. Rep., 2017, 7, 46001, DOI:10.1038/srep46001.
- Q. Xie, X. Huang, Y. Zhang, S. Wu and P. Zhao, High performance aqueous symmetric supercapacitors based on advanced carbon electrodes and hydrophilic poly(vinylidene fluoride) porous separator, Appl. Surf. Sci., 2018, 443, 412–420 CrossRef CAS.
- Q. Zhang, B. Yan, F. Li, J. Zheng, B. You, J. Chen, X. Zhao, C. Zhang, S. Jiang and S. He, Progress in the use of organic potassium salts for the synthesis of porous carbon nanomaterials: microstructure engineering for advanced supercapacitors, Nanoscale, 2022, 14, 8216–8244, 10.1039/D2NR01986H.
- C. Wang, B. Yan, J. Zheng, F. Li, Z. Chen, Q. Zhang, T. Liao, J. Chen, S. Jiang, C. Du and S. He, Recent progress in template-assisted synthesis of porous carbons for supercapacitors, Adv. Powder Technol., 2022, 1, 100018, DOI:10.1016/j.apmate.2021.11.005.
- B. Yan, J. Zheng, F. Wang, L. Zhao, Q. Zhang, W. Xu and S. He, Review on porous carbon materials engineered by ZnO templates: Design, synthesis and capacitance performance, Mater. Des., 2021, 201, 109518, DOI:10.1016/j.matdes.2021.109518.
- H. Grebel, Capacitor-within-capacitor, SN Appl. Sci., 2019, 1, 48, DOI:10.1007/s42452-018-0058-z.
- D. Avila-Brandea, D. Arenas-Estebana, L. Carlos Otero-Díaza, A. Guerrero-Martínezb, G. Tardajosb and J. Carretero-Gonzálezc, Activated nanoporous carbon–gold nanoparticle composite electrode with enhanced volumetric capacitance, RSC Adv., 2015, 5, 8628 Search PubMed.
- H. Ma, Z. Chen, X. Gao, W. Liu and H. Zhu, 3D hierarchically gold-nano particle decorated porous carbon for high performance supercapacitors, Sci. Rep., 2019, 9, 17065, DOI:10.1038/s41598-019-53506-6.
| This journal is © The Royal Society of Chemistry 2023 |

