
 Open Access Article
 This Open Access Article is licensed under a Creative Commons Attribution-Non Commercial 3.0 Unported Licence
Porosity evolution and oxide formation in bulk nanoporous copper dealloyed from a copper–manganese alloy studied by in situ resistometry†
Elisabeth
Hengge
 *a,
Jakob
Ihrenberger
a,
Eva-Maria
Steyskal
a,
Ricardo
Buzolin
bc,
Martin
Luckabauer
d,
Christof
Sommitsch
b and
Roland
Würschum
a
*a,
Jakob
Ihrenberger
a,
Eva-Maria
Steyskal
a,
Ricardo
Buzolin
bc,
Martin
Luckabauer
d,
Christof
Sommitsch
b and
Roland
Würschum
a
aInstitute of Materials Physics, Graz University of Technology, Petersgasse 16, A-8010 Graz, Austria. E-mail: e.hengge@tugraz.at; Tel: +43 316 873-8481
bInstitute of Materials Science, Joining and Forming, Graz University of Technology, Kopernikusgasse 24, A-8010 Graz, Austria
cChristian Doppler Laboratory for Design of High-Performance Alloys by Thermomechanical Processing, Kopernikusgasse 24, 8010 Graz, Austria
dDepartment of Mechanics of Solids, Surfaces and Systems, Faculty of Engineering Technology, University of Twente, Drienerlolaan 5, 7522NB Enschede, The Netherlands
First published on 28th November 2022
Abstract
The synthesis of bulk nanoporous copper (npCu) from a copper–manganese alloy by electrochemical dealloying and free corrosion as well as the electrochemical behaviour of the dealloyed structures is investigated by in situ resistometry. In comparison to the well-established nanoporous gold (npAu) system, npCu shows strongly suppressed reordering processes in the porous structure (behind the etch front), which can be attributed to pronounced manganese oxide formation. Characteristic variations with the electrolyte concentration and potential applied for dealloying could be observed. Cyclic voltammetry was used to clarify the electrochemical behaviour of npCu. Oxide formation is further investigated by SEM and EDX revealing a hybrid composite of copper and manganese oxide on the surface of a metallic copper skeleton. Platelet-like structures embedded in the porous structure are identified which are rich in manganese oxide after prolonged dealloying. As an outlook, this unique heterogeneous structure with a large surface area and the inherent properties of manganese and copper oxides may offer application potential for the development of electrodes for energy storage and catalysis.
1 Introduction
Porous metals are promising materials in many fields of application including (bio-)catalysis,1,2 energy storage3–5 and sensing.6,7 In particular, nanoporous metal electrodes prepared by selective etching, so-called (electrochemical) dealloying, are highly interesting due to their free-standing structure, high surface-to-volume ratio and thermal as well as electrical conductivity. By far the best known nanoporous metal is nanoporous gold (npAu), but also other noble metals such as nanoporous platinum (npPt), palladium (npPd) or silver (npAg) have been investigated extensively.7–9 For future application, nanoporous metals based on noble metal alloys might not be suitable because of their high costs and environmental impact. Hence, non-precious metals have gained increasing interest, among which is nanoporous copper (npCu). Nanoporous copper electrodes exhibit a variety of potential applications in green and sustainable chemistry, e.g. as anode materials for lithium-ion batteries,10–12 as catalysts13–15 and for sensors.16 In the literature, synthesis of npCu from AlCu,16–20 SnCu,11 TiCu,21 CeCu,22 NiCu,17 ZnCu17,23,24 and CuMn25–27 has been reported, whereby the resulting nanoporous structures differ greatly depending on experimental parameters and alloy composition. Among them, nanoporous copper from copper–manganese gained a lot of interest as it exhibits one of the largest differences in electrochemical potential (difference of 1.477 V between Mn/Mn2+ and Cu/Cu2+)28 from the alloys mentioned above. This characteristic feature is essential for successful electrochemical dealloying. Furthermore, a single phase alloy can be obtained.Up to now, only a few studies are available which focus on the systematic understanding of the dealloying of this alloy system. Early investigations on the dealloying process and the porous structure of copper manganese alloys started in the 1980s,29–31 but studies on microstructural composition of the porous structure32,33 or electrocatalytic performance13,25 have been performed only in recent years. Also, strong influence of the pH-value and concentration26,28,34 of the electrolyte as well as of previous heat treatment35 has been reported. The high chemical reactivity of both copper and manganese makes the (electro-)chemistry of these systems highly complex. For example, pronounced oxide formation of both alloy components has been reported25,32 but a full understanding of the underlying kinetics is still missing. At the same time, deliberate control of oxide formation is of great importance for many applications including energy storage and sensing.14,25,25,36
Studies of the dealloying and the electrochemical performance of dealloyed npCu will significantly contribute to the fundamental understanding of the structural evolution. There are several methods for investigating dealloying processes (including X-ray scattering,37–39 X-ray diffraction,40 and electron microscopy41,42), but most methods are surface specific and focus on small volumes. One method, which is particularly well suited to investigate the dealloying process on a larger scale is in situ resistometry43 which enables the monitoring of the entire sample and the study of the evolution of the porous structure in real time. This method has been recently applied by our group for studying npPt,43,44 npPd,45 and npAu.44,46
The present work aims at a comprehensive investigation of npCu using in situ resistometry to analyse the structural evolution during electrochemical dealloying as well as the electrochemistry of the dealloyed state. The findings are compared to data obtained by scanning electron microscopy (SEM) and energy-dispersive X-ray spectroscopy (EDS). Potential-controlled dealloying in different electrolytes and varying potentials is compared to free corrosion (chemical dealloying). In situ resistometry shows that oxide formation strongly influences the surface diffusivity. The formation of manganese oxide incorporated in the porous structure as a result of prolonged dealloying is identified. The findings significantly contribute to the understanding of the dealloying mechanisms as well as electrochemical performance of CuMn alloys. Potential future application fields include energy storage and catalysis.
2 Materials and methods
2.1 Electrochemical dealloying and characterization
The master alloy for dealloying was prepared following the preparation routine described by Hayes et al.26 The alloy composition was evaluated using X-ray diffraction (XRD) and energy dispersive X-ray spectroscopy (EDS), revealing an fcc structure with a final composition of 68 at% Mn and 32 at% Cu. The XRD spectrum is shown in Fig. SI-1 in the ESI.†The master alloy was cut into small sample pieces (approx. 10 × 12 × 0.7) mm with an average weight of 120 mg) using a high precision saw. Directly before each measurement, the respective sample was ground with a piece of SiC paper to remove any oxide layer formed during cutting and storage. After rinsing with ethanol, the sample was then wrapped with copper wires for electrical contact. All electrochemical measurements were performed in a three electrode setup with concomitant in situ resistometry. A schematic representation of the setup is shown in Fig. 1. Commercial Ag/AgCl (saturated KCl) was used as the reference electrode; a Pt-wire and a carbon cloth was used as the counter electrode for electrochemical dealloying and cyclic voltammetry, respectively. Each CuMn sample was made to come in contact with five wires, the middle one serving as the working electrode, the outer wires enabling a four point resistance measurement. Thereby, the two outermost wires were used for applying the current (100 mA pulses) and the inner two wires, for measuring the potential drop. Any influence of in situ resistometry on the electrochemical measurements was excluded in previous studies.44 To ensure that no mechanical stress was applied to the sample through the wires, the wires were mounted between two acrylic glass pieces which were glued together with a two-component adhesive. This mechanical fixation was placed well above the fluid surface to avoid any contact with the electrolyte (for details see Fig. 1). The electrochemical measurements were performed using an Autolab PGSTAT204 potentiostat, and the resistance change was monitored with a Keithley 2400 Source Meter. Solutions of 0.1 and 0.04 M HCl (diluted from 1 M HCl in high purity water) were used as electrolytes for dealloying based on the results presented by Wang et al.47 0.1 M KOH (prepared by dissolving an appropriate amount of KOH platelets (≥85% in high purity water) was used as the electrolyte for cyclic voltammetry. All chemicals were purchased from Carl Roth.
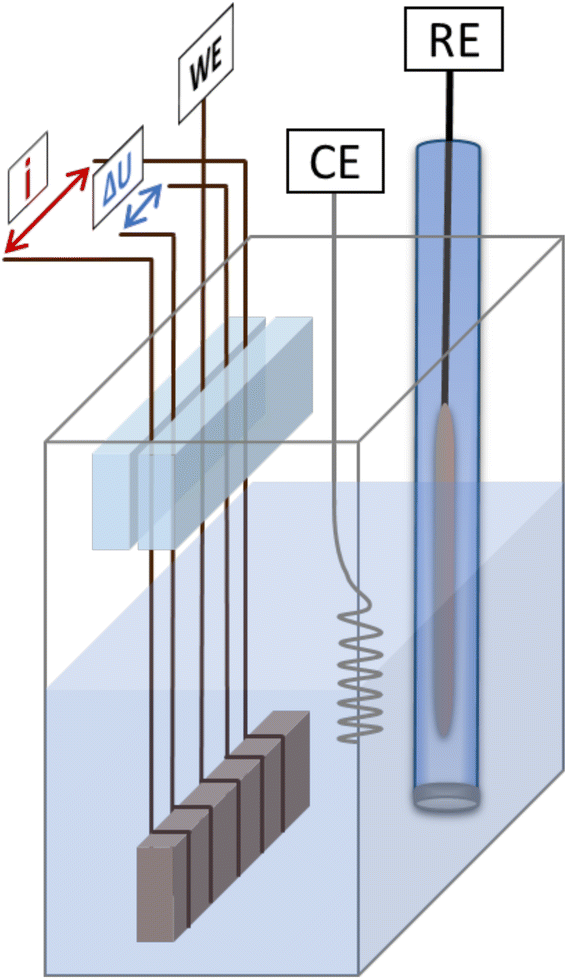 | ||
| Fig. 1 Schematic representation of the setup used for electrochemical dealloying with complementary in situ resistometry. The sample is made to come in contact with five Cu-wires, the middle one representing the working electrode (WE), and the outer four are used for applying current pulses (i) and measuring the potential drop (ΔU) for the four-point resistance measurement. RE and CE represent the reference and counter electrode, respectively. | ||
After dealloying, the electrochemical cell (including the sample) was immersed in distilled water. Subsequently, cyclic voltammograms (CV) were recorded in 0.1 M KOH and again monitored by in situ resistometry.
2.2 Scanning electron microscopy
For scanning electron microscopy (SEM) and energy dispersive X-ray spectroscopy (EDS), three additional samples were prepared following the same routine as described above (including dealloying and cycling in 0.1 M KOH), ensuring similar sample size and weights. After thoroughly rinsing with water and ethanol and subsequent drying, the samples were cut in half using a scalpel and mounted on the SEM sample holder. The SEM images and EDS spectra were recorded from the cross section of the sample. For microstructural analysis, the SEM images were analysed with ImageJ open source software.48The studies were performed using a TESCAN Mira3 electron scanning microscope equipped with an energy dispersive X-ray (EDS) Octane Super A spectrometer. Backscattered (BSE) and secondary electron (SE) micrographs were acquired using an acceleration voltage of 3 kV and 15 kV and a beam spot size between 2 nm and 30 nm. The working distance varied between 2 mm and 15 mm. EDS analysis was performed at an acceleration voltage of 15 kV with a beam spot size of 30 nm and a working distance of 15 mm. The chemical composition reported here is semi-quantitative as no calibrant was used for the analysis.
For determination of the overall elemental composition of dealloyed npCu, one sample was further analysed by X-ray fluorescence spectroscopy using a Panalytical Epsilon 1 XRF analyzer equipped with an Ag anode.
3 Results
3.1 Dealloying
To examine the influence of the potential and electrolyte concentration, dealloying was performed in 0.1 M HCl at −300 mV (sample R-1) and −500 mV (sample R-2) as well as in 0.04 M HCl at −300 mV (sample R-3). Prior to the dealloying experiments, a polarization curve (see Fig. SI-2 in the ESI†) was recorded with a separate CuMn sample to ensure proper choice of dealloying potential. One sample was dealloyed under free corrosion conditions in 0.1 M HCl (sample R-F). A list of the samples including the dealloying conditions is shown in Table 1.| Sample | m CuMn [mg] | A macro [cm2] | c elec [M] | U [mV] | m npCu [mg] |
|
|
|---|---|---|---|---|---|---|---|
| R-1 | 135.7 | 1.01 | 0.1 | −300 | 76.4 | 0.57 | 0.8 |
| R-2 | 127.6 | 0.78 | 0.1 | −500 | 72.2 | 0.58 | 0.57 |
| R-3 | 101.1 | 0.67 | 0.04 | −300 | 54.5 | 0.61 | 0.84 |
| R-F | 117.7 | 0.68 | 0.1 | f.c. | 56.4 | 0.68 | — |
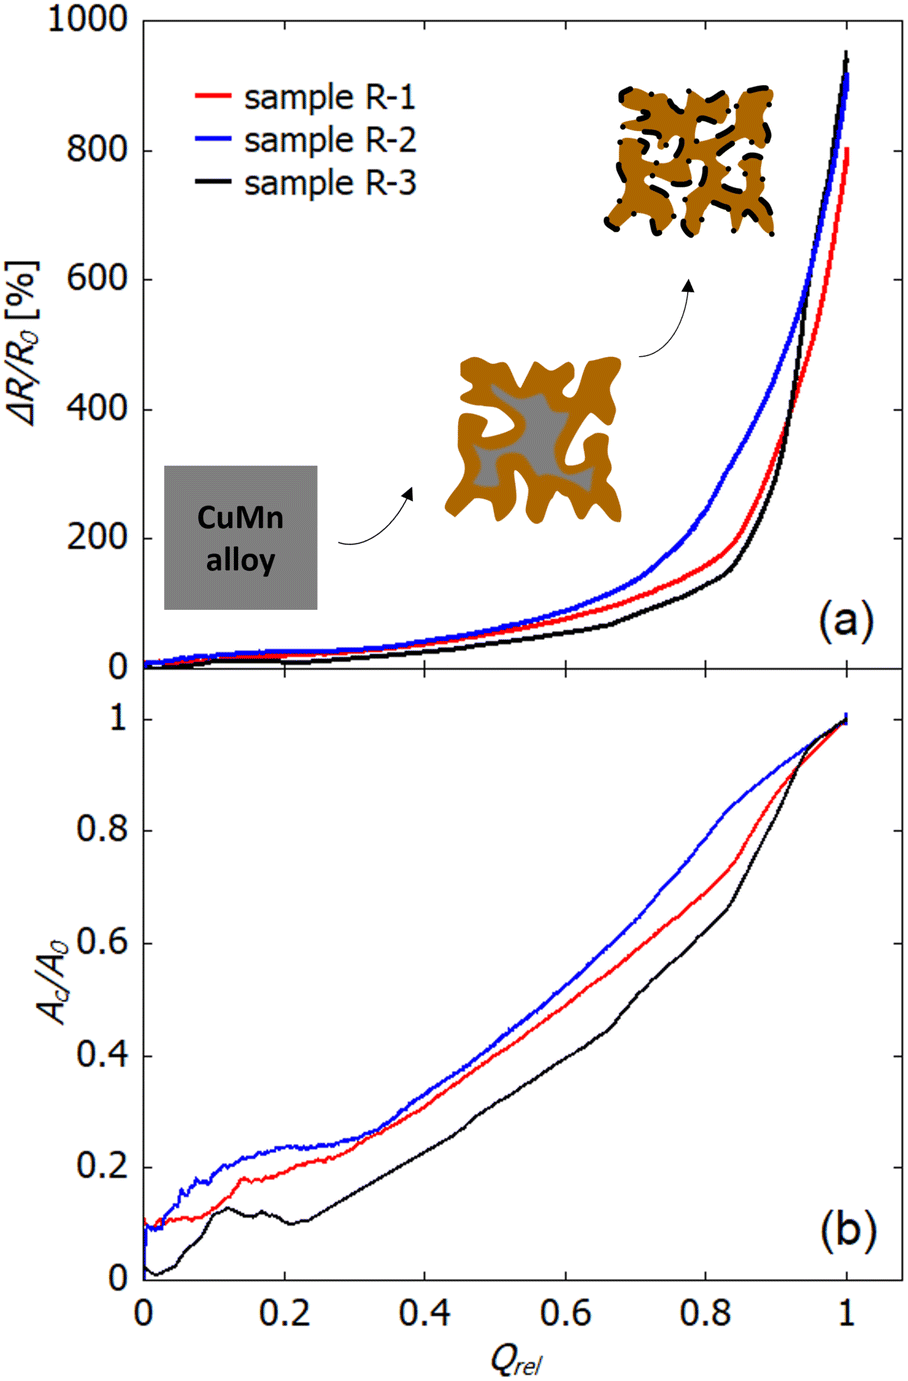
In Fig. 2 the current vs. time evolution (a) as well as the relative change in electrical resistance (b) during electrochemical dealloying is shown (samples R-1, R-2 and R-3). For better comparison and to account for the different sample sizes, the current is normalized by using the macroscopic surface area Amacro of each sample which is determined from the outer dimension of the CuMn sample. The values for Amacro are also given in Table 1.
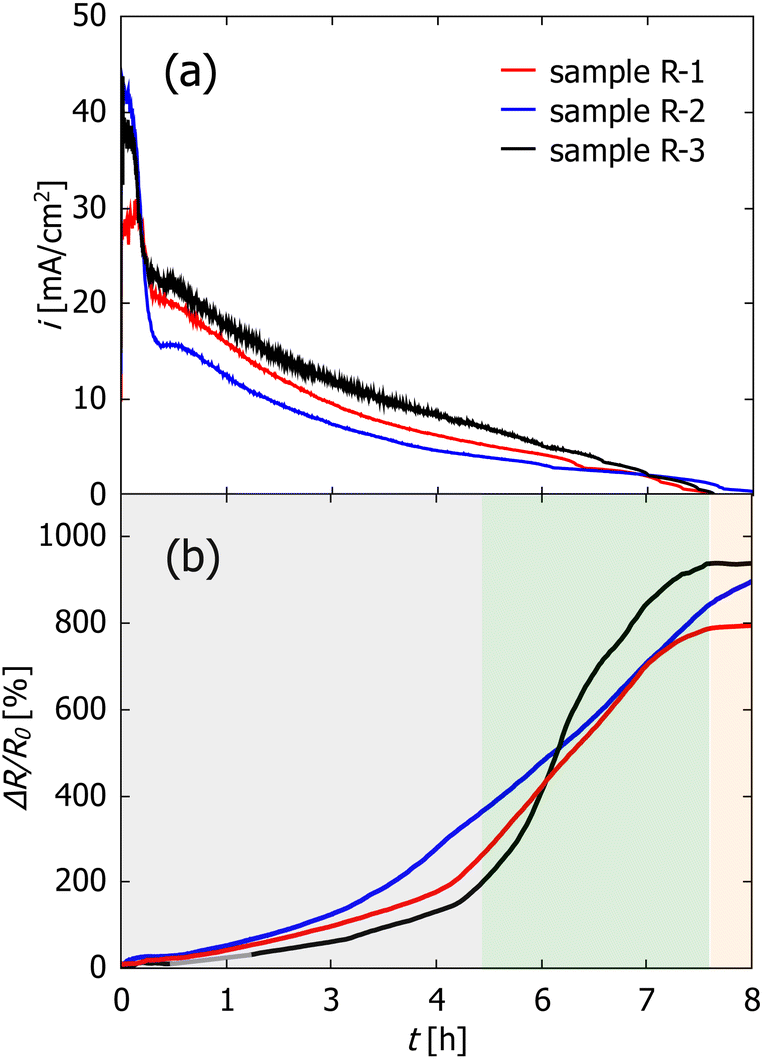 | ||
| Fig. 2 Current density in mA cm−2 (a) and change in relative electrical resistance ΔR/R0 in % (b) during potential-controlled dealloying. Sample R-1 was dealloyed in 0.1 M HCl at −300 mV (red), sample R-2 in 0.1 M HCl at −500 mV (blue) and sample R-3 in 0.04 M HCl at −300 mV (black). The background colors mark the different regimes in the dealloying process as discussed in the main text. | ||
The time evolution of the current density in Fig. 2(a) shows characteristics known from other dealloying experiments,43 starting at rather high currents followed by a steep decrease which is caused in this system by the depletion of Mn atoms on the surface. The decrease in current density is followed by a short period of constant current and a subsequent slow decrease which lasts up to 7–8 h of total etching time. This is then interrupted by a kink in current. Afterwards, the current stays nearly constant at slightly negative values (in the range of −10 to −100 μA cm−2).
The relative change ΔR/R0 in resistance in Fig. 2(b) can be divided into three regimes, which are marked by the different background colors. First the resistance increase is rather slow with a nearly linear increase up to 4 to 5 h hours of dealloying. Then, the resistance starts to increase very fast resulting in a resistance increase of three orders of magnitude. Finally, in the third regime which starts simultaneously with the current kink, the resistance change stays constant over the rest of the measurement time.
As visible in the curve of sample R-3 (Fig. 2(b)), no datapoints were recorded between 0.68 h (2440 s) and 1.7 h (6100 s) which is due to an error of the measurement device. However, as the resistance change is very small in this region, it was possible to fit the data in this timeslot with a linear fit (shown in grey).
Fig. 3 shows the relative change in electrical resistance of sample R-F during free corrosion in 0.1 M HCl. The sample was kept in the electrolyte until no change in resistance was observed over several hours (in total 170 h). For comparison, the dealloying curve of sample R-1 is reprinted from Fig. 2. For this sample, the applied potential (−300 mV) was held for 20 h in total. As clearly visible, ΔR/R0 increases significantly slower during free corrosion and thereby reaches a higher overall value, exceeding that of the potential-controlled sample (R-1) by a factor of 2. Again the three regions, as described above for the potential-controlled dealloyed samples, can be identified.
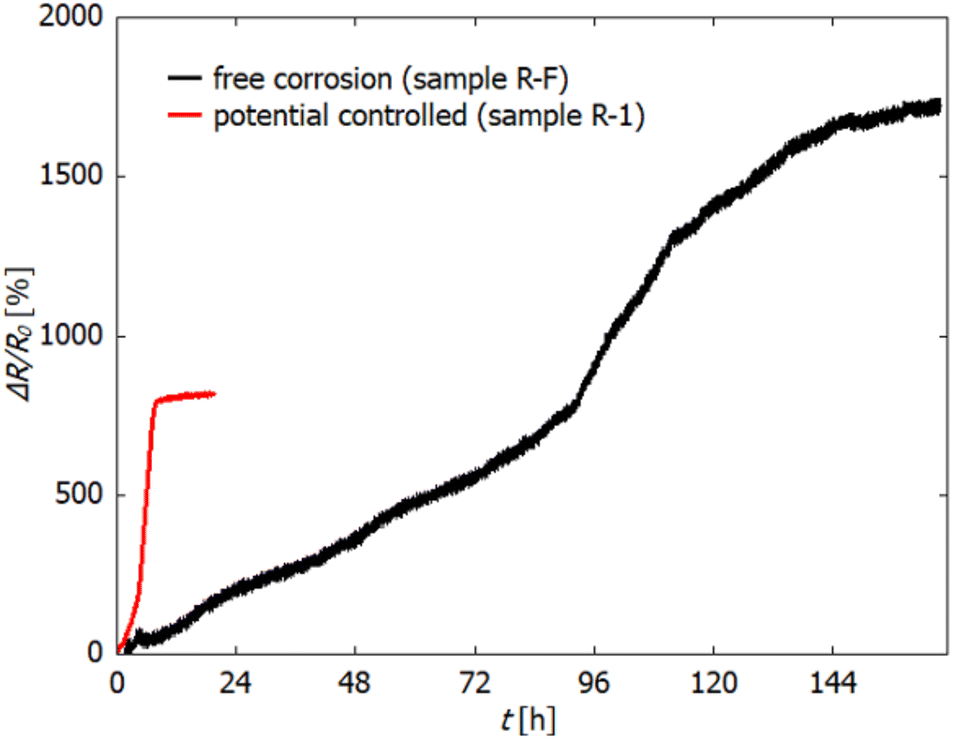 | ||
| Fig. 3 Relative change in electrical resistance (in %) during free corrosion of sample R-F in 0.1 M HCl (black). For comparison, the resistance change during electrochemically controlled dealloying at −300 mV vs. Ag/AgCl (sample R-1) is reprinted from Fig. 2 (red). | ||
The determination of the initial resistance R0 was hampered by fluctuations at the beginning of the measurement. These fluctuations arose from dissolution of Mn, which starts immediately upon immersion even without an applied potential, due to the low standard potential of Mn, which is associated with strong hydrogen bubble formation. Therefore, R0 was estimated by fitting the resistance increase in a later stage of dealloying (where the recorded data are reasonable stable) by using an exponential function which was then extrapolated towards the start of the measurement (t = 0). The value of the exponential function at t = 0 is set as R0, which for all samples is approx. 3–3.5 mΩ.
3.2 Behaviour of fully dealloyed electrodes
For electrochemical characterization of the dealloyed npCu samples, cyclic voltammograms were recorded in 0.1 M KOH and simultaneously the relative change in resistance was measured (see Fig. 4(a) and (b)). Again, the current is normalized with respect to the macroscopic surface area (Amacro in Table 1).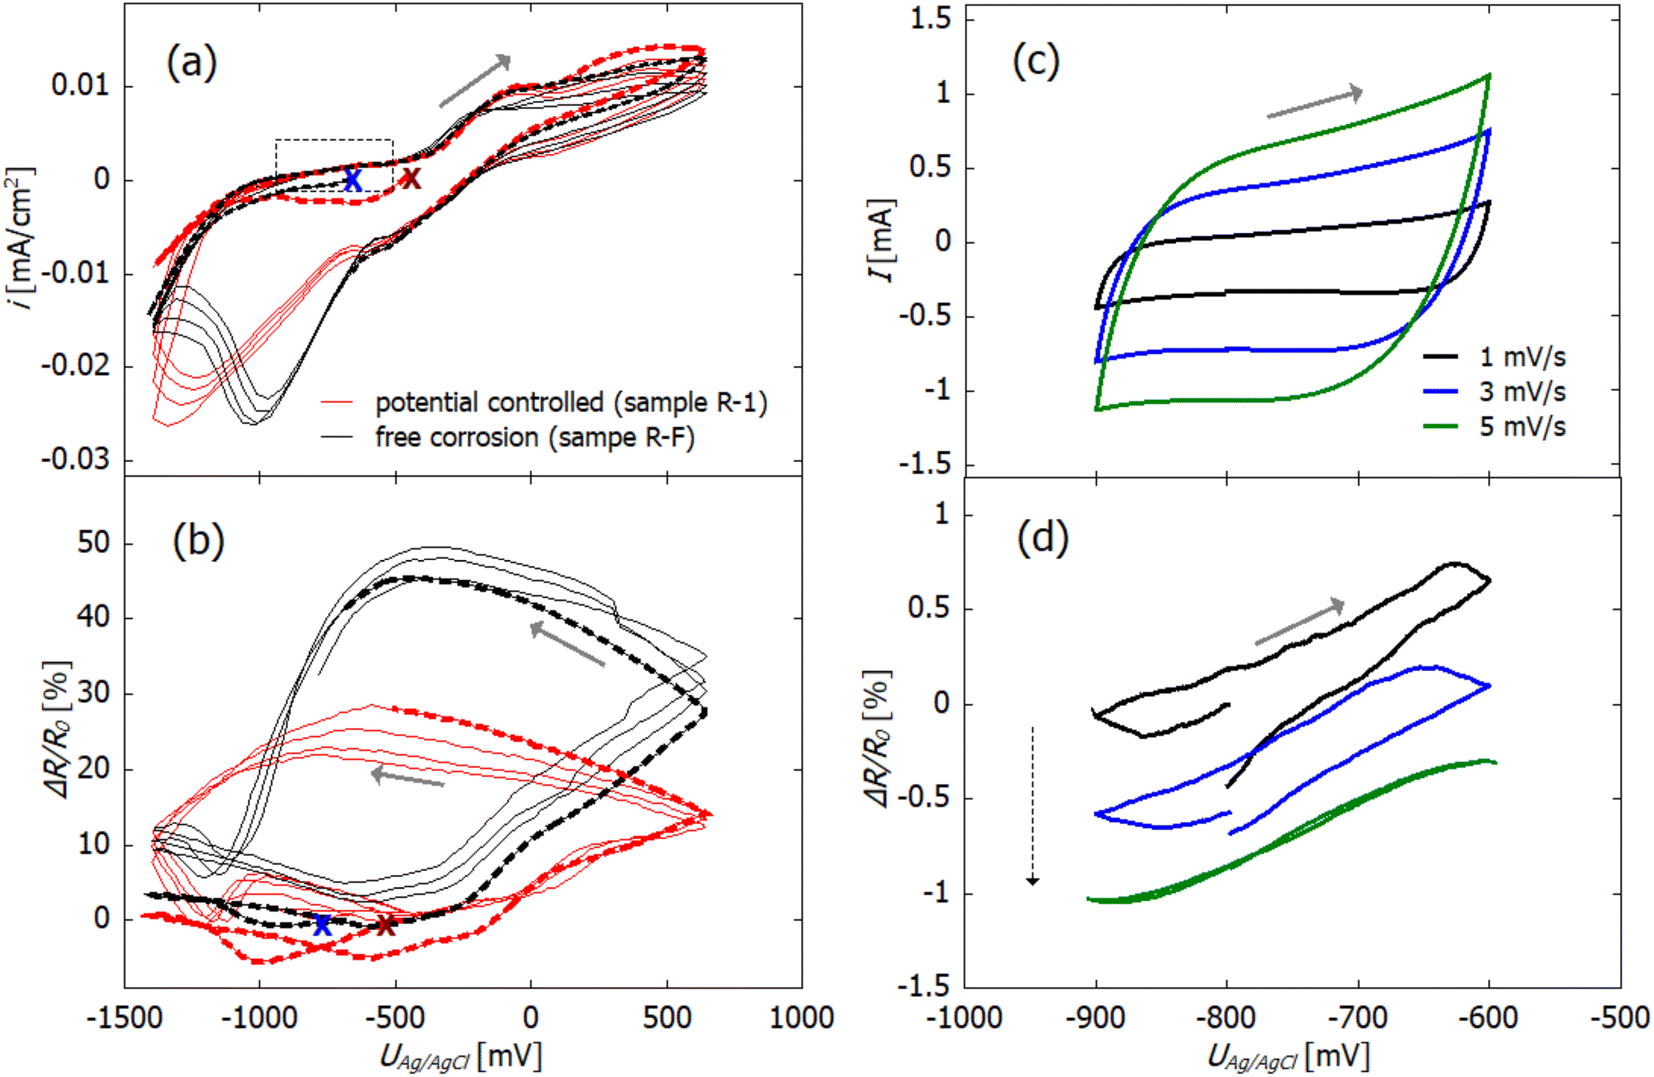 | ||
| Fig. 4 Cyclic voltammograms (a) and (c) of dealloyed npCu in 0.1 M KOH and concomitant relative change ΔR/R0 in resistance (b) and (d). (a) and (b) Potential controlled sample R-1 and free corrosion sample R-F; (c) and (d) sample R-F, only. In (a) and (b), the first cycles are indicated by the dashed lines whereby the starting point is marked by red (R-1) and blue crosses (R-F). In (a) and (b) the potential was scanned from −1400 to +350 mV with 5 mV s−1, and in (c) and (d) the potential range is chosen in the quasi double layer region between −900 and −600 mV. The grey rectangle in (a) marks the potential range investigated in (c) and (d). Scans recorded consecutively with 1, 3, and 5 mV s−1 are shown in (c) and (d). The grey arrows indicate the scan direction, and the dashed arrow in (d), the order of measurements. | ||
The open circuit potential (OCP) was in the range of −500 to −600 mV for all freshly dealloyed samples (Fig. 4(a)). The scan was started in the cathodic direction, so that the sample is first reduced before reversing the scan direction and letting (further) electrochemical oxidation of the sample take place (anodic scan). In total, 4.5 cycles are recorded for each sample which means that the measurements are stopped after reduction.
In the ΔR/R0vs U scans in Fig. 4(b), R0 refers to the resistance at the start of each measurement, which is marked by crosses in figure parts (a) and (b). In the first cycle (indicated with dashed lines), no significant change in resistance occurs in the cathodic scan for both samples. This fits the electrochemical data, as no reduction reaction is observed. In the following cycles, a relative resistance increase occurs in the anodic scan at potentials higher than −400 mV. After reversing the scan direction, the resistance increase continues which correlates with the remaining positive current and which, therefore, indicates ongoing oxidation. Under free corrosion (R-F), the relative resistance increase reaches up to 50%. For the potential-controlled sample (R-1), the overall relative change in resistance due to oxidation is significantly lower, only reaching approximately 25%. At approx. −250 mV, the sign of the current becomes negative and reduction sets in. In this potential region, the resistance increase levels off until the resistance starts to decrease at roughly −500 mV. Concomitant with the reduction, the resistance then decreases rapidly.
Although npCu does not exhibit a pure double layer region, charging of a quasi double layer can be examined by recording scan rate dependent CVs in the potential range between −900 and −600 mV (marked by the grey rectangle in Fig. 4(a)).
In Fig. 4 quasi double layer charging (c) with concomitant in situ resistometry (d) at varying scan rates between 1 and 5 mV s−1 is exemplarily shown for sample R-F. For this specific measurement, the absolute current is plotted as this is relevant for further analysis. For the sake of visibility, only three scan rates, namely 1, 3 and 5 mV s−1 are presented. Three cycles were measured for each scan rate, and only the third cycle is shown. In Fig. 4(c), a rectangular-shaped behaviour can be seen as it is characteristic for double layer charging. The dependence of the current on the increasing scan rates arises from the capacitive behaviour of the system.
Fig. 4(d) shows that the resistance change as a function of the applied potential has a linear dependence with a small hysteresis. Additionally, the shift in the course of the consecutive scans at 1, 3, and 5 mV s−1 (marked by the dashed arrow) indicates a superimposed continuous decrease of the resistance. This is most likely caused by the slow and continuous reduction of oxide as the quasi double layer lies in the reductive potential regime. It is possibly accompanied by slight coarsening which is a well known phenomenon during electrochemical cycling.49
3.3 Scanning electron microscopy
Three different samples were dealloyed in 0.1 M HCl for SEM: one at −300 mV for 20 h (sample M-1), one at −300 mV for 9 h (sample M-2), and one under free corrosion (sample M-F) conditions for 170 h, each followed by cycling in 0.1 M KOH. Sample M-1 was prepared the same way as sample R-1 (see Fig. 3). Dealloying of sample M-2 was cut off directly after the current fell below +5 μA for investigation of the influence of dealloying time (M-2 vs. M-1). Preparation conditions for sample M-F were identical to those for sample R-F.Fig. 5 shows scanning electron microscopy images from the cross section of the fully dealloyed samples. For each sample an inhomogeneous structure with a clear distinction between two regions is visible. One region is the porous structure with a ligament-morphology characteristic for nanoporous materials (left column S1 to S3) which accounts for the majority of the sample. As the second characteristic region, islands of porous plate-like structures (right column P1 to P3) appear on the sample. An overview of the surface morphology is given in Fig. SI-3 in the ESI.† The SEM images were analysed using the software ImageJ48 with respect to pore size and the diameter of the platelets. The results are summarized in Table 2 and will be discussed in Section 4.3.
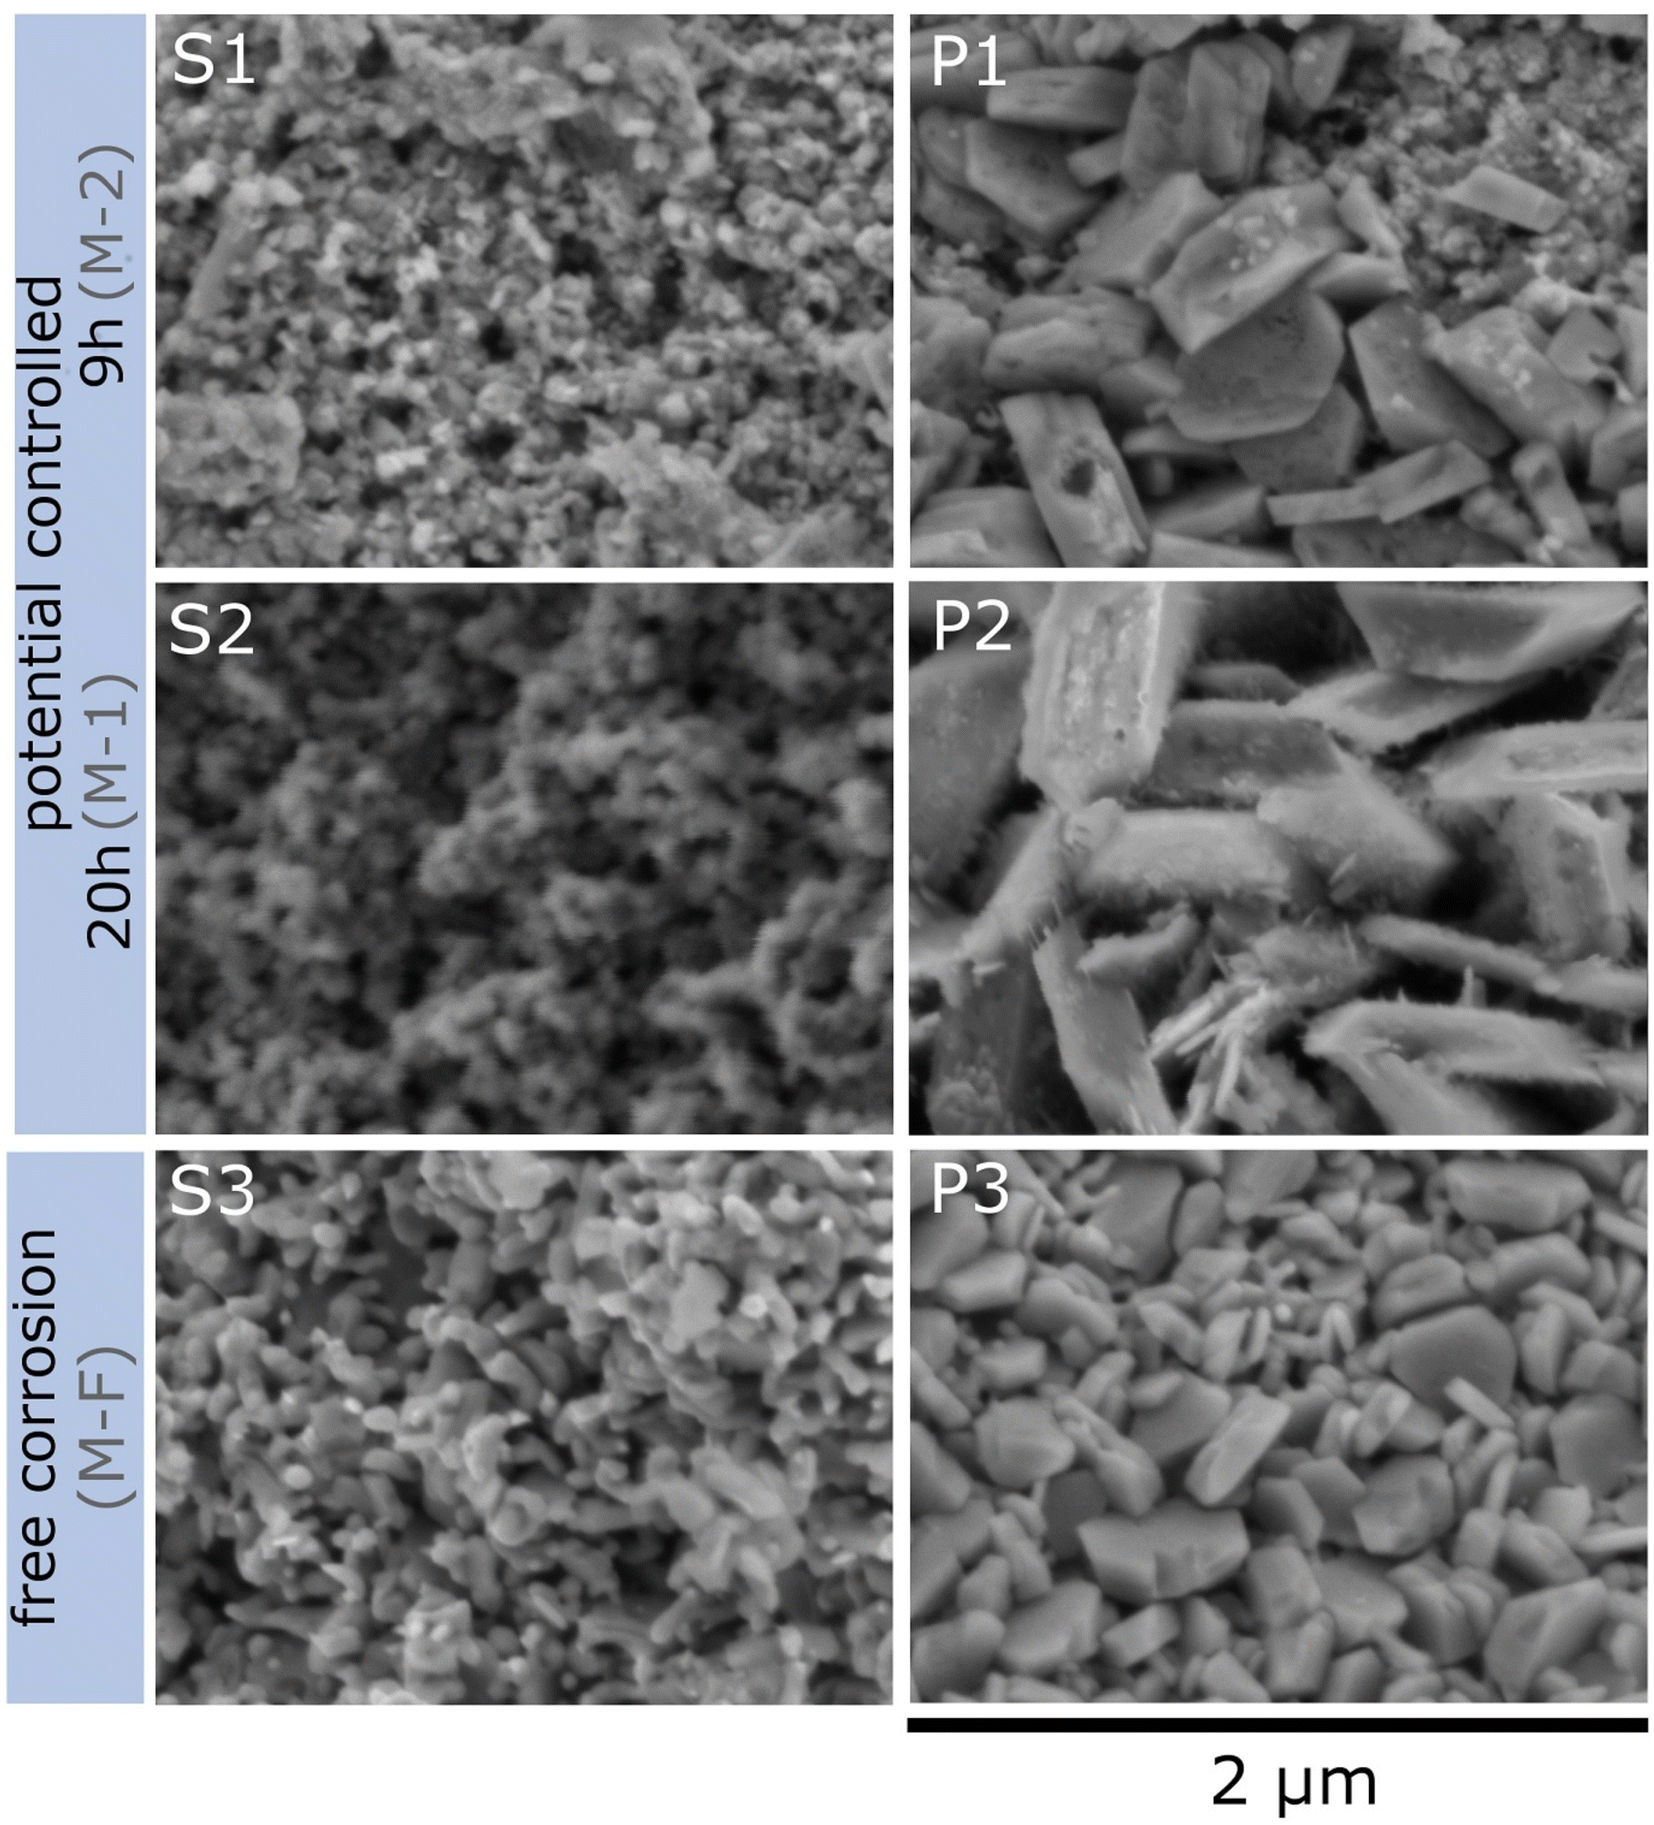 | ||
| Fig. 5 Scanning electron microscopy (SEM) images of dealloyed npCu. First row: sample M-2 (dealloying time 9 h); second row: sample M-1 (dealloying time 20 h); M-2 and M-1 were both dealloyed at −300 mV. Third row: sample M-F (dealloying time 170 h, free corrosion). The left column shows images taken from the porous structure, and the right column shows the platelets as discussed in the main text. | ||
| Sample | Platelets [nm] | Pores [nm] |
|---|---|---|
| M-2 | 450 | 55 |
| M-1 | 610 | 66 |
| M-F | 280 | 60 |
EDS spectra were recorded at several individual points on sample M-1, indicating that on average the porous structure consists of 36 at% O, 24 at% Mn and 40 at% Cu and a plate-like structure of 61 at% O, 32 at% Mn and 6 at% Cu (EDS spectra from the porous structure and from the platelets are shown in Fig. SI-4 in the ESI†). The elemental composition clearly reveals that significant amounts of oxides are present on the surface of the dealloyed structure. The platelets appear to consist of Mn-oxide.
For more detailed insights into these structures, EDS mapping was performed on overview images of the platelet-rich regions of samples M-2 (dealloyed for 9 h) and M-1 (dealloyed for 20 h). The compositional mapping for Cu, Mn and O is shown in Fig. 6. Clearly, the composition of the platelets changes with dealloying time. For the shorter dealloying time (sample M-2) the platelet-like structures consist of Cu-oxide as well as of Mn-oxide for the sample, whereas for the longer dealloying time (sample M-1) the concentration of Mn-oxide is significantly enriched. XRF analysis was further performed on sample M-1 revealing that the overall ratio between Cu and Mn is 16% to 84%. Oxygen cannot be detected by this method.
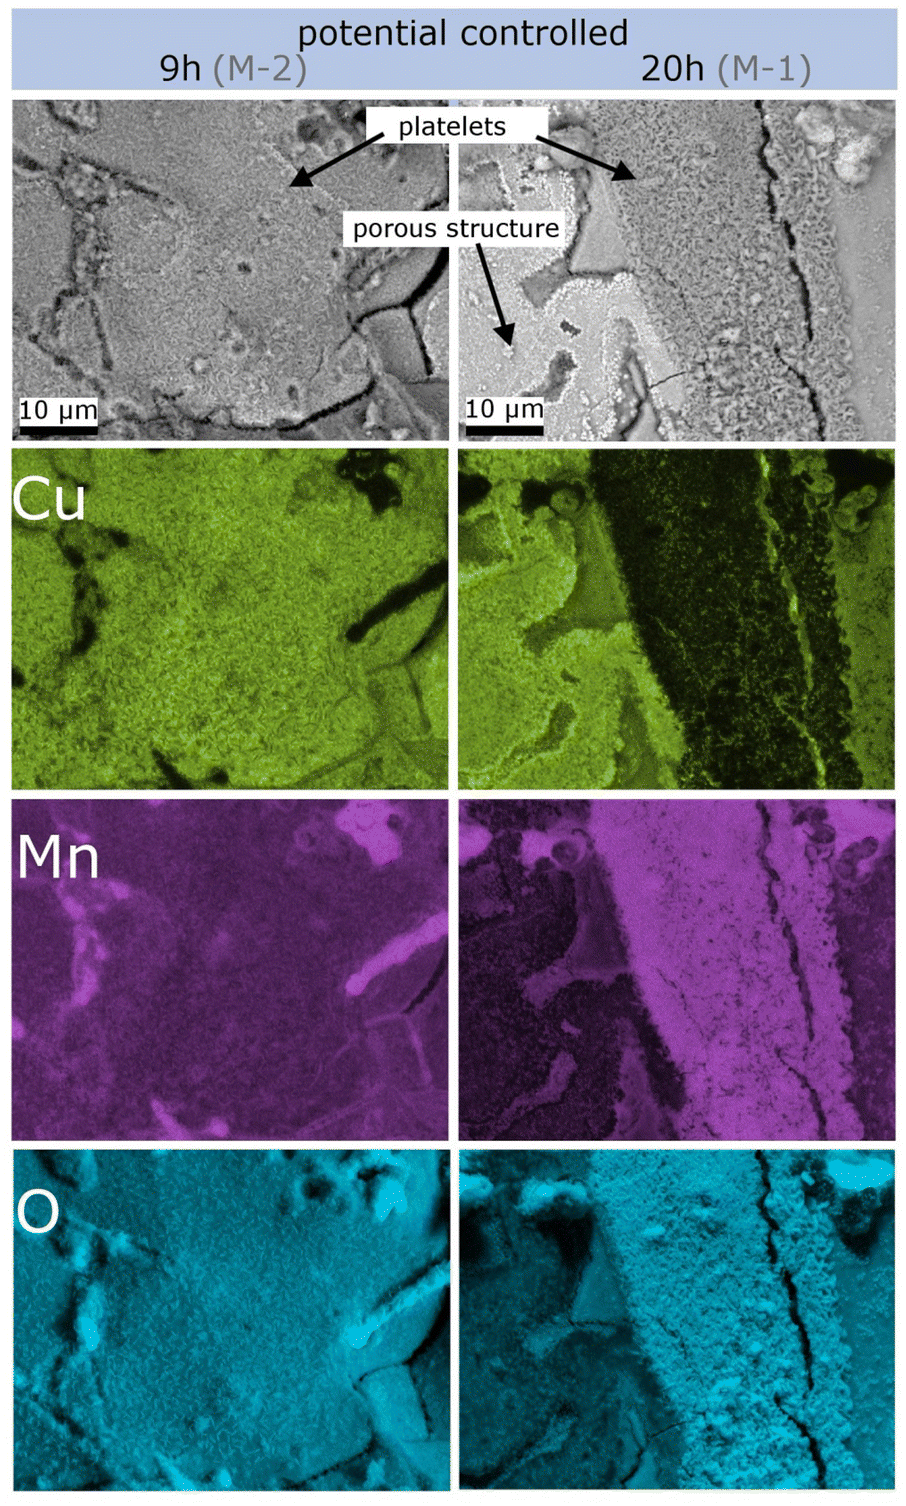 | ||
| Fig. 6 Elemental analysis of SEM images performed by EDS mapping for Cu, Mn and O in a platelet-rich region. The left column is taken from sample M-2, and the right column, from sample M-1. | ||
4 Discussion
Aiming at an in-depth understanding of nanoporous copper formation by dealloying CuMn, the discussion will start with of the electrochemistry of the dealloying process where the relative change in electrical resistance during dealloying is used to gain information on the temporal evolution of the porous structure (Section 4.1). In Section 4.2, electrochemistry during electrochemical cycling in KOH will be analysed. Finally, in Section 4.3 the findings are compared with SEM images and EDS data to gain insight into the morphology and composition of the porous structure.4.1 Structural evolution during dealloying
For noble metal alloy systems, such as AuAg, PtCu or PdCo, the chemical reactions which result in a faradaic current during dealloying are rather simple. However, because of their high chemical reactivity, the (electro-)chemistry of non-precious alloy systems might be significantly more complex.The dealloying of CuMn is performed at pH-values of 1 and 1.4 (0.1 M and 0.04 M HCl, respectively). In this pH regime, according to the Pourbaix-diagrams,50,51 Cu is stable in its metallic form and Mn dissolves. When immersing CuMn samples in HCl, it can be expected that the etching process starts immediately. Applying a potential more positive than the OCP will further enhance the reaction kinetics. Independent of the dealloying routine (potential controlled or free corrosion), formation of Cu-oxide in acidic electrolytes concomitant to the etching process has been reported (e.g. by Chen et al.28 and Wang et al.27).
Generally, the following (electro-)chemical reactions can be assumed. During free corrosion of Mn in the CuMn alloy, the reaction
| Mn + 2HCl → MnCl2 + H2 | (1) |
If a potential more positive than the OCP is applied, the electrochemically induced reaction
| Mn → Mn2+ + 2e− | (2) |
| Mn2+ + 2H2O → MnO2 + 2H2. | (3) |
After formation of Mn-oxide, additionally an oxygen reduction reaction catalysed by MnO2 can occur, which results in a negative current contribution and which is more pronounced at negative applied potentials.53,54 Oxygen reduction means the conversion of O2 into OH− by the consumption of H2O and electrons. The catalytic process includes several transition states and follows either a two or four electron pathway (hence consuming either two or four electrons during the reductive reaction).54
Based on the dissolution and side reactions described above, the present results will be discussed in the following section. During potential controlled dealloying, current vs. time is monitored, whereby this charge transfer can only be seen as an effective charge, resulting from all reactions described above. The total charge transferred (ΔQexp) was determined by integrating the current over time and it was compared to the theoretical charge transfer assuming complete etching of Mn (ΔQtheor) (only considering eqn (2)). The ratio ΔQexp/ΔQtheor is listed for all samples in Table 1 together with the ratio Δmexp/Δmtheor between the mass loss of the dealloyed sample and the theoretical calculated mass loss (again assuming complete etching of Mn according to eqn (2)).
For both ratios a value of one would mean complete etching of Mn, assuming that no side reactions occur. Hence, for Δmexp/Δmtheor a value lower than one (Δmexp < Δmtheor) indicates that manganese is still present in the dealloyed structure and/or side reactions occurred which causes a smaller change of mexp compared to the difference Δmtheor. Accordingly, for ΔQexp/ΔQtheor a value lower than one could indicate remaining Mn in the structure or an apparent charge decrease (e.g. concomitant reduction reactions).
For each sample, Δmexp/Δmtheor is in the range of 0.6, meaning that 60% of the theoretically calculated mass has been etched. Compared to that, ΔQexp/ΔQtheor varies greatly between the samples. It is approx. 80% for R-1 and R-3 and approx. 60% for R-2 (dealloyed at −500 mV). The generally smaller value of Δmexp/Δmtheor compared to that of ΔQexp/ΔQtheor can be explained by the concomitant oxidation reactions giving rise to a reduced mass loss upon etching. Apparently, the charge transfer (ΔQexp) differs the most from the theoretical value (ΔQtheor) for sample R-2, which is dealloyed at −500 mV. At this more negative potential, the oxygen reduction reaction catalysed by Mn-oxide is more pronounced,54 as described above. Hence the negative current contribution is larger which presumably causes the deviation of the monitored charge transfer.
As complementary information to analyse the dealloying process, the change ΔR/R0 in electrical resistance can be used. In addition to the ΔR/R0–t plots (Fig. 2 and 3), Fig. 7(a) shows ΔR/R0 as a function of the relative charge transferred Qrel that is obtained by integrating the current vs. time curve. In a simple picture, during dealloying the less noble component of a master alloy (in the present case manganese from copper–manganese) is removed and leaves behind a porous skeleton of the more noble metal. Thereby the dealloying front, i.e., the interface between the bulk alloy and porous structure, moves from the surface towards the center of the sample. Surface diffusion of the more noble component enables formation of a bi-continuous porous structure. In Fig. 2 (potential-controlled dealloying) and Fig. 3 (free corrosion) as well as in Fig. 7(a) different regimes in ΔR/R0-evolution can be identified. In the first regime only a slow increase in resistance occurs, which indicates that an alloy backbone is still present. Afterwards, in the ΔR/R0–Qrel plot above Qrel of approx. 0.85, the resistance increases rapidly which is attributed to a complete consumption of the alloy backbone in the wake of dealloying.
 | ||
| Fig. 7 Analysis of the relative change in electrical resistance during electrochemical controlled dealloying for samples R-1, R-2 and R-3. (a) Relative change in resistance ΔR/R0 as a function of the relative charge transferred Qrel. The schemes illustrate the formation of the porous structure. Grey represents the initial alloy (CuMn), brown the metallic npCu and black the oxide formed on the surface. (b) Ratio between the converted cross section (Ac) and the total cross section (A0) of the sample as a function of transferred charge. | ||
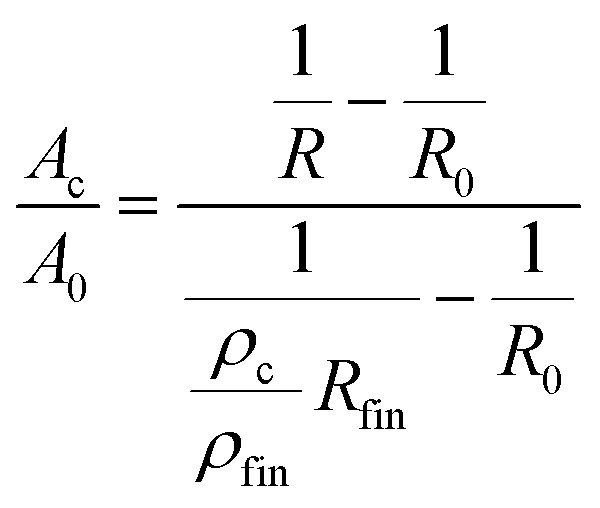
As described above, concomitant to the dissolution process, oxidation takes place. Therefore, the formed oxide contributes to the overall resistance increase. The resistance change arising from pore formation and oxidation cannot be distinguished in a straightforward manner. Nevertheless, some information on the progress of the conversion from the bulk alloy into the porous (oxide-rich) structure is obtained as follows: The measured resistance of the sample can be described as an electrical circuit, consisting of the resistance of the bulk alloy Rm and that of the converted structure Rc connected in parallel.. Furthermore, a relation between the converted cross section (Ac) and the bulk cross section (Ap) is given by
 | (4) |
With this assumption, the ratio Ac/A0 can be directly deduced from the resistance data as shown in Fig. 7(b), as a function of the transferred charge Qrel. The ratio Ac/A0 shows a nearly linear increase over the whole dealloying process when the fluctuations in the early stage up to Qrel = 0.2 are not taken into consideration. These fluctuations presumably result from the low resistance value in this regime along with the initial pronounced bubble formation on the sample. When comparing the Ac/A0–Qrel variation of np-Cu to npAu and npPt, which was studied in a previous work,43 the characteristics of npCu are more similar to those of npPt than to those of npAu. This is quite noticeable, since in the literature the different porosity evolutions during electrochemical dealloying (and the resulting pore sizes) are typically related to the different melting points,55 which would connect copper to gold rather than to the high-melting platinum. A lower melting point is associated with a higher surface diffusivity of the remaining atoms, which causes (i) the formation of ligaments with larger diameters at the etch front (bulk dealloying) as well as (ii) stronger rearrangement processes in the already porous structure, leading to further coarsening along with exposure and dissolution of sacrificial element atoms (ligament dealloying). The latter produces a significant charge flow contribution stemming from behind the etch front. While the large pore sizes formed by npCu (bulk dealloying) are well in line with this picture, the low charge flow (ligament dealloying) recorded once the etch front has run through the material, and thus suppressed reordering in the porous structure, cannot be explained via the melting point of copper. In contrast to more-noble element systems, the mechanism blocking surface diffusion behind the etch front in the case of npCu is the pronounced formation of oxides on the metal surface, which makes a similar evolution of Ac/A0 for npPt and npCu plausible.
Finally, we compare the electrical resistance variation of R-2 and R-1, and that of of R-3 and R-1 (Fig. 7(a)). For R-1 and R-2 the curves evolve rather similarly, whereby the increase starts earlier for sample R-2 (dealloyed at −500 mV) compared to R-1 (dealloyed at −300 mV). This offset with respect to Qrel is most likely caused by the negative current contribution for sample R-2 associated with the MnO2-catalysed oxidation at more negative potentials as described above. Comparing R-3 to R-1 (using 0.04 instead of 0.1 M HCl), the increase in relative resistance for R-3 is significantly reduced in the first part, which is also clearly visible in the ΔR/R0–t representation (Fig. 2). This can most likely be explained by the strong influence of the Cl− concentration on the surface diffusivity of copper as discussed in the literature.15 Surface diffusion is highly dependent on the Cl− concentration in the electrolyte, whereby a higher Cl− concentration facilitates diffusion. Hence, at lower concentration (as for R-3 compared to R-1) the slower surface diffusion hinders the rearrangement of surface atoms and dealloying kinetics.
4.2 Cu-oxide formation in alkaline electrolyte
The cycling behaviour in 0.1 M KOH (pH 13) after dealloying (Section 3.2) yields additional information on the nanoporous Cu-electrodes. According to the Pourbaix diagrams,50,51 at this pH Cu is oxidized in an anodic potential scan and reduced at the cathodic potential scan and Mn remains oxidized at any applied potential. In Fig. 4(a) the oxidation/reduction of Cu can be identified with oxidation peaks between −450 and +500 mV (formation of Cu2O, 2Cu(OH)2 and CuO) as well as the corresponding reduction peaks between −450 and −1400 mV, as expected from the literature.56 The free corrosion sample (R-F) reveals quite similar behaviour to that of the potential-controlled sample. The shift of the reduction peak to more positive potentials might be caused by the different morphologies of the free corrosion sample (see below, Section 4.3).In the first cycle, no reduction of any primary oxide is visible, which is supported by the rather stable resistance and indicates that any oxide formed during dealloying seems stable over the investigated potential range. This supports the notion discussed above (Section 4.1), that during dealloying, mainly Mn-oxide, rather than Cu-oxide is formed.
Interestingly, during cycling, the peak height decreases from cycle to cycle which is most likely caused (predominantly) by the formation of stable Cu2O and which thereby reduced the active surface area, as described by Yang et al.25 and supported by Bai et al.16 who detected pronounced Cu2O and CuO formation after multiple cycles. This assumption is also supported by the slight resistance increase from cycle to cycle (Fig. 4(b)).
Obviously, the electrochemically induced resistance variation is significantly higher for the sample (R-F) prepared under free corrosion compared to the potential-controlled sample (R-1) (Fig. 4(b)). As potential-controlled dealloying takes place under stronger oxidizing conditions, more Mn-oxide is formed. Hence, the tunability of the relative resistance is higher for the free corrosion sample (R-F) as the oxide formation is less pronounced.
The remarkably high resistance variations observed during CV stem from a reversible conversion of copper into low-conducting (hydr-)oxides, leading to an effective decrease of the metallic conductor cross section. Assuming a negligible conductivity of the formed oxide layer, the 30%-increase of ΔR/R0 corresponds to a decrease of the metallic ligament diameter by about 15% or roughly 10 nm, if the ΔR/R0-increase is entirely attributed to a corresponding reduction of the conductor cross section. However, to a certain extent, the ΔR/R0-increase is also due to stronger charge carrier scattering, on the one hand, because of the reduced metallic ligament diameter and, on the other hand, because the charge carrier scattering presumably is stronger at the metal-oxide interface in the oxidized state of the ligaments than at the metal-electrolyte interface of the ligaments in the reduced state.
4.3 Composition and morphology of the porous structure
Finally, the morphology of the porous structure will be discussed in more detail and compared to that in the literature. The SEM and EDS studies (Section 3.3, Fig. 5 and 6, SI-3 in the ESI†) reveal two different morphologies, the porous structure, accounting for the majority of the surface, and in addition platelet-like structures. The latter consists of Cu- and Mn-oxide, where the amount of Mn-oxide increases upon prolonged dealloying (comparison of samples M-2 and M-1, 9 h and 20 h dealloying, respectively; Section 3.3). Cu-oxide arises from post-dealloying cycling in KOH. Similar types of geometric features have been described in the literature before, for dealloyed CuMn. For example, Chen et al.28 identified nanocube and spheroid nanoparticles after dealloying as Cu2O. Castillo et al.32 found that manganese oxide forms nanoplatelets during etching of electrodeposited CuMn which is supported by Biswal et al.57 who stated that MnO2 can be electrodeposited from Mn2+ in HCl by first oxidation of Mn2+ to Mn3+.The analysis of the SEM-pictures (Table 2) reveal the smallest platelets for the free corrosion sample (M-F). For the potential-controlled sample, the size of the platelets is significantly larger and increases during prolonged dealloying (M-2, 9 h, compared to M-1, 20 h). The smaller platelet size for the free corrosion sample (M-F) is in line with the higher voltage-induced resistance variation (Fig. 4(b)) that has been attributed to the reduced degree of oxidation compared to that for the potential-controlled sample (see Section 4.2).
The pore size lies in the range of 60 nm for all three samples, whereby a slight increase is again observed after prolonged dealloying. In the literature, results on the pore size after dealloying of CuMn in HCl vary greatly, e.g. Hayes et al.26 reports 130 nm, Chen et al.28 approx. 20 nm and Tan et al.35 70 nm.
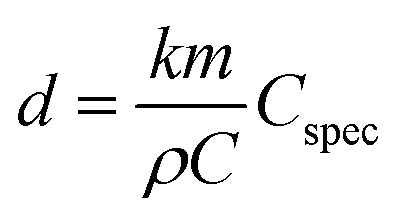
From double layer charging (see Fig. 4(c)), the capacitance of the sample can be calculated using a linear fit of the current at a specific potential as a function of scan rate. For the SEM-sample M-1 such type of analysis yields a total capacitance of 0.2 F. Following the analytic expression derived from Detsi et al.,58 an estimation of the pore size d can be carried out based on the total capacitance of the nanoporous sample C and the specific interfacial capacitance of the material investigated (Cspec):
 | (5) |
Eqn (5) can be further used to estimate the specific surface area using the pore sizes deduced from the SEM images. Assuming that the density of the npCu sample is approx. 9 g cm−3 (pure copper, see above) or slightly below (taking into account the less dense oxides), a specific surface area of roughly 8 m2 g−1 is obtained for sample M-1. This value lies well in the range of specific surface areas reported for npCu samples with similar pore sizes.62
5 Conclusions
The study presented here provides comprehensive insights into oxide formation during dealloying and electrochemical cycling of nanoporous copper in an aqueous electrolyte which is of outmost importance for many fields of application. The synthesis of npCu from a CuMn alloy during free corrosion and potential controlled dealloying in HCl as well as its electrochemical performance in KOH is investigated by in situ resistometry. The following structural evolution during formation of nanoporous copper can be proposed. First, etching of Mn and concomitant formation of Mn-oxide in platelet-like structures on the surface takes place. On the surface of these platelets, Mn-oxide is deposited during prolonged dealloying leading to a growth in diameter and an overall enrichment of manganese oxide in these areas. After subsequent cycling in KOH, copper oxide is additionally formed on the surface, resulting in a hybrid composite with a nanoporous copper skeleton decorated with Mn- and Cu-oxide.While the large observed pore size of the npCu structure is typical for a low-melting metal, a strongly suppressed ligament dealloying is identified in the course of further etching. In contrast to more noble dealloying systems such as npAu or npPt, this can be attributed to the pronounced oxide formation, which blocks rearrangement processes in the porous structure. Reversible oxidation and reduction also enable pronounced resistance variations upon electrochemical cycling in KOH.
As an outlook, the specific control over the materials synthesis described here, and in particular oxide formation, could be of major interest for application in energy storage, sensing and catalysis in the future. Mn and Cu oxide are known from the literature to be perfectly suited for supercapacitors due to their high interfacial capacitance.5,36 Up to now, great effort has been put into decorated porous samples with Mn-oxides for development of hybrid electrodes for supercapacitors,63,64e.g. MnO2 and MnO on npAu5 or npCu36,65,66 and Cu2O on npCu,25 always using multi-step preparation routines. The samples in the present study exhibit large amounts of Cu- and Mn-oxides on the internal surface directly after dealloying and electrochemical cycling, which could be enhanced in further studies to maximize the oxide-concentration and hence the interfacial capacitance. Moreover, Cu- and Mn-oxide exhibit great catalytic activities. Together with the large surface area of samples synthesised in the present study, this is very promising for catalytic application, e.g. reduction of nitrogen,13 degradation of methyl orange,67 oxygen reduction,53,54 methanol oxidation25 and reduction of CO2.14
Conflicts of interest
There are no conflicts to declare.Acknowledgements
The work was financially supported by the Lead Project (LP-03) Porous Materials@Work at TU Graz (cooperation between subprojects P10 and P06). It was performed in the framework of the interuniversity cooperation of TU Graz and Uni Graz on natural sciences (NAWI Graz). R. H. Buzolin fosters the D-1303000107/CD-Laboratory for Design of High-Performance Alloys by Thermomechanical Processing with the support of the Christian Doppler Forschungsgesellschaft. The authors thank Prof. Resel (Institute of Solid State Physics, TU Graz) for enabling access to the XRF analyzer. Publication was supported by TU Graz Open Access Publishing Fund.Notes and references
- A. Wittstock, J. Biener and M. Bäumer, Phys. Chem. Chem. Phys., 2010, 12, 12919–12930 RSC.
- K. J. Stine, Biochem. Insights, 2017, 10, 1–12 Search PubMed.
- H. Qiu, H.-T. Xu, L. Liu and Y. Wang, Nanoscale, 2015, 7, 386–400 RSC.
- H.-J. Qiu, Y. Ito and M. W. Chen, Scr. Mater., 2014, 89, 69–72 CrossRef CAS.
- X. Lang, A. Hirata, T. Fujita and M. Chen, Nat. Nanotechnol., 2011, 6, 232–236 CrossRef CAS PubMed.
- J. Biener, A. Wittstock, L. A. Zepeda-Ruiz, M. M. Biener, V. Zielasek, D. Kramer, R. N. Viswanath, J. Weissmüller, M. Bäumer and A. V. Hamza, Nat. Mater., 2009, 8, 47–51 CrossRef CAS PubMed.
- H.-J. Jin and J. Weissmüller, Adv. Eng. Mater., 2010, 12, 714–723 CrossRef CAS.
- S. Shi, J. Markmann and J. Weissmüller, Electrochim. Acta, 2018, 285, 60–69 CrossRef CAS.
- E. Detsi, M. S. Sellès, P. R. Onck and J. T. M. de Hosson, Scr. Mater., 2013, 69, 195–198 CrossRef CAS.
- Y. Chen, H. Feng, Y. Wang, Z. Tang and D. Chua, Mater. Lett., 2018, 226, 8–12 CrossRef CAS.
- C. Zhang, Z. Wang, Y. Cui, X. Niu, M. Chen, P. Liang, J. Liu, R. Liu, J. Li and X. He, Materials, 2021, 14, 4348 CrossRef CAS.
- D. Liu, Z. Yang, P. Wang, F. Li, D. Wang and D. He, Nanoscale, 2013, 5, 1917–1921 RSC.
- Y. Cui, A. Dong, Y. Qu, J. Zhang, M. Zhao, Z. Wang and Q. Jiang, Chem. Eng. J., 2021, 426, 131843 CrossRef CAS.
- Y. Peng, T. Wu, L. Sun, J. M. V. Nsanzimana, A. C. Fisher and X. Wang, ACS Appl. Mater. Interfaces, 2017, 9, 32782–32789 CrossRef CAS PubMed.
- Y.-Z. Lee, W.-Y. Zeng and I.-C. Cheng, Thin Solid Films, 2020, 699, 137913 CrossRef CAS.
- Q. Bai, C. Zhang, F. Tan, F. Wu and Z. Zhang, Electrochem. Commun., 2021, 124, 106940 CrossRef CAS.
- E. V. Nikitina, E. A. Karfidov and N. Kazakovtseva, J. Alloys, 2020, 845, 156238 CrossRef CAS.
- Q. Kong, L. Lian, Y. Liu and J. Zhang, Micro Nano Lett., 2013, 8, 432–435 CrossRef CAS.
- Y. Ji, Y. Xing, F. Zhou, X. Li, Y. Chen and L.-H. Shao, Adv. Eng. Mater., 2018, 20, 1800574 CrossRef.
- T. Song, M. Yan, Z. Shi, A. Atrens and M. Qian, Electrochim. Acta, 2015, 164, 288–296 CrossRef CAS.
- X. Yue, R. Hu, J. Qi, Y. He, Q. Meng, F. Wei, Y. Ren and Y. Sui, J. Mater. Eng. Perform., 2021, 30, 1759–1767 CrossRef CAS.
- N. Wang, Y. Pan and S. Wu, J. Mater. Sci. Technol., 2018, 34, 1162–1171 CrossRef CAS.
- C. Yang, Q. B. Zhang, M. Y. Gao, Y. X. Hua and C. Y. Xu, J. Electrochem. Soc., 2016, 163, D469–D475 CrossRef CAS.
- Q. Yang, S. Liang, B. Han, J. Wang and R. Mao, Mater. Lett., 2012, 73, 136–138 CrossRef CAS.
- Q. Yang, Y. Qin, S. Chu, S. Sun, D. Liu, S. Yang and S. Liang, Mater. Today Commun., 2021, 26, 101992 CrossRef CAS.
- J. R. Hayes, A. M. Hodge, J. Biener, A. V. Hamza and K. Sieradzki, J. Mater. Res., 2006, 21, 2611–2616 CrossRef CAS.
- L. Wang, H. Xie, J.-C. Shao, H. Yang, P.-Z. Feng and H.-J. Jin, Scr. Mater., 2021, 203, 114114 CrossRef CAS.
- L.-Y. Chen, J.-S. Yu, T. Fujita and M.-W. Chen, Adv. Funct. Mater., 2009, 19, 1221–1226 CrossRef CAS.
- D. S. Keir and M. J. Pryor, J. Electrochem. Soc., 1980, 127, 2138–2144 CrossRef CAS.
- M. J. Pryor and J. C. Fister, J. Electrochem. Soc., 1984, 131, 1230–1235 CrossRef CAS.
- U.-S. Min and J. C. Li, J. Mater. Res., 1994, 9, 2878–2883 CrossRef CAS.
- E. Castillo and N. Dimitrov, Electrochem, 2021, 2, 520–533 CrossRef CAS.
- S.-Y. Joo, Y. Choi and H.-C. Shin, J. Alloys, 2022, 900, 163423 CrossRef CAS.
- S. An, S. Zhang, W. Liu, H. Fang, M. Zhang and Y. Yu, Corros. Sci., 2013, 75, 256–261 CrossRef CAS.
- X.-l. Tan, K. Li, G. Niu, Z. Yi, J.-s. Luo, Y. Liu, S.-j. Han, W.-d. Wu and Y.-j. Tang, J. Cent. South Univ., 2012, 19, 17–21 CrossRef CAS.
- M. Li, J. Liu, C. Wang, Y. Liu, Y. Sun, C. Qin, Z. Wang, Y. Li, L. Liu and S. Liu, Chem. Eng. J., 2022, 427, 130861 CrossRef CAS.
- C. J. Dotzler, B. Ingham, B. N. Illy, K. Wallwork, M. P. Ryan and M. F. Toney, Adv. Funct. Mater., 2011, 21, 3938–3946 CrossRef CAS.
- S. S. Welborn and E. Detsi, Nanoscale Horiz., 2020, 5, 12–24 RSC.
- M. Gößler, E. Hengge, M. Bogar, M. Albu, D. Knez, H. Amenitsch and R. Würschum, J. Phys. Chem. C, 2022, 126, 4037–4047 CrossRef.
- Y. Zhang, F. Luo, Q. Bai, C. Zhang, B. Yu and Z. Zhang, J. Phys. Chem. Solids, 2021, 150, 109879 CrossRef CAS.
- F. U. Renner, G. A. Eckstein, L. Lymperakis, A. Dakkouri-Baldauf, M. Rohwerder, J. Neugebauer and M. Stratmann, Electrochim. Acta, 2011, 56, 1694–1700 CrossRef CAS.
- P. Liu, Q. Chen, Y. Ito, J. Han, S. Chu, X. Wang, K. M. Reddy, S. Song, A. Hirata and M. Chen, Nano Lett., 2020, 20, 1944–1951 CrossRef CAS.
- E.-M. Steyskal, M. Seidl, M. Graf and R. Würschum, Phys. Chem. Chem. Phys., 2017, 19, 29880–29885 RSC.
- E.-M. Steyskal, Z. Qi, P. Pölt, M. Albu, J. Weissmüller and R. Würschum, Langmuir, 2016, 32, 7757–7764 CrossRef CAS.
- M. Gößler, M. Nachtnebel, H. Schröttner, H. Krenn, E.-M. Steyskal and R. Würschum, J. Appl. Phys., 2020, 128, 093904 CrossRef.
- E.-M. Steyskal, M. Seidl, S. Simic and R. Würschum, Langmuir, 2018, 34, 13110–13115 CrossRef CAS PubMed.
- J. Wang, Y. Yang, M. Zhang and S. Yang, Adv. Funct. Mater., 2018, 919–926 Search PubMed.
- C. A. Schneider, W. S. Rasband and K. W. Eliceiri, Nat. Methods, 2012, 9, 671–675 CrossRef CAS.
- Z. Matharu, P. Daggumati, L. Wang, T. S. Dorofeeva, Z. Li and E. Seker, ACS Appl. Mater. Interfaces, 2017, 9, 12959–12966 CrossRef CAS.
- B. Beverskog and I. Puigdomenech, J. Electrochem. Soc., 1997, 144, 3476–3483 CrossRef CAS.
- W. Sun, D. A. Kitchaev, D. Kramer and G. Ceder, Nat. Commun., 2019, 10, 573 CrossRef CAS PubMed.
- Z. Rogulski, H. Siwek, I. Paleska and A. Czerwiński, J. Electroanal. Chem., 2003, 543, 175–185 CrossRef CAS.
- F. Cheng and J. Chen, Chem. Soc. Rev., 2012, 41, 2172–2192 RSC.
- J. H. Siow, M. R. Bilad, W. Caesarendra, J. J. Leam, M. A. Bustam, N. S. Sambudi, Y. Wibisono and T. M. I. Mahlia, Energies, 2021, 14, 6385 CrossRef CAS.
- Q. Chen and K. Sieradzki, Nat. Mater., 2013, 12, 1102–1106 CrossRef CAS PubMed.
- K. K. Diao, Z. Xiao and Y. Y. Zhao, Mater. Chem. Phys., 2015, 162, 571–579 CrossRef CAS.
- A. Biswal, B. Chandra Tripathy, K. Sanjay, T. Subbaiah and M. Minakshi, RSC Adv., 2015, 5, 58255–58283 RSC.
- E. Detsi, E. de Jong, A. Zinchenko, Z. Vuković, I. Vuković, S. Punzhin, K. Loos, G. ten Brinke, H. A. de Raedt, P. R. Onck and J. de Hosson, Acta Mater., 2011, 59, 7488–7497 CrossRef CAS.
- M. Neubronner, T. Bodmer, C. Hübner, P. B. Kempa, E. Tsotsas, A. Eschner, G. Kasparek, F. Ochs, H. Müller-Steinhagen, H. Werner and M. H. Spitzner, D6 Properties of Solids and Solid Materials, in VDI Heat Atlas, SpringerMaterials, 2010, Copyright 2010Springer-Verlag, DOI:10.1007/978-3-540-77877-6_26.
- D. P. Dubal, D. S. Dhawale, R. R. Salunkhe, V. S. Jamdade and C. D. Lokhande, J. Alloys, 2010, 492, 26–30 CrossRef CAS.
- P. Connor, J. Schuch, B. Kaiser and W. Jaegermann, Z. Phys. Chem., 2020, 234, 979–994 CrossRef CAS.
- X. Luo, R. Li, Z. Liu, L. Huang, M. Shi, T. Xu and T. Zhang, Mater. Lett., 2012, 76, 96–99 CrossRef CAS.
- J. Wei, N. Nagarajan and I. Zhitomirsky, J. Mater. Process. Technol., 2007, 186, 356–361 CrossRef CAS.
- J. Kang, A. Hirata, L. Kang, X. Zhang, Y. Hou, L. Chen, C. Li, T. Fujita, K. Akagi and M. Chen, Angew. Chem., 2013, 125, 1708–1711 CrossRef.
- T. Jian, J. Zhu, W. Ma, X. Yan, G. Li and J. Zhou, Appl. Surf. Sci., 2020, 529, 147152 CrossRef CAS.
- K. Mohamed Racik, A. Manikandan, M. Mahendiran, P. Prabakaran, J. Madhavan and M. Victor Antony Raj, Phys. E, 2020, 119, 114033 CrossRef CAS.
- T. Kou, C. Jin, C. Zhang, J. Sun and Z. Zhang, RSC Adv., 2012, 2, 12636 RSC.
Footnote |
| † Electronic supplementary information (ESI) available. See DOI: https://doi.org/10.1039/d2na00618a |
| This journal is © The Royal Society of Chemistry 2023 |