 Open Access Article
A systematic study on synthesis parameters and thermoelectric properties of tellurium nanowire bundles†
Yanmei
Ren
a,
Rongke
Sun
a,
Xue
Yu
a,
Ruoxi
Wang
a,
Wusheng
Zhang
a,
Xiaodong
Zhu
a,
Yanqing
Ma
 *ab and
Lei
Ma
 *a
*a
aTianjin International Center for Nanoparticles and Nanosystems, Tianjin University, Tianjin 300072, P. R. China. E-mail: mayanqing@tju.edu.cn; lei.ma@tju.edu.cn
bSchool of Precision Instrument and Opto-electronics Engineering, Tianjin University, Tianjin 300072, P. R. China
First published on 24th August 2023
Abstract
The controlled growth of tellurium (Te) nanocrystals is vital for making Te-based nanomaterials with finely tuned morphology and thermoelectric properties. Herein, to reveal the controlling parameters and their roles behind the synthesis of Te nanowire bundles (NBs), they were systematically investigated. The unveiled growth mechanism of Te-NBs is a “solid-solution-solid” transformation process from amorphous Te (a-Te) spheres to trigonal Te (t-Te) NBs. Accordingly, Te-NBs with different sizes and crystallinity have been successfully prepared by simply adjusting the reaction temperature and initial solution pH to regulate the generating rate of Te atoms and the dissolution rate of a-Te spheres. Well-ordered Te-NBs with a large width and high crystallinity can be synthesized at an optimized reaction temperature of 90 °C and an initial solution pH value of 10. The relationship between the thermoelectric properties of the Te-NB thin film (Te-NBs-TF) and the width and crystallinity of the NBs exposes that a large width and high crystallinity lead to a high thermoelectric performance of Te-NBs-TFs, and the optimized results can reach a power factor of 35.2 μW m−1 K−2 at room temperature. This work provides crucial information for the controllable synthesis of Te-NBs and a facile preparation avenue of Te-based thermoelectric films, which paves the way for future industrial applications of high-performance thermoelectric devices.
Introduction
Tellurium (Te) is an element widely used in preparing high-performance Te based thermoelectric materials and devices due to the high power factor that results from its intrinsic valence band structure.1 The thermoelectric performance of Te based nanomaterials and devices are closely related to its geometric configuration.2 Among all the Te based thermoelectric thin films, those consisting of nanowires and nanorods are the most efficient, and are normally fabricated through vacuum assisted filtration, drop-coating and other approaches.3,4 However, thin films prepared by the above methods usually exhibit a rather poor electrical performance due to disorder piling of the Te nanowire and nanorods.5 Compared with randomly stacked one-dimensional Te nanowire and nanorods, the films made of ordered Te nanowire bundles (NBs) have a much lower contact resistance and leakage current, and therefore have superior power factor.6,7Solution-phase synthesis is a facile approach for preparing large-scale Te-NBs at low cost.8,9 The size and shape of the prepared Te nanomaterials are strongly dependent on the reaction temperature, surfactants, solvent, etc.10,11 Yu et al. realized a precise regulation of the Te nanowire diameter through the finely controlled ratio of two surfactants (polyvinyl pyrrolidone and cyclopentanone).12 In addition, different Te nanostructures, such as Te nanowires, Te nanotubes and trifold Te nanorods, can be prepared by adjusting the amount of surfactant (polyvinyl pyrrolidone) and reducing agent (ascorbic acid aqueous solution). Tuning the amount of PVP in the reaction can vary the solution viscosity and then significantly affect the morphology of the Te nanostructure.13 Furthermore, Yu et al. synthesized Te nanowires by a hydrothermal method and, subsequently, the disordered nanowires were assembled with well-defined orders using a Langmuir–Blodgett method.7 However, the fabrication of Te nanostructures with well-defined structures by the above methods is rather complicated and heavy energy consuming. Therefore, in order to make highly structural nanowire bundles, except by a reprocessing approach, there have been many attempts to explore the direct synthesis in a single step. For example, Ma et al. grew single crystal Te-NBs by reducing TeO2 using ionic liquid [TEAH]+[BF4]− as the solvent, and template.14 Driven by the [BF4]− anion, the Te nanoparticles aggregate on the single nanowire to form nanowire bundles via Ostwald ripening. A proper reaction temperature setting is the key for the formation of well-defined Te-NBs.14 However, detailed investigations of growth parameters have solely focused on tellurium nanowires; neither systematic investigations of the parameters that control the growth of Te-NBs, their structure–activity relations or their thermoelectric properties have been conducted.
Hereby, in this work, we performed a systematic investigation on the parameter dependence of Te-NBs using a solution-phase method at low temperature. By fine tuning the reaction temperature and initial solution pH value, optimized Te-NBs structures were achieved. Meanwhile, both the internal growth mechanism of the Te-NBs and the structure–activity relationship between their structures and thermoelectric properties were investigated. These studies provide important guidance for the design and controllable preparation of high-performance Te-based thermoelectric materials and devices.
Experimental
Material
All the chemicals were used as received without further purification unless otherwise specified. Tellurium dioxide (TeO2, 99.99%), hydrazine monohydrate (N2H4·H2O, 80%), cetyltrimethylammonium bromide (CTAB, 99%), ethylenediaminetetraacetic acid disodium salt (EDTA-Na2, 98%), and sodium hydroxide (NaOH, 96%) were purchased from Shanghai Aladdin Bio-Chem Technology Co., LTD. Ammonium hydroxide (NH3·H2O, 25%) was ordered from Tianjin Yuanli Chemical Co., LTD. Concentrated nitric acid (HNO3, 68%) was bought from Tianjin Beilian Fine Chemicals Development Co., Ltd.The preparation of Te-NBs and thermoelectric thin films
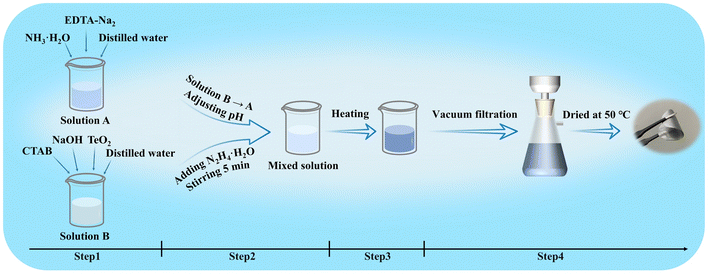
Te-NBs were synthesized through an improved solution-phase chemical reduction process (Fig. 1).15 25 mL of distilled water, 2 mL of NH3·H2O and 0.145 g of EDTA-Na2 were added to a glass beaker to make solution A. 20 mL of distilled water, 50 mg of NaOH and 80 mg of TeO2 were added to another glass beaker to form solution B. After stirring for 30 min at room temperature, CTAB was added to solution B with a concentration of 5 mM (step 1). Solution B was added to solution A to give a mixture. The initial pH of the solution was set to 8, 9 or 10 with HNO3(aq). The mixture was then stirred for 5 min. After adding 2 mL of N2H4·H2O, the mixture was continuously stirred for another 5 min (step 2). The glass beaker was transferred to an oven heated to different temperatures of 50 °C, 70 °C or 90 °C (step 3). The samples were washed using deionized water and then vacuum-filtered. The thin film was dried in a vacuum oven at 50 °C for 2 h (step 4).Characterization and measurements
The surface morphology and element composition of the samples were characterized by a scanning electron microscope (SEM, SU3500, Hitachi, Japan) and an energy dispersive spectrometer (EDS, Model 550i, IXRF, America). An X-ray powder diffractometer (XRD, TD-3500 model) was used for the crystallinity analysis. The surface chemical information of the samples, including the proportion of surface chemical elements and chemical charge state, was analyzed by X-ray photoelectron spectroscopy (XPS, ESCALAB 250Xi, Thermo Scientific). All the binding energies obtained from XPS were calibrated using the C 1s peak (Eb = 284.6 eV) as a reference. A UV-vis spectrophotometer (UV-3900, Hitachi, Japan) was used for the analysis of diffuse reflectance spectra of solid film samples at a certain range of wavelength. The pH values were measured by a pH meter (S210, Mettler Toledo Instruments (Shanghai) Co., LTD). The Raman spectra were recorded by a Raman spectrograph (RTS-2) at a 638 nm laser wavelength. The Seebeck coefficient of the prepared thin films was tested with a home-built apparatus (Fig. S1a, ESI†). The electrical conductivity was measured based on the Van der Pauw method.16 Details of the measurements are shown in the ESI† (Note 1 and Fig. S1, S2, ESI†).Results and discussion
The morphology, crystallinity and chemical composition of Te-NBs
With a reaction temperature of 90 °C, initial solution pH value of 10 and reaction time of 12 h, high-quality Te-NBs can be produced as shown in Fig. 2a and b. The statistics reveal that the Te-NBs have an average length, width and aspect ratio of ∼25.5 μm, ∼375 nm and 68, respectively (Fig. 2c and d), of which the aspect is the highest in all reported works so far.14,17 Moreover, the study of the effects of CTAB on the morphology and structure of the Te-NBs (Fig. S3, ESI†) reveals its inhibitory and structure-directing effect on the growth of bundles as well as that it can promote the forming of a self-assembly of a bundle-like structure. This may be due to the surface energy reduction effect on trigonal Te (t-Te) nanocrystals and nanowires by CTAB, which consequently leads to the growth of wire bundles during the long reaction time.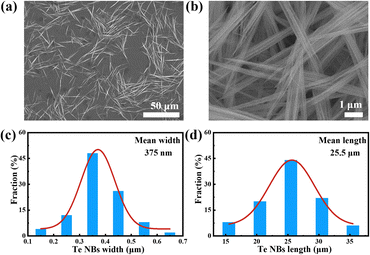 | ||
| Fig. 2 The (a) low-magnification and (b) high-magnification SEM images of Te-NBs; the corresponding (c) width and (d) length distribution histograms of the Te-NBs. | ||
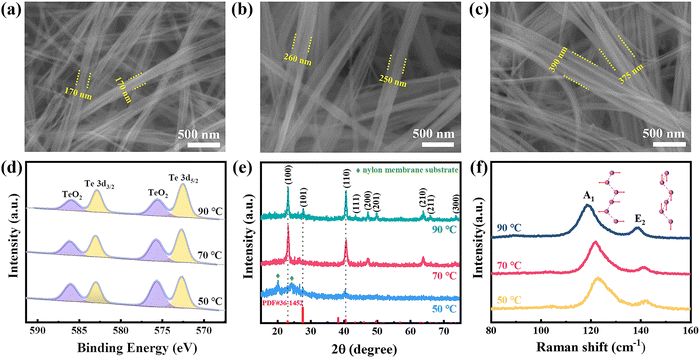
Furthermore, it was found that the width of the NBs gradually increased with an increase of the reaction temperature. The width of Te-NBs obtained at a reaction temperature of 90 °C is ∼1.5 and ∼2.25 times wider than that grown at reaction temperatures of 70 °C and 50 °C (Fig. 3a–c), respectively.
In order to identify the chemical composition, EDS measurements were conducted on the Te-NBs grown under various temperatures. The oxygen concentration on the surface of the Te-NBs was measured as 30–42% (Fig. S4, ESI†), which is due to the easiness of Te oxidization under an ambient environment.18,19 In order to further unveil the dependence of the oxidation states of the synthesized Te-NBs on the reaction temperatures, XPS measurements were carried out, and the results are shown in Fig. 3d. Two major peaks at 572.7 and 583.0 eV corresponding to Te0 3d5/2 and 3d3/2, respectively, are observed. Meanwhile, two shoulders at 575.7 and 586.0 eV can be assigned as Te4+, indicating the coexistence of Te4+ and Te0 at the Te-NB surfaces.20 In addition, the decrease of peak intensity of Te4+ relative to that of Te0 from 51.4% to 39.1% with an increase of reaction temperature from 50 °C to 90 °C indicated a decline in the oxidation of Te-NBs. The decrease in oxygen percentage with the increase of the NB width can be attributed to the fact that the oxidized layer on the surface retards the oxidation of the inner regions of the Te-NBs. And the thinner NBs width leads to a larger specific surface area and oxidation degree.21
For the crystal phase, Te-NBs show a dominant trigonal phase (JCPDF card number: 36-1452) (Fig. 3e).22 The diffraction peaks at 23.1°, 27.6°, 40.5°, 43.4°, 47.1°, 49.7°, 63.7°, 65.9° and 73.5° are indexed to the (100), (101), (110), (111), (200), (201), (210), (211) and (300) planes of Te, respectively.23–25 The XRD spectra of the prepared Te-NBs at a reaction temperature of 50 °C show a relatively weak diffraction peak of Te, indicating poor crystallinity. The diffraction peaks at 20.1° and 24.1° belong to the nylon film substrate (Fig. S5, ESI†). With an increase of reaction temperature, the intensity of the featured peaks for the trigonal phase Te gradually enhances, indicating an improvement of its crystallinity. In addition, the UV-Vis spectra (Fig. S6, ESI†) indicate the increases in band gap of the grown Te-NBs with the rising reaction temperature. A high reaction temperature results in the high crystallinity of Te-NBs with an improved structure, as evident by the measured XRD.26
Raman spectroscopy has been used to evaluate inter-chain van der Waals interactions in Te-NBs.27 The A1 mode is caused by chain expansion in the basal plane and the E2 mode represents asymmetric bond-stretching along the c-axis.28,29Fig. 3f presents the Raman peak shift with the width of the Te-NBs. As the width of the Te-NBs increases from ∼170 nm to ∼375 nm (the reaction temperature increases from 50 °C to 90 °C) (Fig. 3a–c), clear redshifts of the A1 and E2 are observed. For example, the A1 peak is significantly shifted from 122.83 cm−1 to 118.35 cm−1 for Te-NBs when the reaction temperature rises from 50 °C to 90 °C. Consistent with the previously reported results for 2D tellurene and few-chain Te nanowires encapsulated by nanotubes, as the width of Te-NBs grows, a unique chiral-chain van der Waals structure of Te leads to attenuated intra-chain covalent atomic bonds, and consequently enhances the inter-chain van der Waals interactions, and therefore there is a redshift in the frequency of the A1 mode.27,30 Furthermore, the reaction time also affects the width and crystallinity of the Te-NBs. When the reaction time is extended from 12 h to 18 h, the width of the Te-NBs increases from an average of 375 nm to 545 nm with a largely improved crystallinity (Fig. S7a, b and d, ESI†). Meanwhile, the Raman spectra show a noticeable redshift of the A1 mode (Fig. S7e, ESI†). However, on further extending the reaction time to 24 h almost no changes are featured in both the width and crystallinity of the Te-NBs compared to those at 18 h. The Raman spectra and XRD pattern of Te-NBs grown for 18 h and 24 h are nearly identical (Fig. S7c–e, ESI†). The above results indicate that the width and crystallinity of Te-NBs are highly regulated by both the reaction temperature and reaction time. In addition, the high reaction temperature facilitates both the crystallization of the nanowire bundles and a lower oxidation.
The temperature and initial solution pH value dual regulation effect on the Te-NBs growth
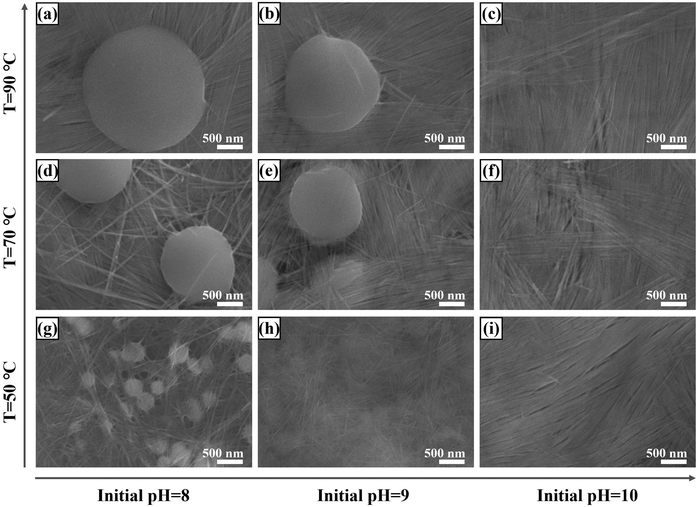
Both the reaction temperature and the initial solution pH value dependent test were conducted in order to study their effects on regulating the growth of Te-NBs. The Te-NB based thin films (Te-NBs-TF) were prepared on nylon membranes through vacuum-assisted filtration. As shown in Fig. 4, all the Te-NBs-TF contain Te spheres when the initial solution pH value is 8, while the diameter of these spheres becomes larger with an increase of reaction temperature (∼0.35 μm, ∼1.52 μm and ∼2.21 μm corresponding to reaction temperatures of 50 °C, 70 °C, and 90 °C, respectively). When the initial pH of solution increases to 9 with a reaction temperature of 50 °C, no spheres but only Te-NBs appear in the formed Te-NBs-TF, shown in Fig. 4h. Keeping the same initial pH but with a rise of the temperature to 70 °C, the Te spheres appear again with the average diameter of ∼1.44 μm (Fig. 4e). With a further increase in temperature to 90 °C, spheres will continuously grow to an average diameter of ∼1.83 μm (Fig. 4b). When setting the initial pH to 10, no matter the reaction temperature (50 °C, 70 °C or 90 °C), there were no Te spheres present in any of the final fabricated Te-NBs-TF, shown as Fig. 4c, f, and i. The corresponding XRD measurements of Te-NBs-TF to those samples in Fig. 4 are shown in Fig. S8 (ESI†). Both increasing the reaction temperature and lowering the initial solution pH value can enhance the diffraction peak intensity of Te, indicating the improvement of the crystallinity of the formed Te-NBs-TF.The growth mechanism of Te-NBs
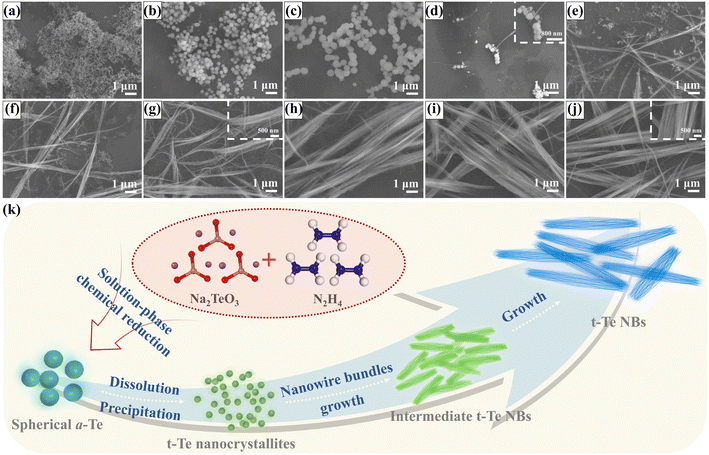
SEM images of the Te nanostructures over various reaction times are shown in Fig. 5a–j. The initial products of the reactions are nano spheres ranging from 50 to 100 nm (Fig. 5a).31,32 When the reaction time is extended to 30 min, the diameter of the Te sphere gradually increases to approximately 1 μm (Fig. 5b and c). Apart from the diffraction peaks from the nylon film substrate, no prominent diffraction peaks corresponding to the trigonal phase of Te were detected in the XRD pattern of the tellurium sphere/nylon composite sample, indicating that the nano spheres were amorphous Te (a-Te) spheres (Fig. S9, ESI†).33–35 Further extending the reaction to 1 h, both the total amount and the diameters of the a-Te spheres started to decrease due to the dissolution; simultaneously, a small amount of Te-NBs appears (Fig. 5d). When the reaction time was extended up to 6 h, the a-Te spheres completely disappeared (Fig. 5e–h). Meanwhile, the width and length of the Te-NBs gradually increased when the reaction time was extended from 2 h to 12 h (Fig. 5e–j and Fig. S10, ESI†).Fig. 5k shows a schematic diagram of the tentative growth mechanism of Te-NBs that we propose. The evolution of the Te nanostructure morphology indicates that the growth mechanism of Te-NBs is similar to that of Te or Se nanowires synthesized by the reduction of orthotelluric acid or selenious acid with hydrazine hydrate, or a so-called “solid-solution-solid” transformation process.31,36 According to the Stranski rule, if a crystal has various allotropes, the least stable and most soluble phase usually is the favorable one due to kinetic preference. Then, the above-mentioned metastable phase is transformed into a thermodynamically more stable phase during the aging process.37 The initial products of the reaction are a-Te spherical colloids. Initially the a-Te dissolves and precipitates as t-Te nanocrystallites in the solution due to their higher free energy compared with that of t-Te nanocrystallites.31,32,38 Then, more Te will recrystallize on the surface of the trigonal Te nanocrystallites (seeds) to form Te-NBs. The length-to-diameter ratio of the Te nanowires in the Te-NBs gradually increases until the complete dissolution of the a-Te spherical colloids. In this transformation, the linear morphology of the trigonal Te-NBs is determined by the highly anisotropic characteristics of the extended Te atom helical chains contained in the trigonal phase of solid Te.39 As a-Te spherical colloids transform into crystalline Te-NB, the order of the atomic arrangement increases, which would reduce the bulk free energy.31 Additionally, the initially formed spherical a-Te are actually made of much smaller Te particle aggregates (Fig. 5d), which also have a high surface energy due to the larger surface area compared to that of crystalline nanowires. In addition, with the assistance of the surfactant CTAB, Te nanowires attach side-by-side to self-assemble into bundles, significantly reducing the surface free energy of the final product Te-NBs.17 Thus, the transformation of a-Te spherical colloids into trigonal Te-NBs is favored with regard to energy, which drives the transformation process.
The growth of Te-NBs is sensitive to the reaction temperature and the initial solution pH value. First, TeO2 and NaOH react to form Na2TeO3, and then hydrate hydrazine reduces Na2TeO3 to form Te atoms (eqn (1) and (2)).32 As known, whether a redox reaction can occur depends on the reaction potential, that is, the difference between the reduction potentials for each half reaction (eqn (3) and (4)). The greater the potential of reaction, the easier the reaction will be.40
| TeO2 + 2NaOH = Na2TeO3 + H2O | (1) |
| TeO32− + N2H4 = Te + N2 + H2O + 2OH− | (2) |
| TeO32− + 3H2O + 4e− → Te + 6OH− E0 = −0.57 eV | (3) |
| N2H4 + 4OH− → N2 + 4H2O + 4e− E0 = −1.16 eV | (4) |
 | (5) |
The corresponding Nernst equation for the above reaction (eqn (2)) includes the pH term (eqn (5)). In eqn (5), the standard potential (E0) is 0.59 eV, while E is the actual reaction potential under certain reaction conditions (temperature, concentration, pH value).41,42 When the concentration is constant, the actual reaction potential will decrease with an increase of the pH value and a lower reaction temperature. In brief, it is possible to change the reduction of the Te ion by tuning the reaction temperature and the initial pH value of the solution.40,43 The reaction temperature and the initial solution pH value mainly affect the growth of the Te nanostructures through three aspects: (1) increasing the alkalinity of solution can promote the dissolution of Te.31,42 Therefore, the increase of the initial solution pH value facilitates the dissolution of a-Te spheres. (2) The reaction rate decreases as the initial solution pH value increases,44,45 which is due to the difference in the reaction potential under different initial pH values of the solution.32,43,46 Therefore, when the initial solution pH value is 10, the generating rate of Te atoms slows down and the dissolution rate of a-Te spheres accelerates. Eventually, the a-Te spheres dissolve completely and the final products are all Te-NBs (Fig. 4c, f and i). (3) The higher the reaction temperature, the faster the reaction rate will be.47 With an initial solution pH value of 10, employing a high reaction temperature of 90 °C promotes an increase in the width of the pure Te-NBs.
The systematic investigation unveiled that the high temperature and strong alkaline environment can balance the yield rate of Te atoms and the dissolution rate of a-Te spheres, which is favorable for the growth of highly crystallized pure Te-NBs in solution. Therefore, high-quality pure Te-NBs with a high crystallinity and low oxidation can be obtained at the reaction temperature of 90 °C with an initial solution pH value of 10.
The thermoelectric performance of Te-NBs-TF
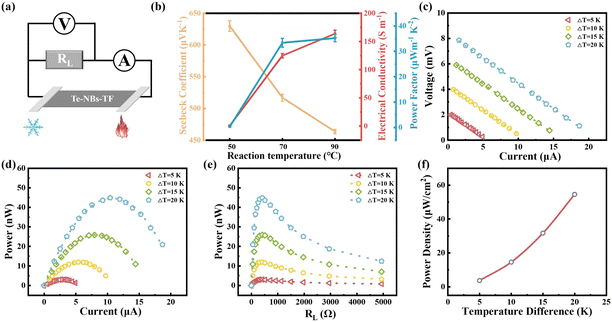
As the reaction temperature increases, the Seebeck coefficient of the corresponding pure Te-NBs-TF decreases while the conductivity increases (Fig. 6b), which may relate to the reduced oxidation and enhanced crystallinity of Te-NBs-TF. The optimized Te-NBs-TF at a reaction temperature of 90 °C and initial solution pH value of 10 exhibits a Seebeck coefficient, electrical conductivity and power factor of 463.6 μV K−1, 163.9 S m−1 and 35.2 μW m−1 K−2 at room temperature, respectively. Fig. 6a shows an illustration of the experimental setup for the output power measurement of Te-NBs-TF (10 × 15 × 0.009 mm). Since the output power can be expressed as , when the internal resistance (R0) and the load resistance (RL) are equal, the output power will be maximized.48 When the temperature difference (ΔT) is 15 K, the maximum output power of Te-NBs-TF fabricated under reaction temperatures of 50 °C, 70 °C and 90 °C is 0.12, 6.16 and 25.94 nW (Fig. S11 and Table S1, ESI†), respectively. Fig. 6c and d shows the output voltage and output power versus current at various ΔT. Fig. 6e shows output power versus RL at various ΔT. When ΔT = 5, 10, 15, and 20 K, the maximum output power of the Te-NBs-TF fabricated at a reaction temperature of 90 °C is 3.04, 11.94, 25.94, and 44.62 nW, respectively (Table S1, ESI†). The maximum output power density is the ratio of maximum output power to the total cross-sectional area (A),
  , which increases with ΔT.48 The maximum output power density of the Te-NBs-TF fabricated at a reaction temperature of 90 °C reaches 54.54 μW m−2 at ΔT = 20 K (Fig. 6f).
Conclusions
In this work, a systematic investigation of the parameter dependence of Te-NBs using a solution-phase method was conducted. By fine tuning the reaction temperature and initial pH of the solution, optimization of the structurally highly controlled Te-NBs structure growth was achieved. The growth mechanism of the NBs was unveiled through a thorough analysis of their morphology evolution and parameter dependencies. Accordingly, successful syntheses of the well-aligned Te-NBs with a high crystallinity and large width were realized under a reaction temperature of 90 °C and initial solution pH value of 10. The fabricated Te-NB based thin film demonstrated an optimized power factor of 35.2 μW m−1 K−2 at room temperature. This work opens an avenue of finely controlling the properties of Te-based thermoelectric nanomaterials through tuning their morphology and composition, which is expected to be crucial for improving their practicality as a future thermoelectric material.Author contributions
Yanmei Ren: data curation, formal analysis, investigation, writing – original draft. Rongke Sun: formal analysis. Xue Yu: formal analysis. Ruoxi Wang: formal analysis. Wusheng Zhang: formal analysis. Xiaodong Zhu: writing – review & editing. Yanqing Ma: funding acquisition, validation, writing – review & editing. Lei Ma: funding acquisition, resources, supervision, conceived the project, writing – review & editing.Conflicts of interest
There are no conflicts to declare.Acknowledgements
This work was financially supported by the National Natural Science Foundation of China (No. 11774255) and the National Key R & D Program of China (No. 2020YFC2004602).References
- S. Lin, W. Li, Z. Chen, J. Shen, B. Ge and Y. Pei, Nat. Commun., 2016, 7, 10287 CrossRef CAS PubMed.
- D. Park, H. Ju and J. Kim, J. Alloys Compd., 2018, 748, 305–313 CrossRef CAS.
- Y. Liu, W. Wang, C. Liu, C. Liu, J. Xu, Z. Zhu, J. Yang, Y. Wang and F. Jiang, J. Alloys Compd., 2020, 849, 156630 CrossRef CAS.
- Y. Liu, X. Lan, J. Xu, W. Zhou, C. Liu, C. Liu, P. Liu, M. Li and F. Jiang, ACS Appl. Mater. Interfaces, 2021, 13, 43155–43162 CrossRef CAS PubMed.
- W. Wang, C. Li, X. Li, Y. Jia, F. Jiang, C. Liu, R. Tan and J. Xu, Thin Solid Films, 2018, 654, 23–29 CrossRef CAS.
- H. Hu, S. Wang, S. Wang, G. Liu, T. Cao and Y. Long, Adv. Funct. Mater., 2019, 29, 1902922 CrossRef.
- J. W. Liu, W. R. Huang, M. Gong, M. Zhang, J. L. Wang, J. Zheng and S. H. Yu, Adv. Mater., 2013, 25, 5910–5915 CrossRef CAS PubMed.
- B. N. Zhong, G. T. Fei, W. B. Fu, X. X. Gong, X. D. Gao and L. Zhang, Phys. Chem. Chem. Phys., 2016, 18, 32691–32696 RSC.
- J. W. Liu, J. Xu, W. Hu, J. L. Yang and S. H. Yu, ChemNanoMat, 2016, 2, 167–170 CrossRef CAS.
- T. Zhang, T. Doert, K. Schwedtmann, J. J. Weigand and M. Ruck, Dalton Trans., 2020, 49, 1891–1896 RSC.
- P. Yu, L. Zhou, Z. Jia, K. Wu and J. Cui, J. Mater. Sci.: Mater. Electron., 2020, 31, 16332–16337 CrossRef CAS.
- L. Xu, G. Wang, X. Zheng, H. Pan, J. Zhu, Z. Li and S.-H. Yu, Chem, 2018, 4, 2451–2462 CAS.
- B. N. Zhong, G. T. Fei, W. B. Fu, X. X. Gong, S. H. Xu, X. D. Gao and L. De Zhang, CrystEngComm, 2017, 19, 2813–2820 RSC.
- J. Ma, J. Lian, X. Duan, Z. Liu, P. Peng, X. Liu, T. Kim and W. Zheng, CrystEngComm, 2011, 13, 2774–2778 RSC.
- H. Liu, B. Zeng and F. Jia, Nanotechnology, 2011, 22, 305608 CrossRef PubMed.
- K. Zhang, S. Wang, J. Qiu, J. L. Blackburn, X. Zhang, A. J. Ferguson, E. M. Miller and B. L. Weeks, Nano Energy, 2016, 19, 128–137 CrossRef CAS.
- J. Li, J. Zhang and Y. Qian, Solid State Sci., 2008, 10, 1549–1555 CrossRef CAS.
- E. Bianco, R. Rao, M. Snure, T. Back, N. R. Glavin, M. E. McConney, P. M. Ajayan and E. Ringe, Nanoscale, 2020, 12, 12613–12622 RSC.
- L. Xu, H. W. Liang, H. H. Li, K. Wang, Y. Yang, L. T. Song, X. Wang and S. H. Yu, Nano Res., 2014, 8, 1081–1097 CrossRef.
- M. K. Bahl, R. L. Watson and K. J. Irgolic, J. Chem. Phys., 1977, 66, 5526–5535 CrossRef CAS.
- Z. He, M. Hassan, H. X. Ju, R. Wang, J. L. Wang, J. F. Chen, J. F. Zhu, J. W. Liu and S. H. Yu, Nano Res., 2018, 11, 3353–3361 CrossRef CAS.
- Y. Zuo, T. Li, D. Rao, X. Lei, Q. Li, G. Zhu, R. Lu and H. Han, J. Phys. Chem. C, 2016, 120, 12305–12312 CrossRef CAS.
- Y. J. Zhu, W. W. Wang, R. J. Qi and X. L. Hu, Angew. Chem., Int. Ed., 2004, 43, 1410–1414 CrossRef CAS PubMed.
- Z. Liu, Z. Hu, Q. Xie, B. Yang, J. Wu and Y. Qian, J. Mater. Chem., 2003, 13, 159–162 RSC.
- Z. Xie, C. Xing, W. Huang, T. Fan, Z. Li, J. Zhao, Y. Xiang, Z. Guo, J. Li, Z. Yang, B. Dong, J. Qu, D. Fan and H. Zhang, Adv. Funct. Mater., 2018, 28, 1705833 CrossRef.
- K. Mahmood, J. Jacob, M. Ibrahim, A. Ail, N. Amin and S. Ikram, Optik, 2020, 206, 163435 CrossRef CAS.
- J. K. Qin, P. Y. Liao, M. Si, S. Gao, G. Qiu, J. Jian, Q. Wang, S. Q. Zhang, S. Huang, A. Charnas, Y. Wang, M. J. Kim, W. Wu, X. Xu, H. Y. Wang, L. Yang, Y. Khin Yap and P. D. Ye, Nat. Electron., 2020, 3, 141–147 CrossRef CAS.
- Y. Du, G. Qiu, Y. Wang, M. Si, X. Xu, W. Wu and P. D. Ye, Nano Lett., 2017, 17, 3965–3973 CrossRef CAS PubMed.
- T. Kim, C. H. Choi, P. Byeon, M. Lee, A. Song, K.-B. Chung, S. Han, S.-Y. Chung, K.-S. Park and J. K. Jeong, npj 2D Mater. Appl., 2022, 6, 4 CrossRef CAS.
- Y. Wang, G. Qiu, R. Wang, S. Huang, Q. Wang, Y. Liu, Y. Du, W. A. Goddard, M. J. Kim, X. Xu, P. D. Ye and W. Wu, Nat. Electron., 2018, 1, 228–236 CrossRef.
- B. Mayers and Y. Xia, J. Mater. Chem., 2002, 12, 1875–1881 RSC.
- Z. Liu, S. Li, Y. Yang, Z. Hu, S. Peng, J. Liang and Y. Qian, New J. Chem., 2003, 27, 1748–1752 RSC.
- Z. Fang, P. Wu, Y. Qian and G. Yu, Angew. Chem., Int. Ed., 2021, 60, 4275–4281 CrossRef CAS PubMed.
- B. Jiang, H. Xue, P. Wang, H. Du, Y. Kang, J. Zhao, S. Wang, W. Zhou, Z. Bian, H. Li, J. Henzie and Y. Yamauchi, J. Am. Chem. Soc., 2023, 145, 6079–6086 CrossRef CAS PubMed.
- G. Wu, X. Zheng, P. Cui, H. Jiang, X. Wang, Y. Qu, W. Chen, Y. Lin, H. Li, X. Han, Y. Hu, P. Liu, Q. Zhang, J. Ge, Y. Yao, R. Sun, Y. Wu, L. Gu, X. Hong and Y. Li, Nat. Commun., 2019, 10, 4855 CrossRef PubMed.
- B. Gates, Y. Yin and Y. Xia, J. Am. Chem. Soc., 2000, 122, 12582–12583 CrossRef CAS.
- X. Li, Y. Li, S. Li, W. Zhou, H. Chu, W. Chen, I. L. Li and Z. Tang, Cryst. Growth Des., 2005, 5, 911–916 CrossRef CAS.
- B. Gates, B. Mayers, B. Cattle and Y. Xia, Adv. Funct. Mater., 2002, 12, 219–227 CrossRef CAS.
- Y. Xia, P. Yang, Y. Sun, Y. Wu, B. Mayers, B. Gates, Y. Yin, F. Kim and H. Yan, Adv. Mater., 2003, 15, 353–389 CrossRef CAS.
- X. Zhang, R. Gallagher, D. He and G. Chen, Chem. Mater., 2020, 32, 5626–5633 CrossRef CAS.
- M. Hunyadi, Z. Gacsi, I. Csarnovics, L. Csige, A. Csik, L. Daroczi, R. Huszank and Z. Szucs, Phys. Chem. Chem. Phys., 2017, 19, 16477–16484 RSC.
- L. Berg, V. Haase, I. Hinz, G. Kirschstein, H. J. Richter-Ditten and J. Wagner, Gmelin handbook of inorganic chemistry, Springer-Verlag, Berlin, 1983 Search PubMed.
- R. Gallagher, X. Zhang, A. Altomare, D. Lawrence, N. Shawver, N. Tran, M. Beazley and G. Chen, Nano Res., 2020, 14, 1167–1174 CrossRef.
- H. Zhu, H. Zhang, J. Liang, G. Rao, J. Li, G. Liu, Z. Du, H. Fan and J. Luo, J. Phys. Chem. C, 2011, 115, 6375–6380 CrossRef CAS.
- C. Miao, Y. Yao, J. Wan and G. Tang, Rare Met., 2008, 27, 608–611 CAS.
- B. Zhang, W. Hou, X. Ye, S. Fu and Y. Xie, Adv. Funct. Mater., 2007, 17, 486–492 CrossRef CAS.
- H. S. Qian, S. H. Yu, J. Y. Gong, L. B. Luo and L. F. Fei, Langmuir, 2006, 22, 3830–3835 CrossRef CAS PubMed.
- L. Zhang, H. Shang, D. Huang, B. Xie, Q. Zou, Z. Gao, J. Xue, H. Gu and F. Ding, Nano Energy, 2022, 104, 107907 CrossRef CAS.
Footnote |
| † Electronic supplementary information (ESI) available. See DOI: https://doi.org/10.1039/d3ma00336a |
| This journal is © The Royal Society of Chemistry 2023 |

