 Open Access Article
Additive engineering for high-performance P3HT:non-fused ring electron acceptor organic solar cell†
Dou
Luo‡
ad,
Lanqing
Li‡
b,
Erjun
Zhou
 c,
Wai-Yeung
Wong
 d and
Aung Ko Ko
Kyaw
 *a
*a
aGuangdong University Key Laboratory for Advanced Quantum Dot Displays and Lighting, Department of Electrical & Electronic Engineering, Southern University of Science and Technology, Shenzhen 518055, China. E-mail: aung@sustech.edu.cn
bSchool of Biotechnology and Health Sciences, Wuyi University, Jiangmen 529020, China
cNational Center for Nanoscience and Technology, Beijing 100190, China
dDepartment of Applied Biology and Chemical Technology and Research Institute for Smart Energy, The Hong Kong Polytechnic University, Hung Hom, Hong Kong, China
First published on 26th August 2023
Abstract
In this study, we address the challenge of improving the power conversion efficiency (PCE) of P3HT-based organic solar cells (OSCs) by modulating the phase separation morphology. We synthesize a non-fused ring electron acceptor (NFREA), MOT, with an ultra-narrow bandgap and absorption up to 1000 nm, and pair it with P3HT to prepare OSCs. We find that solvent additives with similar structures can induce different phase separation and morphology in the P3HT:MOT blend, leading to distinct exciton dissociation and device performance. Among the additives tested, 1-methoxynaphthalene (1-MN) induces better phase separation of P3HT:MOT blend, resulting in a PCE of 6.98%, which is higher than that of devices processed with 1-chloronaphthalene (1-CN) and 1-phenylnaphthalene (1-PN) additives. Detailed photoelectric properties and exciton dissociation process analysis indicate that the higher performance processed by 1-MN is attributed to the preferable morphology induced by the phase separation. Our work not only reports a new NFREA to pair with P3HT but also develops a simple additive engineering strategy for regulating the morphology in P3HT-based OSCs.
1. Introduction
Organic solar cells (OSCs) have attracted widespread attention over the past decades owing to their numerous advantages, including being lightweight, flexible, and solution processable.1–4 With advancements in photoactive material designs, device engineering, and device physics, the power conversion efficiency (PCE) of OSCs has been steadily increasing, with some exceeding 19%.5–7 Currently, the most widely used donor materials are composed of a donor (D)–acceptor (A) structure that can modulate energy levels and facilitate charge transfer.8–10 On the other hand, high-efficiency acceptors are narrow bandgap fused-ring electron acceptors (FREAs), such as Y6 and its derivatives.5–7,11 However, the chemical structures of both donor and acceptor materials become more and more complicated over time, making their synthetic cost too high for practical applications. Therefore, it is essential to design and synthesize new materials that are cost-effective and easy to synthesize.Poly(3-hexylthiophene) (P3HT) is an easily accessible and readily scalable polymer with low cost and negligible batch-to-batch variation.12 However, devices based on P3HT and fullerene blend show a PCE of no more than 7.5%, mainly due to their narrow light absorption spectrum and poor phase separation of the blend.13,14 To overcome this, non-fullerene acceptors (NFAs) with narrow bandgap have been developed to be blended with P3HT, but most of these devices still show very low PCEs due to unfavorable phase separation morphologies.15 For instance, NFAs like ITIC and Y6 can achieve PCEs of over 14% and 17%, respectively, when blended with many other polymer donors.16,17 However, blending ITIC or Y6 with P3HT resulted in very low efficiencies of 1.25% and 3.6%, respectively, due to the inability of the P3HT:ITIC and P3HT:Y6 blend to form the necessary phase separation and interpenetrating network required for efficient charge separation and transport.18,19 So far, only a handful of methods have been developed to improve the morphology of P3HT:NFA blend. For example, Peng et al. optimized the treatment conditions of P3HT:TrBTIC film and achieved a PCE of 8.25% with a newly synthesized TrBTIC acceptor.20 Recently, Hou et al. removed the cyano groups of BTP-4Cl molecules and developed a new acceptor, ZY-4Cl, which resulted in a PCE of over 10% in P3HT:ZY-4Cl devices.21 The high efficiency was attributed to the largely reduced miscibility between P3HT and ZY-4Cl, leading to nanoscale phase separation, which is favorable for exciton separation and charge transport in the P3HT:ZY-4Cl blend.
Recently, researchers have shifted their focus to newly developed non-fused ring electron acceptors (NFREAs) due to their easy synthesis, low cost, and diverse molecular structures.22–31 Some of these NFREAs, including high-performance NFREAs developed in our lab, have demonstrated PCEs over 15%,24,26,32–34 making them potentially suitable for use with P3HT due to their tunable energy levels and energy bandgap. However, only few studies have investigated P3HT:NFREA blends due to their low PCE, and straightforward approaches to control phase separation in the blend film and optimize P3HT-based OSCs are rare. Therefore, significant efforts are needed to improve the chemical synthesis of new acceptors, processing procedures, and phase separation control to optimize P3HT-based OSCs.
In this work, we introduced a simple and effective approach for controlling miscibility using additives to promote phase separation and improve the efficiency of P3HT:NFREA-based OSCs. A new simple NFREA, MOT, was designed and synthesized with 3, 4-dimethoxythiophene core connected to DFIC terminals through a 4H-cyclopenta[1,2-b:5,4-b′]dithiophene (CPDT) bridge. This material was designed based on our previous work, C6OT-4F, in which hexyloxy chains were attached to the central thiophene.35 In that study, we found that C6OT-4F exhibited high solubility in common solvents, such as chloroform and chlorobenzene. By replacing the ethoxy chains with methoxy chains in MOT, the solubility remains largely unaffected while also gaining the advantage of greater accessibility of the methoxy groups. This modification results in a further reduction in synthetic complexity compared with C6OT-4F. To distinguish it from C6OT-4F in our previous work, we deliberately selected methoxy chains on the central thiophene to design MOT, which was then paired with P3HT in this current work. MOT has a wide absorption up to 1000 nm and a small optical bandgap (Eoptg) of 1.25 eV. It also has a high-lying HOMO level of −5.28 eV, which matches well with P3HT. We explored the effect of three solvent additives with similar structures on regulating the miscibility of the P3HT:MOT blend. Through film-depth-dependent light absorption spectra (FLAS) test, we surprisingly found that the 1-methoxynaphthalene (1-MN) additive significantly influences morphology fine-tuning, inducing preferable phase separation in the P3HT:MOT blend with higher exciton dissociation and a PCE of 6.98%. On the other hand, the 1-chloronaphthalene (1-CN) additive promotes miscibility, resulting in homogeneous morphology with reduced exciton dissociation and a PCE of 5.75%. The 1-phenylnaphthalene (1-PN) additive caused insufficient phase segregation, resulting in a PCE of 6.12%. Our results demonstrate that the miscibility between P3HT and NFREA MOT can be controlled to achieve appropriate phase separation through simple additive engineering. Among them, the 1-MN additive induces better phase separation compared with 1-CN and 1-PN, contributing to the efficient exciton dissociation and PCE in the devices. This work indicates that additive engineering is a promising strategy for achieving high-performance and low-cost P3HT-based OSCs.
2. Results and discussion
Synthesis and characterization of acceptors
The synthetic routes for MOT compound are displayed in Fig. 1a and the detailed synthetic procedures are given in the ESI.† It is observed that the target molecule MOT can be obtained with high yields through several steps. Compound 1 was acquired through 3,4-dimethoxythiophene (compound 1) bromination with N-bromosuccinimide. Notably, compound 2 was skillfully synthesized in our group and has proven successful in constructing other acceptors. Our methods allow for a total yield of over 61.5% for compound 2 through alkylation reaction, formylation and lithiation reactions.25 Compound 3 was prepared in ∼80% yield through the Stile cross-coupling reaction between compound 1 and key bis-formyl intermediates compound 2, with Pd(PPh3)4 as catalyst. Finally, through Knoevenagel condensations of compounds 3 and 2-(5,6-difluoro-3-oxo-2,3-dihydro-1H inden-1-ylidene)malononitrile (DFIC), MOT was obtained as black solids with good yields. Although multistep synthesis remains necessary for MOT, the overall satisfactory yields and easy purification procedures will significantly reduce synthesis complexity. The chemical structure of MOT was fully characterized by 1H NMR, 13C NMR, high-resolution mass spectroscopy (HRMS), and microanalysis, which affirmed the high purity of the molecule. The chemical structures of both polymer donor P3HT and NFREA MOT are shown in Fig. 1b.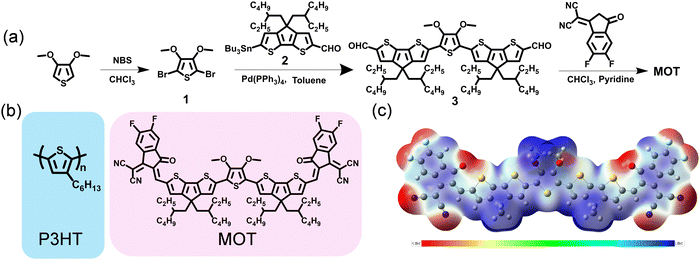 | ||
| Fig. 1 (a) Synthetic routes for MOT. (b) Chemical structures of P3HT and MOT. (c) electrostatic potential (ESP) distributions of MOT. | ||
Furthermore, we investigated the molecular geometry of the ground states by conducting density functional theory (DFT) calculations based on the B3LYP/6-31G(d) level. All alkyl chains were replaced with methyl groups to speed up the calculations. As illustrated in Fig. S1 (ESI†), MOT has excellent planarity from a side view, which is advantageous for facilitating intramolecular charge transfer and potentially favorable for intermolecular π–π stacking. The calculated values for the LUMO and the highest occupied molecular orbital (HOMO) levels of MOT are −3.71 and −5.49 eV, respectively. The molecular electrostatic potential (ESP) distribution is shown in Fig. 1c, where the CPDT π-bridge exhibits a positive ESP value, while the O-atoms and cyano group exhibit negative values. The distinct ESP distribution in MOT plays a critical role in affecting the inter- and intrachain electronic coupling, which has a strong influence on the optical response in π-conjugated molecule.
Optical and electrochemical properties
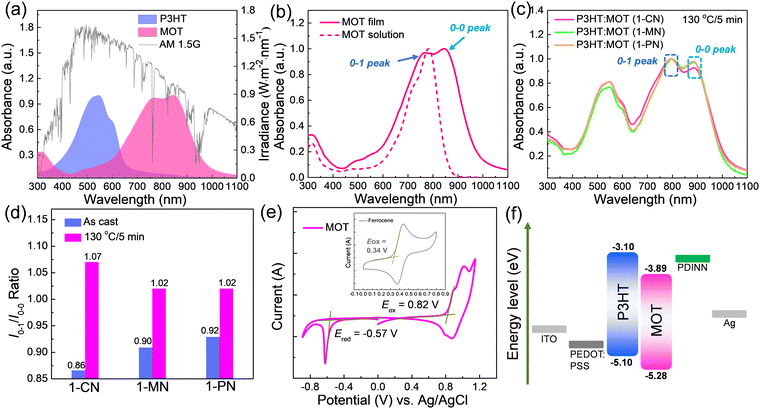
The absorption spectra of neat P3HT and MOT films are shown in Fig. 2a and the details are summarized in Table 1. The maximum absorption peaks of P3HT and MOT are centered at 545 and 847 nm, respectively. Notably, the complementary absorption bands of P3HT and MOT range from 400 nm to 1000 nm, covering a wide spectrum of the AM1.5G illumination of the sunlight (Fig. 2a). Such a broad absorption spectrum can promote photon utilization, which could contribute to the Jsc of the device. Furthermore, Fig. 2b shows the distinct double peaks of the MOT film, assigned as 0–1 and 0–0 peaks, reflecting different aggregation states in the pure and blend films. To distinguish the molecular aggregation of MOT in the blend films, we tested the absorption spectra of P3HT:MOT blends with different additives. As illustrated in Fig. S2 (ESI†), the absorption spectra of as-cast P3HT:MOT films with 1-CN, 1-MN and 1-PN additive show a broad range from 400 nm to 1000 nm. The absorption peaks of P3HT in the blend films are similar to that of pure P3HT film, indicating the unchanged P3HT aggregation in the blend films. However, the absorption of MOT exhibits double peaks that can be assigned to the intensities of 0–1 peak (I0–1) and 0–0 peak (I0–0), and their peak intensities vary with additive used in the blend. The ratio of I0–1/I0–0 provides a means to analyze the aggregation states of the acceptor. As shown in Fig. S2 (ESI†), the I0–1/I0–0 ratios are 0.86, 0.90, and 0.92 for the P3HT:MOT blend processed with1-CN-, 1-MN- and 1-PN, respectively. These values suggest that 0–0 peak is dominant for MOT in all these blends. Upon thermal annealing of the blend films at 130 °C for 5 min, the I0–1/I0–0 values change to 1.07, 1.02 and 1.02 for the films processed with 1-CN, 1-MN and 1-PN, respectively (Fig. 2c and d). The I0–1/I0–0 values approaching unity indicate the higher 0–1 peak in the films. Under thermal stress, the aggregation states of acceptor in the blend films are changed, which plays an important role in the performance of OSCs. Moreover, the maximum absorption peaks for 1-CN-, 1-MN- and 1-PN-processed blend films under thermal annealing are red-shifted by 72 nm, 77 nm, and 70 nm, respectively, compared with those of the as-cast films (Fig. S3, ESI†). The different degrees of red shift indicate that additives have significant effects on the molecular stacking, with 1-MN inducing stronger intermolecular π–π interactions in the blend films.| Material | λ max (nm) | λ onset (nm) | λ max (nm) | λ onset (nm) |
E
optg![[thin space (1/6-em)]](https://www.rsc.org/images/entities/char_2009.gif) c (nm) c (nm) |
HOMOd | LUMOd | HOMOe | LUMOe |
|---|---|---|---|---|---|---|---|---|---|
| a In chloroform solution. b In a neat film. c Calculated from the onset of the absorption spectrum of the film. Eoptg = 1240/λonset. d Evaluated by CV measurements. e Calculated from DFT. | |||||||||
| MOT | 783 | 861 | 816 | 989 | 1.25 | −5.28 | −3.89 | −5.49 | −3.71 |
The electrochemical properties of the acceptor were measured by cyclic voltammetry (CV), as depicted in Fig. 2e. The HOMO and LUMO levels for MOT were found to be −5.28 eV and −3.89 eV, respectively, indicating matched energy levels with P3HT, and efficient charge transfer between the polymer P3HT and MOT. (Fig. 2f)
Photovoltaic properties
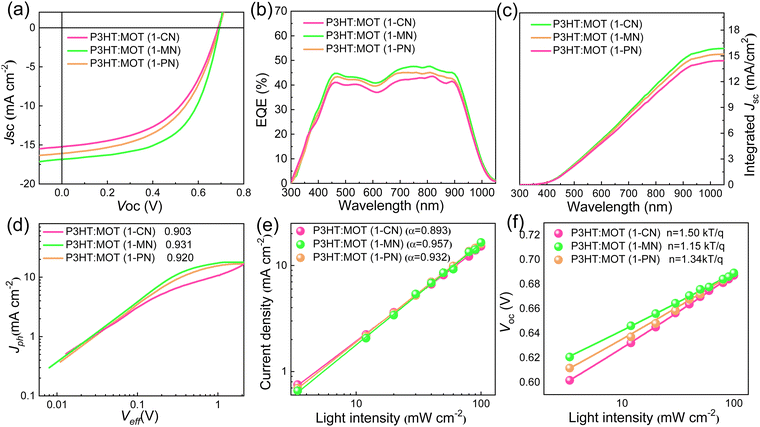
The chemical structures of 1-CN, 1-MN and 1-PN are shown in Fig. 3a. Among them, 1-PN exhibits the highest boiling point (324 °C), while the boiling points of 1-CN and 1-MN are between 263–271 °C. To study the effect of different additives on device performance, we fabricated corresponding devices with the structure of ITO/PEDOT:PSS/P3HT:MOT/PDINN/Ag and measured their photovoltaic parameters. As shown in Fig. 3b, we vacuumized the active layers under a vacuum chamber before thermal annealing to remove the additives quickly and to optimize the morphology. All the fabricated cells were tested under simulated AM1.5G with an illumination intensity of 100 mW cm−2. The optimal current density (J)–voltage (V) curves of the best-performing devices and their corresponding characteristics are shown in Fig. 4a and Table 2. The 1-MN-processed devices exhibited the highest PCE of 6.98%, with a Voc of 0.689 V, a Jsc of 16.7 mA cm−2, and a FF of 60.7%. However, for the 1-CN- and 1-PN-processed devices, the PCEs decreased to 5.75% and 6.12%, respectively, with inferior Jsc (15.2 mA cm−2 and 16 mA cm−2 for 1-CN and 1-PN processed devices) and FF (54.9% and 55.6% for 1-CN and 1-PN processed devices). These different results are mainly due to the Jsc and FF between different additives processed devices. Compared to 1-CN- and 1-PN-processed devices, the increased Jsc and FF of 1-MN-processed devices can be attributed to higher charge dissociation, less charge recombination, and better phase separation in the blend, which will be discussed in detail in the following sections. The external quantum efficiency (EQE) curves of these three devices are presented in Fig. 4b. Compared with the 1-CN- and 1-PN-processed devices, the 1-MN-processed device has a higher EQE response throughout the range of 400–900 nm, with a peak value exceeding 40%, which is responsible for the higher Jsc. The integrated Jsc values calculated from the EQE curves of the 1-CN-, 1-MN- and 1-PN-processed devices are 14.43, 15.86 and 15.19 mA cm−2, respectively, which are consistent with the Jsc values from the J–V curves.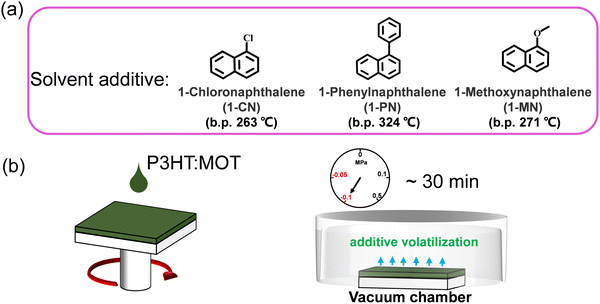 | ||
| Fig. 3 (a) The chemical structures and boiling points of the additives used in this work. (b) The diagram of spin coating and removing the additives via vacuuming. | ||
| Active layer | V oc (V) | J sc (mA cm−2) | J sc (mA cm−2)a | FF (%) | PCE (%)b |
|---|---|---|---|---|---|
| a Calculated current densities from EQE curves. b Average PCEs from ten devices. | |||||
| 1-CN | 0.689 (0.680 ± 0.009) | 15.2 (15.0 ± 0.2) | 14.43 | 54.9 (54.0 ± 0.9) | 5.75 (5.70 ± 0.05) |
| 1-MN | 0.689 (0.682 ± 0.007) | 16.7 (16.2 ± 0.5) | 15.86 | 60.7 (60.0 ± 0.7) | 6.98 (6.81 ± 0.17) |
| 1-PN | 0.689 (0.681 ± 0.008) | 16.0 (15.6 ± 0.4) | 15.19 | 55.6 (55.0 ± 0.6) | 6.12 (6.00 ± 0.12) |
Although the obtained PCE of 6.98% appears satisfactory, it remains lower than the reported P3HT:FREA-based counterparts.21 The difference can likely be attributed to several factors related to MOT. Firstly, MOT exhibits a deep lowest unoccupied molecular orbital (LUMO) level, which inevitably reduces the Voc in the devices. Moreover, previous studies have shown that cyano-substituted end groups exhibit much stronger miscibility with P3HT,21 leading to poor phase separation in the active layer. Consequently, the MOT with cyano-substituted groups may hinder the desired phase separation. Additionally, the use of low boiling point chloroform solvent during device preparation reduces the crystallization period and hampers effective phase separation in the active layers. Collectively, these factors contribute to the lower device performance in our case. Further efforts should be directed towards overcoming these deficiencies to improve overall efficiency.
To assess the suitability of MOT with other polymers, we also fabricated the devices using PTB7-Th:MOT and the corresponding J–V curves are shown in Fig. S4 (ESI†), while the parameters are listed Table S2 (ESI†). Remarkably, the 1-MN-processed devices exhibited a higher PCE of 8.03% compared to1-CN (6.80%) and 1-PN (7.79%). This improvement in PCE for the 1-MN treated devices can be attributed to the enhanced Jsc and FF. However, it is worth noting that the results obtained in this study are not as favorable as our previous work, where PTB7-Th:C6OT-4F exhibited a superior PCE of 9.8%. This indicates that the modification of alkyl chains on the central thiophene significantly influences the efficiency of the OSCs.
Charge generation, recombination, and transport
We studied the charge generation and exciton dissociation process in the three OSCs by measuring the dependence of photocurrent (Jph, defined as the difference between light and dark current density) on effective voltage (Veff, defined as Vbias – Vappl, where Vbias is the voltage when Jph is zero and Vappl is the applied voltage).36,37 At high Veff (2 V and above), almost all photogenerated carriers are swept out without recombination, hence, Jph at high Veff reflects the efficiency of charge generation process. Jph of 1-MN-processed device (15.54 mA cm−2) is higher than that of other two devices (13.72 mA cm−2 and 14.72 mA cm−2 for 1-CN- and 1-PN-processed device, respectively), suggesting that exciton generation and dissociation is more efficient in the former than latter, probably due to favorable nanoscale phase separation, which will be discussed later in detail. As depicted in Fig. 4d, the calculated charge collection probabilities (defined as Jsc/Jsat, where Jsat represents the saturation photocurrent density when Veff is equal to 2 V or more) for the 1-CN-, 1-MN- and 1-PN-processed devices are 90.3, 93.1 and 92%, respectively, indicating that the 1-MN processed device is more efficient in charge collection. Meanwhile, the charge recombination behavior was investigated by establishing the correlation between Jsc and light intensity (Pin) following the power-law equation of Jsc ∝ Pinα, where α approaching 1 means the bimolecular recombination is negligible.38 As displayed in Fig. 4e, the α values of the 1-CN-, 1-MN- and 1-PN-processed OSCs are 0.893, 0.957 and 0.932, respectively, indicating the less bimolecular recombination in the 1-MN-processed one. Furthermore, the relationship between Voc and Pin can be used to evaluate the trap-assisted recombination in the devices by using the equation of Voc ∝ (nkT/q)ln(Pin) (k is Boltzmann constant, T is temperature in Kelvin, and q is elementary charge), where the slope is close to 2 kT/q represents trap-assisted recombination.39 As shown in Fig. 4f, devices processed by 1-MN exhibited a smaller slope of 1.15 kT/q than that of 1-CN- (1.50 kT/q) and 1-PN- (1.34 kT/q) processed devices, suggesting that low trap-assisted recombination was realized, which is beneficial for achieving higher Jsc and FF.In order to gain a deeper understanding of the charge transfer in the three types OSCs, other advanced characterizations were performed. First, steady-state photoluminescence (PL) emission spectra were investigated to reveal the photo-induced charge transfer in the blend films. The PL intensity of P3HT was completely quenched in all blend films (Fig. S5, ESI†), implying highly efficient electron transfer from the LUMO of P3HT to the LUMO of MOT. Among them, the 1-MN-processed film exhibits the highest PL quenching efficiency of 92.1%, compared to 88.2% for the 1-CN-processed film and 90% for the 1-PN-processed film. This result indicates that the 1-MN-processed film exhibited more efficient charge transfer, consistent with the higher Jsc and FF. The time-resolved photoluminescence (TRPL) technique was used to further investigate the charge transfer dynamics (Fig. S6, ESI†). Fitting these curves with biexponential function resulted in the average lifetime (τave) values of 443, 381 and 390 ps for the films processed with 1-CN, 1-MN and 1-PN, respectively,40 indicating the more efficient charge transfer in the 1-MN-processed blend film due to its shorter lifetime. Moreover, the transient photovoltage (TPV) measurement was used to evaluate the charge carrier lifetimes and the degree of charge recombination.41 The carrier lifetimes of the three devices were 8.62, 10.11 and 9.29 μs for 1-CN-, 1-MN- and 1-PN-processed devices, respectively (Fig. S7, ESI†). The longer carrier lifetime of the device processed by 1-MN implies less bimolecular recombination than the other two devices, consistent with the results of recombination observed from Jsc ∝ Pinα.
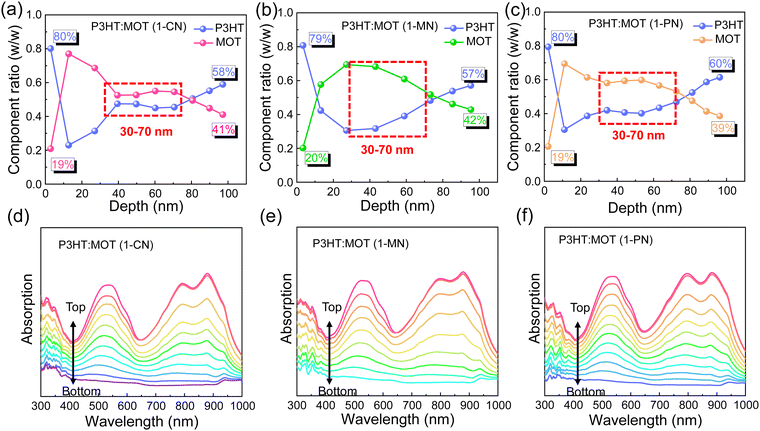
Film-depth-dependent light absorption spectra (FLAS) of the blend films were carried out to further investigate the effect of additives on the miscibility, which is critical to phase separation in the blend films. As mentioned above, all the blend films exhibit a distinguishable absorption range, with absorption peaks located from 400 to 600 nm mainly attributed to P3HT and absorption around 800–900 nm mainly ascribed to MOT. The blend films processed with 1-CN, 1-MN and 1-PN were tested, and the characteristic spectra of the donor and acceptor materials exhibit varying intensities along the film-depth direction, as shown in Fig. 5. Based on the distribution of P3HT and MOT, the component content distributions were calculated. It can be observed clearly that the contents of P3HT and MOT in the three blend films are nearly the same at the bottom and top of the films, indicating that additives have little effect on the shallow surface. However, at a depth of 30–70 nm, all three blend films exhibit different component content distributions. Specifically, for the 1-MN-processed film, the content of P3HT is up to ∼70% at a depth of 40 nm, while the content of MOT is only ∼30%. At the same depth, the contents of P3HT are ∼50% and ∼60% for 1-CN- and 1-PN-processed films, respectively, with corresponding MOT contents of ∼50% and ∼40% (Fig. 5a–c). These results indicate that the contents of donor P3HT and acceptor MOT are significantly different at the depth of 40 nm in 1-MN-processed film, which contributes to the phase separation and reduces the miscibility between P3HT and MOT. This favorable nanoscale phase separation morphology is beneficial for efficient exciton dissociation and forming efficient channels for charge transport. In contrast, for the 1-CN-processed film, P3HT and MOT are mixed well and a nanoscale interpenetrating network cannot be formed, which accounts for the lower Jsc and FF. Furthermore, the simulated exciton generation rates distributions along with film depth direction for the blend films processed with different additives are illustrated in Fig. S8 (ESI†). Particularly, the maximal exciton generation rate values were 1.38 × 1028, 1.48 × 1028 and 1.35 × 1028 cm−3 s−1 for the 1-CN, 1-MN and 1-PN processed films. The higher exciton generation rate value of 1-MN processed film agrees well with Jph analysis, higher Jsc and EQE results.
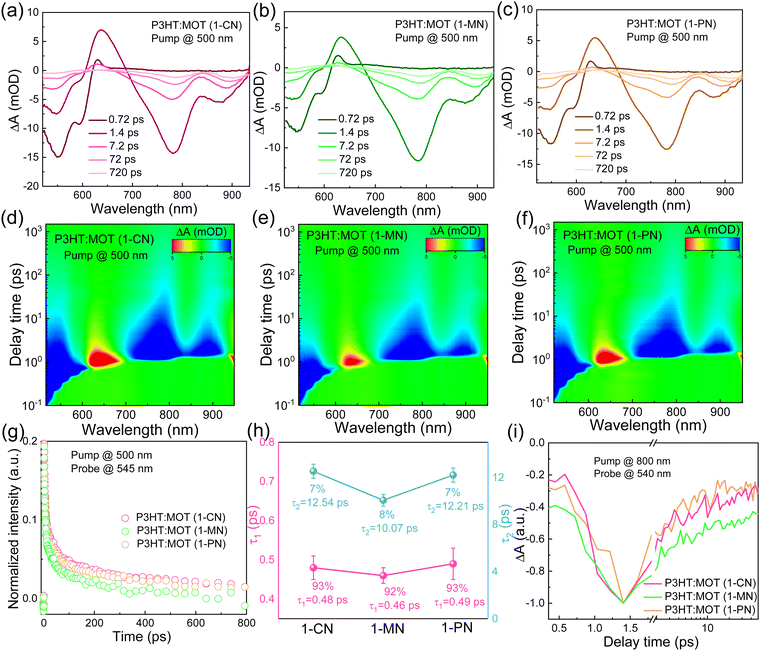
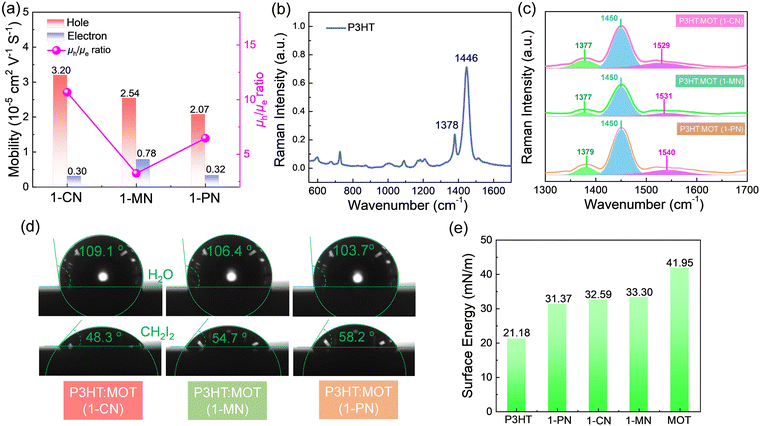
To investigate the charge transfer between the components and the effect of additives on the charge generation and recombination dynamics, transient absorption spectroscopy (TAS) measurements were performed and presented in Fig. 6. Initially, a 500 nm laser was used to excite the blend films and study electron transfer. The negative signals in the range of 450–610 nm are assigned to the ground state bleaching (GSB) signals of P3HT and the positive signals around 650 nm belong to the polaron pairs of P3HT. The electron transfer processes are verified by the decay dynamics of the 545 nm GSB signals of P3HT:MOT with different additives (Fig. 6g). The decay dynamics of the GSB at 545 nm are fitted by biexponential functions to gain the fast component (τ1) and slow component (τ2) (Fig. 6h and Table S3, ESI†). Generally, τ1 can be assigned to the ultrafast exciton dissociation at the donor–acceptor interface while τ2 corresponds to the diffusion of excitons in the donor phase towards the interface before dissociation.33 The τ1 and τ2 are 0.48, 12.54 ps, 0.46, 10.07 ps and 0.49, 12.21 ps for the devices with 1-CN-, 1-MN- and 1-PN-processed films, respectively. The results reveal that the 1-MN-processed device has a faster electron transfer rate than the other counterparts, which is beneficial for charge separation in the corresponding cell. Moreover, the hole transfer was also investigated using 800 nm excitation to solely excite the acceptor. The TA images and corresponding spectra with various decay times are presented in Fig. S9 (ESI†). With the decay of MOT signals at around 900 nm, the P3HT signals at 500 nm become negative and then decay to zero, confirming the hole transfer process form MOT to P3HT.42 Notably, the rising edge of the 1-MN-processed film is longer than that of the other films, indicating more efficient hole transfer from MOT to P3HT (Fig. 6i). These results suggest that the 1-MN-processed film exhibits faster charge transport and contributes to higher Jsc and device efficiency. Considering the better phase separation and efficient charge transfer in the 1-MN-processed film, the space-charge-limited current (SCLC) model was further adopted to evaluate the charge transport properties of the films (Fig. S10 and Table S4, ESI†). The μe value of the pristine MOT film is 1.95 × 10⁻⁴ cm2 V−1 s−1. The μh values of the blend films processed by 1-CN, 1-MN and 1-PN are 3.2 × 10⁻⁵, 2.54 × 10⁻⁵, 2.07 × 10⁻⁵ cm2 V−1 s−1, while the μe values are 0.30 × 10⁻⁵, 0.78 × 10⁻⁵, 0.32 × 10⁻⁵ cm2 V−1 s−1, respectively (Fig. 7a). It is observed that all three blend films exhibit unbalanced μh/μe (10.66, 3.25, 6.46 for 1-CN-, 1-MN- and 1-PN-processed films) values, which account for the low FF for the devices. Specially, the low electron mobilities of the blend films are expected to be enhanced to further improve the PCE of the devices.
Blend film morphology
The nanostructures and intramolecular conformational order were investigated using Raman spectra.43Fig. 7b shows the normalized Raman spectra of neat P3HT thin film excited at 532 nm. The ∼1446 cm−1 peak corresponds to the ν(C![[double bond, length as m-dash]](https://www.rsc.org/images/entities/char_e001.gif) C) vibration of P3HT along the conjugated backbone, while the ∼1378 cm−1 peak corresponds to the ν(C–C) vibration. Upon blending P3HT with MOT, two prominent peaks at ∼1091 cm−1 and ∼1450 cm−1 are observed in the Raman spectra (Fig. S11b, ESI†). The ∼1091 cm−1 peak, arising from acceptor MOT, is almost identical in the blend films processed by 1-CN, 1-MN and 1-PN. However, different peak intensities are observed for the ∼1450 cm−1 peak, as shown in Fig. 7c. In the 1-MN-processed film, the Raman band at ∼1377 cm−1 and ∼1450 cm−1 become broader with an increased full width at half maxima (FWHM) compared to those of 1-CN- and 1-PN-processed films, indicating a decrease in the molecular order and packing along the entire backbone. The difference in micro morphology was further verified by the grazing-incidence wide-angle X-ray scattering (GIWAXS), which will be discussed in the following sections.
C) vibration of P3HT along the conjugated backbone, while the ∼1378 cm−1 peak corresponds to the ν(C–C) vibration. Upon blending P3HT with MOT, two prominent peaks at ∼1091 cm−1 and ∼1450 cm−1 are observed in the Raman spectra (Fig. S11b, ESI†). The ∼1091 cm−1 peak, arising from acceptor MOT, is almost identical in the blend films processed by 1-CN, 1-MN and 1-PN. However, different peak intensities are observed for the ∼1450 cm−1 peak, as shown in Fig. 7c. In the 1-MN-processed film, the Raman band at ∼1377 cm−1 and ∼1450 cm−1 become broader with an increased full width at half maxima (FWHM) compared to those of 1-CN- and 1-PN-processed films, indicating a decrease in the molecular order and packing along the entire backbone. The difference in micro morphology was further verified by the grazing-incidence wide-angle X-ray scattering (GIWAXS), which will be discussed in the following sections.
To comprehensively understand the miscibility of the pure P3HT, MOT films and P3HT:MOT blend films, the surface energy and the interaction parameter χ between the components were evaluated using contact angle measurements. It should be noted that both pure films and blend films are spin coated on quartz glass. According to Flory-Huggins theory, miscibility can be evaluated from the interaction parameter χ based on the empirical equation  ,2 where k is a positive constant, and γA and γB refer to the surface tension of A and B in neat films, respectively.44 To make a clear comparison of the miscibility between P3HT and NFREA MOT, we also tested surface energy of the commonly used fullerene acceptor PC61BM. The contact angle measurements of P3HT, MOT and PC61BM are shown in Fig. S12 (ESI†), and the detailed parameters are exhibited in Table S5 (ESI†). Based on the contact angle values, the surface tension values were determined to be 21.18, 36.49, and 41.95 mN m−1 for the P3HT, PC61BM, and MOT pristine films, respectively. Then the χ can be calculated as χP3HT/PC61BM = 2.06 K and χP3HT/MOT = 3.51 K. The higher χ implies stronger phase separation in the P3HT:MOT blend. In addition, we also measured the contact angles for the blended films processed by different additives as shown in Fig. 7d. Using the contact angle values, the surface energies of P3HT:MOT processed by 1-CN, 1-MN and 1-PN are calculated to be 32.59, 33.30 and 31.37 mN m−1, respectively. As shown in Fig. 7e, the 1-CN-processed film exhibits the surface energy between P3HT and MOT, indicating that the donor and acceptor can effectively diffuse into the other phase.34 However, for the 1-MN- and 1-PN-processed blend films, the higher or lower surface energy indicates uneven distribution of donor and acceptor. Specially, the 1-MN processed blend film exhibit the higher surface energy for greater phase separation. These results imply that 1-MN can induce the superior phase separation in the P3HT:MOT film than that of 1-CN and 1-PN additives, which will contribute to the charge dissociation and transport in the devices.
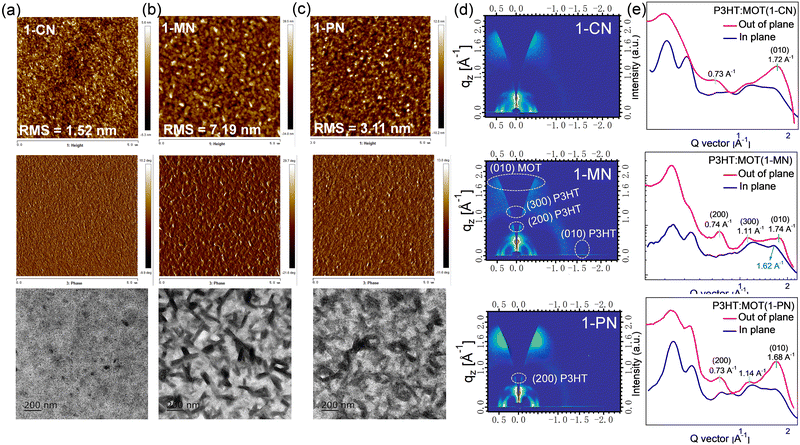
The surface morphologies of the P3HT:MOT blend films processed by 1-CN, 1-MN and 1-PN were characterized using atomic force microscopy (AFM), transmission electron microscopy (TEM), and GIWAXS. As presented in Fig. 8a, the 1-CN-processed blend film has a smooth surface with root-mean-square (RMS) roughness of 1.52 nm whereas the 1-PN and 1-MN processed films exhibit rougher surface with RMS roughness values of 3.11 and 7.19 nm, respectively. Moreover, the TEM images confirm that the 1-MN-processed film displays distinct nanoscale phase separation with rod-like aggregations, representing two separate phases in the blend. However, this phenomenon is not observed in the 1-CN processed film, which has a homogeneous morphology. AFM and TEM results imply that the rod-like aggregations promote phase separation between P3HT and MOT processed by 1-MN. The crystalline properties of these blend films were determined by GIWAXS. As shown in Fig. S13 (ESI†), P3HT exhibits an edge-on orientation with a pronounced (010) π–π stacking diffraction peak at 1.62 Å−1 in in-plane (IP) direction and (100), (200) and (300) diffraction peaks in the out-of-plane (OOP) direction. On the other hand, MOT neat films tend to form a predominantly face-on orientation with a sharp (010) diffraction peak at 1.71 Å−1 in OOP direction. GIWAXS patterns of P3HT:MOT blend films with different additives are displayed in Fig. 8d. The 1-CN and 1-PN-processed blend films show a predominant face-on orientation with (010) diffraction peak in the OOP direction at 1.72 Å−1 and 1.68 Å−1, respectively. In contrast, the 1-MN-processed film exhibits (010) diffraction peak at 1.62 Å−1 in the IP direction, as well as (200) and (300) diffraction peaks at 0.74 Å−1 and 1.11 Å−1, respectively, in the OOP direction, which are derived from P3HT donor. Additionally, the 1-MN-processed film displays a (010) peak at 1.74 Å−1 in the OOP direction, which can be attributed to the diffraction from MOT, based on the GIWAXS pattern of pure MOT film (Fig. S13d, ESI†). The absence of this peak in the pure P3HT film further confirms that it originates from MOT phase (Fig. S12c, ESI†). The presence of both P3HT and MOT orientations in the 1-MN-processed blend film indicates that they can form two separate phases in their blends. The better phase separation in the 1-MN processed film possesses a more favorable nanoscale phase separation morphology, which is beneficial for forming efficient channels for charge transport, agreeing well with the higher Jsc and FF in the devices. Moreover, the 1-PN-processed devices show higher performance than those of 1-CN, which is probably due to the stronger crystallinity of the active layers, as manifested by the much stronger diffraction intensity.
3. Conclusion
In summary, we have synthesized a new non-fused ring electron acceptor MOT with spectra absorption up to 1000 nm and up-shifted HOMO level of −5.28 eV. Through photophysical characterizations and device performance exploration, we demonstrated that the device performance can be improved by using an additive engineering strategy. In contrast to the 1-CN and 1-PN additives, 1-MN additive was found to promote phase separation in the P3HT:MOT blend, resulting in efficient charge transport and reduced charge recombination in OSCs. Consequently, P3HT:MOT devices processed with 1-MN exhibited a PCE of 6.98%, which was higher than that of devices processed with 1-CN (PCE of 5.75%) and 1-PN (PCE of 6.12%). Overall, this work reports a new simple NFREA and additive engineering approach to regulate the phase separation in P3HT-based OSCs, offering a promising avenue for the development of efficient and cost-effective organic photovoltaics.Conflicts of interest
There are no conflicts to declare.Acknowledgements
This work was supported by the Shenzhen Science, Technology and Innovation Commission (JCYJ20220530113014033), the Department of Education of Guangdong Province University Innovation Foundation (2021KTSCX107), the National Natural Science Foundation of China (Grant No. 62150610496). L. Q. L. is thankful to the Department of Education of Guangdong Province (2022KQNCX092), the Foundation of Guangdong Basic and Applied Basic Research (2022A1515110134). W. Y. W. thanks the RGC Senior Research Fellowship Scheme (SRFS2021-5S01), the Hong Kong Polytechnic University, Research Institute for Smart Energy (CDAQ) and Miss Clarea Au for the Endowed Professorship in Energy (847S).Notes and references
- J. Zhang, H. S. Tan, X. Guo, A. Facchetti and H. Yan, Nat. Energy, 2018, 3, 720–731 CrossRef CAS.
- P. Cheng, G. Li, X. Zhan and Y. Yang, Nat. Photonics, 2018, 12, 131–142 CrossRef CAS.
- G. Zhang, F. R. Lin, F. Qi, T. Heumüller, A. Distler, H.-J. Egelhaaf, N. Li, P. C. Y. Chow, C. J. Brabec, A. K. Jen and H.-L. Yip, Chem. Rev., 2022 DOI:10.1021/acs.chemrev.1c00955.
- D. Luo, W. Jang, D. D. Babu, M. S. Kim, D. H. Wang and A. K. K. Kyaw, J. Mater. Chem. A, 2022, 10, 3255–3295 RSC.
- C. He, Y. Pan, Y. Ouyang, Q. Shen, Y. Gao, K. Yan, J. Fang, Y. Chen, C.-Q. Ma, J. Min, C. Zhang, L. Zuo and H. Chen, Energy Environ. Sci., 2022, 15, 2537–2544 RSC.
- J. Wang, M. Zhang, J. Lin, Z. Zheng, L. Zhu, P. Bi, H. Liang, X. Guo, J. Wu, Y. Wang, L. Yu, J. Li, J. Lv, X. Liu, F. Liu, J. Hou and Y. Li, Energy Environ. Sci., 2022, 15, 1585–1593 RSC.
- L. Zhu, M. Zhang, J. Xu, C. Li, J. Yan, G. Zhou, W. Zhong, T. Hao, J. Song, X. Xue, Z. Zhou, R. Zeng, H. Zhu, C.-C. Chen, R. C. I. MacKenzie, Y. Zou, J. Nelson, Y. Zhang, Y. Sun and F. Liu, Nat. Mater., 2022, 21, 656–663 CrossRef CAS PubMed.
- S.-H. Liao, H.-J. Jhuo, Y.-S. Cheng and S.-A. Chen, Adv. Mater., 2013, 25, 4766–4771 CrossRef CAS PubMed.
- M. Zhang, X. Guo, W. Ma, H. Ade and J. Hou, Adv. Mater., 2015, 27, 4655–4660 CrossRef CAS PubMed.
- C. Sun, F. Pan, H. Bin, J. Zhang, L. Xue, B. Qiu, Z. Wei, Z. Zhang and Y. Li, Nat. Commun., 2018, 9, 743 CrossRef PubMed.
- J. Yuan, Y. Zhang, L. Zhou, G. Zhang, H.-L. Yip, T.-K. Lau, X. Lu, C. Zhu, H. Peng, P. A. Johnson, M. Leclerc, Y. Cao, J. Ulanski, Y. Li and Y. Zou, Joule, 2019, 3, 1140–1151 CrossRef CAS.
- A. Wadsworth, Z. Hamid, M. Bidwell, R. S. Ashraf, J. I. Khan, D. H. Anjum, C. Cendra, J. Yan, E. Rezasoltani, A. A. Y. Guilbert, M. Azzouzi, N. Gasparini, J. H. Bannock, D. Baran, H. Wu, J. C. de Mello, C. J. Brabec, A. Salleo, J. Nelson, F. Laquai and I. McCulloch, Adv. Energy Mater., 2018, 8, 1801001 CrossRef.
- M. T. Dang, L. Hirsch and G. Wantz, Adv. Mater., 2011, 23, 3597–3602 CrossRef CAS PubMed.
- A. F. Eftaiha, J.-P. Sun, I. G. Hill and G. C. Welch, J. Mater. Chem. A, 2014, 2, 1201 RSC.
- S. Holliday, R. S. Ashraf, C. B. Nielsen, M. Kirkus, J. A. Röhr, C.-H. Tan, E. C.-Fregoso, A.-C. Knall, J. R. Durrant, J. Nelson and I. McCulloch, J. Am. Chem. Soc., 2015, 137, 898–904 CrossRef CAS PubMed.
- Y. Lin, J. Wang, Z.-G. Zhang, H. Bai, Y. Li, D. Zhu and X. Zhan, Adv. Mater., 2015, 27, 1170–1174 CrossRef CAS PubMed.
- J. Lv, H. Tang, J. Huang, C. Yan, K. Liu, Q. Yang, D. Hu, R. Singh, J. Lee, S. Lu, G. Li and Z. Kan, Energy Environ. Sci., 2021, 14, 3044–3052 RSC.
- Y. Qin, M. A. Uddin, Y. Chen, B. Jang, K. Zhao, Z. Zheng, R. Yu, T. J. Shin, H. Y. Woo and J. Hou, Adv. Mater., 2016, 28, 9416–9422 CrossRef CAS PubMed.
- J. Yang, Y. Geng, J. Li, B. Zhao, Q. Guo and E. Zhou, J. Phys. Chem. C, 2020, 124, 24616–24623 CrossRef CAS.
- X. Xu, G. Zhang, L. Yu, R. Li and Q. Peng, Adv. Mater., 2019, 31, 1906045 CrossRef CAS PubMed.
- C. Yang, S. Zhang, J. Ren, M. Gao, P. Bi, L. Ye and J. Hou, Energy Environ. Sci., 2020, 13, 2864–2869 RSC.
- X. Zhang, C. Li, L. Qin, H. Chen, J. Yu, Y. Wei, X. Liu, J. Zhang, Z. Wei, F. Gao, Q. Peng and H. Huang, Angew. Chem., Int. Ed., 2021, 60, 17720–17725 CrossRef CAS PubMed.
- D. Luo, X. Lai, N. Zheng, C. Duan, Z. Wang, K. Wang and A. K. K. Kyaw, Chem. Eng. J., 2021, 420, 129768 CrossRef CAS.
- X. Wang, H. Lu, Y. Liu, A. Zhang, N. Yu, H. Wang, S. Li, Y. Zhou, X. Xu, Z. Tang and Z. Bo, Adv. Energy Mater., 2021, 11, 2102591 CrossRef CAS.
- D. Luo, L. Li, Y. Shi, J. Zhang, K. Wang, X. Guo and A. K. K. Kyaw, J. Mater. Chem. A, 2021, 9, 14948–14957 RSC.
- L. Ma, S. Zhang, J. Zhu, J. Wang, J. Ren, J. Zhang and J. Hou, Nat. Commun., 2021, 12, 5093 CrossRef CAS PubMed.
- A. Mishra and G. D. Sharma, Angew. Chem., Int. Ed., 2023, 62, e202219245 CrossRef CAS PubMed.
- H. Gao, C. Han, X. Wan and Y. Chen, Ind. Chem. Mater., 2023, 1, 60–78 RSC.
- Q. Shen, C. He, S. Li, L. Zuo, M. Shi and H. Chen, Acc. Mater. Res., 2022, 3, 644–657 CrossRef CAS.
- Y. Li, J. Yu, Y. Zhou and Z. Li, Chem. – Eur. J., 2022, 28, e202201675 CrossRef CAS PubMed.
- D. Luo, C. J. Brabec and A. K. K. Kyaw, Nano Energy, 2023, 114, 108661 CrossRef CAS.
- D. Luo, Z. Jiang, C. Shan, L. Li, C. Duan, Q. Liu, Z. Wang, K. Wang, B. Xu and A. K. K. Kyaw, ACS Appl. Mater. Interfaces, 2022, 14, 24374–24385 CrossRef CAS PubMed.
- D. Luo, Z. Jiang, W. Yang, X. Guo, X. Li, E. Zhou, G. Li, L. Li, C. Duan, C. Shan, Z. Wang, Y. Li, B. Xu and A. K. K. Kyaw, Nano Energy, 2022, 98, 107186 CrossRef CAS.
- D. Luo, Z. Jiang, W. L. Tan, L. Zhang, L. Li, C. Shan, C. R. McNeill, P. Sonar, B. Xu and A. K. K. Kyaw, Adv. Energy Mater., 2023, 13, 2203402 CrossRef CAS.
- D. Luo, Y. Zhang, L. Li, C. Shan, Q. Liu, Z. Wang, W. C. H. Choy and A. K. K. Kyaw, Mater. Today Energy, 2022, 24, 100938 CrossRef CAS.
- A. K. K. Kyaw, D. H. Wang, V. Gupta, W. L. Leong, L. Ke, G. C. Bazan and A. J. Heeger, ACS Nano, 2013, 7, 4569–4577 CrossRef CAS PubMed.
- Y. Zhang, D. Luo, C. Shan, Q. Liu, X. Gu, W. Li, W. C. H. Choy and A. K. K. Kyaw, Sol. RRL, 2021, 6, 2100785 CrossRef.
- A. K. Kyaw, D. H. Wang, D. Wynands, J. Zhang, T.-Q. Nguyen, G. C. Bazan and A. J. Heeger, Nano Lett., 2013, 13, 3796–3801 CrossRef CAS PubMed.
- G. J. Wetzelaer, M. Scheepers, A. M. Sempere, C. Momblona, J. Ávila and H. J. Bolink, Adv. Mater., 2015, 27, 1837–1841 CrossRef CAS PubMed.
- T. Wu, Y. Wang, X. Li, Y. Wu, X. Meng, D. Cui, X. Yang and L. Han, Adv. Energy Mater., 2019, 9, 1803766 CrossRef.
- Z. Li, F. Gao, N. C. Greenham and C. R. McNeill, Adv. Funct. Mater., 2011, 21, 1419–1431 CrossRef CAS.
- R. Wang, C. Zhang, Q. Li, Z. Zhang, X. Wang and M. Xiao, J. Am. Chem. Soc., 2020, 142, 12751–12759 CrossRef CAS PubMed.
- W. C. Tsoi, D. T. James, E. B. Domingo, J. S. Kim, M. Hashimi, C. E. Murphy, N. Stingelin, M. Heeney and J.-S. Kim, ACS Nano, 2012, 6, 9646–9656 CrossRef CAS PubMed.
- S. Nilsson, A. Bernasik, A. Budkowski and E. Moons, Macromolecules, 2007, 40, 8291–8301 CrossRef CAS.
Footnotes |
| † Electronic supplementary information (ESI) available. See DOI: https://doi.org/10.1039/d3ma00541k |
| ‡ These authors contribute equally to this work. |
| This journal is © The Royal Society of Chemistry 2023 |

