DOI:
10.1039/D3MA00313B
(Paper)
Mater. Adv., 2023,
4, 3822-3838
The thermodynamic and mechanical properties of Earth-abundant metal ternary boride Mo2(Fe,Mn)B2 solid solutions for impact- and wear-resistant alloys
Received
19th June 2023
, Accepted 30th July 2023
First published on 31st July 2023
Abstract
The tetragonal ternary borides Mo2MB2 (M = Fe, Mn) and their solid solutions are promising candidates for tungsten-free wear-resistant alloys. In this study, we investigated the thermodynamic, mechanical, vibrational, structural, and electronic properties of Mo2MB2 compounds and their solid solutions using density functional theory (DFT) calculations. To model Mo2(Fe1−xMnx)B2 as disordered substitutional solid solutions, we employed the DFT-based virtual crystal approximation (VCA) and the cluster expansion (CE) approaches. The calculation results showed that both Mo2MB2 compounds are mechanically and thermodynamically stable, exhibiting similar features in terms of electronic structure and chemical bonding types. The temperature–dependent interaction parameter for the Mo2(Fe1−xMnx)B2 phase in the compound energy formalism (CEF) notation was accessed using a combination of the ATAT and the Thermo-Calc software. To experimentally validate the calculated thermodynamic parameters, an isopleth was constructed by intersecting the Fe–Mn–Mo–B–C alloy system within suitable concentration ranges for hardfacing alloy development, and the key alloys were analyzed to compare their phase composition and constitution with the calculation results. The Vickers hardness (HV) of the Mo2(Fe1−xMnx)B2 solid solutions was determined as an average value from different models, including elastic constants calculated using DFT. Both VCA and CE approaches showed an HV increase from 22.9 to 24.7 GPa within the composition range of Mo2(Fe0.75Mn0.25)B2 to Mo2(Fe0.25Mn0.75)B2. Based on the calculated properties, Mo2(Fe,Mn)B2 solutions can serve as a reinforcement phase in high-manganese hardfacing Fe-based alloys.
1. Introduction
Tungsten carbide (WC) is the typical material used in applications that require wear resistance. However, the price of raw materials for tungsten carbide has increased significantly in recent decades. WC-based materials are widely applied in diverse fields, such as machining, oil and gas equipment, mining machines, cermets, wear-resistant alloys, and coatings, owing to their versatility. Recent advancements in tungsten-free materials with adequate mechanical properties now offer opportunities for partial replacement of WC-based materials in specific areas, including hardfacing alloys, where their use is less critical than in the energy industry. This approach provides a more rational redistribution of available tungsten resources. Transition-metal ternary borides such as Mo2FeB2 are materials with unique physical, chemical, and mechanical properties: high microhardness, stability in contact with liquid alloys and relatively low price compared to WC.1 Mo2FeB2 is used as a component of metal matrix composites and coatings with the composite structure using Fe-based alloys alloyed with other metals such as Mn, Cr, and Ni as the metal matrix.2–4 For example, the effect of Mn in such materials and coatings is critical to achieving complex impact abrasion wear resistance due to the formation of a TWinning Induced Plasticity (TWIP) steel5 matrix. Hence, the intentional development of hardfacing alloys with such a combination of characteristics can be achieved by predicting the effect of Mn on the composition and properties of key (both ceramic and metal) phases using atomistic and thermodynamic models of the corresponding solid solutions. Investigations of the alloying with Mn on the microstructure and the mechanical properties of the sintered Fe/Mo2FeB2 composites showed that the Mn additions lead to an increase in plasticity and transverse rupture strength and a decrease in hardness and size of the Mo2FeB2 grains.6,7 Remarkable improvements were also observed in the tribological properties measured in contact with the ceramic (Al2O3) counter body.8 Using diffraction patterns analysis, Yu et al.6 showed that (Mo,Fe,Mn)3B2 substitution solutions are possible, but the detailed solubility ranges of Mn in Mo2FeB2 were not determined.
The Mo2FeB2 materials has also been the focus of theoretical investigations. Wang et al.9 used density functional theory (DFT) to calculate the enthalpies of formation, electronic properties, and elastic constants for Mo2FeB2 for different magnetism (nonmagnetic, ferromagnetic, and antiferromagnetic) and it was found that Mo2FeB2 is a ground state structure. In further DFT investigations,10 elastic constants and thermodynamic properties were calculated for Mo2FeB2 at constant volume and different pressures in the range from 0 to 100 GPa. Shi et al.11 proposed a model based on chemical bond strength analysis and Mulliken overlap population calculation to predict the hardness of ternary borides. Their model was in good agreement with experimental results for the Vickers hardness (HV) of Mo2FeB2 (23.06 GPa), with a calculated value of 21.7 GPa compared to the experimental value of 23.1 GPa. He and co-workers12 used another approach to calculate the hardness of Mo2FeB2 based on elastic constants, according to the empirical Chen model.13 The reported HV value of 24.6 GPa was also close to the experimental value.
In contrast to Mo2FeB2, the experimental data for Mo2MnB2 are essentially limited by the isothermal section constructed in ref. 14, where a stable phase with a U3Si2-type structure was observed and described as solid solution (Mo,Mn)3B2. However, DFT calculations performed by Yang et al.15 show that Mo2MnB2 is a stable phase with a predicted HV value of 22.8 GPa. Atomistic models of the (Mo,Mn)2(Fe,Mn)B2 of substitutional solid solutions were also generated by partially replacing Fe or Mo in the Mo2FeB2 parent lattice with Mn avoiding the use of supercell structures.16 The resulting structures after geometry optimization were more stable than Mo2FeB2 and had increased Young's modulus and HV values. This approach is, however, not sufficiently robust to predict the properties of the solution in the ground state due to the limited number of atomic configurations. To overcome this limitation, it can be extended with techniques that allow the analysis of a large number of clusters, such as supercells with different atomic arrangements. Two such techniques are cluster expansion (CE) and special quasirandom structures (SQS) formalism.17 These techniques enable a systematic ab initio investigation of ground-state structures, which represent the lowest energy set of supercells corresponding to disordered structures with various composition in real alloy systems. This is accomplished through stepwise concentration-dependent DFT lattice stability calculations, performing the screening of energy in composition space within the given crystal structure symmetry. The main distinction between CE and SQS lies in their approaches to supercell generation. CE involves DFT calculations of a wide range of supercells with different compositions and sizes, whereas SQS utilizes a limited number of relatively small supercells (typically containing 30–50 atoms per cell) that comprise the most important interactions between components. Despite the wide integration of the SQS approach into software tools for high-throughput computing18 and its successful testing for various phase models, the tetragonal (space group P4/mbm) structure is not included in the current SQS database of the ATAT software.19 Therefore, additional SQS model generation is needed using corresponding algorithms as implemented in the mcsqs code,20 along with further validation of the data using other calculation approaches and experimental data. Another suitable approach for modelling disordered substitutional solid solutions via DFT is the Virtual Crystal Approximation (VCA) technique.21 This method involves the concentration-dependent averaging of pseudopotentials for the crystal lattice sites occupied by alloy components. However, it is important to note that the applicability of the VCA is limited to systems that exhibit insignificant deviations from Vegard's law.22
A comprehensive analysis of the experimental investigations3,4,6,7 and theoretical studies9–12,15,16 of Mn2FeB2 and similar compounds shows that current investigations mainly focus on these compounds in their pure state. However, there is a lack of data regarding the properties of their based solid solutions. Therefore, the motivation behind this study was to investigate Mo2FeB2-based solid solutions using DFT-based methods supported by key experiments. As Mn is a typical component of impact- and wear-resistant alloys, the Mo2(Fe1−xMnx)B2 solid solutions were the main focus, being promising candidates for use as a reinforcement phase in the design of new alloys.
In the present study, DFT calculations were employed to investigate the structural, mechanical, thermodynamic and electronic properties of Mo2FeB2 and Mo2MnB2 ternary borides as well as of Mo2(Fe,Mn)B2 solid solutions which were modeled using CE and VCA approaches. Finally, the thermodynamic parameters were determined according to the compound energy formalism (CEF)23 representation in order to extend existing thermodynamic databases for the calculation of the equilibrium phase composition of impact- and wear-resistant alloys.
2. Methodology
2.1 Atomistic models
The crystal structure of the ternary borides Mo2FeB2 and Mo2MnB2 has a tetragonal lattice unit cell belonging to the P4/mbm space group and containing two Fe(Mn), four Mo, and four B atoms at the Wyckoff positions 2a, 4g, and 4h, respectively, as shown in Fig. 1(a). Such a structure arises through cooperative growth of the cubic intermetallic MoFe (MoMn) phase (space group Pm3m) and the hexagonal diboride MoB2 (space group P6/mmm).24 The experimental lattice parameters are a = b = 5.782 Å and c = 3.148 Å for Mo2FeB225 and a = b = 5.781–5.812 Å and c = 3.127–3.136 Å26 for Mo2MnB2. According to the CEF and considering the data presented in ref. 27, the Mo2(MI,MII)B2 solid solutions can be modelled as a phase with three sublattices filled with Fe(Mn), Mo and B and described with a formula unit (:Fe,Mn:)0.2I(:Mo:)0.4II(:B:)0.4III, where the symbol “:” denotes sublattices, the subscript the stoichiometric coefficients, and superscript the number of the sublattice. Such a phase representation was used to model the disordered substitutional solid solutions within the VCA approach, in which the average weight of Fe and Mn pseudopotentials at a given composition was set to 2a site. To apply the CE approach to the Mo2(Fe,Mn)B2 solid solutions, the Fe or Mn was placed at 2a sites and supercells (clusters) with different Mn concentration were generated for energy analysis to determine effective cluster interactions (ECI) and ground state properties as implemented in the ATAT toolkit.19 The Monte Carlo simulation, combined with the semi-grand canonical potential of lattice models’ energetics resulting from the CE analysis as implemented in the Easy Monte Carlo code (emc2)28 integrated into the ATAT toolkit, was utilized to extrapolate composition-dependent configurational mixing thermodynamic quantities (free energy, enthalpy, and entropy) to non-zero temperatures (in the range from 1000 to 2000 K). This approach provided valuable data for constructing phase diagrams that reflect real conditions. The calculated excess properties were converted into a format suitable for thermodynamic assessment as suggested by Gautam Ghosh in ref. 19. Next, the thermodynamic parameters of the Mo2(Fe,Mn)B2 solid solutions were accessed via the PARROT module of the Thermo-Calc 2022 software.29
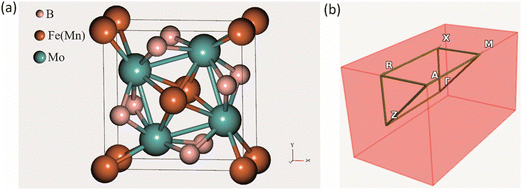 |
| | Fig. 1 Crystal structure of a tetragonal Mo2FeB2 and Mo2MnB2 unit cell (a) and corresponding BZ with high symmetry points (b). | |
2.2 Computational details
All DFT-based first-principles calculations for structure relaxation during VCA and CE analysis were carried out with Vienna Ab initio Simulation Package (VASP v. 6.1.1) plane wave ab initio code30 using general gradient approximation (GGA)31 with Perdew–Burke–Ernzerhof (PBE)32 exchange–correlation functional. For the integration over the first Brillouin zone (BZ) (Fig. 1(b)) the Monhorst–Pack33 meshing scheme of 1000 k-points per reciprocal atom (KPPRA), corresponding to the 4 × 4 × 8 special k-points sampling and ferromagnetic state for the Mo2MeB2 was set. During the self-consistent field (SCF) calculations and the cutoff energy for the plane-wave-basis set was 520 eV at the convergence criterion for the total energy of 10−7 eV. Molybdenum borides with different stoichiometries were chosen as reference phases for the adjustment of parameters during lattice stability calculations, using the following k-point meshes: 12 × 12 × 7 for MoB2, 8 × 8 × 1 for α-MoB, 8 × 3 × 8 for β-MoB, and 4 × 4 × 5 for Mo2B. For the relaxed structures of interest, the elastic constants and related properties were calculated by deriving the elastic constants from the strain–stress relationship34 with further post-processing calculation using the VASPKIT utility.35
To obtain the Vickers hardness (HV), which is one of the key mechanical properties for wear-resistant alloys, calculations were performed using different formalisms based on approximations using the elastic moduli values as proposed by Chen et al. (HChenV),13 Tian et al. (HTianV),36 Teter (HTeterV),37 Mazhnik and Oganov (HMachnikV),38 Miao et al. (HMiaoV).39 To validate the calculated data through experimental investigations, the approach proposed by Kabir et al.40 was used, which includes obtaining HV as an average value from those calculated with different models (eqn (1)–(5)):
| | | HChenV = 2[(G/B)2G]0.585 − 3 | (1) |
| | | HTianV = 0.92(G/B)1.137G0.708 | (2) |
| |  | (4) |
| |  | (5) |
where
B,
G, and
E are the bulk, shear, and Young's modulus, respectively, and
v is the Poisson's ratio.
The phonon calculations were performed using the PHONOPY code41 in combination with density-functional-perturbation theory (DFPT)42 calculations of the force-constants as implemented in VASP. For this purpose, 2 × 2 × 2 supercells with 80 atoms per cell were constructed from the optimized Mo2FeB2 and Mo2MnB2 structures. To obtain thermodynamic properties at constant pressure, the Quasi-Harmonic Approximation (QHA) approach was combined with DFPT and applied to the supercells with different volumes to obtain the Vinet43 equations of state (EOSs) at given temperature ranges. Using EOSs for volume minimization in the given temperature ranges, the Gibbs free energy and thermal properties at constant pressure were obtained.
To obtain accurate electronic properties, all-electron calculations were performed using the Amsterdam Modelling Suite (AMS) BAND44 module with the linear combination of atomic orbitals (LCAO) and the Slater-type basis functions with triple-ζ polarized orbital basis set (TZP). The regular k-point sampling grid of the first BZ was 5 × 5 × 9 and other settings were set according to the «good» numerical quality for spin-unrestricted calculations.
2.3 Experimental details
For the validation of the calculations results, the experimental alloys were prepared by arc-melting of the initial components in the form of powder mixtures drawn into low-carbon steel sheath to reproduce the compositions close to the typical Fe-based hardfacing alloys with nominal compositions Fe0.6975−xMnxMo0.135B0.134C0.0335.45 As initial components, powders of boron carbide with an angular particles morphology (Fig. 2(a)) (fraction F120, PJSC “Zaporozhabrasive”, Ukraine), Mo powder with a spherical (Fig. 2(b)) (PM grade, 1–5 μm, GrandLada Co., Ltd) and Mn powder (grade MN997 (GOST 6008-90), JSC “Nikopol Ferroalloy Plant”, Ukraine). The key alloys were investigated using X-ray diffraction (XRD) (Shimadzu XRD-7000, Japan) and further analyzed with Match! Software46 Microstructure investigations were performed using scanning electron microscopy (SEM) techniques (Zeiss EVO-40XVP, UK), including secondary electrons (SE) and backscattered electron diffraction (BSD). The microhardness measurements were performed using the Vickers method with an indentation load of 0.2 kg (PMT-3M hardness tester, LLC NPF “Standard-M”, Ukraine).
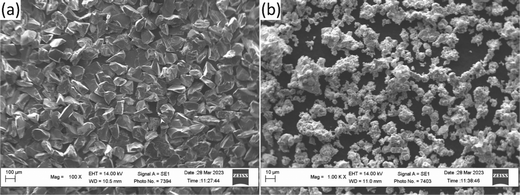 |
| | Fig. 2 The morphology of the initial boron carbide (a) and Mo (b) powders. | |
3. Results and discussions
3.1 Energy and Stability
Accurately predicting the formation energies from the DFT calculations of compounds such as Mo2FeB2 and Mo2MnB2 that involve bonding between metallic and non-metallic components of a phase requires corrections due to the systematic error caused by chemical bonding features.47 According to Stevanović et al.48 the corrected formation energy ΔHf(An1An2…) can be written as follows:| |  | (6) |
where An1 and An2 are the components of a phase, ΔHGGA+Uf(An1An2…) is the formation energy for the compound and components in their reference states calculated at the DFT-GGA level with the Hubbard U correction (3 eV for the transition metals), δμi is the correction term for the component i, and ni is the stoichiometric coefficient for that component. In a given case, to calculate the formation energies for Mo2FeB2 and Mo2MnB2, the correction terms δμi for Fe and Mn are equal to −0.03 and −0.15 eV, respectively,48 while the parameter δμMo has to be determined. In order to obtain value of δμMo, the formation energies of the four molybdenum borides with different structure and composition (Fig. 3) were calculated and fitted using least-square method with respect to the experimental values.27 The values of ΔHGGA+Uf of MoxBy computed using the GGA+U method show a similar concentration dependence to the experimental values. In both cases, the formation energies of α-MoB and β-MoB are the highest and are close to each other, while ΔHGGA+Uf for MoB2 and Mo2B is relatively higher (Fig. 4). After solving the least-squares problem with respect to δμMo according to eqn (6) the corresponding value was +0.237 eV. As a result of using the obtained correction term for Mo in molybdenum borides, the accuracy of the prediction of the energies of formation was significantly improved, since the calculated values for α-MoB, β-MoB and Mo2B represent experimental data within the chemical accuracy (4184 J mol−1). Considering the values for Fe and Mn from48 and the fitted value for Mo, the resulting formation energies for the Mo2FeB2 and Mo2MnB2 target phases were calculated according to eqn (6) as follows:| | ΔHf(Fe(Mo,B)2) = −47![[thin space (1/6-em)]](https://www.rsc.org/images/entities/char_2009.gif) 562 − 0.4 × 22 562 − 0.4 × 22![[thin space (1/6-em)]](https://www.rsc.org/images/entities/char_2009.gif) 905 + 0.2 × 14 905 + 0.2 × 14![[thin space (1/6-em)]](https://www.rsc.org/images/entities/char_2009.gif) 472 = −53 472 = −53![[thin space (1/6-em)]](https://www.rsc.org/images/entities/char_2009.gif) 830 J mole−1 830 J mole−1 | (7) |
| | ΔHf(Mn(Mo,B)2) = −36![[thin space (1/6-em)]](https://www.rsc.org/images/entities/char_2009.gif) 114 − 0.4 × 32 114 − 0.4 × 32![[thin space (1/6-em)]](https://www.rsc.org/images/entities/char_2009.gif) 468 + 0.2 × 2894 = −44 468 + 0.2 × 2894 = −44![[thin space (1/6-em)]](https://www.rsc.org/images/entities/char_2009.gif) 698 J mole−1. 698 J mole−1. | (8) |
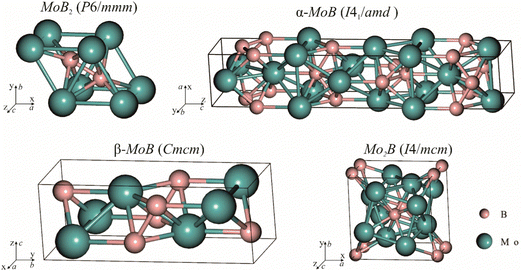 |
| | Fig. 3 Crystal structures of molybdenum borides selected for energy of formation calculations and fitting with experimental data. | |
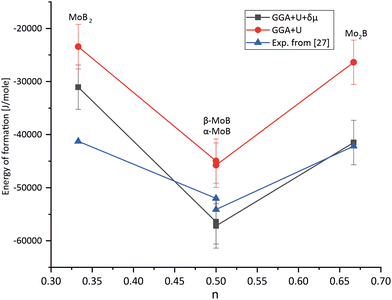 |
| | Fig. 4 Results of fitting the formation energies for the molybdenum borides with different stoichiometry using the δμMo correction term. | |
3.2 Electronic properties
To compare the electronic structure of Mo2FeB2 and Mo2MnB2, the total density of states (TDOS) and the partial density of states (pDOS) were performed (Fig. 5). Both compounds are metallic because there is no gap at the Fermi energy level (EF). This is due to the formation of peaks near the EF in the 0 to −2 eV range, which are mainly composed of d-states of the metal atoms. These d-states provide metallic bonding between Fe–Mo and Mn–Mo pairs. At the same time, the DOS on EF is relatively higher for Mo2MnB2, showing the higher metallic properties and electrical conductivity for this compound. In both cases, there are high DOS peaks below the EF, located between −2 and −7 eV and composed of p-states of boron and d-states of metal atoms, consistent with pd hybridization and formation of covalent bonds between Fe–B, Mn–B, and Mo–B pairs. At the lower level, corresponding to the energy of about −10 eV, there is a DOS peak resulting from the overlap of s and p-states, leading to the sp hybridization, typical for the covalent bonds between boron atoms. For both Mo2FeB2 and Mo2MnB2, peaks due to antibonding p-states of B and Mo in antiphase interaction have been observed above the Fermi energy (EF) in the energy range of 12 to 20 eV. These peaks are located near the Fermi level and are composed of conductivity-enhancing d-states of metal atoms.
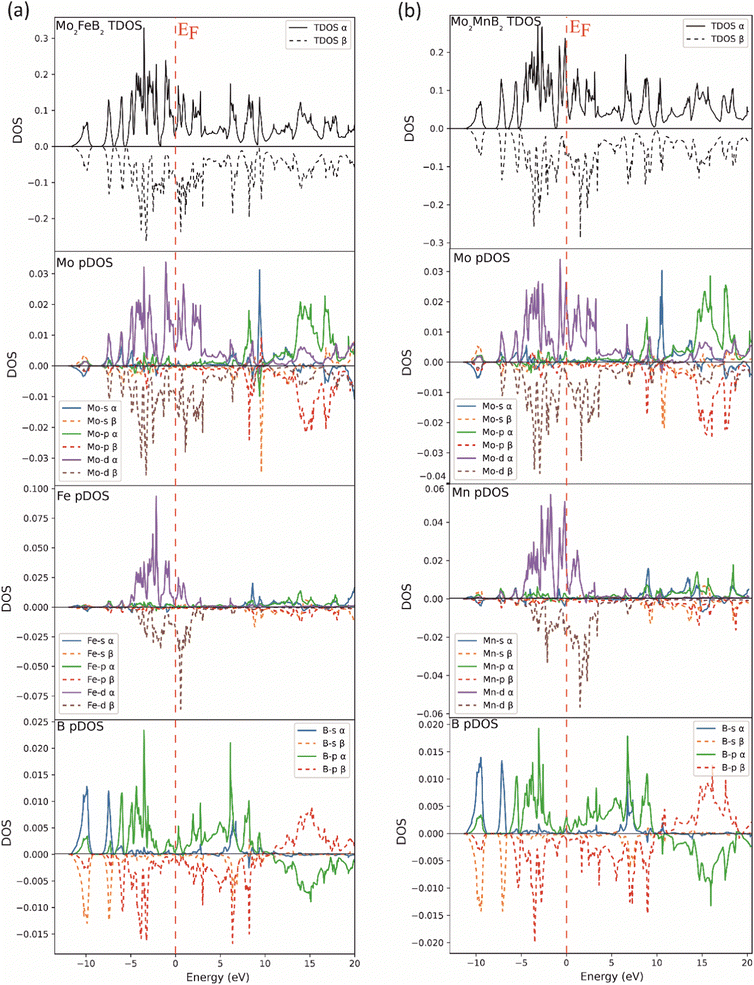 |
| | Fig. 5 Total and partial DOS of the Mo2FeB2 (a) and Mo2MnB2 (b) borides. | |
Further insight in the electronic properties of Mo2MnB2 and Mo2FeB2, their Fermi surfaces and band structures were calculated (Fig. 6). The calculated Fermi surface (FS) topologies show that both compounds have similar elongated FS along the ΓZ direction, indicating charge transport anisotropy in both cases. The minor topology differences related to the more closed shape of the FS for Mo2MnB2 compared to Mo2FeB2 may indicate that Mo2MnB2 exhibits stronger electron correlation effects and higher electrical conductivity.49 Analysis of the FS curvatures shows that in Mo2FeB2 the electron-like and hole-like conductivity coexist, while in the case of Mo2MnB2 the electron-like conductivity is more dominant.50 The calculated band structures of Mo2MnB2 and Mo2FeB2 show that in both cases the valence and conduction bands with dominant d-state character overlap at the Fermi level. At the energies below (from −2 eV to −7 eV) there are bands contributed by combinations of dominant p and d states and s and p states in the range −9 eV to −11 eV. The energy dispersion curves in the conduction band just above the Fermi level are contributed by the d states, and at the higher energies (3 eV to 20 eV) the dominant states are s and p with a slight contribution from d electrons. Based on the calculations of TDOS, pDOS, and band structure, it can be concluded that the ternary borides Mo2MnB2 and Mo2FeB2 exhibit homeopolar B–B bonding, heteropolar B–Mo, B–Fe or B–Mn covalent bonds and metallic bonding between Mo, Fe and Mn.
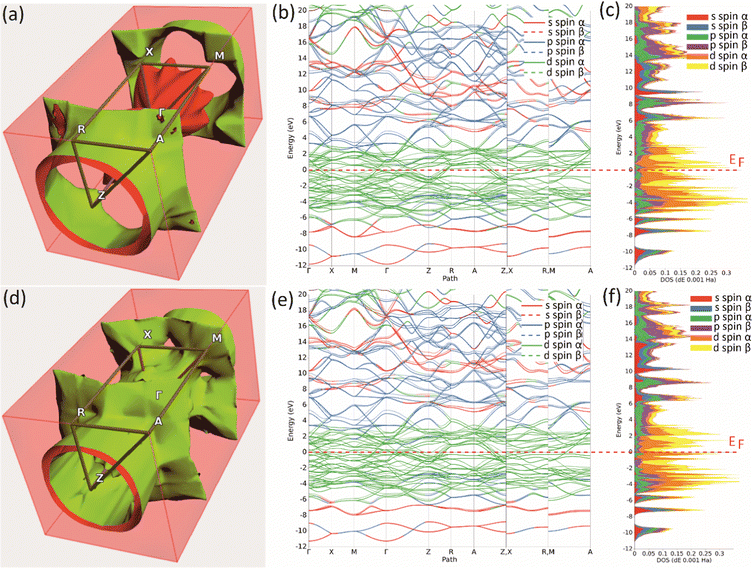 |
| | Fig. 6 The Fermi surfaces (a), (d), band structure (b), (e) and projected density of states (c), (f) of the Mo2FeB2 (a)–(c) and Mo2MnB2 (d)–(f) borides. | |
To study the interatomic bonding properties of Mo2MnB2 and Mo2FeB2 in more detail, the total electron density (ρ), the electron localization function (ELF), and the reduced density gradient (RDG) were mapped with contour plots along the (001) planes containing Fe or Mn and B atoms (Fig. 7). The mapped fields for both borides appear to be very similar, with the ρ maps showing increased charge density values between B–B and Fe(Mn)–B pairs, corresponding to relatively high ELF values. The highest ELF values of 0.6 to 0.7 (typical for the covalent bond) are between the nearest boron atoms and around the Fe cores, pointing towards the boron atoms. The charge density and ELF values are weaker in the directions between metal atoms, with typical values ranging from 0.2 to 0.3, consistent with metallic bonding. The RDG parameter is informative in the presence of covalent bonds as it indicates regions of high electron cloud stability with low RDG values. In the case of Mo2MnB2 and Mo2FeB2, it was found that the regions with the lowest RDG values are located between pairs of B–B, Fe(Mn)–B, and Fe(Mn)–Fe(Mn), corresponding to all types of bonding identified by the analysis of pDOS and band structure.
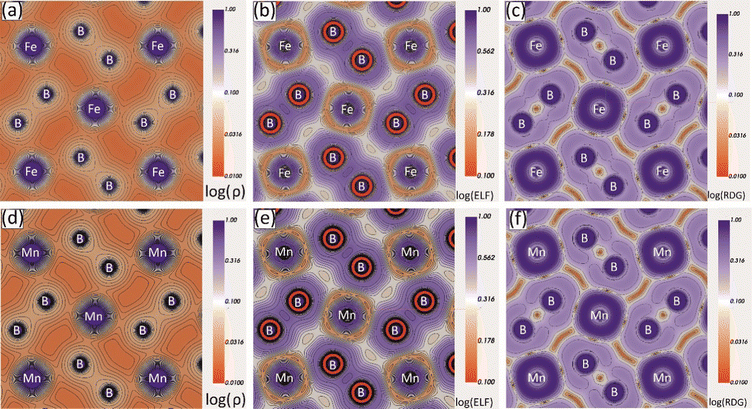 |
| | Fig. 7 Charge density (ρ), electron localization function (ELF) and reduced density gradient (RDG) contour maps along the (001) plane for the Mo2FeB2 (a)–(c) and Mo2MnB2 (d)–(f) borides. | |
3.3 Thermodynamic properties
To evaluate the vibrational properties for the Mo2FeB2, Mo2MnB2 compounds and hypothetical solid solution Mo2Fe0.5Mn0.5B2, phonon calculations were performed. The phonon dispersion curves (ωqj) were calculated for along the high symmetry points G → X → M → G → Z → R → A → Z → X → R → M → A path (Fig. 8(a), (c) and (e)). No imaginary phonon frequencies were present in all cases, indicating that pure ternary borides and Mo2Fe0.5Mn0.5B2 solid solution are dynamically stable structures. This result agrees with the previously calculated lattice stability values. The phonon spectra in all cases consist of three branches assigned to the acoustic spectra and the rest to the optical. A comparison of the partial density of phonon states (pPHDOS) (Fig. 8(b), (d) and (f)) between investigated structure shows that the segments contributed mainly by metallic atoms are very similar. However, the segments contributed by boron are wider and have higher frequencies indicating higher interatomic bonding strength.
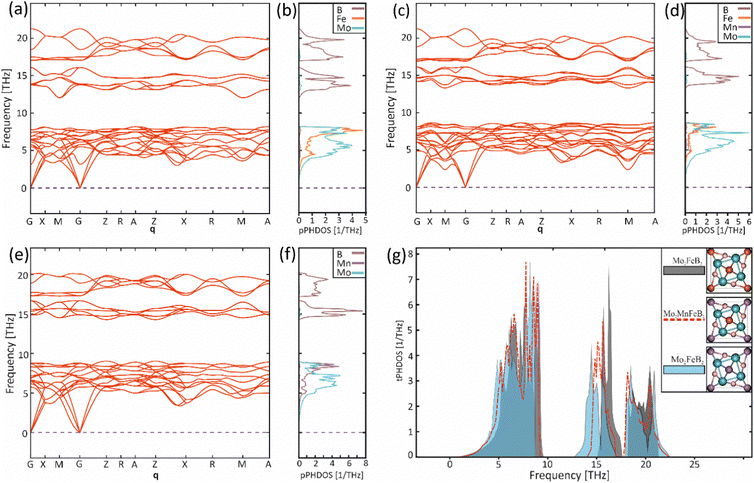 |
| | Fig. 8 Phonon dispersion curves (a), (c), (e) along with the partial phonon density of states (b), (d), (f) for the Mo2FeB2 (a), (b), Mo2Fe0.5Mn0.5B2 (c), (d), Mo2MnB2 (e), (f) and the corresponding total phonon densities of states (g). | |
The phonon dispersion curves for all structures exhibit the highest frequencies (22 THz for Mo2FeB2 (Mo2Fe0.5Mn0.5B2) and 20 THz for Mo2MnB2) between the G and Z symmetry points. Both materials have two intervals where no vibrations occur and as a result, the vibrational spectra can be divided into a low-frequency segment, mainly contributed by partial spectra of Mo with Fe and/or Mn, and a high-frequency segment dominated by B spectra. Based on the relationship between frequencies, force constants, and interatomic bond strength, the low-frequency segment can be attributed to weak metallic bonding, while the high-frequency segments correspond to strong covalent bonds of B–B and B-metal pairs. When comparing Mo2FeB2 and Mo2MnB2, the pPHDOS for segments mostly contributed by metal atoms are similar. However, Mo2FeB2 shows broader ranges with higher frequencies in segments primarily contributed by boron, indicating stronger interatomic bonding. In Mo2Fe0.5Mn0.5B2, the pPHDOS of Fe and Mn remain similar in shape to those in the end members, while the pPHDOS of B and Mo exhibit a tendency to overlap. The analysis of the total densities of phonon states (tPHDOS) (Fig. 8(g)) shows that the tPHDOS of Mo2Fe0.5Mn0.5B2, resulting from the overlapping tPHDOSs of the end members, exhibits values close to averaged. This causes the formation of more uniform peak shapes in a broad high-frequency region corresponding to the covalent bonding, which may have a positive effect on the elastic constants values for solid solutions.
In order to obtain the thermodynamic properties of Mo2FeB2 and Mo2MnB2 at constant pressure for the purpose of analysis within the CALPHAD approach, phonon spectra and energies were calculated for 2 × 2 × 2 supercells. The volumes of these supercells were varied in steps of 2% by creating 5 supercells each in the decreasing and increasing directions relative to the equilibrium volume. Using the Phonopy code, temperature-dependent constant-volume thermodynamic properties and equations of state through the quasi-harmonic approximation (QHA) were derived (Fig. 9(a) and (b)) and the temperature-dependent values for the Gruneisen parameter (γ) (Fig. 9(c)), Gibbs energy (G) (Fig. 9(c)), bulk modulus (BT) (Fig. 9(d)), thermal expansion coefficient (α) (Fig. 9(e)), and specific heat capacity at constant pressure (Cp) (Fig. 9(f)) were determined. Upon analysis of the obtained data, it was revealed that Mo2FeB2 exhibits a higher bulk modulus compared to Mo2MnB2, with a difference of approximately 20 GPa, while Mo2FeB2 demonstrates a lower coefficient of thermal expansion (α) within the studied temperature range of 0 to 2000 K. However, the specific heat capacity values were found to be very similar for both compounds, which can be attributed to their similar electronic properties and chemical bonding nature (Fig. 7).
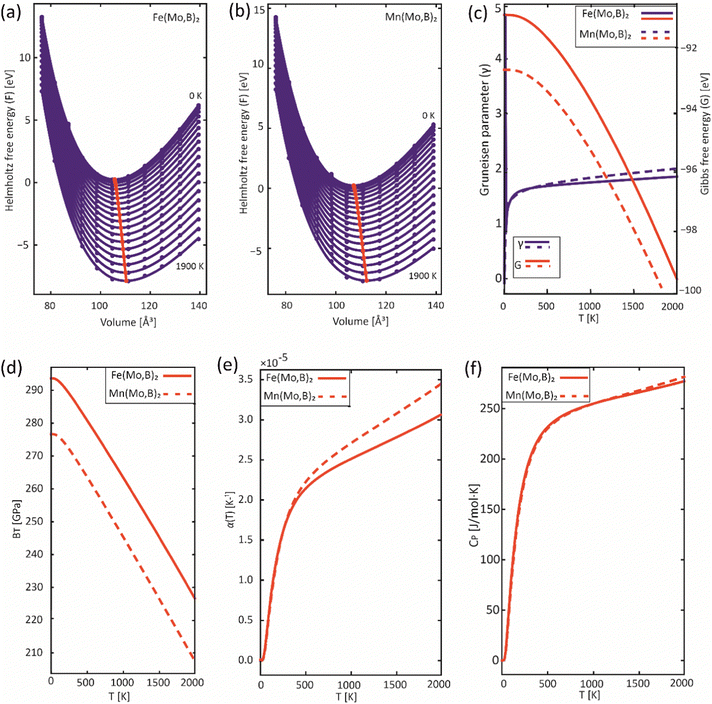 |
| | Fig. 9 Results of the QHA fitting of the EOSs (a), (b) and the resulting temperature dependencies of the Gruneisen parameter and Gibbs energy (c), bulk modulus (d), thermal expansion (e) and heat capacity (f). | |
To obtain the necessary thermodynamic data for thermodynamic assessment, such as entropy, we performed numerical differentiation of the Gibbs energy values with respect to the temperature. According to the SGTE (Scientific Group Thermodata Europe) notation. The temperature dependence for the molar Gibbs energy of Mo2MB2 compounds (where M = Fe or Mn) can be represented by the following equation, assuming a CEF model with three sublattices filled with M, Mo, and B:
| |  | (9) |
where
a,
b and
c are the model coefficients to be fitted and
GSER is the Gibbs energy of the pure elements, referred to the enthalpy for its stable state at 298.15 K. After fitting the results obtained by the QHA approach and the formation energies using the PARROT module the result representations of the Gibbs energies of Mo
2FeB
2 and Mo
2MnB
2 were as follows:
| |  | (10) |
| |  | (11) |
Comparing the calculated data with those obtained from experimental alloys in ref. 22 and from the TCFE12 Thermo-Calc database (Fig. 10), it can be concluded that the Gibbs energy values agree well with both references. Therefore, it is expected that the free energy values for Mo2MnB2 obtained by the same methodology would accurately reflect experimental data.
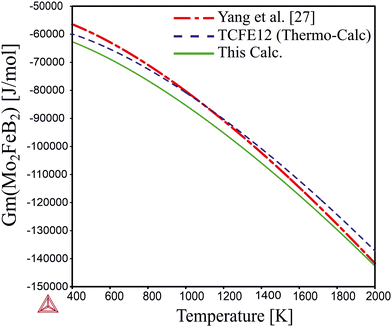 |
| | Fig. 10 Temperature dependence of the Gibbs energy calculated using optimized parameters and parameters given in TCFE12 thermodynamic database and the work.27 | |
The formation energy of Mo2(Fe,Mn)B2 solid solutions was determined by assuming that Mn atoms replace Fe atoms in the sublattice of Mo2FeB2. This assumption was based on the similarities in crystal structures, electronic, and phonon properties of the end-member ternary borides. Previous studies on coatings based on Mo2FeB2 have also suggested that Mn has a significant influence on the size, shape, and mechanical properties of boride phase grains. The hypothetical solid solution can be represented by the generalized CEF formula (:Fe,Mn:)0.2I(:Mo:)0.4II(:B:)0.4III, and its analysis was carried out using the CE method with the ATAT code.26
For the analysis, 121 clusters generated by the MIT Ab initio phase stability (MAPS) code51 were used to simulate different configurations of disordered solid solutions with varying Fe and Mn ratios. Energy calculations were performed for a ferromagnetic state, which was initially set by the spin polarization of electrons. Analysis of the calculated energies (Fig. 11) shows that certain structures with low Mn content exhibit positive mixing energy values, indicating their instability under the given conditions (0 K). In contrast, the most stable configurations are characterized by high concentrations of dissolved Mn (above 50 at%). The data approximation using parameters describing effective cluster interactions (ECI) demonstrates sufficient accuracy to extrapolate the data to practically significant temperature ranges.
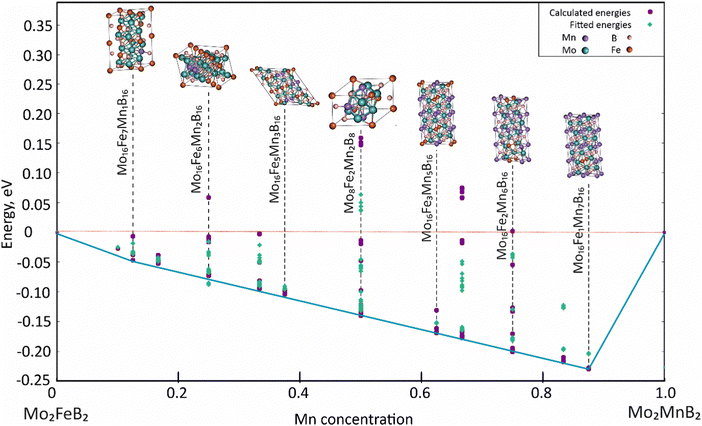 |
| | Fig. 11 Concentration dependence of pseudo-binary mixing energy for Mo2(Fe1−xMnx)B2 solid solutions calculated using CE with ATAT and VASP. | |
Using the Monte Carlo simulations of lattice models as implemented in emc2 code at the constant temperatures of 1200, 1400, 1600, 1800 and 2000 K the concentration dependencies of the Gibbs energy of mixing were evaluated (Fig. 12). Next, considering the description of excess Gibbs energy in the form of (eqn (12)) with the representation of the interaction parameter L = V1 + V2 × T as temperature dependent with two optimizing variables (V) and performing optimization procedure with PARROT module the resulting interaction parameter can be described by (eqn (13)). The negative values of optimized variables V1 and V2 indicate high negative value of excess energy of mixing, which increase while temperature increases.
| |  | (12) |
| |  | (13) |
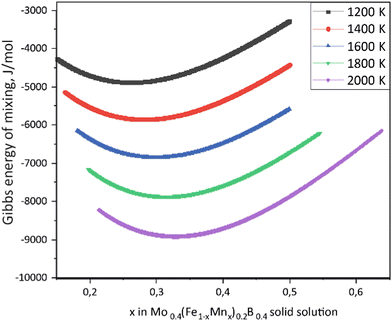 |
| | Fig. 12 Concentration dependencies of the Gibbs energy of mixing for Mo0.4(Fe1−xMnx)0.2B0.4 solid solutions calculated using the emc2 code with ATAT for different temperatures. | |
To validate the obtained thermodynamic parameters described by eqn (10), (11) and (13), they were integrated with thermodynamic parameters from,52,53 and others.54 These parameters cover the entire Fe–Mn–Mo–B–C system within typical ranges for Fe-based hardfacing alloys and were compiled into a TDB file. The resulting CALPHAD calculations allow for the construction of an isopleth illustrating the effect of Mn on the phase composition of the Fe0.6975−xMnxMo0.135B0.134C0.0335 alloys (Fig. 13(a)). As is shown in the figure, increasing the Mn content in the alloys up to 1.2 at% leads to a slight (40 K) increase in the melting temperature. However, within the concentration range of 1.2 to 40 at%, a nearly linear decrease (ranging from ∼1975 to ∼1675 K) in the liquidus temperature is observed. Meanwhile, the primary crystallization temperature interval remains practically unchanged at around 350 K and is represented by a two-phase region: liquid (L) + Mo2(Fe,Mn)B2, which is adjacent to a three-phase region: L + Mo2FeB2 + austenite (γ-Fe(Mn)), indicating eutectic formation. Below the solidus line, three regions are identified where γ-Fe(Mn) coexists with boride phases. Among these regions, the wide two-phase region: γ-Fe(Mn) + Mo2FeB2 is particularly important from a practical standpoint and exists within the concentration range up to approximately 32 at%. Regions involving the primary crystallization of Fe2B and Mn2B are undesirable due to the high brittleness of such borides. Therefore, an optimal concentration is approximately 13.4 at % Mn. Below the temperature of ∼1000 K, γ-Fe(Mn) and α-Fe coexist with cementite (Fe3C) and metastable carbide phases of MxCy type. The solidification process of the Mn-free alloy (A1) (Fig. 13(b)) comprises three significant stages: primary crystallization of Mo2FeB2, formation of the eutectic (γ-Fe + Mo2FeB2) and subsequent γ-Fe → α-Fe transformation. The microstructural analysis of the corresponding alloy (Fig. 13(d)) reveals primary Mo2FeB2 as uniformly distributed grains with a cuboidal shape, which corresponds to the tetragonal structure of this phase. In addition, a rod-like eutectic (α-Fe + Mo2FeB2) and wide regions of α-Fe are observed, showing agreement with the predictions derived from thermodynamic calculations. The solidification behavior of the Mn-enriched alloy (A2) (Fig. 13(c)) is similar up to ∼1200 K but exhibits a broader temperature range for the existence of γ-Fe(Mn) due to its stabilization by the effect of Mn, as commonly observed in austenitic high-Mn (Hadfield) steels.55 The microstructural investigations (Fig. 13(e)) accurately reproduce the calculated phase composition, revealing Mo2(Fe,Mn)B2 grains with a faceted angular shape and a lamellar eutectic structure (γ-Fe(Mn) + Mo2(Fe,Mn)B2). Consequently, the presence of Mn significantly impacts the phase morphology, leading to more pronounced symmetric branching of the boride crystals. This phenomenon can be attributed to the preferential arrangement of Mn along specific crystallographic planes within the Mo2(Fe,Mn)B2 solid solution, which results in a reduction in its surface energy and promotes growth in the appropriate directions. The XRD results show that alloy A1 consists of α-Fe and Mo2FeB2 (Fig. 13(d)), with lattice parameters a = 5.807 Å and c = 3.142 Å, which are close to those of the pure compound,24 while alloy A2 consists of γ-Fe and Mo2FeB2 (Fig. 13(e)), with changed lattice parameters (a = 3.783 Å and c = 3.152 Å), indicating the partial substitution of the Fe by Mn. The presence of γ-Fe at room temperature in alloy A2 suggests that the diffusion processes responsible for the formation of α-Fe cementite and other metastable carbide phases are inhibited below ∼1150 K. As a result, the phase composition at room temperature is identical to that calculated within the temperature range of 1150–1325 K. To investigate the equilibrium Mn contents in the key phases (γ-Fe and Mo2(Fe,Mn)B2), concentration mapping was performed within the high-temperature regions (Fig. 14). According to the calculation results, the equilibrium concentration of Mn in Mo2FeB2 is approximately 5 wt%, corresponding to a solid solution with the formula unit Mo2(Fe0.75Mn0.25)B2. The Mn concentration in γ-Fe is around 18 wt%, which is a typical content for impact-resistant TWIP steels.5 The lattice parameters of the relaxed Mo2(Fe0.75Mn0.25)B2 solid solution models, calculated using VCA (a = 5.7712 Å and c = 3.1517 Å) and for the cluster with the lowest energy determined by CE (a = 5.7707 Å and c = 3.1563 Å), are in good agreement with those obtained experimentally by XRD. Elemental EDS mapping (Fig. 15) for the alloy A2 reveals that Mo and B are primarily concentrated in regions corresponding to the Mo2(Fe0.75Mn0.25)B2 phase, while Fe is generally found in the intergranular space corresponding to the eutectic. Mn is evenly redistributed between the eutectic and boride phases, indicating its solubility in both the metal and ceramic boride phases. The local EDS analysis in the central regions of the boride grains shows the presence of Mn in amounts of approximately 3–5 wt%. The primary locations of carbon are the pores and other insignificant microstructural defects.
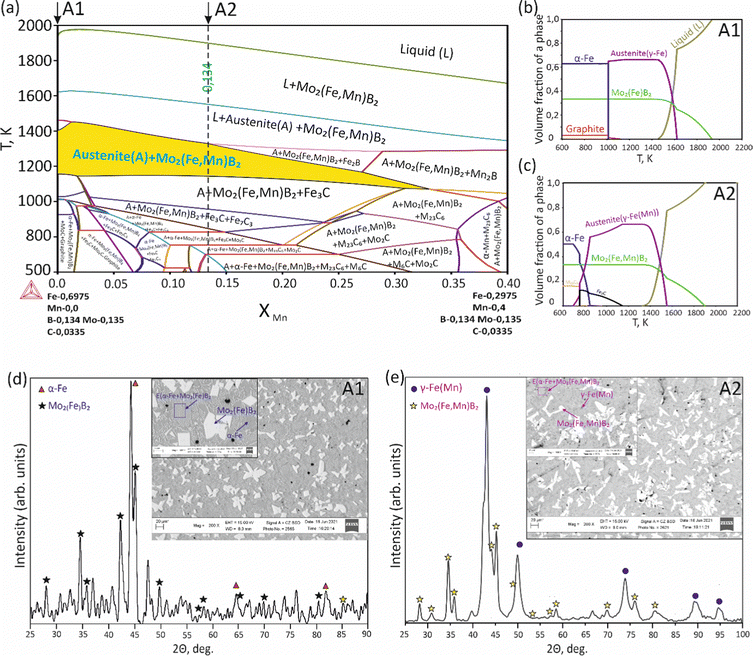 |
| | Fig. 13 Isopleth section of the Fe–Mn–Mo–B–C system corresponding to the Fe0.6975−xMnxMo0.135B0.134C0.0335 alloys (a), solidification paths of Fe0.6975Mo0.135B0.134C0.0335 (A1) (b) and Fe0.5635Mn0.134Mo0.135B0.134C0.0335 (c) and XRD and SEM results for the A1 (d) and A2 (e) alloys. | |
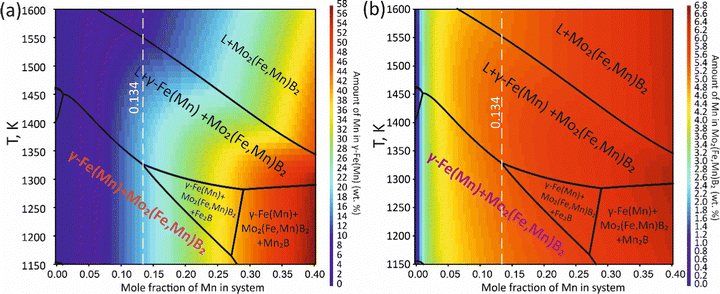 |
| | Fig. 14 Mapping of the calculated equilibrium Mn concentration in the γ-Fe(Mn) (a) and Mo2(Fe,Mn)B2 phases (b). | |
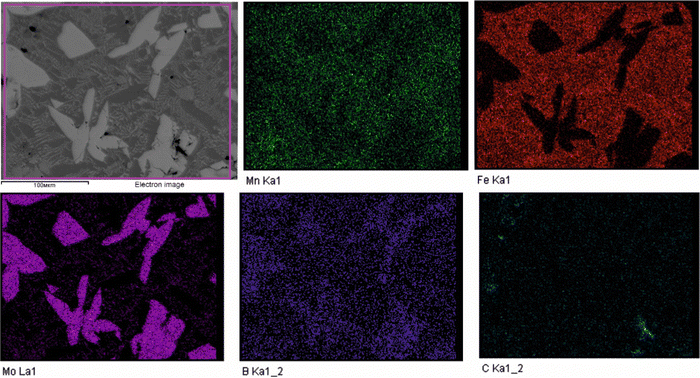 |
| | Fig. 15 EDS elemental maps of the experimental alloy A2 showing distribution of the Mn, Fe, Mo, B and C. | |
3.4 Mechanical properties
To evaluate the mechanical properties of the hypothetical Mo2(Fe1−xMnx)B2 solid solutions resulting from CE analysis, calculations were performed for the most stable clusters with an increasing step of x = 0.125 (Fig. 11) using the finite differences approach as implemented in VASP to determine the elastic tensor. Additionally, the elastic tensors for the corresponding virtual crystal approximation (VCA) models were computed, assuming averaged Mn and Fe pseudopotentials with different weights in the Fe site of Mo2FeB2. The derived elastic moduli, namely B, G, and E, were then compared between the CE and VCA models (Fig. 16(a)). The results demonstrate sufficient agreement between the two techniques, showing a consistent trend of increasing moduli with increasing Mn content up to 50–75%, followed by a subsequent decrease. Considering that the VCA approach21 is suitable for modeling disordered alloys with similar structural and electronic properties and small deviations from Vegard's law, the agreement between CE and VCA results indicates the existence of stable substitutional solid solutions in the Mo2FeB2–Mo2MnB2 system. Furthermore, all analyzed structures, including clusters and VCA models, meet the mechanical stability criteria derived from elastic constants according to ref. 56. Next, the Mn concentration-dependent HV values were calculated for the Mo2(Fe1−xMnx)B2 solid solutions using different formalisms represented by eqn (1)–(5) (Fig. 16(b)). As can be seen from the figure, the HV values calculated for the clusters generated by CE are close to those modeled by VCA. The main differences observed between HV calculated using different models are that HTeterV and HMiaoV exhibit the highest values in the range of 26–32 GPa, while the values of HChenV, HTianV, and HMazhnikV are close to each other and are in a range of 17 – 22 GPa. It is worth noting that all calculated HV values, except for HMazhnikV, show similar trends of increasing as the Mn content increases in the range of x = 0 to x = 0.75, with a further decrease at x > 0.75. The averaged HV values (Fig. 16(c)) show small differences with respect to the method (CE or VCA) used for the solid solutions models, and the calculated values are in good agreement with the results of the performed experimental measurements for the key alloys (x = 0 and x = 0.25), experimental data from,11 and also closely match the calculated data from11,12,15 when considering mean values of HV.
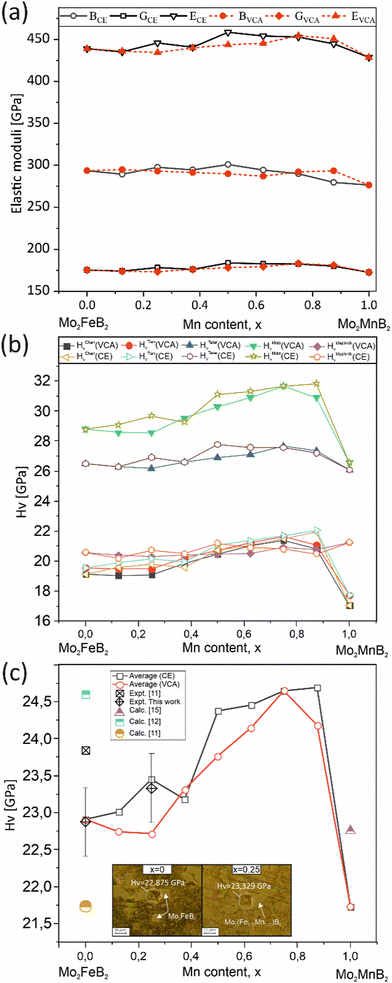 |
| | Fig. 16 Mechanical properties of the most stable structures obtained using CE, along with the corresponding structures calculated using the VCA: elastic moduli (a), HV calculated using different formalisms (eqn (1)–(5) (b), and the averaged HV value compared to measured values and data from ref. 11, 12 and15 (c). | |
The significant correlation effects between mechanical properties and the TDOS peak values, corresponding to the energy ranges associated with different types of chemical bonding, were observed for the solid solutions modeled using the VCA approach in ref. 57,58. To reveal such effects in the Mo2(Fe1−xMnx)B2 solid solutions, the TDOSs for different Mn contents were calculated using the VCA approach (Fig. 17) and analyzed for the energy ranges corresponding to different bonding types (Fig. 5). This analysis was performed to include contributions resulting from pd hybridization for the Fe(Mn)–B (R1, Fig. 17) and Mo–B (R2, Fig. 17) pairs, as well as sp hybridization for B–B pairs (R3, Fig. 17), by mapping TDOS values as dependent on Mn content and energy range. The tendency of the TDOS values to change in relation to the calculated HV values with increasing Mn content was observed for all energy ranges, especially for the energy range corresponding to the Mo–B bonding. In this range, the TDOS values exhibited an increase up to x = 0.75 and then decreased, similar to the observed behavior in the calculated HV values.
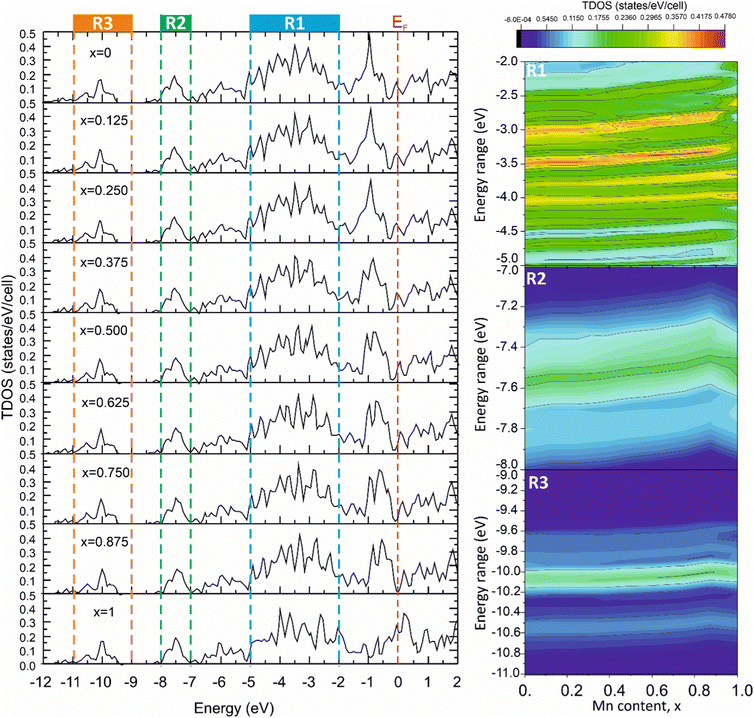 |
| | Fig. 17 The total DOS of the Mo2(Fe1−xMnx)B2 solid solutions calculated using VCA approach for different Mn contents (x). | |
4. Conclusions
This study reports a DFT investigation of the thermodynamic, electronic, vibrational, and mechanical properties of the ternary borides Mo2FeB2 and Mo2MnB2, as well as the thermodynamic and mechanical properties of the Mo2(Fe,Mn)B2 solid solutions. The formation energies of Mo2FeB2 and Mo2MnB2, determined using correction terms based on fitting of the experimental and DFT formation energies for typical molybdenum borides with varying stoichiometry, demonstrate the significant stability of these compounds over a wide temperature range. Phonon calculations were performed to assess the vibrational properties, confirming the absence of imaginary frequencies in both compounds. Furthermore, analysis of the elastic tensors revealed that the relationships between their components satisfied the structure-dependent criteria for mechanical stability, suggesting that both Mo2FeB2 and Mo2MnB2 are stable compounds. A noticeable difference between Mo2FeB2 and Mo2MnB2 was observed in their electronic structure, with Mo2MnB2 exhibiting slightly stronger metallic characteristics and a predominant electron-like conductivity. This finding is supported by the comparative analysis of the DOS and the topology of the Fermi surfaces.
Through the systematic examination of energy levels in clusters representing different configurations of disordered Mo2(Fe1−xMnx)B2 solid solutions using the CE method, it was possible to assess the concentration-dependent excess enthalpy of mixing. Subsequently, these results were extrapolated to cover a temperature range from 0 to 2000 K, allowing optimization of thermodynamic parameters. The resulting temperature–dependent interaction parameter, denoted as L(Mo2MeB2,Fe,Mn:Mo:B;0) according to CALPHAD notation, showed negative values, indicating a favorable tendency for the formation of Mo2(Fe,Mn)B2 solid solutions in Fe-based alloying systems. The evaluation of mechanical properties using both the CE and VCA approaches revealed the positive influence of Mn on the G-modulus and HV, which are key factors contributing to enhanced resistance against abrasive wear by micro-cutting. The calculated mechanical properties indicated that the most favorable solid solutions within the Mo2FeB2–Mo2MnB2 system, were found in the compositional range of Mo2(Fe0.75Mn0.25)B2 to Mo2(Fe0.25Mn0.75)B2. The results of thermodynamic modeling of the alloy system corresponding to the high-manganese steel alloyed with equimolar amounts of Mo and B show that a stable phase within a concentration range sufficient for alloy development is close to Mo2(Fe0.75Mn0.25)B2 solid solution. These findings are consistent with the experimental observations obtained using SEM, XRD, and EDS techniques for the corresponding alloy. Earth-abundant metal ternary borides solid solutions have the potential to be developed into advanced wear-resistant materials that could help reduce the reliance on tungsten-based materials.
Author contributions
Pavlo Prysyazhnyuk: conceptualization, data curation, formal analysis, methodology, software, validation, visualization, writing – original draft. Devis Di Tommaso: methodology, project administration, resources, software, supervision, writing – review & editing.
Conflicts of interest
There are no conflicts to declare.
Acknowledgements
This research utilized Queen Mary's Apocrita HPC facility, supported by QMUL Research-IT. https://doi.org/10.5281/zenodo.438045. We acknowledge the assistance of the Research Software Engineering team in ITS Research at Queen Mary University of London and we extend our sincere appreciation to Tom Bradford for his exceptional support and expert guidance. The authors would like to express their gratitude to Thermo-Calc Software AB for their generous support and provision of high-quality software and special thanks are extended to Therese Gustafsson for her valuable consultations. The authors thank the SCM (Software for Chemistry and Materials) team for their support and provision of a relevant set of high-quality software tools for this study. Special appreciation is extended to Mrs. Sorana Burcusel for her valuable technical assistance in maintaining the modules of the Amsterdam Modeling Suite (AMS). The first author acknowledges the Ministry of Science and Education of Ukraine for support (project “The development of materials for depositing impact- and wear-resistant coatings in a high-manganese steel – refractory compounds system through electric arc hardfacing” for 2023–2025, state reg. no. 0123U101858) and the Armed Forces of Ukraine for providing the necessary security measures to carry out this work.
References
- L. Tang, P. Wang, Z. Ma, S. Pauliuk, W.-Q. Chen, T. Dai and Z. Lin, J. Ind. Ecol., 2023, 27, 323–335 CrossRef.
- M. Bembenek, P. Prysyazhnyuk, T. Shihab, R. Machnik, O. Ivanov and L. Ropyak, Materials, 2022, 15 Search PubMed.
- Y. Shen, W. Xie, B. Sun, Y. Liu, Y. Li, Z. Cao, Y. Jian and Z. Huang, Materials, 2022, 15, 6729 CrossRef CAS PubMed.
- H. Xu, J. Sun, J. Jin, J. Song and C. Wang, Materials, 2020, 14, 46 CrossRef PubMed.
- A. Saeed-Akbari, L. Mosecker, A. Schwedt and W. Bleck, Metall. Mater. Trans. A, 2011, 43, 1688–1704 CrossRef.
- P. Xuming, Z. Yong, W. Shaogang and W. Qiuhong, Int. J. Refract. Met. Hard Mater., 2009, 27, 777–780 CrossRef.
- H. Yu, Y. Zheng, W. Liu, J. Zheng and W. Xiong, Int. J. Refract. Met. Hard Mater., 2010, 28, 286–290 CrossRef CAS.
- F. Yang, Y. Wu, J. Han and J. Meng, J. Alloys Compd., 2016, 665, 373–380 CrossRef CAS.
- B. Wang, Y. Liu, J.-W. Ye and J. Wang, Comput. Mater. Sci., 2013, 70, 133–139 CrossRef CAS.
- B. Wang, B. Ma, W. Song, Z. Fu and Z. Lu, R. Soc. Open Sci., 2018, 5, 172247 CrossRef PubMed.
- Z. Shi, H. Yin, Z. Xu, T. Zhang, G. Yang, Q. Zheng, R. S. Rao, J. Yang, F. Gao, M. Wu and others, Intermetallics, 2019, 114, 106573 CrossRef CAS.
- T. He, Y. Jiang, R. Zhou and J. Feng, J. Appl. Phys., 2015, 118, 075902 CrossRef.
- X.-Q. Chen, H. Niu, D. Li and Y. Li, Intermetallics, 2011, 19, 1275–1281 CrossRef CAS.
- V. S. Telegus and Y. B. Kuz’ma, Sov. Powder Metall. Met. Ceram., 1971, 10, 52–56 CrossRef.
- G. Yang, H. Yin, Z. Xu, T. Zhang, J. Yang, F. Gao, Q. Zheng and X. Qu, J. Alloys Compd., 2019, 791, 761–772 CrossRef CAS.
- Y. H. Lin, C. C. Tong, Y. Pan, W. Y. Liu and A. Singh, Mod. Phys. Lett. B, 2017, 31, 1750138 CrossRef CAS.
- A. Zunger, S.-H. Wei, L. G. Ferreira and J. E. Bernard, Phys. Rev. Lett., 1990, 65, 353–356 CrossRef CAS PubMed.
- A. van de Walle, R. Sun, Q.-J. Hong and S. Kadkhodaei, Calphad, 2017, 58, 70 CrossRef CAS.
- A. van de Walle, M. D. Asta and G. Ceder, Calphad, 2002, 26, 539–553 CrossRef CAS.
- A. van de Walle, P. Tiwary, M. de Jong, D. L. Olmsted, M. Asta, A. Dick, D. Shin, Y. Wang, L.-Q. Chen and Z.-K. Liu, Calphad, 2013, 42, 13–18 CrossRef CAS.
- L. Bellaiche and D. Vanderbilt, Phys. Rev. B: Condens. Matter Mater. Phys., 2000, 61, 7877–7882 CrossRef CAS.
- L. Vegard, Z. Phys., 1921, 5, 17–26 CrossRef CAS.
- M. Hillert, J. Alloys Compd., 2001, 320, 161–176 CrossRef CAS.
- M. Lukachuk and R. Pöttgen, Z. Kristallogr. – Cryst. Mater., 2003, 218, 767–787 CrossRef CAS.
- W. Rieger, H. Nowotny and F. Benesovsky, Monatsh. Chem., 1964, 95, 1502–1503 CrossRef CAS.
- V. Telegus, Khim. Khim. Tekhnol., 1970, 1, 96–100 Search PubMed.
- X. O. Yang, F. Yin, J. Hu, M. Zhao and Y. Liu, Calphad, 2017, 59, 189–198 CrossRef.
- A. Van De Walle and M. Asta, Modell. Simul. Mater. Sci. Eng., 2002, 10, 521 CrossRef CAS.
- J.-O. Andersson, T. Helander, L. Höglund, P. Shi and B. Sundman, Calphad, 2002, 26, 273–312 CrossRef CAS.
-
J. Hafner and G. Kresse, Properties of Complex Inorganic Solids, Springer, US, 1997, pp.69–82 Search PubMed.
- J. P. Perdew, J. Chevary, S. Vosko, K. A. Jackson, M. R. Pederson, D. Singh and C. Fiolhais, Phys. Rev. B: Condens. Matter Mater. Phys., 1993, 48, 4978 CrossRef CAS PubMed.
- J. P. Perdew, K. Burke and M. Ernzerhof, Phys. Rev. Lett., 1996, 77, 3865–3868 CrossRef CAS PubMed.
- H. J. Monkhorst and J. D. Pack, Phys. Rev. B: Solid State, 1976, 13, 5188 CrossRef.
- Y. Le Page and P. Saxe, Phys. Rev. B: Condens. Matter Mater. Phys., 2002, 65, 104104 CrossRef.
- V. Wang, N. Xu, J.-C. Liu, G. Tang and W.-T. Geng, Comput. Phys. Commun., 2021, 267, 108033 CrossRef CAS.
- Y. Tian, B. Xu and Z. Zhao, Int. J. Refract. Met. Hard Mater., 2012, 33, 93–106 CrossRef CAS.
- D. M. Teter, MRS Bull., 1998, 23, 22–27 CrossRef CAS.
- E. Mazhnik and A. R. Oganov, J. Appl. Phys., 2019, 126, 125109 CrossRef.
- N. Miao, B. Sa, J. Zhou and Z. Sun, Comput. Mater. Sci., 2011, 50, 1559–1566 CrossRef CAS.
- M. Kabir, M. Hossain, M. Ali, M. Uddin, M. Ali, M. Hasan, A. A. Islam and S. Naqib, Results Phys., 2023, 106701 CrossRef.
- A. Togo and I. Tanaka, Scr. Mater., 2015, 108, 1–5 CrossRef CAS.
- P. Giannozzi, S. de Gironcoli, P. Pavone and S. Baroni, Phys. Rev. B: Condens. Matter Mater. Phys., 1991, 43, 7231–7242 CrossRef CAS PubMed.
- P. Vinet, J. H. Rose, J. Ferrante and J. R. Smith, J. Phys.: Condens. Matter, 1989, 1, 1941–1963 CrossRef CAS.
- G. te Velde and E. J. Baerends, Phys. Rev. B: Condens. Matter Mater. Phys., 1991, 44, 7888–7903 CrossRef CAS PubMed.
- P. Prysyazhnyuk, L. Shlapak, O. Ivanov, S. Korniy, L. Lutsak, M. Burda, I. Hnatenko and V. Yurkiv, East.-Eur. J. Enterp. Technol., 2020, 4, 46–51 Search PubMed.
-
H. Putz and K. Brandenburg, Match! Crystal Impact, Kreuzherrenstr. 102, 53227 Bonn, Germany.
- G. G. C. Peterson and J. Brgoch, J. Phys. Energy, 2021, 3, 022002 CrossRef CAS.
- V. Stevanović, S. Lany, X. Zhang and A. Zunger, Phys. Rev. B: Condens. Matter Mater. Phys., 2012, 85, 115104 CrossRef.
- E. Viswanathan, M. Sundareswari, D. S. Jayalakshmi and M. Manjula, Comput. Mater. Sci., 2019, 157, 107–120 CrossRef CAS.
- W. Wu, M. S. Scheurer, S. Chatterjee, S. Sachdev, A. Georges and M. Ferrero, Phys. Rev. X, 2018, 8, 021048 CAS.
- A. van de Walle and G. Ceder, J. Phase Equilib., 2002, 23, 348–359 CrossRef CAS.
- B. Hallstedt, A. V. Khvan, B. B. Lindahl, M. Selleby and S. Liu, Calphad, 2017, 56, 49–57 CrossRef CAS.
- X. O. Yang, F. Yin, J. Hu, M. Zhao and Y. Liu, Calphad, 2017, 59, 189–198 CrossRef.
- A. van de Walle, C. Nataraj and Z.-K. Liu, Calphad, 2018, 61, 173–178 CrossRef CAS.
- Y. A. Kryl and P. M. Prysyazhnyuk, J. Superhard Mater., 2013, 35, 292–297 CrossRef.
- F. Mouhat and F.-X. Coudert, Phys. Rev. B: Condens. Matter Mater. Phys., 2014, 90, 224104 CrossRef.
- M. A. Ali and S. H. Naqib, RSC Adv., 2020, 10, 31535–31546 RSC.
- M. A. Ali, M. M. Hossain, M. A. Hossain, M. T. Nasir, M. M. Uddin, M. Z. Hasan, A. K. M. A. Islam and S. H. Naqib, J. Alloys Compd., 2018, 743, 146–154 CrossRef CAS.
|
| This journal is © The Royal Society of Chemistry 2023 |
Click here to see how this site uses Cookies. View our privacy policy here.  Open Access Article
 *a and
Devis
Di Tommaso
 b
b


![[thin space (1/6-em)]](https://www.rsc.org/images/entities/char_2009.gif) 562 − 0.4 × 22
562 − 0.4 × 22![[thin space (1/6-em)]](https://www.rsc.org/images/entities/char_2009.gif) 905 + 0.2 × 14
905 + 0.2 × 14![[thin space (1/6-em)]](https://www.rsc.org/images/entities/char_2009.gif) 472 = −53
472 = −53![[thin space (1/6-em)]](https://www.rsc.org/images/entities/char_2009.gif) 830 J mole−1
830 J mole−1![[thin space (1/6-em)]](https://www.rsc.org/images/entities/char_2009.gif) 114 − 0.4 × 32
114 − 0.4 × 32![[thin space (1/6-em)]](https://www.rsc.org/images/entities/char_2009.gif) 468 + 0.2 × 2894 = −44
468 + 0.2 × 2894 = −44![[thin space (1/6-em)]](https://www.rsc.org/images/entities/char_2009.gif) 698 J mole−1.
698 J mole−1.


