 Open Access Article
Creative Commons Attribution 3.0 Unported Licence
In situ observation of a mechanically induced self-sustaining reaction for synthesis of silver†
Yanyan
Zheng
a,
Hidetaka
Kasai
 *a,
Shintaro
Kobayashi
 b,
Shogo
Kawaguchi
 b and
Eiji
Nishibori
 *a
*a
aDepartment of Physics, Faculty of Pure and Applied Sciences and Tsukuba Research Center for Energy Materials Science (TREMS), University of Tsukuba, 305-8571, Tsukuba, Japan. E-mail: kasai.hidetaka.fw@u.tsukuba.ac.jp; nishibori.eiji.ga@u.tsukuba.ac.jp
bDiffraction and Scattering Division, Japan Synchrotron Radiation Research Institute (JASRI), 679-5198, Sayo, Japan
First published on 29th December 2022
Abstract
We investigated in situ the mechanical reduction of silver chloride with aluminum using synchrotron X-ray diffraction with thermography at SPring-8 BL02B2. A mechanically induced self-sustaining reaction (MSR) was observed for 2 minutes following an activation period of 9 minutes under the present milling conditions. The in situ data were analyzed using our developed multi-distance method. The crystal growth of silver was observed from the activation period and was accelerated by the MSR. The growth kinetics induced by the MSR continued for 6 minutes. The in situ monitoring clearly distinguished the reaction and crystal growth in the synthesis. We found the two dimensional growth of silver and that reducing the size of silver chloride is dominant in the activation period for the MSR.
Introduction
Mechanically induced self-sustaining reactions (MSRs)1–3 have been used as a solvent-free, direct and energy-efficient synthesis method for the fabrication of functional materials. The MSR is similar to a self-propagating high-temperature synthesis (SHS) reaction,4 which proceeds by its own heat once it is started. The distinguished feature of MSRs is use of mechanical activation. The MSR occurs in various powder mixtures in which reactions are highly exothermic.2,3 This includes some of the mechanochemical reduction of silver chloride (AgCl) with metals studied by M. Faraday in the 19th century,5,6 which sparked scientific studies of mechanochemistry.7 The reduction is nowadays employed as a synthesis method of fine particles of silver (Ag).8,9 MSRs have been used for materials synthesis for a variety of applications such as refractories,10,11 optical devices12–14 and lithium-ion batteries.15The mechanism of MSRs, especially their activation, has been poorly understood due to their complexity even in the case of AgCl and metal mixtures. Monitoring of the temperature of a container has been extensively used to study processes for MSRs.2,3,16 This approach has limitations to the observation of MSRs, especially their activation process, and no access to the growth process of products caused by MSRs.
Synchrotron radiation (SR) is the most powerful tool for in situ observation of a small amount of sample in a container due to its transmittance, high intensity, tunable wavelength, and controllable beam size. In situ monitoring techniques for mechanochemistry using SR powder X-ray diffraction (PXRD) with ball mills have been advanced since the first development by Friščić and coworkers.17 The advance provides us an opportunity to understand MSRs quantitatively. Emmerling et al. combined in situ SR-PXRD with thermography to monitor structural evolution and temperature.18 Michalchuk et al. reported a systematic study of kinetics of product formation using in situ SR-PXRD.19
In situ monitoring of MSR-type synthesis requires detailed data analysis due to the chaotic environment during synthesis. In addition, it is necessary to detect smaller structural changes in the activation period than those in the reaction period. The in situ data consist of multiple sample-to-detector distances due to a variety of possible sample positions in a milling container with an inner diameter of ∼10 mm. Very recently, Lampronti et al. reported the systematic studies with the analytical method which resolved complex diffraction profiles using sample displacement correction.20
In the present study, we performed in situ SR-PXRD of MSR-type mechanochemical reduction of AgCl with aluminium (Al) at the SPring-8 BL02B2 beamline.21,22 Firstly, we constructed in situ ball mill apparatus. Secondly, we developed an analytical method using the in situ data of simple metal powders during ball milling to reveal the structure in MSR processes based on Rietveld refinements. Finally, the processes for MSRs, their activation and crystal growth of Ag were discussed based on a combination of the in situ SR-PXRD data and the temperature of the milling jar.
Experimental
Ball milling for in situ SR-PXRD
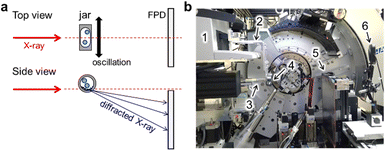
Fig. 1a shows a schematic representation of the experiment carried out at SPring-8 BL02B2.21,22 The in situ setup was used for monitoring an assembly of multiple organic molecules under mechanochemical conditions.23In situ diffraction data were measured using a flat panel detector (FPD). The sample-to-detector distance was approximately 320 mm. In Fig. 1b, the modified Retsch MM400 mill was installed in the beamline. We modified arms and jar holders on the mill as shown in Fig. S1 (ESI†). The details are shown in the ESI.† The ball mill could be operated at 3–30 Hz. The start and stop buttons of the mill were remotely operated as shown in Fig. S2 (ESI†). The in situ setup was prepared on an optical breadboard plate by adjusting the plate position and fixing the mill. We could switch the in situ setup to a normal setup, by which automatic data measurement is available using the auto-sampler,22 within less than an hour. This enabled us to measure the standard data for in situ measurements and to evaluate a diffraction profile such as peak asymmetry. In Fig. 1b, an infrared thermography camera, FLIR C5, was used for monitoring the temperature of the jar during in situ SR-PXRD measurements for information on the MSR.We determined the height of the jar for X-ray irradiation with a precision of 0.1 mm by inserting stainless steel spacers between the arm and the holder. We investigated the area near the bottom of the jar, which was the reported strategy for measuring the signal of the sample in between the jar walls with fewer peak splits caused by the signal from the sample adhering to the jar walls.17 The height of the jar was aligned using the in situ data for a jar with milling balls instead of a theodolite.24 Fig. S3 (ESI†) shows the jar height dependence of the scattered intensity of the milling balls made of agate, i.e. SiO2. The intensity from the balls decreased as the X-ray irradiation position went down against the jar.
Materials
Al (Kojundo Chemical Lab., 99.9% purity), Ni (Mitsuwa Chemicals, 99.9% purity), and AgCl (FUJIFILM Wako Pure Chemical Corporation, >99.5% purity) were used as samples. Al and Ni powders consist of fine particles with a size of micrometers. The as-received AgCl powder consists of various sized aggregates. The AgCl aggregates were weighed and flattened to millimeter-sized thickness just before ball milling.In situ and ex situ measurements
We used the modified Retsch MM400 for both in situ and ex situ measurements. Ball milling was conducted with a 3D-printed milling jar25 as shown in Fig. S4 (ESI†), agate balls with a diameter of 3 mm or 5 mm, and mill operation at 20 Hz. The details of our jar are provided in the ESI.† Plastic jars were not reused. We performed in situ SR-PXRD during ball milling at SPring-8 BL02B2.21,22 The wavelengths of incident X-rays were calibrated using the NIST CeO2 standard powder, the diffraction data of which were measured using both the FPD and multiple MYTHEN detectors. The X-ray beam was collimated to 0.5 mm in height and 3.0 mm in width. The FPD with a pixel size of 100 μm, Varex Imaging XRD3025, was used for in situ data collection with an exposure time of 1 or 2 s. The data with a time resolution of one minute were prepared for analysis by summing 60 and 30 data frames with exposure times of 1 s and 2 s, respectively.Ball milling of Al and Ni
The amount of powder loaded in the jars made of polylactic acid (PLA) was 150 mg for ball milling Al and Ni powders. We performed in situ SR-PXRD during ball milling of the metal powder. The wavelengths of incident X-rays were 0.500 Å and 0.328 Å for Al and Ni, respectively. SR-PXRD data of both the unmilled samples in glass capillaries were also collected using a large Debye–Scherrer camera with an imaging plate (IP) as a detector to determine the lattice parameters before milling.Mechanochemical reduction of AgCl with Al
We performed four kinds of experiments: (i) ex situ experiments at the laboratory, (ii) in situ SR-PXRD, (iii) in situ SR-PXRD with only AgCl, and (iv) PXRD of the product after (ii) at the laboratory. A polycarbonate (PC) jar with an inner diameter (ID) of 12 mm and four balls with a diameter of 3 mm were used for all the ball milling experiments. The wavelength of incident X-rays was 0.700 Å for (ii and iii). A SmartLab diffractometer with Mo Kα radiation was used at a scan rate of 1° min−1 for (i and iv).We conducted ex situ experiments to determine milling conditions for in situ SR-PXRD measurements in (i). The charged amounts were 400 mg and 30 mg for AgCl and Al, respectively. 20% more Al than stoichiometry was loaded in order to compensate for the partial oxidation of aluminum.6 Ball milling was conducted by monitoring the temperature by thermography. After we performed ball milling for 30 minutes, the jar was opened and the product and balls were removed from the jar. The micrometer-sized particles in the product were covered by tape within 20 minutes after ball milling. We measured PXRD of the product from 24 minutes after ball milling.
The milling conditions determined in (i) were used for in situ measurements. The samples were weighed and loaded into the PC jar with the balls at the beamline. We performed the in situ SR-PXRD measurements during ball milling for 30 minutes. The jar was opened and the balls were removed after the measurements. In (iii), we performed in situ SR-PXRD for ball milling of AgCl. The charged amount of AgCl was 400 mg. The other conditions were the same as in (ii).
In (iv), we measured PXRD of the product of (ii). The jar was opened again 12 days after (ii). There were fine particles with micrometer size and millimeter-sized aggregates which were removed easily from the jar and fine particles adhering to the jar wall. The particles with different sizes were covered by tape and characterized by PXRD at the laboratory.
Results and discussion
Multi-distance method for in situ data analysis
We developed an analytical method using the SR-PXRD patterns of Al and Ni powders during milling. For these simple metals, it was possible to eliminate peak asymmetry by the instrumental effect for all the observed reflections due to the diffraction angle 2θhkl of more than 9°. The complex shape of Bragg reflections was attributed to the peak splitting by sample distribution on the X-ray beam path.20 The high-resolution SPring-8 data enabled us to observe fine details in between the peaks as shown in Fig. S5 (ESI†). We tried to analyze this complex profile using the already reported methods using multiple phases with different lattice constants17 and two split-type pseudo-Voigt functions plus one Gaussian function.20 However, these techniques have some insufficient points for the analysis of the present high-resolution data especially at the peaks in between the two peaks from the front and back walls of the jar.Fig. 2 schematically shows our developed method. The scattering angle 2θi for the ith sample position, i.e. sample-to-detector distance Li, is expressed by
| 2θi = arctan [0.1·(x − x0)/Li] | (1) |
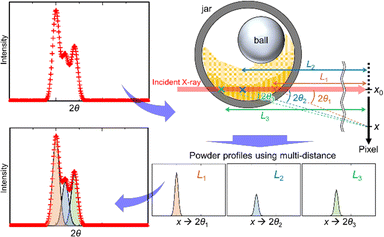 | ||
| Fig. 2 Multi-distance method for in situ SR-PXRD data during ball milling. The powder profiles with multiple sample positions are treated as a sum of those with each sample-to-detector distance. | ||
The method is similar to the strategy reported by Lampronti et al.20 The differences of our method for the peak splitting are that (1) more than three calculated profiles are available and (2) all the profiles are assumed as split-type pseudo-Voigt functions. We provided all of the profile parameters for each profile. The flexibility of our method enables us to analyze the complex shape of powder profiles as shown in Fig. S5 (ESI†). We call this technique a multi-distance method. The multi-distance method was implemented in the synchrotron powder (SP) program.26
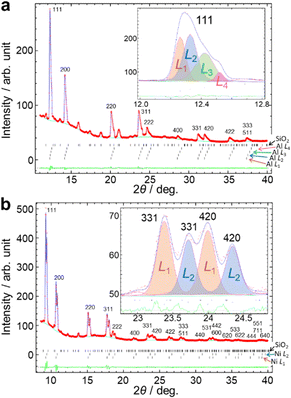
The multi-distance method achieved the satisfactory fitting in the 2θ range of up to 40° in Fig. 3, Fig. S6 and S7 (ESI†). Reliability factors based on the weighted profiles, Rwp, and on the intensity, RI, are 0.77% and 2.47% for Al, and 1.57% and 2.71% for Ni, respectively. The details of refinements are given in the ESI.† The number of sample-to-detector distances was determined to be a minimum value which achieves the smallest Rwp by trial refinements by changing the number. The Rwp decreased and became almost constant with an increasing number of sample-to-detector distances in Fig. S8 (ESI†). The data were fitted by the four profiles of Al with the sample-to-detector distances of L1: 323.8 mm, L2: 325.5 mm, L3: 328.1 mm and L4: 330.8 mm with an accuracy of approximately ± 0.1 mm using the identical lattice parameter. In Fig. 3b, the multi-distance method used the two sample-to-detector distances of L1: 325.7 mm and L2: 331.0 mm for Ni.
The in situ diffraction pattern in Fig. 3a shows a sum of the four profiles resulting in more complex peak shapes than the reported in situ data using a jar with an ID of 10 mm.20 The difference can be attributed to the sample distribution, the length of which is more than 7.0 mm calculated from L1 and L4 in Fig. 3a. The L1 and L4 were attributed to the sample positions close to the front and back walls of the jar.20 The L2 and L3 correspond to the in-between positions. The peak widths for the in-between positions were larger than those for the front and back walls. The width of the 511 reflection for the in-between positions was ∼0.3° by projection of 3 mm for an irradiated area of the sample.
In situ monitoring of the mechanochemical reduction of AgCl with Al
We applied our in situ apparatus and multi-distance method to the mechanochemical reduction of AgCl with Al. The reaction equation is described as| 3AgCl + Al → 3Ag + AlCl3 | (2) |
This reaction is exothermic with the ratio of the reaction heat to the RT heat capacity of the products ΔH/C of 1933 K.6 The ΔH/C is much higher than the sublimation temperature 453 K of AlCl3. The reduction was reported as an MSR.6
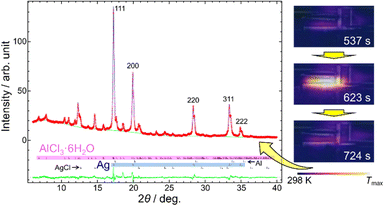
We confirmed the synthesis of Ag using the modified mill and the milling conditions in Experiment (i). Fig. 4 shows the PXRD pattern of the reaction product. It confirmed that Ag was synthesized using the hexahydrate form of AlCl3. The growth of AlCl3·6H2O occurred from saturated aqueous solution of AlCl3 by air moisture.27
The temperature of a milling jar is an indicator of ignition of the MSR. Fig. 4 also shows the thermography images during ball milling in Experiment (i). The temperature increased drastically at a milling time of 10 minutes, indicating ignition of the MSR. Subsequently, the temperature decreased to its original within 2 minutes, indicating that the MSR and the deceleration periods were completed.
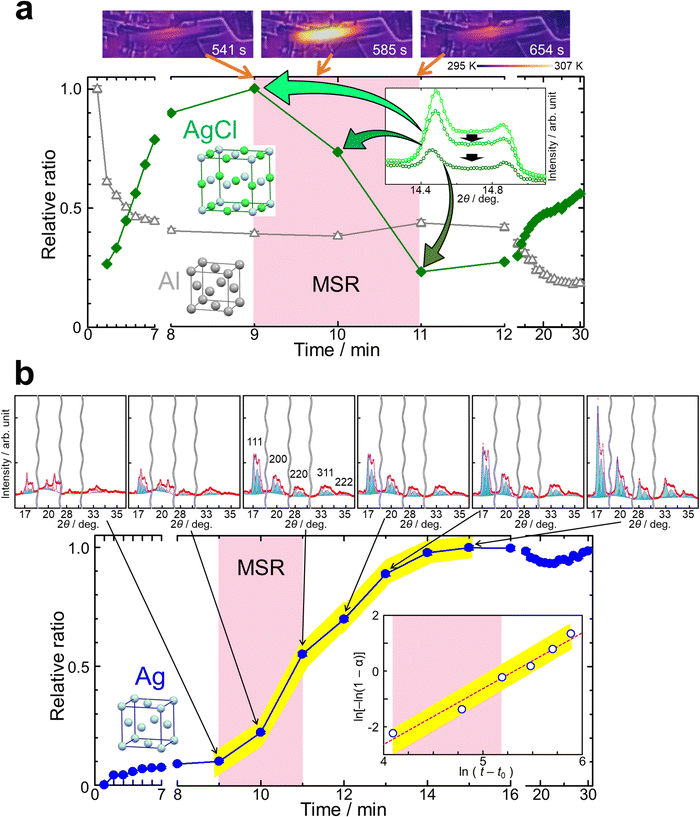
The process of the mechanochemical reduction was monitored by in situ SR-PXRD in Experiment (ii). Fig. 5, Fig. S9 and S10 (ESI†) show the in situ diffraction data and monitored temperatures. We observed the growth of Ag in the figures. The time change of temperature of the jar in Fig. 5a is consistent with that in Fig. 4. Fig. S11 (ESI†) shows the micrometer-sized particles obtained by the mechanochemical reduction.
The size reduction of AgCl by ball milling caused the increase of its micrometer-sized particles. The increase of AgCl was observed until 9 minutes and after 11 minutes in Fig. 5a, Fig. S8 and S9 (ESI†). In situ SR-PXRD for ball milling of only AgCl was carried out in Experiment (iii) and the pattern is shown in Fig. S12 (ESI†). The pattern confirmed the increase of the amount for micrometer-sized AgCl particles.
The millimeter-sized AgCl aggregates did not react. In other words, the reaction occurred for the fine particles with micrometer size of AgCl. The PXRD data of the product with different sizes were collected in Experiment (iv). The patterns showed that the ratio of the amount for AgCl was higher in the millimeter-sized aggregates than that in the micrometer-sized particles as shown in Fig. S13 (ESI†).
The in situ diffraction patterns clearly show the peak splitting due to sample distribution on the beam path as shown in Fig. 5b, Fig. S9 and S10 (ESI†). The weak signal from the balls confirmed the alignment of the X-ray beam across the nearly shortest path length near the bottom of the jar. We observed at least three components for each of AgCl, Al and Ag. Fig. 5b and Fig. S10 (ESI†) show the fitting results of Rietveld refinements using the multi-distance method. The profile was fitted with three sample-to-detector distances of 323.0 mm, 328.6 mm and 332.3 mm for the materials. There were Ag 200, Al 200 and AgCl 220 reflections with each splitting, i.e. total of nine components, around 2θ = 20–21° as shown in Fig. S10 (ESI†). The complex profile was successfully resolved by the multi-distance method in the figure.
Fig. 5 shows the time evolution of the relative amount of the reactants and product. The scale factors from the three sample-to-detector distances were summed and normalized for each material in the figure. The time evolution of AgCl confirmed the above-mentioned size reduction process and the MSR from 9 to 11 minutes in Fig. 5a. Al decreased within two minutes in the figure. This was attributed to sample spreading, also observed in Fig. S5 (ESI†). Ag increased slowly until 9 minutes and subsequently drastically from 9 to 15 minutes as shown in Fig. 5b.
The MSR occurred for 2 minutes after an activation time of 9 minutes under the present conditions. This was confirmed by the changes of AgCl and the temperature of the jar. The size reduction of AgCl was a dominant process in the activation period. The reaction occurred slightly even in the activation period. The onset of the drastic growth of Ag is consistent with the ignition of the MSR. AlCl3·6H2O was not observed in the in situ data. This fact indicates that the crystal growth of AlCl3·6H2O occurred after ball milling. The MSR was terminated probably due to an insufficient amount of the fine particles of AgCl as shown in Fig. 5a. It was not investigated whether the MSR re-occurs or not after 30 minutes by re-increasing the amount of fine particles of AgCl by size reduction after 11 minutes in this study.
We observed the growth of Ag even after the MSR was completed including its deceleration period in Fig. 5b. The figure also shows the Avrami plot for the growth of Ag. The crystallization kinetics was described by the Kolmogorov–Johnson–Mehl–Avrami (KJMA) model: α(t) = 1 − exp[−k(t − t0)n], where α is the relative ratio of the product, t is the ball milling time, t0 is the induction time, k is the crystallization rate constant, and n is a kinetic exponent. The kinetics after the ignition of the MSR was described with t0 of 480 s, n = 2.00(3) and ln(k) = −10.63(16), indicating the same growth mechanism from 9 to 14 minutes. The n value of 2 indicates two or one dimensional crystal growth. Two dimensional crystal growth was supported by the preferable growth in the 111 direction indicated by the peak widths in the diffraction data.
The in situ SR-PXRD and the data analysis unveiled the activation, MSR, and crystal growth processes. The MSR was ignited by increasing micrometer-sized particles of AgCl, which took 9 minutes. The MSR accelerated the growth of the product and continued for 2 minutes. The decrease of fine particles of AgCl for 2 minutes was associated with the MSR due to consumption by the reaction. The MSR resulted in the change of the kinetics for Ag. The growth of Ag continued with the kinetics caused by the MSR for 6 minutes, which was longer than the reaction. This is due to the growth processes such as diffusion, nucleation and crystal growth following the reaction. The kinetics and the diffraction data indicated two dimensional crystal growth.
Conclusions
We revealed the processes for the MSR-type synthesis of Ag particles. The processes were described by activation, MSR and crystal growth of Ag. The activation process was dominated by making micrometer-sized AgCl particles as observed by in situ SR-PXRD. The MSR and the decelerated reaction were completed before the crystal growth of Ag was saturated. This showed that the chemical reaction and crystal growth are different steps, which are distinguished by in situ SR-PXRD. The multi-distance method suggests that detailed in situ monitoring can be carried out for various positions in a milling jar. We believe that our in situ apparatus and multi-distance method will reveal processes of a variety of mechanochemical reactions, resulting in the advancement in science for materials synthesis.Conflicts of interest
There are no conflicts to declare.Acknowledgements
This work was supported by JSPS KAKENHI Grant Numbers JP19KK0132, JP20H04656 and JP21H05235. The synchrotron experiments were performed at SPring-8 BL02B2 with the approval of the Japan Synchrotron Radiation Research Institute (JASRI) (Proposal No. 2021A0068 as a Partner User and Proposal No. 2021B1630, 2021B1775, 2021B1783, 2022A1231 and 2022A1754).Notes and references
- C. G. Tschakarov, G. G. Gospodinov and Z. Bontschev, J. Solid State Chem., 1982, 41, 244 CrossRef
.
- L. Takacs, Prog. Mater. Sci., 2002, 47, 355 CrossRef CAS
.
- L. Takacs, Int. J. Self-Propag. High-Temp. Synth., 2009, 18, 276 CrossRef
.
- J. J. Moore and H. J. Feng, Prog. Mater. Sci., 1995, 39, 243 CrossRef CAS
.
- M. Faraday, Q. J. Sci., Lit., Arts, 1820, 8, 374 Search PubMed
.
- L. Takacs, J. Therm. Anal. Calorim., 2007, 90, 81 CrossRef CAS
.
- L. Takacs, Chem. Soc. Rev., 2013, 42, 7649 RSC
.
- J. Keskinen, P. Ruuskanen, M. Karttunen and S. P. Hannula, Appl. Organomet. Chem., 2001, 15, 393 CrossRef CAS
.
- M. T. Le, D. J. Kim, C. G. Kim, J. S. Sohn and J. Lee, J. Exp. Nanosci., 2008, 3, 223 CrossRef CAS
.
- M. Jalaly, F. J. Gotor and M. J. Sayagués, J. Am. Ceram. Soc., 2018, 101, 1412 CrossRef CAS
.
- S. Eilbeigi, S. A. Hassanzadeh-Tabrizi and A. Khodaivandi, Ceram. Int., 2018, 44, 21437 CrossRef CAS
.
- M. A. Avilés, J. M. Córdoba, M. J. Sayagués and F. J. Gotor, Inorg. Chem., 2019, 58, 2565 CrossRef PubMed
.
- M. A. Avilés, J. M. Córdoba, M. J. Sayagués and F. J. Gotor, J. Mater. Sci., 2020, 55, 1603 CrossRef
.
- M. A. Avilés and F. J. Gotor, Opt. Mater., 2021, 117, 111121 CrossRef
.
- Ö. Budak, P. Srimuk, M. Aslan, H. Shim, L. Borchardt and V. Presser, ChemSusChem, 2021, 14, 398 CrossRef PubMed
.
- J. M. Pauls, N. F. Shkodich and A. S. Mukasyan, J. Phys. Chem. C, 2019, 123, 11273 CrossRef CAS
.
- T. Friščić, I. Halasz, P. J. Beldon, A. M. Belenguer, F. Adams, S. A. J. Kimber, V. Honkimäki and R. E. Dinnebier, Nat. Chem., 2013, 5, 66 CrossRef PubMed
.
- H. Kulla, S. Haferkamp, I. Akhmetova, M. Röllig, C. Maierhofer, K. Rademann and F. Emmerling, Angew. Chem., Int. Ed., 2018, 57, 5930 CrossRef CAS PubMed
.
- A. A. L. Michalchuk, I. A. Tumanov, S. Konar, S. A. J. Kimber, C. R. Pulham and E. V. Boldyreva, Adv. Sci., 2017, 4, 1700132 CrossRef PubMed
.
- G. I. Lampronti, A. A. L. Michalchuk, P. P. Mazzeo, A. M. Belenguer, J. K. M. Sanders, A. Bacchi and F. Emmerling, Nat. Commun., 2021, 12, 6134 CrossRef CAS PubMed
.
- E. Nishibori, M. Takata, K. Kato, M. Sakata, Y. Kubota, S. Aoyagi, Y. Kuroiwa, M. Yamakata and N. Ikeda, Nucl. Instrum. Methods Phys. Res., Sect. A, 2001, 467, 1045 CrossRef
.
- S. Kawaguchi, M. Takemoto, K. Osaka, E. Nishibori, C. Moriyoshi, Y. Kuroiwa and K. Sugimoto, Rev. Sci. Instrum., 2017, 88, 085111 CrossRef CAS PubMed
.
- Y. Yano, H. Kasai, Y. Zheng, E. Nishibori, Y. Hisaeda and T. Ono, Angew. Chem., Int. Ed., 2022, 61, e20223853 CrossRef PubMed
.
- I. Halasz, S. A. J. Kimber, P. J. Beldon, A. M. Belenguer, F. Adams, V. Honkimäki, R. C. Nightingale, R. E. Dinnebier and T. Friščić, Nat. Protoc., 2013, 8, 1718 CrossRef PubMed
.
- N. Tumanov, V. Ban, A. Poulain and Y. Filinchuk, J. Appl. Crystallogr., 2017, 50, 994 CrossRef CAS
.
- E. Nishibori, E. Sunaoshi, A. Yoshida, S. Aoyagi, K. Kato, M. Takata and M. Sakata, Acta Crystallogr., Sect. A: Found. Crystallogr., 2007, 63, 43 CrossRef CAS PubMed
.
- D. R. Buchanan and P. M. Harris, Acta Crystallogr., Sect. B: Struct. Crystallogr. Cryst. Chem., 1968, 24, 954 CrossRef CAS
.
Footnote |
| † Electronic supplementary information (ESI) available. See DOI: https://doi.org/10.1039/d2ma00903j |
| This journal is © The Royal Society of Chemistry 2023 |

