Dietary additive octyl and decyl glycerate modulates metabolism and inflammation under different dietary patterns with the contribution of the gut microbiota†
Junhui
Zhang‡
 acd,
Huilin
Yu‡
acd,
Qianqian
Wang
acd,
Haiying
Cai
ab,
Fei
Shen
acd,
Shengyue
Ruan
acd,
Yue
Wu
acd,
Tao
Liu
acd,
Fengqin
Feng
acd,
Huilin
Yu‡
acd,
Qianqian
Wang
acd,
Haiying
Cai
ab,
Fei
Shen
acd,
Shengyue
Ruan
acd,
Yue
Wu
acd,
Tao
Liu
acd,
Fengqin
Feng
 acd and
Minjie
Zhao
*acd
aCollege of Biosystems Engineering and Food Science, Zhejiang University, Hangzhou, 310058, China. E-mail: minjiezhao@zju.edu.cn
bSchool of Biological & Chemical Engineering, Zhejiang University of Science &Technology, Hangzhou, 310023, China
cNational Engineering Laboratory of Intelligent Food Technology and Equipment, Zhejiang University, Hangzhou, 310058, China
dKey Laboratory for Agro-Products Nutritional Evaluation of Ministry of Agriculture, Zhejiang University, Hangzhou, 310058, China
First published on 8th December 2022
Abstract
Octyl and decyl glycerate (ODG), a medium-chain triglyceride (MCT), is widely used as a food additive. Medium-chain monoglycerides, such as glycerol monolaurate and glycerol monocaprylate, were found to change the composition of the gut microbiota and influence glucose and lipid metabolism and inflammation. However, whether ODG influences the gut microbiota and whether the alteration in the gut microbiota contributes to the metabolic phenotype remain unknown. Under a normal-chow diet, mice were treated with or without different dosages of ODG (150, 800, 1600 mg kg−1) for 22 weeks. All doses of ODG significantly decreased the ratio of HDL to LDL cholesterol, improved the inflammation and insulin resistance, and increased the α-diversity of the gut microbiota and the abundance of Bifidobacterium and Turicibacter. Under a high-fat diet, mice were treated with or without 1600 mg kg−1 ODG for 16 weeks. The results demonstrated that ODG significantly alleviated the increase in the ratio of HDL to LDL cholesterol, insulin resistance, and inflammation caused by HFD. The expression of related genes was consistent with the above observations. ODG also altered the composition of the gut microbiota and increased the Bifidobacterium abundance under HFD. Our findings indicated that ODG similarly improved glucose metabolism and inflammation but exhibited differential effects on lipid metabolism under different dietary patterns. Furthermore, changes in the gut microbiota caused by ODG supplementation might contribute to the alteration in glucose and lipid metabolism and inflammation, which might be influenced by dietary patterns.
1. Introduction
Medium-chain triglyceride (MCT) is the glycerol derivative of medium-chain fatty acids (MCFAs, C8–C12) and is hydrolyzed and absorbed more simply than long-chain triglyceride (LCT) since it does not require bile or pancreatic juice to take part in the hydrolysis in the intestinal cavity.1 Unlike long-chain fatty acids, MCFAs generated by MCT hydrolysis do not re-synthesize triglycerides, which are rapidly delivered to portal vein circulation and promptly oxidized and digested in the liver.1,2 Based on these characteristics, MCT has been demonstrated to boost fat oxidation and energy expenditure while having a stronger satiety impact, encouraging weight reduction and reducing fat deposition, with advantages for health.3–6 Octyl and decyl glycerate (ODG) is an MCT derived primarily from the hydrolysis and fractionation of coconut oil, palm kernel oil, and litsea cubeba oil to produce octanoic acid (C8:0) and decanoic acid (C10:0), which are then esterified with glycerol in the presence of a catalyst.7 Due to its excellent emulsification characteristics, stability, and unique metabolic advantages, ODG can be used without restriction in emulsifying essences, beverages, ice cream, milk powder, candy, and chocolate, in accordance with manufacturing needs and the Hygienic Standards for the Use of Food Additives in China.The gut microbiota is important not just for nutritional digestion and absorption, but also for maintaining metabolic homeostasis, host immunity, and the gut barrier.8 Emerging evidence has revealed the important roles of the gut microbiota in the occurrence and development of host metabolic disease.9,10 Thus, regulating the gut microbiota has been proved to be a new therapeutic strategy for obesity and related metabolic diseases.11,12 Some dietary fats have been found to have an impact on the gut microbiota and host metabolism. Long-chain fatty acids such as eicosapentaenoic acid and docosahexaenoic acid were shown to significantly reduce hyperglycemia and insulin resistance in db/db mice by altering the gut microbiome.13 It has also been found that the monoglyceride of MCFA14 and medium-chain and long-chain triacylglycerol (MLCT)15 could modulate the gut microbiota and influence the metabolism of the host. However, little is known about whether MCT, especially ODG, affects the gut microbiota. Furthermore, even the same dietary ingredients may have different effects on the gut microbiota under different dietary patterns. Glycerol monolaurate (GML), a monoglyceride of lauric acid (C12:0), was found to cause gut microbiota dysbiosis, inflammation, and metabolic syndrome under a low-fat diet,16 while it was found to ameliorate obesity and metabolic syndrome with the modulation of the gut microbiota under a high-fat diet.17,18 Therefore, it is meaningful to evaluate the effect of ODG on the gut microbiota under different dietary patterns.
In the present research, we aimed to investigate the effects of ODG supplementation on metabolism and inflammation, and the possible interaction between the gut microbiota and metabolic phenotype under different dietary patterns. We evaluated the effect of ODG on glucose and lipid metabolism, inflammation, related gene expression, and the gut microbiota composition under a normal-chow diet and a high-fat diet, respectively. The relationships between metabolic markers and the gut microbiota composition were further examined in order to identify a potential mechanism for the regulation of metabolic health by ODG supplementation under different dietary patterns.
2. Materials and methods
2.1. Animals and experimental design
2.2. Intravenous glucose tolerance test (IGTT)
Mice were assessed for glucose tolerance by an intravenous injection after 12 h of fasting at week 20 in Experiment 1 and at week 14 in Experiment 2. A 2 g per kg body weight glucose solution was intravenously given to eight mice at random from each group. At 0, 30, 60, 90, and 120 minutes, each mouse's blood glucose concentration was tested using an Accu-Check glucometer manufactured by Roche Diagnostics Deutschland GmbH (Mannheim, Germany).2.3. Biochemical analysis
Using commercial kits (Nanjing Jiancheng Bioengineering Institute, Nanjing, Jiangsu, China) and following the manufacturer's instructions, we measured the serum levels of high-density lipoprotein cholesterol (HDL cholesterol), low-density lipoprotein cholesterol (LDL cholesterol), triglycerides, total cholesterol, and glucose.19 Free fatty acid (FFA), insulin, lipopolysaccharide binding protein (LBP), lipopolysaccharide (LPS), interleukin 1β (IL-1β), interleukin 6 (IL-6), tumor necrosis factor (TNF), and monocyte chemotactic protein 1 (MCP-1) were all measured using ELISA kits from Wuhan ColorfulGene Biological Technology Co., Ltd (Wuhan, Hubei, China). The detailed experimental methods are shown in the ESI.† Serum insulin (mU L−1) × serum glucose (mmol L−1)/22.5 was used to carry out the homeostasis model assessment of insulin resistance (HOMA-IR).2.4. Histology analysis
The tissues were taken out of paraformaldehyde, alcohol-dehydrated, embedded in paraffin wax, and cut with 4 μm thickness. The epididymal fat was stained with hematoxylin and eosin (H&E) in Experiment 1 and Experiment 2. The liver was stained with oil red O in Experiment 2. The detailed experimental methods are shown in the ESI.† The stained slices were examined using the Leica Application Suite v4 (Wetzlar, Germany). The size and frequency of the epididymal fat and the fat region of the liver were determined using Image-Pro Plus 6.1 (Media Cybernetics, Inc., Rockville, MD, USA).2.5. 16S rRNA sequencing and analysis
The bacterial DNA sample of each mouse was extracted individually from roughly 50 mg of feces using the QlAamp DNA Stool Mini Kit (Qiagen, Dusseldorf, Germany). The V3–V4 variable region was amplified using particular primers in PCR. The sequencing library was created after purifying and quantifying the PCR products. The sequences were OTU clustered using the UPARSE software (https://drive5.com/uparse/) based on their 97% similarity. The Majorbio cloud platform (https://cloud.majorbio.com/) was used to evaluate all 16S rRNA sequencing data. The microbial diversity and richness in various groups were determined using the α-diversity of the gut microbiota, which included the Ace index, Chao index, Sobs index, Simpson index, and Venn diagram based on the OTU level. The differences in the gut microbiota between diverse groups were shown using principal coordinates analysis (PCoA), which symbolizes diversity. We performed barplot analysis to determine the composition and distribution of microbial species at the phylum and family levels, and heatmap analysis at the genus level. Then, the linear discriminant analysis effect size (LEfSe) was used to estimate the influence of the abundance of each species on the difference. Correlation heatmap analysis was used to show the relationship between key metabolic markers and diverse microbial species.2.6. Gene expression analysis
Gene expression was performed with real-time quantitative PCR analysis. The TRI reagent (Invitrogen, America) was used to extract RNA from the homogenized liver, and the concentration and purity of RNA were measured using a Nanodrop ND-2000 spectrophotometer (Thermo Fisher Scientific, MA, USA). Then, using a Reverse Transcription kit (Vazyme, Nanjing, Jiangsu, China), the first-strand cDNA was synthesized from the total RNA in accordance with the manufacturer's instructions. With LightCycler 480 equipment (Roche Applied Science, IN, USA), real-time quantitative PCR was carried out using an SYBR Color qPCR Master Mix from Vazyme (Nanjing, Jiangsu, China). Using the 2−ΔΔCt method, mRNA expression was estimated and standardized to YWHAZ. Primer sequences are shown in the ESI, Table 2.†2.7. Statistical analysis
The Majorbio cloud platform (https://cloud.majorbio.com/) was used for 16S rRNA sequencing analysis, and GraphPad Prism 6 (GraphPad Software Inc.) was used for the other statistical analyses. One-way analysis of variance (ANOVA) and Tukey's multiple comparison post-test were used to identify statistical differences. Data were expressed as mean ± SEM and P-value < 0.05 was considered statistically significant.3. Results
3.1. Effects of ODG on the body weight, lipid and glucose metabolism, and inflammation in normal-chow diet mice
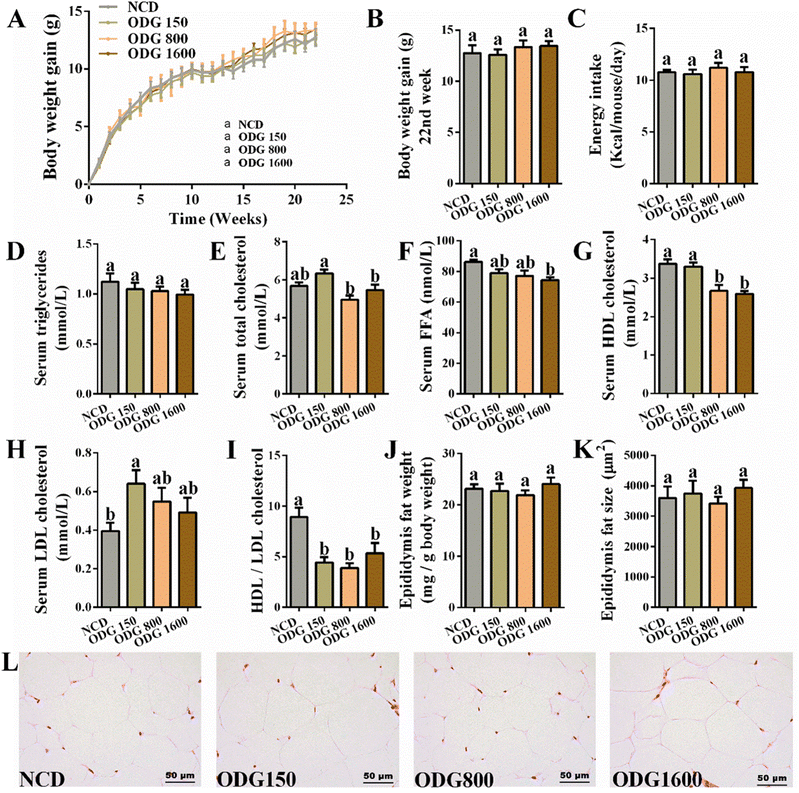
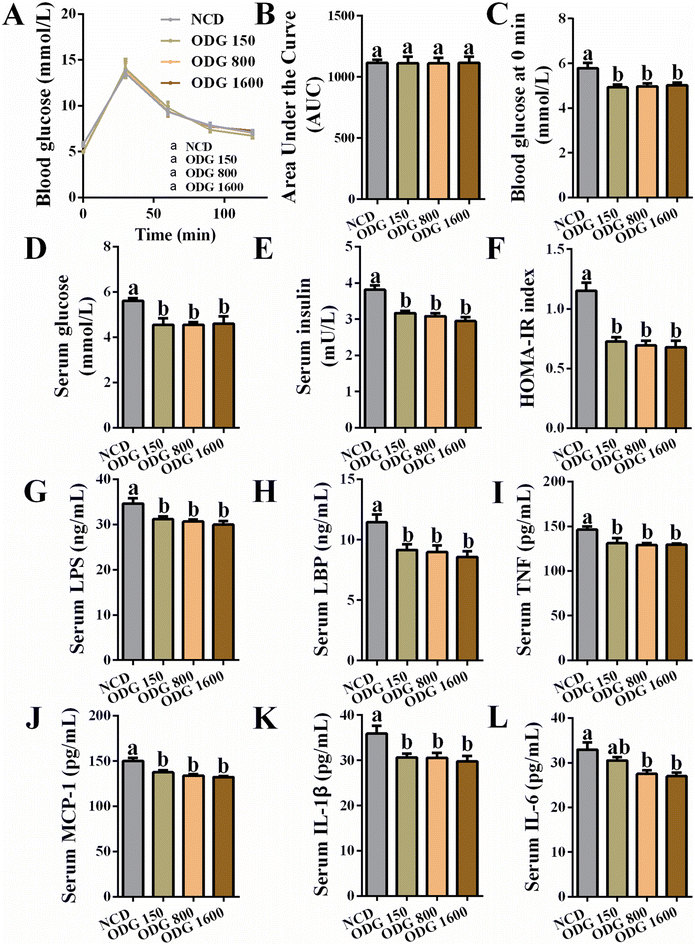
ODG did not significantly influence the body weight (Fig. 1A and B) and total feed intake (Fig. 1C) during the dietary intervention. Furthermore, ODG decreased serum triglycerides with dose dependence, even if there was no significant difference (Fig. 1D). In comparison with the NCD group, 150 mg kg−1 ODG slightly increased serum total cholesterol, whereas 800 and 1600 mg kg−1 ODG marginally decreased serum total cholesterol (Fig. 1E). The serum FFA levels were lowered by ODG, with a significant difference between the 1600 mg kg−1 ODG and NCD groups (Fig. 1F). Additionally, 800 and 1600 mg kg−1 ODG significantly reduced serum HDL cholesterol (Fig. 1G), while all ODG dosages increased the serum LDL cholesterol level (Fig. 1H). Interestingly, ODG obviously decreased the ratio of HDL/LDL cholesterol, regardless of dosages (Fig. 1I). The weight and amount of epididymal fat did not differ substantially across the groups (Fig. 1J–L). The IGTT curve and the area under the curve (AUC) showed no clear differences (Fig. 2A and B). Furthermore, we found that the serum glucose level was also significantly reduced by all ODG dosages (Fig. 2D) which were consistent with blood glucose at 0 min in IGTT (Fig. 2C). All ODG dosages clearly reduced blood insulin (Fig. 2E) and the HOMA-IR index (Fig. 2F) computed from serum glucose and insulin. Remarkably, all dosages of ODG significantly reduced the serum LPS, LBP, TNF, MCP-1, and IL-1β levels compared with the NCD group (Fig. 2G–K). When compared to the NCD group, 800 and 1600 mg kg−1 ODG dramatically reduced the serum IL-6 levels (Fig. 2L).3.2. Effects of ODG on the composition and structure of the gut microbiota in normal-chow diet mice
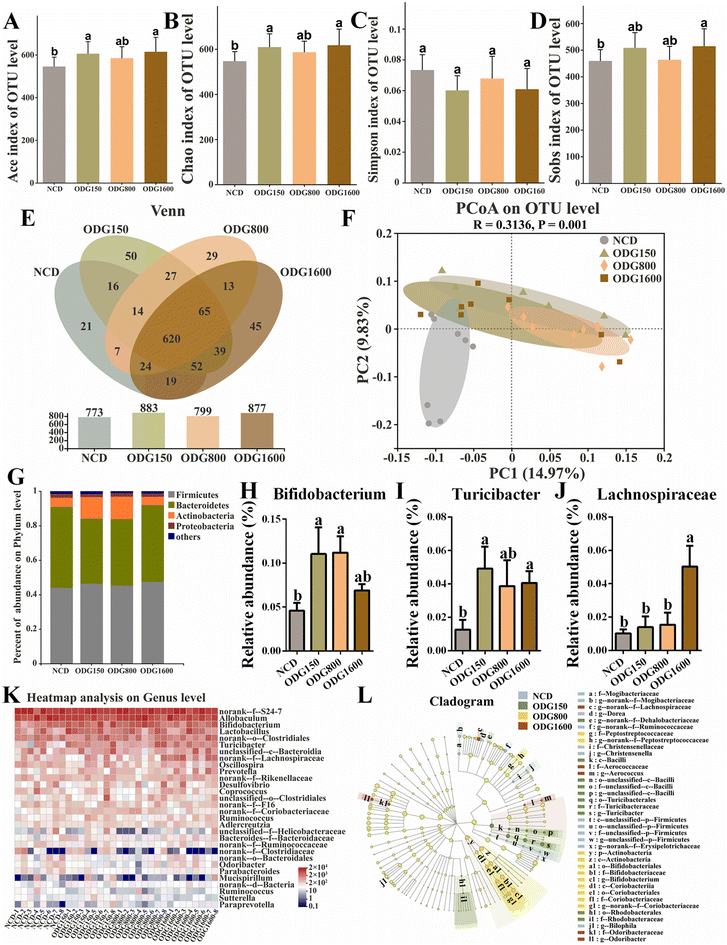
To investigate the effects of ODG on the gut microbiota, we performed 16S rRNA high-throughput sequencing using mouse feces. The Ace, Chao, and Sobs indexes were considerably increased at 150 and 1600 mg kg−1 ODG (Fig. 3A, B and D). The Simpson index showed no obvious variation across the groups (Fig. 3C). In the Venn diagram, all ODG dosages increased the OTU levels (Fig. 3E). The NCD, ODG150, ODG800, and ODG1600 groups all had 620 identical OTUs and 21, 50, 29, and 45 unique OTUs, respectively. All ODG groups were clearly distinguished from the NCD group on the PC1 axis and PC2 axis of the PCoA diagram (Fig. 3F). 150 and 800 mg kg−1 ODG enhanced Actinobacteria and decreased Bacteroidetes (Fig. 3G). 150 and 800 mg kg−1 ODG significantly increased the Bifidobacterium abundance, while 1600 mg kg−1 ODG also increased the Bifidobacterium abundance, although there was no significant difference (Fig. 3H and K). 150 and 1600 mg kg−1 ODG obviously increased the abundance of Turicibacter (Fig. 3I and K). Interestingly, 1600 mg kg−1 ODG significantly increased the Lachnospiraceae abundance (Fig. 3J and K). The LEfSe analysis in Fig. 3L was conducted to show the dominant microbial species in each group. Erysipelotrichaceae, Bilophila, and Christensenella dominated the NCD group; Bacilli, Dehalobacteriaceae, and Turicibacter dominated the 150 mg kg−1 ODG group; Actinobacteria, Bifidobacteriaceae, and Bifidobacterium dominated the 800 mg kg−1 group; and Lachnospiraceae, Odoribacter, and Aerococcus dominated the 1600 mg kg−1 group (Fig. 3L).3.3. ODG improved lipid metabolism in high-fat diet mice
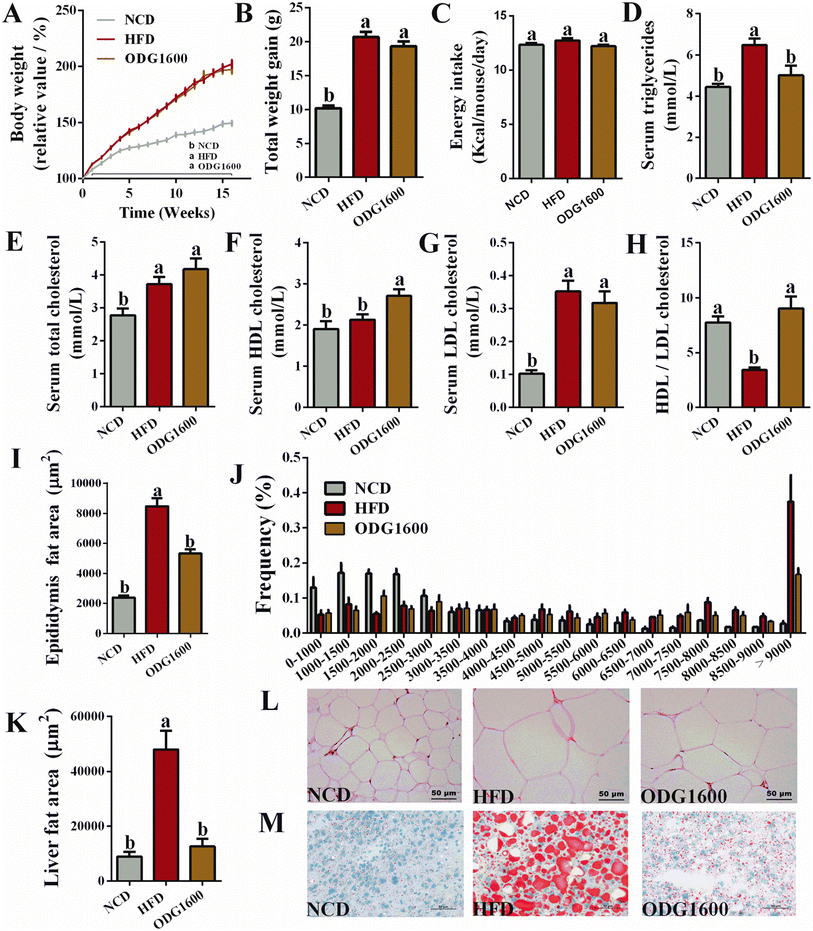
After 16 weeks of dietary intervention, the body weight gain in the HFD group and the 1600 mg kg−1 ODG group was significantly higher than that in the NCD group (Fig. 4A and B). 1600 mg kg−1 ODG slightly decreased the total weight gain compared with the HFD group. The energy intake showed no significant differences among these groups (Fig. 4C). However, 1600 mg kg−1 ODG dramatically reduced serum triglycerides compared with the HFD group (Fig. 4D). Serum total cholesterol was obviously increased by HFD and 1600 mg kg−1 ODG when compared to the NCD group (Fig. 4E). 1600 mg kg−1 ODG significantly increased serum HDL cholesterol compared with the NCD group and HFD group (Fig. 4F). Additionally, the HFD and ODG groups both had significantly higher blood LDL cholesterol levels than the NCD group, with the ODG group being marginally lower than the HFD group (Fig. 4G). Moreover, 1600 mg kg−1 ODG significantly increased the ratio of HDL cholesterol to LDL cholesterol compared to the HFD group (Fig. 4H). H&E staining of epididymal fat and oil red O staining of the liver also indicated that 1600 mg kg−1 ODG dramatically reduced the size and area of adipocytes and visceral fat deposition (Fig. 4I–M).3.4. ODG alleviated insulin resistance and inflammation in high-fat diet mice
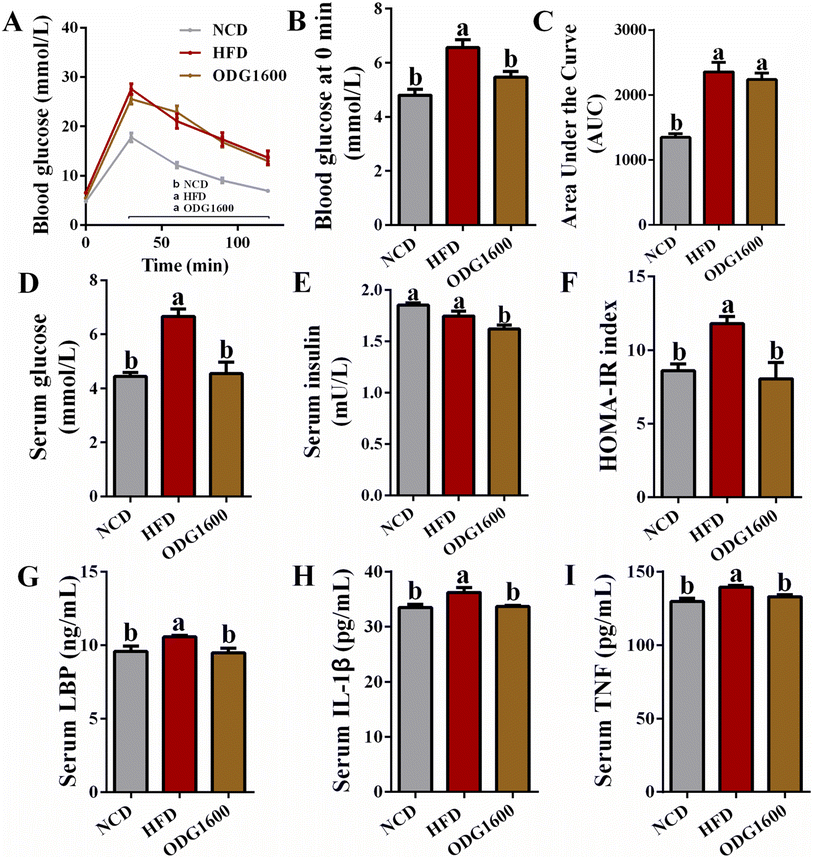
To investigate the effects of ODG on glucose metabolism under HFD, we performed an IGTT in the 14th week. The 1600 mg kg−1 ODG group and HFD group always had higher blood glucose levels (Fig. 5A). HFD and 1600 mg kg−1 ODG significantly increased the area under the curve (AUC) of the IGTT versus NCD, while 1600 mg kg−1 ODG slightly decreased the AUC compared to the HFD group with no significant difference (Fig. 5C). Interestingly, we detected the serum glucose level and discovered that NCD and 1600 mg kg−1 ODG dramatically lowered serum glucose versus HFD, which was consistent with the blood glucose at 0 minutes of the IGTT (Fig. 5B and D). 1600 mg kg−1 ODG significantly reduced serum insulin compared with the NCD and HFD groups (Fig. 5E). The HOMA-IR index of the NCD and 1600 mg kg−1 ODG groups was significantly lower than that in the HFD group (Fig. 5F). Moreover, the NCD and 1600 mg kg−1 ODG groups had obviously lower serum LBP, IL-1β, and TNF levels than the HFD group (Fig. 5G–I).3.5. ODG altered the gene expression of glucose and lipid metabolism and inflammation in high-fat diet mice
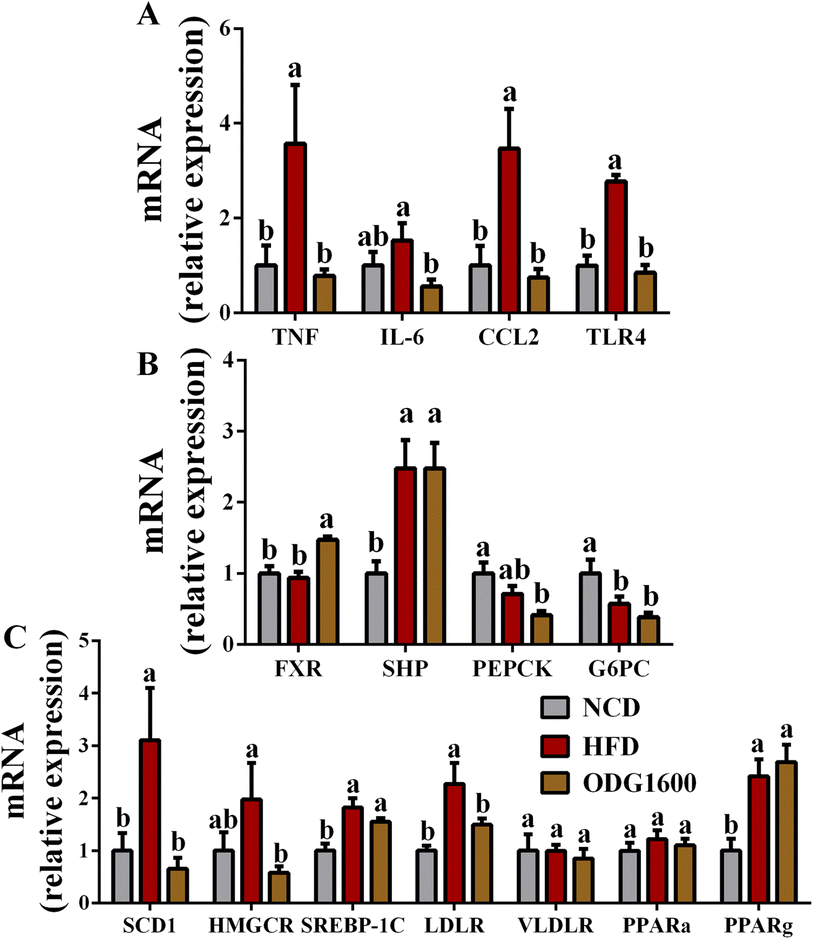
1600 mg kg−1 ODG dramatically down-regulated the hepatic gene expression of TNF, IL-6, CCL2, and TLR4 related to inflammation compared with the HFD group (Fig. 6A). Furthermore, 1600 mg kg−1 ODG significantly up-regulated the expression of FXR versus the NCD and HFD groups (Fig. 6B). The expression of SHP was obviously increased by HFD and 1600 mg kg−1 ODG (Fig. 6B). (Fig. 6B). Compared to the NCD group, the expression of G6PC was dramatically reduced in the HFD group and 1600 mg kg−1 ODG group (Fig. 6B). Moreover, the 1600 mg kg−1 ODG group significantly down-regulated the expression of SCD1, HMGCR, and LDLR versus the HFD group (Fig. 6C). When compared to the NCD group, HFD and 1600 mg kg−1 ODG clearly enhanced the expression of SREBP-1C and PPARg, but there were no appreciable variations in the expressions of VLDLR and PPARa between these groups (Fig. 6C).3.6. ODG regulated the composition and structure of the gut microbiota in high-fat diet mice
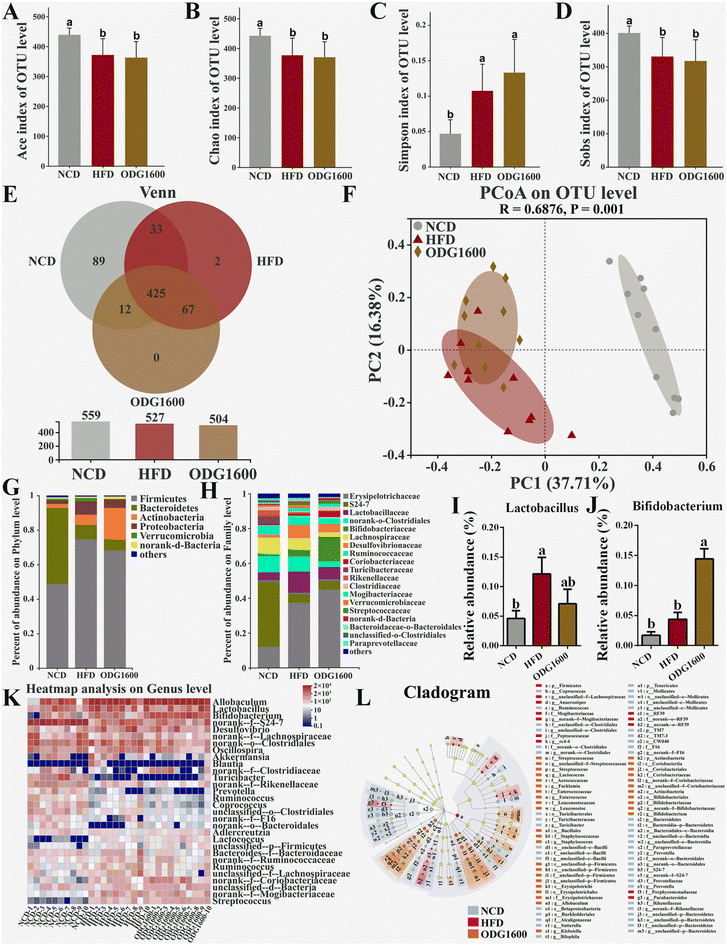
To investigate whether ODG could modify the gut microbiota in high-fat diet mice, we used 16S rRNA high-throughput sequencing to explore how the diversity and composition of the gut microbiota changed. The HFD and 1600 mg kg−1 ODG groups exhibited significantly lower Ace, Chao, and Sobs indexes and higher Simpson indexes than the NCD group (Fig. 7A–D). The NCD, HFD, and 1600 mg kg−1 ODG groups had 425 identical OTUs, while the NCD and HFD groups had 89 and 2 unique OTUs, respectively (Fig. 7E). Furthermore, on the PC1 axis which explained 37.71% of the total variance, the NCD group was clearly distinguished from the other two groups, whereas on the PC2 axis which accounted for 16.38% of the total variance, the 1600 mg kg−1 ODG group was distinguishable from the HFD group (Fig. 7F). The HFD and 1600 mg kg−1 ODG groups had higher Firmicutes and lower Bacteroidetes than the NCD group at the phylum level (Fig. 7G). 1600 mg kg−1 ODG contained the most Actinobacteria. At the family level, the HFD and 1600 mg kg−1 ODG groups had higher Erysipelotrichaceae and lower S24-7 than the NCD group, while the 1600 mg kg−1 ODG group had higher Bifidobateriaceae and lower Clostridiales and Lachnospiraceae than the other two groups. Furthermore, we performed a genus-level heatmap analysis and discovered that the 1600 mg kg−1 ODG group had significantly higher Bifidobacterium abundance than the other two groups, and the NCD and 1600 mg kg−1 ODG groups had lower Lactobacillus abundance than the HFD group, with a significant difference between the NCD and HFD groups (Fig. 7I–K). The LEfSe analysis showed that Bacteroidetes, S24-7, Clostridiales, and Turicibacterales were the dominant species in the NCD group; Firmicutes, Mogibacteriaceae, and Lachnospiraceae were the dominant species in the HFD group; and Allobaculum, Erysipelotrichaceae, Actinobacteria, and Bifidobacterium were the dominant species in the 1600 mg kg−1 ODG group (Fig. 7L).3.7. Correlation between the gut microbiota and metabolic and inflammatory parameters
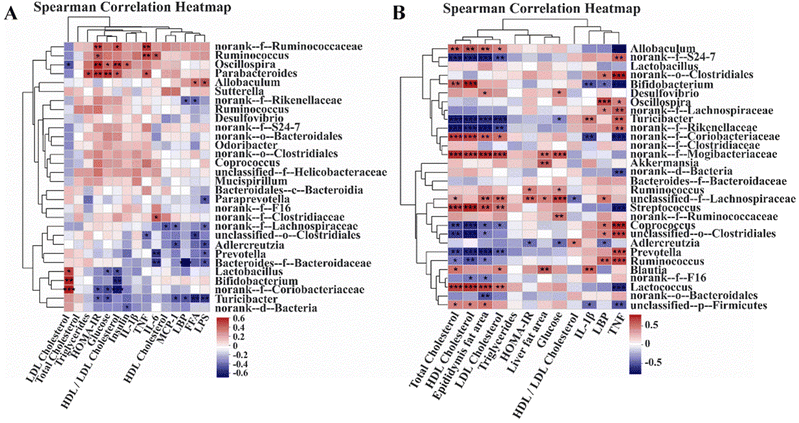
In order to investigate the relationship between the gut microbiota and metabolic health, we performed Spearman correlation heatmap analysis in Experiment 1 and Experiment 2. In Experiment 1, LDL cholesterol had a significantly strong negative correlation with Oscillospira and obviously strong positive correlations with Lactobacillus, Bifidobacterium, and norank-f-Coriobacteriaceae. The HOMA-IR index had significantly strong positive relationships with norank-f-Ruminococcaceae, Ruminococcus, Oscillospira, and Parabacteroides and significantly strong negative correlations with norank-f-Coriobacteriaceae and Turicibacter. Furthermore, inflammatory parameters such as LPS, LBP, and MCP-1 had significantly negative correlations with Turicibacter. In Experiment 2, total cholesterol, HDL cholesterol, epididymis fat area, and LDL cholesterol had considerably positive relationships with Lactococcus, Streptococcus, norank-f-Mogibacteriaceae, norank-f-Coriobacteriaceae, and Allobaculum, and had significantly negative correlations with Prevotella, Coprococcus, norank-f-Rikenellaceae, Turiciacter, and norank-f-S24-7. The HOMA-IR index had obviously strong positive correlations with Ruminococcus and unclassified-f-Lachnospiraceae, and a significantly strong negative relationship with Adlercreutzia. Remarkably, TNF had significantly positive correlations with Ruminococcus, Prevotella, unclassified-o-Clostridiales, Coprococcus, norank-f-Rikenellaceae, Turicibacter, norank-f-Lachnospiraceae, Oscillospira, and norank-f-S24-7, and obviously negative relationships with Lactococcus, Streptococcus, norank-f-Coriobacteriaceae, Bifidobacterium, and Allobaculum (Fig. 8).4. Discussion
In the current study, the effects of ODG on glucose and lipid metabolism, inflammation and the gut microbiota in mice fed a normal chow diet (Experiment 1) and a high-fat diet (Experiment 2), respectively, were investigated for the first time. Remarkably, ODG did not significantly change the body weight gain under either a normal chow diet or a high-fat diet. However, ODG had various effects on blood lipids depending on the dietary pattern. Under normal dietary conditions, ODG has no beneficial effect on lipid metabolism; however, it could improve the blood lipid metabolism under a high-fat diet. Nonetheless, ODG showed consistent effects on improving the insulin resistance and inflammation response under different dietary conditions. We further discovered that these metabolic improvements caused by ODG were linked to modulation of the gut microbiota.MCT is rapidly digested, absorbed, and metabolized in the body.1 Thus, MCT has a unique effect on lipid metabolism different from that of LCT. Several studies have found that when LCT was replaced with MCT in high-fat diets, the metabolic characteristics linked to obesity were improved,20 and the weight and fat gain were inhibited.21 However, we did not replace LCT with ODG as the only fat source in either regular or high-fat diets, but only introduced it as an additive in a modest amount to the feed. Then, we found that ODG did not influence the body weight gain and energy intake under the two dietary patterns, which might be attributed to the dosage. Nevertheless, LDL and HDL cholesterol, which are the risk factors and protective factors for atherosclerosis, respectively,22 showed opposite changes between a normal-chow diet and a high-fat diet. We hypothesized that under the normal chow dietary pattern, the fat intake of mice was low, and ODG might act as a fat supplement and contribute to the change in the atherosclerosis index. Then, we discovered that under a high-fat diet, 1600 mg kg−1 ODG showed remarkable effects on improving the ratio of HDL cholesterol to LDL cholesterol, implying its potential for alleviating atherosclerotic symptoms. Triglycerides are crucial to adipose tissue accumulation23 and are also a risk factor for cardiovascular disease.24 The liver is the main site for the endogenous synthesis of triglycerides and a key organ for triglyceride metabolism. Excess triglyceride accumulation in the liver can result in lipid deposition and the development of non-alcoholic fatty liver disease (NAFLD), which is frequently accompanied by an increase in SREBP-1C expression.25SREBP-1C, which is mainly expressed in the liver and adipocytes, is an important nuclear transcription factor in animal fat metabolism. It affects fat synthesis in animals by regulating the gene expression of enzymes related to fat metabolism.26 Here, we found that ODG decreased the contents of serum triglycerides in the normal-chow diet with a dosage dependence and further discovered that 1600 mg kg−1 ODG dramatically improved the increase of serum triglycerides caused by the high-fat diet. Simultaneously, our research also showed that 1600 mg kg−1 ODG obviously alleviated liver lipid deposition induced by a high-fat diet and down-regulated the expression of hepatic SREBP-1C. These results indicated that 1600 mg kg−1 ODG might have the potential to alleviate NAFLD. In addition, the effect of 1600 mg kg−1 ODG on reducing the abdominal fat size on a high-fat diet is encouraging. It has been demonstrated that SCD1 is a key player in lipid metabolism since it is a rate-limiting enzyme in the production of monounsaturated fatty acids from their saturated fatty acid precursors.27 The content of SCD1 is increased in patients with obesity and metabolic syndrome, and SCD1 inhibitors have been proposed as a novel treatment for metabolic syndrome and NAFLD.28 Here, we found that the high expression of SCD1 caused by HFD was reversed by 1600 mg kg−1 ODG. HMGCR is the key enzyme catalyzing de novo cholesterol synthesis in vivo, and its activity directly affects the rate of cholesterol synthesis and the level of cholesterol.29 It has been clinically confirmed that an HMGCR inhibitor can reduce the plasma concentration of total cholesterol, triglycerides, and LDL cholesterol, and increase the plasma concentration of HDL cholesterol.30 The receptor for LDL cholesterol, LDLR, is essential for cholesterol transport and clearance from the plasma to the cytoplasm.29 Our current research discovered that 1600 mg kg−1 ODG significantly up-regulated the expression of HMGCR and LDLR compared with the HFD group, which was consistent with the decreased LDL cholesterol and increased HDL cholesterol in the serum. The significant improvement in lipid metabolism, especially triglycerides and cholesterol, and related gene expression suggested a promising role in the treatment of dyslipidemia induced by HFD.
Furthermore, we found that all ODG dosages had a substantial influence on glucose metabolism when fed a normal-chow diet. Considering that HFD often causes abnormal blood glucose, insulin resistance, and even diabetes,31 it is necessary to investigate whether ODG could improve blood glucose metabolism under HFD. Previous studies have demonstrated that long-term use of MCT instead of lard as a fat source could significantly improve insulin resistance in mice.32 Interestingly, the addition of 1600 mg kg−1 GML (one of the MCFA monoglycerides) to the diet as a dietary additive also ameliorated insulin resistance induced by HFD.17 In our current research, we discovered that ODG significantly reduced the serum glucose content and insulin resistance index in both NCD and HFD, which indicated an excellent effect of ODG on the regulation of glucose metabolism. Moreover, FXR has a vital function in maintaining bile acid and cholesterol homeostasis, and in regulating glucose metabolism.33FXR activation improved hyperlipidemia and hyperglycemia in db/db mice by suppressing hepatic gluconeogenesis and boosting glycogen production.34 PEPCK and G6PC are key enzymes for gluconeogenesis and glucose release.35 Accordingly, the 1600 mg kg−1 ODG group up-regulated the expression of FXR and down-regulated the expression of PEPCK and G6PC compared to the HFD group in our study, which revealed more glucose metabolism and glycogen synthesis and less gluconeogenesis and glucose release by ODG treatment.
Inflammation contributes to the occurrence of atherosclerosis.36 In order to prevent and treat atherosclerosis, it may be possible to target inflammatory pathways. Improving inflammation is also the key therapeutic strategy for atherosclerosis. In fact, clinical research has recently conclusively shown that ameliorating inflammation helps to prevent the clinical side effects of atherosclerosis.37 We observed a strong effect of ODG on improving the serum inflammatory response under either NCD or HFD. Furthermore, genes which are important for regulating inflammation, such as TNF, IL-6, CCL2, and TLR4,38,39 were also significantly reduced by 1600 mg kg−1 ODG compared to the HFD group. After 1600 mg kg−1 ODG was added to the diet, the atherosclerosis indexes of LDL and HDL cholesterol were changed in a favorable direction, and the inflammation caused by HFD was also significantly improved, indicating that ODG has the potential to prevent and alleviate atherosclerosis.
There is growing proof that the gut microbiota plays a vital role in the development of obesity and obesity-related comorbidities such as insulin resistance, type 2 diabetes, and NAFLD.40 Previous research demonstrated that the monoglycerides of MCFAs could modulate the gut microbiota.14,18 However, a few studies have reported that MCT could affect the gut microbiota. It has been shown that a decrease in the diversity of the gut microbiota plays a significant role in the development of inflammatory bowel disease.41 Thus, the increased α-diversity of the gut microbiota under NCD by the addition of various dosages of ODG, particularly 1600 mg kg−1, may be a desirable health benefit. The results of intestinal microbiota β-diversity showed that the samples of all ODG-treated groups clustered closely, and gradually moved away from the NCD group, indicating that the gut microbiota composition changed in a specific direction after ODG treatment. Although the α-diversity did not change significantly, the ODG group showed a difference in the β-diversity compared with the HFD group under a HFD. Remarkably, ODG increased the abundance of Bifidobacterium under both NCD and HFD. A clinical investigation found that the abundance of Bifidobacterium was much lower in obese subjects and obese patients with type 2 diabetes than in healthy individuals, implying that Bifidobacterium may become a biomarker for the occurrence and progression of type 2 diabetes and obesity in the future.42 It has been proved that Bifidobacterium supplementation can improve insulin resistance.43 The Spearman correlation analysis in our current research showed that Bifidobacterium negatively correlated with the insulin resistance index under both NCD and HFD, indicating that Bifidobacterium might mediate the ameliorative effect of ODG on insulin resistance. Recent evidence suggested that Bifidobacterium supplementation reduced metabolic endotoxin concentrations and intestinal inflammation.44 Here, we found that Bifidobacterium had negative correlations with TNF and IL-1β under NCD, and had significant negative relationships with TNF, IL-1β, and LBP under a HFD, suggesting that Bifidobacterium might also mediate the ameliorative effect of ODG on inflammation. Interestingly, the gut microbiota may have different effects on the host under different dietary conditions. Bifidobacterium was significantly positively correlated with LDL cholesterol under NCD, while it was obviously positively correlated with HDL cholesterol under a HFD, indicating that the effects of Bifidobacterium on host lipid metabolism may be influenced by dietary conditions. The same result was also found in Turicibacter, which was increased by all doses of ODG under NCD. The opposite correlations were found between Turicibacter and inflammation and cholesterol under different dietary conditions. In fact, the alteration of the gut microbiota induced by GML under low-fat diet conditions contributed to the development of metabolic syndrome and systemic inflammation,16 while the gut microbiota modulated by GML under a high-fat diet contributed to the amelioration of obesity and metabolic syndrome.17,18 Thus, the dietary patterns might also influence the contribution of the gut microbiota to host metabolism and inflammation after ODG supplementation.
5. Conclusion
ODG decreased the insulin resistance index and inflammation in both NCD and HFD. ODG decreased the ratio of HDL to LDL cholesterol under NCD, but increased it under HFD. The results for gene expression under HFD were consistent with the results for glucose and lipid metabolism and inflammation. Furthermore, ODG changed the composition and structure of intestinal microbiota under both NCD and HFD conditions. The change in the gut microbiota caused by ODG supplementation was correlated with glucose and lipid metabolism and inflammation, which might be influenced by dietary patterns.Conflicts of interest
There are no conflicts to declare.References
- Y. Y. Lee, T. K. Tang, E. S. Chan, E. T. Phuah, O. M. Lai, C. P. Tan, Y. Wang, N. A. Ab Karim, N. H. Mat Dian and J. S. Tan, Medium chain triglyceride and medium-and long chain triglyceride: metabolism, production, health impacts and its applications – a review, Crit. Rev. Food Sci. Nutr., 2022, 62, 4169–4185 CrossRef CAS PubMed.
- M. E. Clegg, Medium-chain triglycerides are advantageous in promoting weight loss although not beneficial to exercise performance, Int. J. Food Sci. Nutr., 2010, 61, 653–679 CrossRef CAS PubMed.
- T. Maher and M. E. Clegg, Dietary lipids with potential to affect satiety: Mechanisms and evidence, Crit. Rev. Food Sci. Nutr., 2019, 59, 1619–1644 CrossRef CAS PubMed.
- E. Simon, A. Fernandez-Quintela, M. D. Portillo and A. S. Del Barrio, Effects of medium-chain fatty acids on body composition and protein metabolism in overweight rats, J. Physiol. Biochem., 2000, 56, 337–346 CrossRef CAS PubMed.
- X. Zhang, Y. Zhang, Y. Liu, J. Wang, Q. Xu, X. Yu, X. Yang, Z. Liu and C. Xue, Medium-chain triglycerides promote macrophage reverse cholesterol transport and improve atherosclerosis in ApoE-deficient mice fed a high-fat diet, Nutr. Res., 2016, 36, 964–973 CrossRef CAS PubMed.
- M. P. St-Onge, R. Ross, W. D. Parsons and P. J. H. Jones, Medium-chain triglycerides increase energy expenditure and decrease adiposity in overweight men, Obes. Res., 2003, 11, 395–402 CrossRef CAS PubMed.
- S. Nimbkar, M. M. Leena, J. A. Moses and C. Anandharamakrishnan, Medium chain triglycerides (MCT): State-of-the-art on chemistry, synthesis, health benefits and applications in food industry, Compr. Rev. Food Sci. Food Saf., 2022, 21, 843–867 CrossRef PubMed.
- H. Okubo, Y. Nakatsu, A. Kushiyama, T. Yamamotoya, Y. Matsunaga, M.-K. Inoue, M. Fujishiro, H. Sakoda, H. Ohno, M. Yoneda, H. Ono and T. Asano, Gut microbiota as a therapeutic target for metabolic disorders, Curr. Med. Chem., 2018, 25, 984–1001 CrossRef CAS PubMed.
- I. Sekirov, S. L. Russell, L. C. M. Antunes and B. B. Finlay, Gut microbiota in health and disease, Physiol. Rev., 2010, 90, 859–904 CrossRef CAS PubMed.
- S. Ussar, N. W. Griffin, O. Bezy, S. Fujisaka, S. Vienberg, S. Softic, L. Deng, L. Bry, J. I. Gordon and C. R. Kahn, Interactions between gut microbiota, host genetics and diet modulate the predisposition to obesity and metabolic syndrome, Cell Metab., 2015, 22, 516–530 CrossRef CAS PubMed.
- P. Gerard, Gut microbiota and obesity, Cell. Mol. Life Sci., 2016, 73, 147–162 CrossRef CAS PubMed.
- L. Miele, V. Giorgio, M. A. Alberelli, E. De Candia, A. Gasbarrini and A. Grieco, Impact of gut microbiota on obesity, diabetes, and cardiovascular disease risk, Curr. Cardiol. Rep., 2015, 17, 7 CrossRef PubMed.
- P. Zhuang, H. Li, W. Jia, Q. Shou, Y. E. Zhu, L. Mao, W. Wang, F. Wu, X. Chen, X. Wan, Y. Wu, X. Liu, Y. Li, F. Zhu, L. He, J. Chen, Y. Zhang and J. Jiao, Eicosapentaenoic and docosahexaenoic acids attenuate hyperglycemia through the microbiome–gut–organs axis in db/db mice, Microbiome, 2021, 9, 21 CrossRef PubMed.
- J. Zhang, F. Feng and M. Zhao, Glycerol monocaprylate modulates gut microbiota and increases short-chain fatty acids production without adverse effects on metabolism and inflammation, Nutrients, 2021, 13, 18 Search PubMed.
- S. Zhou, Y. Wang, J. J. Jacoby, Y. Jiang, Y. Zhang and L. L. Yu, Effects of medium-and long-chain triacylglycerols on lipid metabolism and gut microbiota composition in C57BL/6J mice, J. Agric. Food Chem., 2017, 65, 6599–6607 CrossRef CAS PubMed.
- Z. Jiang, M. Zhao, H. Zhang, Y. Li, M. Liu and F. Feng, Antimicrobial emulsifier–glycerol monolaurate induces metabolic syndrome, gut microbiota dysbiosis, and systemic low-grade inflammation in low-fat diet fed mice, Mol. Nutr. Food Res., 2018, 62, 1700547 CrossRef PubMed.
- M. Zhao, Z. Jiang, H. Cai, Y. Li, Q. Mo, L. Deng, H. Zhong, T. Liu, H. Zhang, J. X. Kang and F. Feng, Modulation of the gut microbiota during high-dose glycerol monolaurate-mediated amelioration of obesity in mice fed a high-fat diet, mBio, 2020, 11, e00190–e00120 Search PubMed.
- M. Zhao, H. Cai, Z. Jiang, Y. Li, H. Zhong, H. Zhang and F. Feng, Glycerol-monolaurate-mediated attenuation of metabolic syndrome is associated with the modulation of gut microbiota in high-fat-diet-fed mice, Mol. Nutr. Food Res., 2019, 63, 1801417 CrossRef PubMed.
- Y. Zhou, S. Tian, L. Qian, S. Jiang, Y. Tang and T. Han, DHA-enriched phosphatidylserine ameliorates non-alcoholic fatty liver disease and intestinal dysbacteriosis in mice induced by a high-fat diet, Food Funct., 2021, 12, 4021–4033 RSC.
- S. A. Rial, A. Jutras-Carignan, K.-F. Bergeron and C. Mounier, A high-fat diet enriched in medium chain triglycerides triggers hepatic thermogenesis and improves metabolic health in lean and obese mice, Biochim. Biophys. Acta, Mol. Cell Biol. Lipids, 2020, 1865, 14 CrossRef PubMed.
- Y. Murata, N. Harada, S. Yamane, K. Iwasaki, E. Ikeguchi, Y. Kanemaru, T. Harada, A. Sankoda, S. Shimazu-Kuwahara, E. Joo, H. Poudyal and N. Inagaki, Medium-chain triglyceride diet stimulates less GIP secretion and suppresses body weight and fat mass gain compared with long-chain triglyceride diet, Am. J. Physiol.: Endocrinol. Metab., 2019, 317, E53–E64 CrossRef CAS PubMed.
- C. R. Sirtori and R. Fumagalli, LDL-cholesterol lowering or HDL-cholesterol raising for cardiovascular prevention – A lesson from cholesterol turnover studies and others, Atherosclerosis, 2006, 186, 1–11 CrossRef CAS PubMed.
- H. C. Chen and R. V. Farese, Inhibition of triglyceride synthesis as a treatment strategy for obesity – Lessons from DGAT1-deficient mice, Arterioscler. Thromb. Vasc. Biol., 2005, 25, 482–486 CrossRef CAS PubMed.
- J. R. Bishop, K. I. Stanford and J. D. Esko, Heparan sulfate proteoglycans and triglyceride-rich lipoprotein metabolism, Curr. Opin. Lipidol., 2008, 19, 307–313 CrossRef CAS PubMed.
- U.-I. Ju, D.-W. Jeong, J. Seo, J. B. Park, J.-W. Park, K.-S. Suh, J. B. Kim and Y.-S. Chun, Neddylation of sterol regulatory element-binding protein 1c is a potential therapeutic target for nonalcoholic fatty liver treatment, Cell Death Dis., 2020, 11, 15 CrossRef PubMed.
- H.-Y. Seo, M.-K. Kim, Y.-A. Jung, B. K. Jang, E.-K. Yoo, K.-G. Park and I.-K. Lee, Clusterin decreases hepatic SREBP-1c expression and lipid accumulation, Endocrinology, 2013, 154, 1722–1730 CrossRef CAS PubMed.
- Y. Uto, Recent progress in the discovery and development of stearoyl CoA desaturase inhibitors, Chem. Phys. Lipids, 2016, 197, 3–12 CrossRef CAS PubMed.
- J. M. Brown and L. L. Rudel, Stearoyl-coenzyme A desaturase 1 inhibition and the metabolic syndrome: Considerations for future drug discovery, Curr. Opin. Lipidol., 2010, 21, 192–197 CrossRef CAS PubMed.
- S. Ma, W. Sun, L. Gao and S. Liu, Therapeutic targets of hypercholesterolemia: HMGCR and LDLR, Diabetes, Metab. Syndr. Obes.: Targets Ther., 2019, 12, 1543–1553 CrossRef CAS PubMed.
- B. A. Ference, K. K. Ray, A. L. Catapano, T. B. Ference, S. Burgess, D. R. Neff, C. Oliver-Williams, A. M. Wood, A. S. Butterworth, E. Di Angelantonio, J. Danesh, J. J. P. Kastelein and S. J. Nicholls, Mendelian randomization study of ACLY and cardiovascular disease, N. Engl. J. Med., 2019, 380, 1033–1042 CrossRef CAS PubMed.
- A. Kumar, K. Sundaram, J. Mu, G. W. Dryden, M. K. Sriwastva, C. Lei, L. Zhang, X. Qiu, F. Xu, J. Yan, X. Zhang, J. W. Park, M. L. Merchant, H. C. L. Bohler, B. Wang, S. Zhang, C. Qin, Z. Xu, X. Han, C. J. McClain, Y. Teng and H.-G. Zhang, High-fat diet-induced upregulation of exosomal phosphatidylcholine contributes to insulin resistance, Nat. Commun., 2021, 12, 21 CrossRef PubMed.
- S. Geng, W. Zhu, C. Xie, X. Li, J. Wu, Z. Liang, W. Xie, J. Zhu, C. Huang, M. Zhu, R. Wu and C. Zhong, Medium-chain triglyceride ameliorates insulin resistance and inflammation in high fat diet-induced obese mice, Eur. J. Nutr., 2016, 55, 931–940 CrossRef CAS PubMed.
- K. Ma, P. K. Saha, L. Chan and D. D. Moore, Farnesoid X receptor is essential for normal glucose homeostasis, J. Clin. Invest., 2006, 116, 1102–1109 CrossRef CAS PubMed.
- Y. Zhang, F. Y. Lee, G. Barrera, H. Lee, C. Vales, F. J. Gonzalez, T. M. Willson and P. A. Edwards, Activation of the nuclear receptor FXR improves hyperglycemia and hyperlipidemia in diabetic mice, Proc. Natl. Acad. Sci. U. S. A., 2006, 103, 1006–1011 CrossRef CAS PubMed.
- L. Valenti, R. Rametta, P. Dongiovanni, M. Maggioni, A. L. Fracanzani, M. Zappa, E. Lattuada, G. Roviaro and S. Fargion, Increased expression and activity of the transcription factor FOX01 in nonalcoholic steatohepatitis, Diabetes, 2008, 57, 1355–1362 CrossRef CAS PubMed.
- P. Raggi, J. Genest, J. T. Giles, K. J. Rayner, G. Dwivedi, R. S. Beanlands and M. Gupta, Role of inflammation in the pathogenesis of atherosclerosis and therapeutic interventions, Atherosclerosis, 2018, 276, 98–108 CrossRef CAS PubMed.
- O. Soehnlein and P. Libby, Targeting inflammation in atherosclerosis – from experimental insights to the clinic, Nat. Rev. Drug Discovery, 2021, 20, 589–610 CrossRef CAS PubMed.
- S. L. Montgomery and W. J. Bowers, Tumor necrosis factor-alpha and the roles it plays in homeostatic and degenerative processes within the central nervous system, J. Neuroimmune Pharmacol., 2012, 7, 42–59 CrossRef PubMed.
- T. Tanaka and T. Kishimoto, The biology and medical implications of interleukin-6, Cancer Immunol. Res., 2014, 2, 288–294 CrossRef CAS PubMed.
- E. E. Canfora, R. C. R. Meex, K. Venema and E. E. Blaak, Gut microbial metabolites in obesity, NAFLD and T2DM, Nat. Rev. Endocrinol., 2019, 15, 261–273 CrossRef CAS PubMed.
- A. Nishida, R. Inoue, O. Inatomi, S. Bamba, Y. Naito and A. Andoh, Gut microbiota in the pathogenesis of inflammatory bowel disease, Clin. J. Gastroenterol., 2018, 11, 1–10 CrossRef PubMed.
- A. Sroka-Oleksiak, A. Mlodzinska, M. Bulanda, D. Salamon, P. Major, M. Stanek and T. Gosiewski, Metagenomic analysis of duodenal microbiota reveals a potential biomarker of dysbiosis in the course of obesity and type 2 diabetes: a pilot study, J. Clin. Med., 2020, 9, 14 Search PubMed.
- J. Chen, R. Wang, X.-F. Li and R.-L. Wang, Bifidobacterium adoiescentis supplementation ameliorates visceral fat accumulation and insulin sensitivity in an experimental model of the metabolic syndrome, Br. J. Nutr., 2012, 107, 1429–1434 CrossRef CAS PubMed.
- J. J. Chen, R. Wang, X.-F. Li and R.-L. Wang, Bifidobacterium longum supplementation improved high-fat-fed-induced metabolic syndrome and promoted intestinal Reg I gene expression, Exp. Biol. Med., 2011, 236, 823–831 CrossRef CAS PubMed.
Footnotes |
| † Electronic supplementary information (ESI) available. See DOI: https://doi.org/10.1039/d2fo03059d |
| ‡ These authors contributed equally to this work. |
| This journal is © The Royal Society of Chemistry 2023 |

