 Open Access Article
Effect of the simulated digestion process on the chlorogenic acid trapping activity against methylglyoxal
Raffaella
Colombo
,
Mayra
Paolillo
,
Ilaria
Frosi
,
Lucia
Ferron
and
Adele
Papetti
 *
*
Department of Drug Sciences, University of Pavia, Viale Taramelli 12, 27100 Pavia, Italy. E-mail: adele.papetti@unipv.it; Fax: +39 0382422975; Tel: +39 0382987863
First published on 12th December 2022
Abstract
Chlorogenic acids are hydroxycinnamic derivatives widespread in food or food by-products, known for their antioxidant effects and ability to interfere with the formation of advanced glycation end products (AGEs). AGEs are potential glycotoxins involved in age-related disorders, such as diabetes, cardiovascular diseases, and neurological disorders. The ability of chlorogenic acids to inhibit AGE formation under physiological conditions needs further investigation other than the in vitro assays. Therefore, in this study, the capacity of 5-caffeoylquinic acid (5-CQA) to effectively trap methylglyoxal (MGO), an AGE precursor compound also present in daily consumed food, was investigated by evaluating 5-CQA and MGO metabolic fate when subjected to digestion. Two different in vitro digestion approaches (static based on the Infogest protocol and dynamic based on a novel millifluidic gastrointestinal model) were set up and the samples collected at different steps of the static and dynamic processes were analyzed by a validated RP-HPLC-DAD method. The obtained results indicated that the gastrointestinal process strongly affected the 5-CQA capacity to trap MGO and its resulting antiglycation activity. Therefore, preliminary investigation using advanced in vitro tests, particularly dynamic approaches, should always be performed to predict the effect of the digestion process on the potential bioactives present in food, food by-products, or plant extracts.
1. Introduction
Polyphenols are bioactive secondary plant metabolites which have different chemical structures and possess many healthy properties. In fact, a diet rich in polyphenols is believed to promote positive effects, reducing morbidity and the risk of development of many age-related disorders, such as cardiovascular diseases (atherosclerosis and diabetes) and neurodegenerative disorders.1–4 In these pathologies, the so-called advanced glycation end-products (AGEs), derived from complex endogenous and exogenous pathways (Maillard or non-enzymatic glycation reaction), play a very important role in toxicity,5–7 and the search for molecules that may inhibit AGE effects by different mechanisms has gained importance in the last few years.Interestingly, fruits, vegetables, and some beverages such as coffee and Cretan tea, together with their food industry by-products, have high contents of bioactive phenolic compounds such as chlorogenic acids and hydroxycinnamic derivatives well known as AGE inhibitors.8–14 In the last few years, many research studies focused on the capacity of caffeoylquinic acids to trap AGE precursors such as α-dicarbonyl compounds. Methylglyoxal (MGO) is one of the most reactive α-oxoaldehyde, and is endogenously formed and also generated in food during processing or storage. It highly contributes to the formation of early Maillard reaction products and AGEs by interacting with aminic groups of arginine and lysine residues and is responsible for damage particularly at the cardiovascular and renal levels.15–20
MGO and also glyoxal (GO)-trapping/inhibitory activity by polyphenols has been generally tested by classical in vitro assays, but bioaccessibility and bioavailability studies are mandatory to understand the real efficacy of these bioactive compounds ingested with food. Also, in this case, in vitro approaches reproducing gastro-intestinal processes are widely used, and the most common simulated digestion procedures are based on the use of suitable electrolytes and enzyme mixtures mimicking the gastrointestinal tract.21–24 To overcome the limitation of such static conventional in vitro simulated digestion, we previously set up a new advanced in vitro model consisting of modular bioreactors able to simulate flow-mediated transport and absorption of bioactives.25 This model allowed to simulate a dynamic multi-organ passage of MGO under experimental conditions closer to in vivo models. Human gastric stromal cells (GIST-882) and intestinal cancer cells (Caco-2) were selected as cellular models to reproduce a gastro-intestinal system in the simulation of MGO diet intake. By comparing the results obtained in the static (based on an adapted Infogest protocol) and the dynamic in vitro procedures, the key role of the gastric compartment in MGO absorption was evident for the dynamic system, differently from that observed using the static assay.
The aim of the present work was to investigate the effect of chlorogenic acid on MGO absorption using the in vitro static and dynamic approaches to simulate the gastro-intestinal compartments, in order to better understand the antiglycation properties (specifically MGO trapping capacity) observed for chlorogenic acids.11
2. Experimental
2.1. Reagents and chemicals
LC-grade water and MS-grade water were obtained from a Millipore Direct-QTM system (Merck-Millipore, Milan, Italy). LC- and MS-grade methanol, chloridric acid (37% ACS), perchloric acid (PCA, 70% ACS), calcium chloride dihydrate, potassium dihydrogen phosphate, magnesium chloride hexahydrate (≥99.0%), methylglyoxal (MGO, 40% aqueous solution), 3-deoxyglucosone (≥75%), o-phenylenediamine (OPD, ≥98%), α-amylase from porcine pancreas type VI-B, pepsin from porcine gastric mucosa (≥400 U mg−1), bile extract porcine, pancreatin (8 × USP) from porcine pancreas protease from Streptomyces griseus type XIV (≥3.5 U mg−1), viscozyme L cellulolytic enzyme mixture, RPMI-1640 medium, fetal bovine serum (FBS), L-glutamine (200 mM)–penicillin (10![[thin space (1/6-em)]](https://www.rsc.org/images/entities/char_2009.gif) 000 U)–streptomycin (10 mg mL−1) solution, poly-L-lysine solution, and the in vitro resazurin-based toxicology assay kit were supplied by Merck KGaA (Darmstadt, Germany). 5-O-Caffeoylquinic acid (5-CQA) and 3-O-caffeoylquinic acid (3-CQA) (>99%) were provided by Extrasynthese (Genay, Rhone, France). Acetic acid (96%), sodium chloride, sodium hydroxide pellets, ammonium carbonate, sodium bicarbonate, and potassium chloride were supplied by FarmItalia CARLO ERBA Reagents S.p.A. (Rodano, MI, Italy).
000 U)–streptomycin (10 mg mL−1) solution, poly-L-lysine solution, and the in vitro resazurin-based toxicology assay kit were supplied by Merck KGaA (Darmstadt, Germany). 5-O-Caffeoylquinic acid (5-CQA) and 3-O-caffeoylquinic acid (3-CQA) (>99%) were provided by Extrasynthese (Genay, Rhone, France). Acetic acid (96%), sodium chloride, sodium hydroxide pellets, ammonium carbonate, sodium bicarbonate, and potassium chloride were supplied by FarmItalia CARLO ERBA Reagents S.p.A. (Rodano, MI, Italy).
2.2. Standard solution preparation
Standard aqueous solutions of PCA (5 M) and OPD (2.5% w/v), electrolyte solutions for the in vitro static simulated digestion process, and hydrochloric acid (6 M) were freshly prepared and stored according to Colombo et al.25 and diluted immediately before use. 5-CQA (20 μM) and 5-CQA (20 μM)–MGO (80 μM or 300 μM) mixtures were prepared by diluting the standard solutions in water or in RPMI-1640 medium added with 10% FBS for the static and dynamic procedures, respectively.2.3. Cell cultures and cell viability assays
Fondazione IRCCS Istituto Nazionale dei Tumori (Milano, Italy) kindly donated GIST-882 cells, while Caco-2 cells were purchased from the European Collection of Authenticated Cell Cultures (Salisbury, UK). RPMI medium supplemented with 10% FBS and 200 mM L-glutamine–penicillin (10![[thin space (1/6-em)]](https://www.rsc.org/images/entities/char_2009.gif) 000 U)–streptomycin (10 mg mL−1) was used to culture the cell lines, at 37 °C under a controlled atmosphere (5% CO2–95% air). Confluent cells were split (split ratio 1
000 U)–streptomycin (10 mg mL−1) was used to culture the cell lines, at 37 °C under a controlled atmosphere (5% CO2–95% air). Confluent cells were split (split ratio 1![[thin space (1/6-em)]](https://www.rsc.org/images/entities/char_2009.gif) :
:![[thin space (1/6-em)]](https://www.rsc.org/images/entities/char_2009.gif) 5/1
5/1![[thin space (1/6-em)]](https://www.rsc.org/images/entities/char_2009.gif) :
:![[thin space (1/6-em)]](https://www.rsc.org/images/entities/char_2009.gif) 10) by trypsinization and used at the third and fourth passages after thawing. For all the experiments, the cells were plated at a density of 1 × 10⁴ viable cells per cm2.
10) by trypsinization and used at the third and fourth passages after thawing. For all the experiments, the cells were plated at a density of 1 × 10⁴ viable cells per cm2.
A resazurin-based assay kit, containing the alamar blue reagent (blue, non-toxic, cell permeable compound and virtually non-fluorescent), which is reduced by viable cells to a highly fluorescent compound, was used to assess cell viability. A 10× solution of the reagent was added to the culture medium at 37 °C at the end of the experiments. Samples were collected at different times, and fluorescence was read at 590 nm using an excitation wavelength of 560 nm. Each independent experiment was repeated three times, and each sample was collected in duplicate. The results were expressed as the relative fluorescence intensity (arbitrary units).
2.4. In vitro static simulated digestion process
Water solutions of 5-CQA (20 μM) and of MGO (80 μM or 300 μM)–5-CQA (20 μM) mixtures were prepared and immediately digested. Oral, gastric, and duodenal phases were prepared according to the INFOGEST protocol,23 while the colon phase was prepared following the procedure of Hamzalıoğlu et al.28 to simulate a complete gastrointestinal process according to Colombo et al.252.5. In vitro dynamic simulated digestion process
Multi-compartmental modular chambers were set up using the LiveFlow® system (IVTech Srl, Massarosa, LU, Italy) as previously described by Colombo et al.25 Briefly, two different chamber configurations were used to simulate the simil-physiological flow through the gastrointestinal digestion process, LB1 (tangential flow) for the gastric compartment (GIST-882 cells) and LB2 (cross-flow – top-down flow) for the intestinal compartment (Caco-2 cells). Gastric and intestinal cells were seeded as previously described and the experimental conditions of the LiveFlow® system were set up (medium volume, flow rate, and connection of chambers).25After seeding the cells in the sterilized chambers, the LiveFlow® system was placed in a cell culture incubator and the 5-CQA or 5-CQA–MGO mixtures were added to the medium. RPMI medium samples were collected from the system at different time periods (at 4 h from the LB1 chamber; at 1 h, 2 h, 4 h, 6 h, and 24 h from the LB2 chamber). Time 0 (t0) represented the initial compound concentration before any contact with the cells.
2.6. Sample preparation for 5-CQA and MGO quantification
From each static digestion phase or each monitored time period of the dynamic procedure, two samples were withdrawn and were collected and centrifuged at 5000 rpm for 10 min at 25 °C (Centrifuge 5804 R®, Eppendorf, Mississauga, Ontario, Canada). The supernatants of the 5-CQA and 5-CQA–MGO mixtures were incubated with 0.5 M PCA and centrifuged and then derivatized with 0.25% (w/v) OPD at 37 °C for 1 h, according to the protocol of Colombo et al.25 Before the HPLC analysis, all the digested samples were filtered (regenerated cellulose (RC) membrane filters, 0.2 μm; Phenomenex®, Torrance, California, USA).Each independent experiment was repeated three times, and each sample was collected in duplicate.
2.7 RP-HPLC-DAD analysis and method validation
Chromatographic separations of the digested samples were carried out using an Agilent Technologies 1200 series system (Santa Clara, CA, USA). A HPLC system was equipped with a quaternary gradient pump, a manual injector (Rheodyne valve, 20 μL sample loop), a degasser, a thermostatted column oven set at 25.0 ± 0.5 °C, and a diode-array detector (DAD). Data acquisition was performed using ChemStation software (B.04.01) on the Windows XP Professional operating system.Separations were carried out on a Gemini C-18 column (150 × 2.1 mm, ID; 5 μm; 110 Å) from Phenomenex (Torrance, CA, USA) and a binary mobile phase was used (A: 0.1% formic acid and B: methanol), and a gradient elution of 25 min was performed, which consisted of: 0 to 1 min, 40% B; 1 to 3.5 min, 50% B; 3.5 to 6.5 min, 55% B; 6.5 to 10 min, 70 B %; 10 to 25 min, 40%B. The flow rate was set at 0.3 mL min−1. Chromatograms were recorded at 315 nm (to quantify the signal of 2-methylquinoxaline, which is the MGO quinoxaline derivative) and 325 nm (to quantify 5-CQA and its derivatives).
Specificity, selectivity, linearity, limit of detection (LOD) and limit of quantification (LOQ), accuracy and precision (intra- and inter-day) were evaluated according to the ICH guidelines.29 No peak was observed in the region of the main peaks of MGO and 5-CQA when the chromatographic profiles of RPMI and those of the 5-CQA–MGO mixtures in the medium were compared and therefore the method can be considered specific. No change in the retention time of the analytes in the medium with respect to that of the corresponding standard was observed and therefore the method is also selective. The calibration curves for MGO (5–500 μM) and 5-CQA (5–50 μM) were constructed on the same day and on three consecutive days by plotting the peak area (Y) of the RPMI medium spiked with MGO and 5-CQA at five different experimental concentrations vs. the theoretical concentration (X), obtaining a mean correlation higher than 0.9980. LOD and LOQ, defined as the concentration levels at the signal-to-noise ratio of about 3 and 10, were 1.05 μM and 1.5 μM, and 3.25 μM and 5.1 μM, for MGO and 5-CQA, respectively. MGO and 5-CQA recovery values were calculated to determine the method accuracy by analysing three times on three consecutive days, each at three different concentration levels (5–250–500 μM for MGO and 5–25–50 μM for 5-CQA), and the values ranged from 95.06 to 101.98 and 94.98 to 102.34% for MGO and 5-CQA, respectively, indicating that the method is accurate. The same three concentration levels for each analyte were analysed six times within a single day for the intra-day assay and in triplicate per day for three consecutive days for the inter-day assay, to determine the method precision which was lower than 1.9%.
2.8. Statistical analyses
All data represented the mean ± SD of at least three replicated experiments, each analysed in duplicate. Differences were considered to be significant at P ≤ 0.05. All statistical analyses were carried out using Microsoft Excel 2010.3. Results and discussion
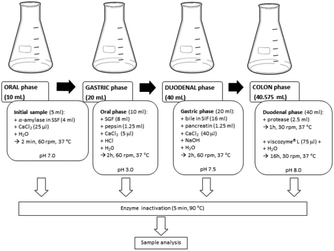
Our previous investigations indicated a high in vitro MGO trapping capacity of an aqueous artichoke waste extract rich in chlorogenic acids, among which 5-CQA was present in 20 μM concentration.11 Therefore, the aim of the present work was both to confirm the MGO trapping capacity of this chlorogenic acid isomer and to investigate the effect of the digestion process on such activity. Two different in vitro digestion approaches were used to simulate the gastrointestinal digestion. The first one was a slightly modified and integrated INFOGEST protocol, while the second one was a new dynamic simulation model, previously set up by our research group to investigate the metabolic fate of different MGO concentrations, mimicking a meal (80 μM), daily intake (300 μM), and weekly intake (1.3 mM), respectively.25 The metabolic fate of 5-CQA was also investigated to better understand the putative MGO trapping activity under simulated digestion conditions. To monitor the changes occurring during the processes involving the 5-CQA or 5-CQA–MGO mixtures, their concentrations were evaluated by RP-HPLC-DAD after the oral, gastric, duodenal, and colon in vitro static digestion steps, and after 4 h in LB1 and after 1, 2, 4, 6 and 24 h in LB2 in the in vitro dynamic system. In Fig. 1, a schematic representation of the static digestion approach used in this investigation is shown, while the scheme of the dynamic set up was the same as that was previously reported.253.1. 5-CQA trapping capacity against MGO
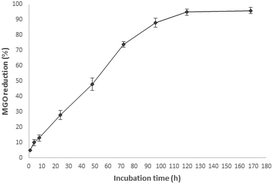
MGO is a 1,2-dicarbonyl compound promoting the glycation process, and the possibility to trap it by the action of 5-CQA could represent a good starting point for the identification of natural antiglycation compounds. Considering the activity recorded for an aqueous artichoke waste extract containing 20 μM 5-CQA, the trapping ability of an aqueous standard solution of 5-CQA at the same concentration was monitored at different time periods in the range of 1 h–7 days (Fig. 2).The results indicated a good trapping capacity of 5-CQA, starting from 2 days of incubation with increasing activity until five days when 5-CQA was able to quite completely trap MGO. These data confirmed the activities previously reported for chlorogenic acid in coffee silverskin26 and for the isomer 3-CQA tested at about 400 μM, and show an additional mechanism other than the antiglycation action based on the conjugation with the free amino groups of protein through covalent bonds occurring at 37 °C after 24 h.27
3.2. Effect of the in vitro static digestion process at the 5-CQA level
The in vitro static approach consisted of four different consecutive simulated digestion phases, i.e., oral, gastric, duodenal, and colon. It is based on the Infogest protocol,21 further implemented with the addition of a colon phase according to the procedure of Hamzalıoğlu et al.28. A 20 μM 5-CQA aqueous standard solution (subjected to derivatization to compare the results with those obtained by the below reported 5-CQA–MGO mixtures) was digested and the decrease of the 5-CQA concentration after each digestion step was monitored by HPLC and the results are reported in Table 1. The oral and gastric phases did not significantly affect the 5-CQA tested concentration and therefore it seems to be stable even under acidic gastric conditions, as previously generally reported in the literature;30–32 conversely, after the duodenal phase 5-CQA level was reduced to about 50%, and after the colon phase, no trace of this compound was detected, indicating putative complete 5-CQA metabolization.| Phase | 5-CQA (μM) |
|---|---|
| Not digested | 20 |
| Oral | 19.20 ± 1.30 |
| Gastric | 19.37 ± 1.48 |
| Duodenal | 9.35 ± 0.87 |
| Colon | n.d. |
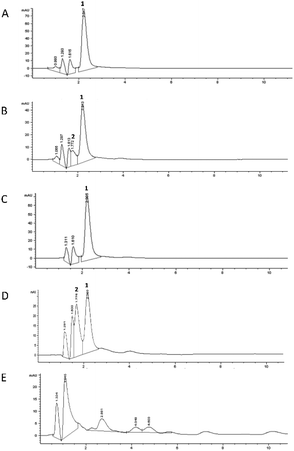
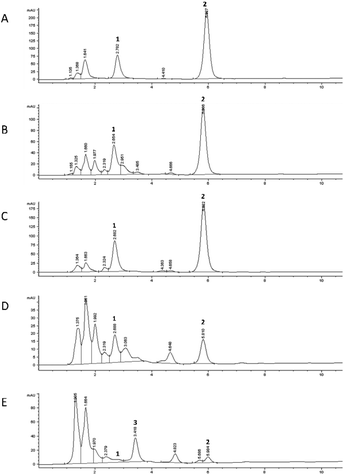
The chromatographic profile recorded for each digestion phase is reported in Fig. 3B–E, compared to the undigested mixture (Fig. 3A). The duodenal phase (Fig. 3D) indicated the presence of another peak (Rt: 1.77 min), in addition to that of 5-CQA (Rt: 2.21 ± 0.01 min), already present in trace in the oral profile (Fig. 3B), identified as 3-O-caffeoylquinic acid (3-CQA) considering its UV-Vis spectrum, selectivity, and co-chromatography with the standard compound.33 Therefore, the duodenal condition (pH: 7.5 ± 0.1) highly affected 5-CQA stability, leading to partial isomerization to 3-CQA. Our results are in agreement with those obtained using similar in vitro digestion models which have shown that the 3-CQA concentration increased in the duodenal phase because of the acyl-migration under alkaline conditions.34 In addition, other derivatives were detected in the profile of the colon phase (Fig. 3E), which represented 4.1%, 4.1%, and 6.7% of the total peak area, respectively (Rt: 2.88, 4.04, and 4.50 min, respectively). We could speculate that these compounds were generated, following stronger 5-CQA metabolization due to both the incubation for a longer time at 37 °C under basic conditions and being in contact with porcine pancreatin. In fact, Fernandez-Gomez et al.35 previously reported the formation of hydroquinone and quinone forms following the incubation of chlorogenic acid at pH 7.4 and 37 °C for 24 h, while Encarnaçāo et al.36 indicated 5-CQA as a good substrate for pancreatin, a mixture of different enzymes inducing the hydrolysis of this hydroxycinnamic acid derivative to give caffeic acid.
3.3. Effect of the in vitro dynamic digestion process at the 5-CQA level
A 20 μM 5-CQA solution was also tested in the dynamic LiveFlow system under the same experimental conditions previously described for MGO:25 4 h of contact with GIST-882 cells, which is considered a reasonable time frame to simulate a complete gastric digestion37 in the LB1 chamber, and increasing time periods of contact (1, 2, 4, 6, and 24 h) with Caco-2 cells in the LB2 chamber. The results are shown in Table 2.| Contact time | 5-CQA (μM) |
|---|---|
| 0 | 20 |
| 4 h GIST | 17.19 ± 0.85 |
| 1 h Caco-2 | 15.05 ± 1.09 |
| 2 h Caco-2 | 15.16 ± 0.72 |
| 4 h Caco-2 | 14.10 ± 0.71 |
| 6 h Caco-2 | 13.13 ± 0.66 |
| 24 h Caco-2 | 12.01 ± 0.48 |
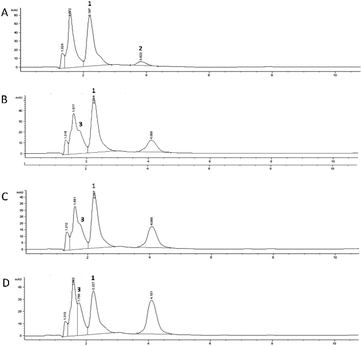
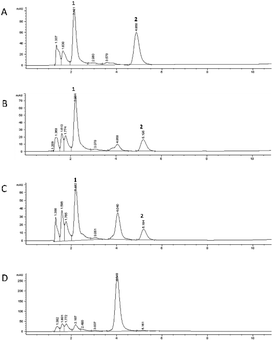
The 5-CQA concentration in the flowing medium decreased to about 15% after the gastric passage, highlighting a more marked effect than that recorded under static conditions. The HPLC profile recorded for 5-CQA dissolved in the medium before any cell contact (t0, Fig. 4A) is characterized by the presence of another compound eluted at Rt: 3.82 min, observed through the UV-Vis spectrum characterized by two λmax at 265 and 325 nm, respectively. This new species which disappeared after the contact with the GIST cells could be due to the simultaneous influence of the medium and the derivatizing agent, which could promote the formation of a 5-CQA adduct. A more marked reduction in the 5-CQA concentration was recorded after 1 h (Fig. 4C) of contact with the Caco-2 cells (about 20%), and reached to about 60% of the initial concentration after 24 h (Fig. 4D). In this system, partial metabolization of 5-CQA could be speculated. In fact, the HPLC chromatograms recorded for the samples after the contact with Caco-2 cells highlighted the presence of 3-CQA (Rt: 1.75 min, Fig. 4D) and a compound, already generated following the contact with GIST cells (Fig. 4B), characterized by a UV-Vis profile similar to that of 5-CQA and attributable to a hydroxycinnamic acid derivative, of which the concentration increased with increasing contact time with the Caco-2 cells (Fig. 4C and D). The spectral superimposition indicated that this derivative could be the same as that was already detected in the profile of the static colon phase at Rt: 4.04 min (Fig. 3E).
The results obtained using Caco-2 cells differed from those obtained in the colon phase of the static digestion protocol, because in the dynamic system, which better simulates human in vivo conditions, 5-CQA is still detectable after 24 h contact without complete metabolization. These data are in agreement with the results obtained by other research groups for this caffeoylquinic acid; 5-CQA is known to be poorly absorbed (by passive diffusion) by Caco-2, independent of the extracellular pH, and to undergo metabolization into caffeic acid.32,38 More recently, the presence of an active efflux transport which leads to low intestinal absorption in a Caco-2 cell model was demonstrated.39
In addition, our data are also supported by the results obtained using another dynamic Caco-2 model set up by Scherbl et al.40 Different from our gastrointestinal model, Scherbl et al. only measured the intestinal permeability of chlorogenic acids without considering the gastric step. Also in this case, 5-CQA instability and the isomerization to 3-CQA and 4-CQA were observed. Both studies using two different dynamic systems represent advanced in vitro models, which can be considered important approaches to predict the in vivo performance of different molecules with potential applications in the food and pharmaceutical fields.
3.4. MGO trapping capacity exerted by 5-CQA under in vitro static digestion conditions
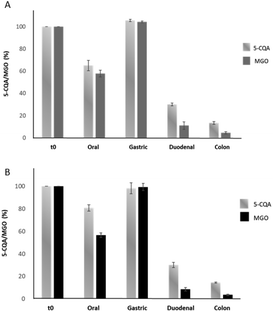
In order to evaluate whether 5-CQA could effectively trap MGO under simil-physiological conditions, its effect on two different MGO concentrations (80 μM and 300 μM, mimicking a meal and daily intake, respectively) during the digestion was evaluated using the aforementioned simulated static approach. Two sample solutions containing 20 μM 5-CQA and 80 μM (Mix1) or 20 μM 5-CQA and 300 μM MGO (Mix2) were tested. The concentrations of 5-CQA and MGO after the derivatization procedure using OPD (necessary to give the corresponding MGO detectable quinoxaline derivative) were monitored at 325 and 315 nm, respectively. In Fig. 5, the results obtained using this approach can be seen.After the oral step, a reduction of the 5-CQA concentration was recorded for both the mixtures as well as for MGO for which only about 60% of the concentration remained, independent from its starting concentration. The different results obtained for 5-CQA when alone or in mixture with MGO could indicate that 5-CQA alone is not able to form a complex with oral enzymes, different from MGO.25 The gastric phase did not affect 5-CQA and MGO; in fact, their levels were similar to those recorded for the undigested mixtures, indicating that the acidic pH and the presence of pepsin did not promote the metabolization, and therefore the capacity to trap MGO, rather their simple release from a putative complex, originated from the interaction with α-amylase and was promoted by the oral step pH and the contact time between the enzyme and the analytes. Considering the abovementioned findings, the gastric step could be simply considered a phase in which the gastric content is mixed and it can be anticipated that the real digestion step takes place at the duodenal and colon levels.23 Conversely, a reduction in the MGO and 5-CQA concentrations was recorded after the intestinal phases; in fact, after the duodenal phase only about 30% 5-CQA (about 6.80 μM) and 10% MGO remained in Mix1 and Mix2 (about 9 and 26 μM, respectively). These results agreed with the literature data about the effect of basic pH, which promotes the interaction between the analytes and the enzymes (pancreatin) in the in vitro static simulated digestion process,28 thereby supporting the metabolization. At the end of digestion (colon step), over 90% 5-CQA and over 95% MGO were metabolized. These results indicated that the metabolization kinetics of 5-CQA was not linked to the MGO concentration, because the recorded profile is very similar to that recorded for the digestion of 5-CQA alone tested at the same concentration. With regard to MGO, its reduction profile during digestion was independent from its starting concentration in the mixtures and the presence of 5-CQA did not affect its metabolization during the oral and gastric phases, as confirmed by the reduction values similar to those obtained for the digestion of MGO alone tested at the same concentrations.25 Conversely, a more marked reduction, mostly evident at the duodenal level, was recorded for MGO in the mixture with 5-CQA, thus indicating a putative trapping capacity of 5-CQA, previously observed in in vitro trapping model systems.11 In any case, MGO in Mix1 and Mix2 was almost totally metabolized at the end of the digestion, as observed when MGO was tested alone.25 The HPLC profile of the colon phase recorded at 325 nm (Fig. 6E) highlighted the presence of a compound at Rt: 4.82 min, of which the spectrum was superimposable with that recorded for the peaks already previously detected at Rt: 4.04 min for 5-CQA, when digested using both the static and dynamic approaches. In addition, another compound at Rt: 3.418 min was better detected at 315 nm only in the colon phase profile of the mixtures, putatively identified as the quinoxaline derivative of 3-deoxyglucosone by comparing the selectivity and UV-Vis spectrum with those obtained after derivatizing the 3-deoxyglucosone standard under the same experimental conditions. Therefore, 3-deoxyglucosone could be generated by MGO metabolization when MGO is in the presence of 5-CQA.
3.5. MGO trapping capacity exerted by 5-CQA under in vitro dynamic digestion conditions
To complete our study on the capacity of 5-CQA to trap MGO during a simulated digestion process, we also tested Mix1 and Mix2 using the dynamic system. The effect of both mixtures on GIST-882 and Caco-2 cell viability was assessed using the alamar blue assay (for more details see Methods section). 20 μM 5-CQA and 80 and 300 μM MGO were not toxic on both cell lines when tested alone and in the mixtures during the time period of the digestion process (cell viability was always >95% in the range of 1–24 h).The 5-CQA and MGO concentrations were monitored after the passage in the GIST-882 and Caco-2 cell compartments, as previously reported for 5-CQA; the concentrations measured at different time periods are shown in Table 3. As it is evident, 5-CQA did not interfere with MGO. In fact, the recorded metabolization trend for 5-CQA and MGO in the mixture was similar to that of every single compound under the same experimental conditions.25 Almost 25% decrease of the 5-CQA concentration was observed after the gastric phase in both mixtures, while after the intestinal passage, a slight decrease until 6 h was observed (35 to 40% of reduction of the initial concentration in Mix1 and Mix2). When the contact time was extended up to 24 h, a significant reduction in the 5-CQA concentration was observed (p < 0.05), since only 35% of the initial concentration was detectable in both mixtures. Conversely, only 22–23% of the initial MGO concentration was detected after the gastric phase, independent from the starting concentration, with more rapid kinetics compared to 300 μM MGO alone.25 After 24 h of contact with Caco-2 cells, MGO was almost no longer detectable both in Mix1 and in Mix2 (lower than 3% of the initial concentration).
| Contact time | 5-CQA (20 μM) + MGO (80 μM) | 5-CQA (20 μM) + MGO (300 μM) | ||
|---|---|---|---|---|
| 0 | 20 | 80 | 20 | 300 |
| 4 h GIST | 14.84 ± 0.04 | 17.60 ± 1.07 | 15.58 ± 1.04 | 68.94 ± 4.13 |
| 1 h Caco-2 | 13.52 ± 0.29 | 13.22 ± 0.01 | 14.05 ± 0.75 | 52.70 ± 4.40 |
| 2 h Caco-2 | 13.80 ± 0.14 | 11.51 ± 0.07 | 13.67 ± 0.28 | 46.32 ± 4.51 |
| 4 h Caco-2 | 13.20 ± 0.29 | 8.85 ± 0.01 | 12.85 ± 0.49 | 35.14 ± 2.77 |
| 6 h Caco-2 | 12.59 ± 0.51 | 7.05 ± 0.01 | 12.11 ± 0.68 | 27.64 ± 1.67 |
| 24 h Caco-2 | 7.22 ± 1.00 | 2.18 ± 0.13 | 6.90 ± 0.44 | 8.93 ± 1.09 |
Different from the static model, the data from the dynamic system suggested that the gastric phase could represent a key point in the process only when the two compounds are mixed; in fact, during the gastric passage, a decrease of both 5-CQA concentration and MGO concentration was observed, together with the formation of the same 5-CQA compound derivative (Rt: 4.04 ± 0.01) previously detected in the gastric and intestinal phases of 5-CQA (Fig. 7B–D).
Its concentration increased with the increase of the contact time with Caco-2 cells in LB2 (Fig. 7C and D). As regards the capacity to trap MGO, it was not confirmed in this system, as evident from MGO concentration at each monitoring time, which did not change when MGO is alone25 or in mixture.
4. Conclusions
Our work highlighted a very important issue concerning the need to investigate the bioaccessibility of a potential food bioactive compound using systems that are able to simulate the digestion process. In fact, as shown in this study, a compound well known for different bioactivities (specifically, the antiglycation capacity), such as 5-CQA, lacked its evident MGO trapping activity when tested in an in vitro model being subjected to the gastrointestinal process. Furthermore, studies performed using static biochemical digestion protocols in addition to the most recent dynamic cellular systems which are able to better simulate a simil-physiological environment using cells, membranes, and dynamic circulation could be a powerful tool to investigate the potential health benefits of these food components. Therefore, the dynamic bioreactor-based systems, after the validation of the models with different types of molecules (food components/nutrients, contaminants and drugs) could represent an interesting digestion platform useful for high throughput screening to also reduce the use of animal models. The investigation will continue in order to chemically identify the metabolites generated in the different digestion phases in the two applied approaches to better understand how 5-O-caffeoylquinic acid could contribute to reduce the glycation process in the presence of methylglyoxal.Author contributions
Raffaella Colombo: conceptualization, data curation, writing, and original draft preparation. Mayra Paolillo: conceptualization, formal analysis, and data curation. Ilaria Frosi: formal analysis, data curation, and investigation. Lucia Ferron: formal analysis, data curation, and investigation. Adele Papetti: conceptualization, resources, writing – review and editing, and supervision.Conflicts of interest
There are no conflicts to declare.Acknowledgements
The authors want to thank the Associazione Italiana Sommelier (AIS), Milan (Italy) delegation and Hotel Siesta, Lido di Camaiore (Italy), for their valuable contributions as financial supporters of the project “Organs in a box: a cure for us, a life for him” (during the years 2018–2020) by Universitiamo, the Pavia University Crowdfunding Platform.References
- M. Mushtaq and S. M. Wani, Polyphenols and human health: A review, Int. J. Pharma Bio Sci., 2013, 4, B338–B360 Search PubMed.
- G. C. Román, R. E. Jackson, R. Gadhia, A. N. Román and J. Reis, Mediterranean diet: The role of long-chain omega-3 fatty acids in fish; polyphenols in fruits, vegetables, cereals, coffee, tea, cacao and wine; probiotics and vitamins in prevention of stroke, age-related cognitive decline, and Alzheimer disease, Rev. Neurol., 2019, 175, 724–741 CrossRef PubMed.
- I. Arora, M. Sharma, L. Y. Sun and T.O. Tollefsbol, The Epigenetic Link between Polyphenols, Aging and Age-Related Diseases, Genes, 2020, 11, 1094 CrossRef CAS PubMed.
- P. Ebrahimi and A. Lante, Polyphenols: A comprehensive review of their nutritional properties, Open Biotechnol. J., 2021, 15, 164–172 CrossRef CAS.
- M. Hellwig, S. Gensberger-Reigl, T. Henle and M. Pischetsrieder, Food-derived 1,2-dicarbonyl compounds and their role in diseases, Semin. Cancer Biol., 2018, 49, 1–8 CrossRef CAS PubMed.
- H. J. Chun, Y. Lee, A. H. Kim and J. Lee, Methylglyoxal causes cell death in neural progenitor cells and impairs adult hippocampal neurogenesis, Neurotoxic. Res., 2016, 29, 419–431 CrossRef CAS.
- I. Nemet, L. Varga-Defterdarović and Z. Turk, Methylglyoxal in food and living organisms, Mol. Nutr. Food Res., 2006, 50, 1105–1117 CrossRef CAS.
- A. Gugliucci, D. H. Markowicz Bastos, J. Schulze and M. Ferreira Souza, Caffeic and chlorogenic acids in Ilex paraguariensis extracts are the main inhibitors of AGE generation by methylglyoxal in model proteins, Fitoterapia, 2009, 80, 339–344 CrossRef CAS.
- E. Verzelloni, D. Tagliazucchi, D. Del Rio, L. Calani and A. Conte, Antiglycative and antioxidative properties of coffee fractions, Food Chem., 2011, 124, 1430–1435 CrossRef CAS.
- M. Mesías, M. Navarro, V. Gökmen and F. J. Morales, Antiglycative effect of fruit and vegetable seed extracts: Inhibition of AGE formation and carbonyl-trapping abilities, J. Sci. Food Agric., 2013, 93, 2037–2044 CrossRef.
- M. Maietta, R. Colombo, R. Lavecchia, M. Sorrenti, A. Zuorro and A. Papetti, Artichoke (Cynara cardunculus L. var. scolymus) waste as a natural source of carbonyl trapping and antiglycative agents, Food Res. Int., 2017, 100, 780–790 CrossRef CAS PubMed.
- M. Khan, H. Liu, J. Wang and B. Sun, Inhibitory effect of phenolic compounds and plant extracts on the formation of advance glycation end products: A comprehensive review, Food Res. Int., 2020, 130, 108933 CrossRef CAS PubMed.
- I. González, M. A. Morales and A. Rojas, Polyphenols and AGEs/RAGE axis. Trends and challenges, Food Res. Int., 2020, 129, 108843 CrossRef PubMed.
- M. Maietta, R. Colombo, F. Corana and A. Papetti, Cretan tea (Origanum dictamnus L.) as a functional beverage: An investigation on antiglycative and carbonyl trapping activities, Food Funct., 2018, 9, 1545–1556 RSC.
- M. Hellwig, S. Gensberger-Reigl, T. Henle and M. Pischetsrieder, Food-derived 1,2-dicarbonyl compounds and their role in diseases, Semin. Cancer Biol., 2018, 49, 1–8 CrossRef CAS PubMed.
- J. Bellier, M. J. Nokin, E. Lardé, P. Karoyan, O. Peulen, V. Castronovo and A. Bellahcène, Methylglyoxal, a potent inducer of AGEs, connects between diabetes and cancer, Diabetes Res. Clin. Pract., 2019, 148, 200–211 CrossRef CAS PubMed.
- R. Kold-Christensen and M. Johannsen, Methylglyoxal Metabolism and Aging-Related Disease: Moving from Correlation toward Causation, Trends Endocrinol. Metab., 2020, 31, 81–92 CrossRef CAS.
- N. M. J. Hanssen, J. L. J. M. Scheijen, A. Jorsal, H.-H. Parving, L. Tarnow, P. Rossing, C. D. A. Stehouwer and C. G. Schalkwijk, Higher plasma methylglyoxal levels are associated with incident cardiovascular disease in individuals with type 1 diabetes: a 12-year follow-up study, Diabetes, 2017, 66, 2278–2283 CrossRef CAS PubMed.
- T. M. Jensen, D. Vistisen, T. Fleming, P. P. Nawroth, P. Rossing, M. E. Jørgensen, T. Lauritzen, A. Sandbæk and D. R. Witte, Methylglyoxal is associated with changes in kidney function among individuals with screen-detected type 2 diabetes mellitus, Diabetic Med., 2016, 33, 1625–1631 CrossRef CAS.
- N. M. J. Hanssen, C. D. A. Stehouwer and C. G. Schalkwijk, Methylglyoxal stress, the glyoxalase system, and diabetic chronic kidney disease, Curr. Opin. Nephrol. Hypertens., 2019, 28, 26–33 CrossRef CAS PubMed.
- M. Minekus, M. Alminger, P. Alvito, S. Ballance, T. Bohn, C. Bourlieu, F. Carrière, R. Boutrou, M. Corredig, D. Dupont, C. Dufour, L. Egger, M. Golding, S. Karakaya, B. Kirkhus, S. Le Feunteun, U. Lesmes, A. Macierzanka, A. Mackie, S. Marze, D. J. McClements, O. Mènard, I. Recio, C. N. Santos, R. P. Singh, G. E. Vegarud, M. S. J. Wickham, W. Weitschies and A. Brodkorb, A standardised static in vitro digestion method suitable for food-an international consensus, Food Funct., 2014, 5, 1113–1124 RSC.
- L. Egger, O. Ménard, C. Delgado-Andrade, P. Alvito, R. Assunção, S. Balance, A. Bradkorb, T. Cattenoz, A. Clemente, I. Comi, D. Dupont, G. Garcia-Llatas, M. J. Legarda, S. Le Feunteun, L. JanssenDuijghuijsen, S. Karakaya, U. Lesmes, A. R. Mackie, C. Martins, A. Meynier, B. Miralles, B. S. Murray, A. Pihlanto, G. Picariello, C. N. Santos, S. Simsek, I. Recio, N. Rigby, L. Rioux, H. Stoffers, A. Tavares, L. Tavares, S. Turgeon, E. K. Ulleberg, G. E. Vegarud, G. Vergères and R. Portmann, The harmonized INFOGEST in vitro digestion method: From knowledge to action, Food Res. Int., 2016, 88, 217–225 CrossRef CAS.
- A. Brodkorb, L. Egger, M. Alminger, P. Alvito, R. Assunção, S. Ballance, T. Bohn, C. Bourlieu-Lacanal, R. Boutrou, F. Carrière, A. Clemente, M. Corredig, D. Dupont, C. Dufour, C. Edwards, M. Golding, S. Karakaya, B. Kirkhus, S. Le Feunteun, U. Lesmes, A. Macierzanka, A. R. Mackie, C. Martins, S. Marze, D. J. McClements, O. Ménard, M. Minekus, R. Portmann, N. C. Santos, I. Souchon, R. P. Singh, G. E. Vergarud, M. S. J. Wickham, W. Weitschies and I. Recio, Infogest static in vitro simulation of gastrointestinal food digestion, Nat. Protoc., 2019, 14, 991–1040 CrossRef CAS PubMed.
- R. Colombo, L. Ferron, I. Frosi and A. Papetti, Advances in static in vitro digestion models after the COST action Infogest consensus protocol, Food Funct., 2021, 12, 7619–7636 RSC.
- R. Colombo, M. Paolillo and A. Papetti, A new millifluidic-based gastrointestinal platform to evaluate the effect of simulated dietary methylglyoxal intakes, Food Funct., 2019, 10, 4330–4338 RSC.
- M. Rebollo-Hernanz, B. Fernández-Gómez, M. Herrero, Y. Aguilera, M. A. Martín-Cabreja, J. Uribarri and M. D. del Castillo, Inhibition of the Maillard Reaction by Phytochemicals Composing an Aqueous Coffee Silverskin Extract via a Mixed Mechanism of Action, Foods, 2019, 8, 438 CrossRef CAS PubMed.
- B. Fernandez-Gomez, M. Ullate, G. Picariello, P. Ferranti, M. D. Mesa and M. D. del Castillo, New knowledge on the antiglycoxidative mechanism of chlorogenic acid, Food Funct., 2015, 6, 2081–2090 RSC.
- A. Hamzalıoğlu and V. Gökmen, Investigations on the reactions of α-dicarbonyl compounds with amino acids and proteins during in vitro digestion of biscuits, Food Funct., 2016, 6, 109–114 Search PubMed.
- ICH guideline Q2(R1), Validation of analytical procedures: text and methodology Guidance for Industry, 2021 Search PubMed.
- I. D'Antuono, A. Garbella, V. Linsalata, F. Minervini and A. Cardinali, Polyphenols from artichoke heads (Cynara cardunculus (L.) subsp. Scolymus Hayek): in vitro bio-accessibility, intestinal uptake and bioavailability, Food Funct., 2015, 6, 1268–1277 RSC.
- H. Yu, H. Jeon, J. Myeong, C. W. Kwon and P.-S. Chang, Influence of creamer addition on chlorogenic acid bioaccessibility and antioxidant activity of instant coffee during in vitro digestion, LWT–Food Sci. Technol., 2021, 151, 112178 CrossRef CAS.
- C. Monente, I. A. Ludwing, A. Stalmach, M. P. de Peña, C. and A. Crozier, In vitro studies on the stability in the proximal gastrointestinal tract and bioaccessibility in Caco-2 cells of chlorogenic acids from spent coffee grounds, Int. J. Food Sci. Nutr., 2015, 66, 657–664 CrossRef PubMed.
- M. N. Clifford, K. L. Johnston, S. Knight and N. Kuhnert, Hierarchial scheme for LC-MSn identification of chlorogenic acids, J. Agric. Food Chem., 2003, 51, 2900–2911 CrossRef CAS.
- A. A. Vilas-Boas, A. Oliveira, D. Jesus, C. Rodrigues, C. Figueira, A. Gomes and M. Pintado, Chlorogenic acids composition and the impact of in vitro gastrointestinal digestion on espresso coffee from single-dose capsule, Food Res. Int., 2020, 134, 109223 CrossRef CAS.
- B. Fernandez-Gomez, M. Ullate, G. Picariello and P. Ferranti, M.D Mesa and M.D. del Castillo. New knowledge on the antiglycoxidative mechanism of chlorogenic acid, Food Funct., 2015, 6, 2081–2090 RSC.
- J. A. Encarnaçāo, T. L. Farrell, A. Ryder, N. U. Kraut and G. Williamson, In vitro enzymic hydrolysis of chlorogenic acids in coffee, Mol. Nutr. Food Res., 2015, 59, 231–239 CrossRef.
- J. B. Dressman, R. R. Berardi, L. C. Dermentzoglou, T. L. Russell, S. P. Schmaltz, J. Barnett and K. M. Jarvenpaa, Upper gastrointestinal (GI) pH in young, healthy men and women, Pharm. Res., 1996, 7, 756–761 CrossRef.
- C. Dupas, A. M. Baglieri, C. Ordonaud, D. Tomé and M. N. Maillard, Chlorogenic acid is poorly absorbed, independently of the food matrix: a Caco-2 cells and rat chronic absorption study, Mol. Nutr. Food Res., 2006, 50, 1053–1060 CrossRef CAS.
- O. Mortelé, J. Jörissen, I. Spacova, S. Lebeer, A. L. N. van Nuijs and N. Hermans, Demonstrating the involvement of an active efflux mechanism in the intestinal absorption of chlorogenic acid and quinic acid using a Caco-2 bidirectional permeability assay, Food Funct., 2021, 12, 417–425 RSC.
- D. Scherbl, S. Muentnich and E. Richling, In vitro absorption studies of chlorogenic acids from coffee using the Using chamber model, Food Res. Int., 2014, 63, 456–463 CrossRef CAS.
| This journal is © The Royal Society of Chemistry 2023 |

