
 Open Access Article
 This Open Access Article is licensed under a
 Creative Commons Attribution 3.0 Unported Licence
Optimization of Pavlova gyrans biomass production and the fatty acid profile using a two-step approach†
Filipe
Maciel
 a,
Daniela
Couto
bc,
Pedro
Geada
*ad,
Hugo
Pereira
e,
José
Teixeira
ad,
M. Rosário
Domingues
bc,
Joana
Silva
f and
António
Vicente
ad
a,
Daniela
Couto
bc,
Pedro
Geada
*ad,
Hugo
Pereira
e,
José
Teixeira
ad,
M. Rosário
Domingues
bc,
Joana
Silva
f and
António
Vicente
ad
aCEB – Centre of Biological Engineering, University of Minho, Campus de Gualtar, Braga, Portugal. E-mail: pedrogeada@ceb.uminho.pt
bCESAM – Centre for Environmental and Marine Studies, Department of Chemistry, University of Aveiro, Santiago University Campus, Aveiro, Portugal
cMass Spectrometry Centre, LAQV-REQUIMTE, Department of Chemistry, University of Aveiro, Santiago University Campus, 3810-193 Aveiro, Portugal
dLABBELS – Associate Laboratory, Guimarães, Braga, Portugal
eGreenCoLab – Associação Oceano Verde, Universidade do Algarve, Campus de Gambelas, 8005-139 Faro, Portugal
fALLMICROALGAE, Natural Products S.A., R&D Department, Rua 25 de Abril 19, 2445-287 Pataias, Portugal
First published on 25th September 2023
Abstract
This work aimed to optimize and characterize the biomass production of Pavlova gyrans through a sequential multivariate approach. Among seventeen cultivation parameters, light intensity, NaNO3, and CuSO4·5H2O were identified as the most significative factors (p < 0.10) for biomass productivity. Together with NaH2PO4·H2O, these variables were further studied in order to maximize the biomass production of P. gyrans, with the optimum growth conditions identified as 700 μmolphotons m−2 s−1 light intensity, 1500 mg L−1 NaNO3, 6 μg L−1 CuSO4·5H2O and 40 mg L−1 NaH2PO4·H2O. These conditions allowed a 3.8-fold increase in biomass production (2.26 g AFDW per L) and improved the biochemical profile (p < 0.05) when compared with the control (Walne's medium). Namely, it was increased the contents of protein (from 10.59 to 30.76% DW), PUFAs (from 37.13 to 47.11% TFA), n − 3 FAs (26.49 to 38.27% TFA), and DHA (from 5.73 to 10.33% TFA). The nutritional value of the microalga (p < 0.05) was also improved, decreasing its atherogenic (AI – from 1.34 to 0.93) and thrombogenic (TI – from 0.45 to 0.24) indices, while the hypocholesterolemic index (HI) increased from 0.96 to 1.63. This work highlights the importance of different growth conditions in P. gyrans, playing a relevant role in the large-scale implementation of this microalga with beneficial nutritional composition for human consumption.
Sustainability spotlightMicroalgae have been highlighted due to their high CO2 biofixation, rapid growth and ability to thrive under a wide range of growth conditions (e.g. wastewater). Moreover, biomass enriched in high added-value compounds shows them as a valuable and contaminant-free source for food and nutraceutical applications. However, large-scale feasibility remains dependent on constraints such as optimization of biomass/biocompound production. In this work, multivariate optimization proved successful, identifying the optimal conditions that improved the biomass production with a higher content of omega-3 fatty acids and protein. Therefore, Pavlova gyrans is presented as a promising and sustainable source of nutritional lipids and protein, in line with the United Nations Sustainable Development Goals (SDG 2, 3, 9, 11, 12, 13, and 14). |
1. Introduction
Long-chain polyunsaturated fatty acids (PUFAs), especially docosahexaenoic acid (DHA – C22:6 n − 3) and eicosapentaenoic acid (EPA – C20:5 n − 3), are essential fatty acids (FAs) with important benefits for human and animal health. Several studies have highlighted the importance of their supplementation in human diet, mainly due to the associated antioxidant and anti-inflammatory properties and protective effect against various diseases,1–3 as well as acting as an enhancer of the visual and cognitive functions of children.4According to the European Food Safety Authority (EFSA), adults should have a daily intake of 250 to 500 mg of EPA and DHA.5 Actually, 30% of EPA and DHA for human consumption is accomplished by ingestion of fish and seafood products. Several constraints have been described for these sources, such as the overexploitation of fish stocks, seasonality, lower content of EPA/DHA of aquaculture fish, and inefficient retention and elongation of these FAs in high trophic level organisms.6,7 Moreover, western countries have been aware of the health consequences of the current diet enriched with pro-inflammatory n − 6 FAs.8 Thus, with an annual growth rate of 14.7% and an estimated market value of US$ 9.8 billion by 2025, it is crucial to develop and implement new sources of n − 3 FAs.9
Several oleaginous microalgae (lipid content > 20% w/w of dry weight (DW)) have been identified as a potential source of lipids for biotechnological applications. These microorganisms possess, as advantage, a rapid and controlled growth, higher plasticity allowing for their cultivation under a wide range of environmental conditions, higher productivities of high-added compounds (e.g., n − 3 FAs, pigments),10 and, unlike fish products, a contaminant-free food source.11
According to the algae species and nutrient conditions, it's possible to reach a lipid content of 53.2% DW with a n − 3 FA content varying from 0.06 to 9.32% DW.11,12 Pavlovophyceae, a well-known class of microalgae commonly used as feed in aquaculture, have been pointed out as a promising source of EPA (1.8% DW) and DHA (1.32% DW) for nutraceutical and pharmaceutical applications.13 Moreover, the absence of a cell wall and biomass enriched with biologically active compounds such as carotenoids (e.g., fucoxanthin), essential amino acids, and bioactive sterols (5% DW), reflected on Pavlovophyceae's great bioactivity, digestibility and bioaccessibility, making them a suitable option for human diet and feed.14–18
To meet the increasing market demand for these high nutritional species, a thorough understanding of the effects of cultivation conditions on biomass production and the biochemical profile is fundamental, contributing to successfully implement their large-scale production in a cost-effective manner. Some studies have described the impact of salinity,19 light intensity,20 carbon source,20–22 nitrogen availability and source,15,21,23 phosphorus,23 and micronutrient supplementation24–28 on the growth performance and fatty acid profile of Pavlovophyceae species. However, most of these studies addressed the influence of a limited number of growth conditions.
Therefore, this study aimed to carry out a complete evaluation of those conditions on the biomass production and FA profile of the microalga Pavlova gyrans. To our knowledge, this is the first study where the growth conditions of this strain were fully optimized regarding its biomass production. For that, a sequential optimization procedure was carried out: (i) screening of growth parameters through a Placket–Burman (PB) design; (ii) optimization of the key factors using a rotatable central composite design (RCCD).
2. Materials and methods
2.1. Microalga and inoculum preparation
The non-axenic microalga strain Pavlova gyrans (RCC1553) was grown in a 2 L flat bottom flask with Walne's medium (500 mg L−1 NaNO3) and a salinity of 30 psu under continuous aeration with a mixture of air and CO2 (8 mL min−1 – Alicat Scientific, USA) to maintain the pH value in the range of 8.0 ± 0.5. P. gyrans cultures were grown at room temperature under continuous illumination (100 μmolphotons m−2 s−1). The remaining nutrient concentrations used in the inoculum preparation were those used under level 0 conditions, as presented in Table 1.| Growth parameters | −1 | 0 | 1 | Effect | Standard error | t-Calc | p-Value | Significant | |
|---|---|---|---|---|---|---|---|---|---|
| Inoculum size (g AFDW per L) | x 1 | 0.1 | 0.2 | 0.3 | 0.009 | 0.010 | 0.855 | 0.411 | No |
| Salinity (psu) | x 2 | 20 | 30 | 40 | −0.003 | 0.010 | −0.269 | 0.793 | No |
| Light intensity (μmolphotons m−2 s−1) | x 3 | 150 | 450 | 750 | 0.065 | 0.010 | 6.346 | 0.000 | Yes |
| Air flow (mL min−1) | x 4 | 600 | 800 | 1000 | −0.002 | 0.010 | −0.171 | 0.867 | No |
| NaNO3 (mg L−1) | x 5 | 250 | 500 | 750 | 0.047 | 0.010 | 4.587 | 0.001 | Yes |
| NaH2PO4·H2O (mg L−1) | x 6 | 10 | 20 | 30 | 0.017 | 0.010 | 1.638 | 0.130 | No |
| Na2H2EDTA·2H2O (mg L−1) | x 7 | 22.5 | 45 | 67.5 | 0.007 | 0.010 | 0.660 | 0.523 | No |
| H3BO3 (mg L−1) | x 8 | 16.8 | 33.6 | 50.4 | 0.001 | 0.010 | 0.122 | 0.905 | No |
| FeCl3·6H2O (mg L−1) | x 9 | 0.65 | 1.3 | 1.95 | 0.000 | 0.010 | −0.024 | 0.981 | No |
| MnCl2·4H2O (μg L−1) | x 10 | 180 | 360 | 540 | −0.012 | 0.010 | −1.149 | 0.275 | No |
| NaHCO3 (mg L−1) | x 11 | 170 | 652 | 1134 | 0.002 | 0.010 | 0.204 | 0.842 | No |
| ZnCl2 (μg L−1) | x 12 | 10.25 | 21 | 31.75 | −0.010 | 0.010 | −0.986 | 0.345 | No |
| CoCl2·6H2O (μg L−1) | x 13 | 10 | 20 | 30 | −0.008 | 0.010 | −0.790 | 0.446 | No |
| (NH4)6Mo7O24·4H2O (μg L−1) | x 14 | 4.5 | 9 | 13.5 | −0.012 | 0.010 | −1.214 | 0.250 | No |
| CuSO4·5H2O (μg L−1) | x 15 | 10 | 20 | 30 | −0.020 | 0.010 | −1.980 | 0.073 | Yes |
| Thiamin (μg L−1) | x 16 | 50 | 100 | 150 | 0.008 | 0.010 | 0.790 | 0.446 | No |
| Cyanocobalamin (μg L−1) | x 17 | 2.5 | 5 | 7.5 | 0.001 | 0.010 | 0.138 | 0.892 | No |
| Mean | 0.142 | 0.005 | 27.724 | 0.000 | — | ||||
| Curvature | 0.033 | 0.023 | 1.446 | 0.176 | No | ||||
2.2. Experimental design
In addition, and according to the conclusions obtained in other studies with Pavlovophyceae species,31,32 it was also decided to evaluate the effect of NaHCO3 on the biomass production of P. gyrans. Table 2 displays the experimental matrix design for the 17 cultivation parameters considered. PB assays were performed in 1 L bubble column reactors (6.5 cm diameter and 43 cm height) using the inoculum as previously described. Individual stock solutions of the variables x5 to x17 were prepared, sterilized by filtration (0.2 μm), and added to each reactor to reach the concentration described in Table 1.
| #E | Variable (x) | t | P X | X max | ||||||||||||||||
|---|---|---|---|---|---|---|---|---|---|---|---|---|---|---|---|---|---|---|---|---|
| 1 | 2 | 3 | 4 | 5 | 6 | 7 | 8 | 9 | 10 | 11 | 12 | 13 | 14 | 15 | 16 | 17 | ||||
| 1 | 1 | −1 | −1 | −1 | −1 | 1 | −1 | 1 | −1 | −1 | 1 | 1 | −1 | −1 | 1 | 1 | −1 | 6 | 0.133 | 1.09 |
| 2 | 1 | 1 | −1 | −1 | −1 | −1 | 1 | −1 | 1 | −1 | −1 | 1 | 1 | −1 | −1 | 1 | 1 | 6 | 0.109 | 1.20 |
| 3 | 1 | 1 | 1 | −1 | −1 | −1 | −1 | 1 | −1 | 1 | −1 | −1 | 1 | 1 | −1 | −1 | 1 | 6 | 0.150 | 1.21 |
| 4 | 1 | 1 | 1 | 1 | −1 | −1 | −1 | −1 | 1 | −1 | 1 | −1 | −1 | 1 | 1 | −1 | −1 | 4 | 0.135 | 0.86 |
| 5 | 1 | 1 | 1 | 1 | 1 | −1 | −1 | −1 | −1 | 1 | −1 | 1 | −1 | −1 | 1 | 1 | −1 | 8 | 0.175 | 1.67 |
| 6 | −1 | 1 | 1 | 1 | 1 | 1 | −1 | −1 | −1 | −1 | 1 | −1 | 1 | −1 | −1 | 1 | 1 | 8 | 0.256 | 2.15 |
| 7 | 1 | −1 | 1 | 1 | 1 | 1 | 1 | −1 | −1 | −1 | −1 | 1 | −1 | 1 | −1 | −1 | 1 | 8 | 0.209 | 1.96 |
| 8 | −1 | 1 | −1 | 1 | 1 | 1 | 1 | 1 | −1 | −1 | −1 | −1 | 1 | −1 | 1 | −1 | −1 | 10 | 0.121 | 1.31 |
| 9 | 1 | −1 | 1 | −1 | 1 | 1 | 1 | 1 | 1 | −1 | −1 | −1 | −1 | 1 | −1 | 1 | −1 | 6 | 0.247 | 1.79 |
| 10 | 1 | 1 | −1 | 1 | −1 | 1 | 1 | 1 | 1 | 1 | −1 | −1 | −1 | −1 | 1 | −1 | 1 | 6 | 0.110 | 0.87 |
| 11 | −1 | 1 | 1 | −1 | 1 | −1 | 1 | 1 | 1 | 1 | 1 | −1 | −1 | −1 | −1 | 1 | −1 | 6 | 0.203 | 1.32 |
| 12 | −1 | −1 | 1 | 1 | −1 | 1 | −1 | 1 | 1 | 1 | 1 | 1 | −1 | −1 | −1 | −1 | 1 | 6 | 0.150 | 1.01 |
| 13 | 1 | −1 | −1 | 1 | 1 | −1 | 1 | −1 | 1 | 1 | 1 | 1 | 1 | −1 | −1 | −1 | −1 | 8 | 0.138 | 1.41 |
| 14 | 1 | 1 | −1 | −1 | 1 | 1 | −1 | 1 | −1 | 1 | 1 | 1 | 1 | 1 | −1 | −1 | −1 | 16 | 0.116 | 2.16 |
| 15 | −1 | 1 | 1 | −1 | −1 | 1 | 1 | −1 | 1 | −1 | 1 | 1 | 1 | 1 | 1 | −1 | −1 | 6 | 0.134 | 0.91 |
| 16 | −1 | −1 | 1 | 1 | −1 | −1 | 1 | 1 | −1 | 1 | −1 | 1 | 1 | 1 | 1 | 1 | −1 | 6 | 0.123 | 0.85 |
| 17 | 1 | −1 | −1 | 1 | 1 | −1 | −1 | 1 | 1 | −1 | 1 | −1 | 1 | 1 | 1 | 1 | 1 | 14 | 0.101 | 1.71 |
| 18 | −1 | 1 | −1 | −1 | 1 | 1 | −1 | −1 | 1 | 1 | −1 | 1 | −1 | 1 | 1 | 1 | 1 | 12 | 0.099 | 1.30 |
| 19 | 1 | −1 | 1 | −1 | −1 | 1 | 1 | −1 | −1 | 1 | 1 | −1 | 1 | −1 | 1 | 1 | 1 | 6 | 0.131 | 1.10 |
| 20 | −1 | 1 | −1 | 1 | −1 | −1 | 1 | 1 | −1 | −1 | 1 | 1 | −1 | 1 | −1 | 1 | 1 | 10 | 0.077 | 0.87 |
| 21 | −1 | −1 | 1 | −1 | 1 | −1 | −1 | 1 | 1 | −1 | −1 | 1 | 1 | −1 | 1 | −1 | 1 | 6 | 0.178 | 1.18 |
| 22 | −1 | −1 | −1 | 1 | −1 | 1 | −1 | −1 | 1 | 1 | −1 | −1 | 1 | 1 | −1 | 1 | −1 | 8 | 0.096 | 0.87 |
| 23 | −1 | −1 | −1 | −1 | 1 | −1 | 1 | −1 | −1 | 1 | 1 | −1 | −1 | 1 | 1 | −1 | 1 | 10 | 0.140 | 1.48 |
| 24 | −1 | −1 | −1 | −1 | −1 | −1 | −1 | −1 | −1 | −1 | −1 | −1 | −1 | −1 | −1 | −1 | −1 | 10 | 0.072 | 0.81 |
| 25 | 0 | 0 | 0 | 0 | 0 | 0 | 0 | 0 | 0 | 0 | 0 | 0 | 0 | 0 | 0 | 0 | 0 | 8 | 0.162 | 1.48 |
| 26 | 0 | 0 | 0 | 0 | 0 | 0 | 0 | 0 | 0 | 0 | 0 | 0 | 0 | 0 | 0 | 0 | 0 | 8 | 0.158 | 1.49 |
| 27 | 0 | 0 | 0 | 0 | 0 | 0 | 0 | 0 | 0 | 0 | 0 | 0 | 0 | 0 | 0 | 0 | 0 | 8 | 0.161 | 1.47 |
| 28 | 0 | 0 | 0 | 0 | 0 | 0 | 0 | 0 | 0 | 0 | 0 | 0 | 0 | 0 | 0 | 0 | 0 | 8 | 0.151 | 1.38 |
| 29 | 0 | 0 | 0 | 0 | 0 | 0 | 0 | 0 | 0 | 0 | 0 | 0 | 0 | 0 | 0 | 0 | 0 | 8 | 0.156 | 1.46 |
| 30 | 0 | 0 | 0 | 0 | 0 | 0 | 0 | 0 | 0 | 0 | 0 | 0 | 0 | 0 | 0 | 0 | 0 | 8 | 0.162 | 1.47 |
The remaining medium components and materials were sterilized by using an autoclave. The salinity in each reactor was adjusted using a concentrated stock solution of sea salt and quantified by using a salinity refractometer (Hanna HI96822). All experiments were performed at room temperature (25 ± 2 °C) under constant illumination provided by LED lighting (Primelux, Portugal). Photosynthetically active radiation (PAR) was measured at two points on the outer surface of the reactor (bottom and top) with a LI-250A light meter (LI-COR quantum sensor Q44069). Cultures were continuously bubbled with different airflows in order to assess different turbulence levels (Table 1) and pH (8.0 ± 0.5) was kept stable by injection of 6 mL min−1 of CO2.
Thus, to optimize biomass production based on these four factors (k = 4), a 24 factorial design without replicates (r = 1) – with 8 axial points and 3 replicates at the central point (cp) – was performed, totaling 27 trials (ESI Table S1†). The different results produced in the RCCD were fitted to a second-order model by a multiple linear regression to predict the different responses (Y) related to microalgae growth performance and its biochemical composition, using the following equation:
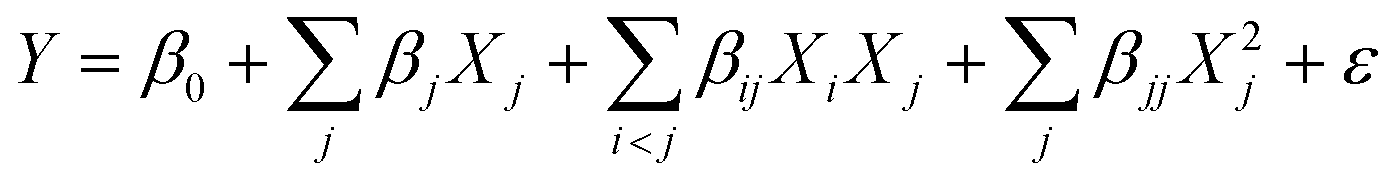 | (1) |
The levels (−α, −1, 0, 1, and +α) attributed to each factor were based on the outcomes of the PB design and are presented in Table 3. The inoculum size (x1), air flow (x4), and NaHCO3 concentration (x11) were fixed at level −1. In contrast, all the other variables that have shown a non-significant effect in the PB matrix were set at level 0 to not limit microalgae growth by nutrient deficiency. Cultivation procedures adopted were the same as described for PB experiments.
| −2 (−α) | −1 | 0 | 1 | 2 (+α) | |
|---|---|---|---|---|---|
| Light intensity (μmolphotons m−2 s−1), x3 | 200 | 350 | 500 | 650 | 800 |
| NaNO3 (mg L−1), x5 | 500 | 750 | 1000 | 1250 | 1500 |
| NaH2PO4·H2O (mg L−1), x6 | 10 | 20 | 30 | 40 | 50 |
| CuSO4·5H2O (μg L−1), x15 | 0 | 5 | 10 | 15 | 20 |
2.3. Growth analysis
Microalgal growth was monitored every 2 days by optical density (750 nm; Synergy HT, BioTek Instruments, Inc., U.S.A.) and its value converted to ash-free dry weight (AFDW), using the calibration curve previously determined: AFDW (g L−1) = 0.8991 × OD750 + 0.0054, R2 = 0.99. AFDW was determined by vacuum filtration of 10 mL of culture samples using pre-weighted glass filters (VWR) and their combustion in a muffle furnace (Nabertherm, Bremem, Germany) at 500 °C overnight. After filtration, samples were washed twice with 20 mL of ammonium formate (0.5 mol L−1), dried at 105 °C in a convection oven (WTCBinder, Germany) for 24 h and weighed. Dried filters were then re-combusted at 500 °C overnight and re-weighed to determine the ash-free dry weight. AFDW determined along P. gyrans growth was used to assess the biomass production parameters. Mean volumetric biomass productivity (PX) was calculated using the equation: | (2) |
2.4. Biochemical characterization
![[thin space (1/6-em)]](https://www.rsc.org/images/entities/char_2009.gif) :methanol (2:1 v/v) solution were added to a glass tube. The suspension was homogenized by vortexing for 2 min. After the extraction, the suspension was centrifuged at 2000 rpm for 10 min and the organic phase was collected in a new glass tube. The biomass residue was extracted twice, until there was no more pigmentation in the solvent. The combined organic phases collected in the new glass tube were dried under a stream of nitrogen gas and dissolved in 2 mL of dichloromethane and 1 mL of methanol, followed by 1 min vortexing for complete re-solubilization.
:methanol (2:1 v/v) solution were added to a glass tube. The suspension was homogenized by vortexing for 2 min. After the extraction, the suspension was centrifuged at 2000 rpm for 10 min and the organic phase was collected in a new glass tube. The biomass residue was extracted twice, until there was no more pigmentation in the solvent. The combined organic phases collected in the new glass tube were dried under a stream of nitrogen gas and dissolved in 2 mL of dichloromethane and 1 mL of methanol, followed by 1 min vortexing for complete re-solubilization.
Then, 0.75 mL of water were added and the mixture was vortexed for 2 min. The extracts were centrifuged at 2000 rpm for 10 min to separate the phases, with the lower phase (organic) being collected and transferred to a new glass tube. The remaining aqueous extract was re-extracted (with 2 mL of dichloromethane) two more times. The combined organic phases were dried under a nitrogen stream. The final dried lipid extract was re-suspended in dichloromethane, transferred to a pre-weighed vial, dried with nitrogen, weighed, and stored at −20 °C. Total lipids were determined by gravimetry using three replicates for each set of growth conditions and presented as the percentage of dry weight.
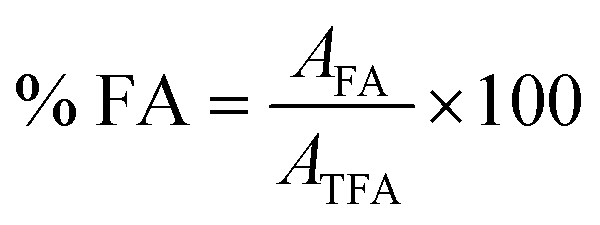 | (3) |
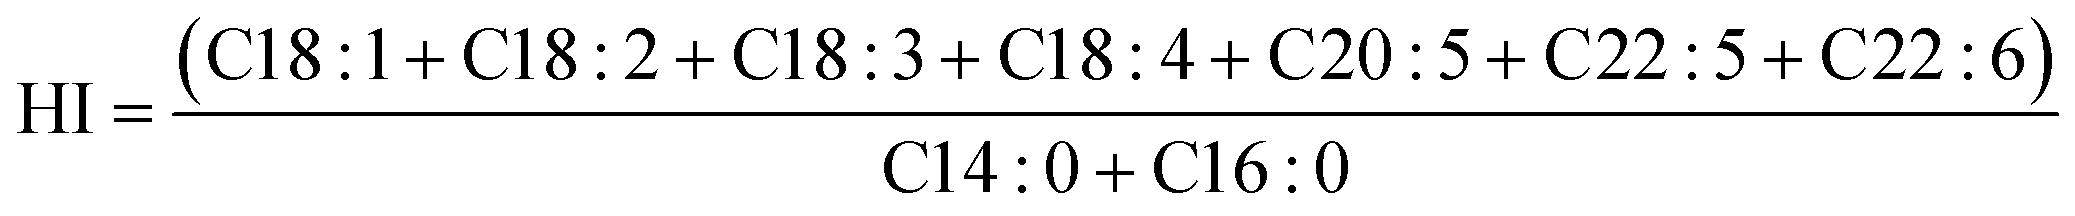 | (4) |
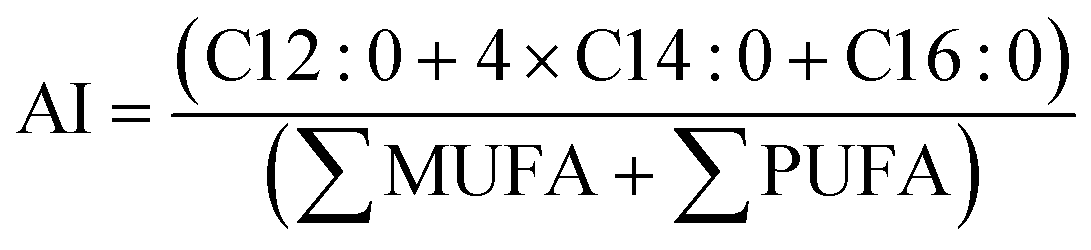 | (5) |
 | (6) |
2.5. Statistical analysis
The significant variables in the PB design were selected using a 90% confidence level (p < 0.10). Second order models of the RCCD were obtained using a 90% confidence level (p < 0.10), and the quality of the fitted model was statistically evaluated by analysis of variance (ANOVA) and coefficient determination (R2). PB and RCCD analyses were performed with the online software Protimiza Experimental Design (http://experimental-design.protimiza.com.br/). The experiments were performed in triplicate and their biochemical properties were analyzed by using differences among means using one-way ANOVA followed by Tukey's multiple comparison test at a 95% confidence level (software: GraphPad Prism version 8.0.2).3. Results and discussion
3.1. Identification of significant factors for biomass productivity of P. gyrans (PB design)
The biomass productivities achieved in the PB design are presented in Table 2, whereas the calculated effects, standard errors, and p-value of the seventeen variables assessed are described in Table 1. Among the thirty assays performed, Xmax ranged from 0.81 to 2.16 g AFDW per L (Table 2). Also, PX varied between 0.072 and 0.256 g AFDW per L per day, which resulted in the identification of the three independent variables (p < 0.10) that greatly affected P. gyrans growth: light intensity, NaNO3, and CuSO4·5H2O (Table 1).Light intensity was identified as the most significant abiotic factor (p < 0.001), showing a positive calculated effect, meaning that PX increased at higher light intensities within the tested interval. Although using a lower lighting range, Seoane et al.42 corroborated the positive effect of light on the growth kinetics of eleven haptophytes.
The second most important variable was NaNO3 (p = 0.001), favoring biomass production (positive effect). Nitrogen is a key nutrient due to its wide distribution in molecules (e.g. proteins, DNA, and RNA).43 It is an important factor for both biomass production and regulation of total lipid content and the FA profile.44 For instance, Pavlova sp. doubled its biomass production when supplemented with 400 mg L−1 NaNO3,15 while the biomass production of D. lutheri was positively affected until 160 mg L−1 NaNO3, with the above concentration values decreasing its growth performance.45
In contrast with the abovementioned significant variables, CuSO4·5H2O (p = 0.073) presented a negative effect, hindering biomass production at higher concentrations. This micronutrient is an important cofactor for several metalloproteins responsible for redox homeostasis and photosynthesis;46 however, as reported for Pavlova viridis, when excessively supplied, it can lead to oxidative stress, inhibiting microalgae growth and triggering protective mechanisms.26 This greater sensitivity was also described in other haptophytes, such as Isochrysis galbana, which presented a low EC50 value for copper.47
Although data from Table 1 excluded NaH2PO4·H2O concentration from the key factors involved in biomass production, this variable was also considered for further optimization through the RCCD. The main reasons for that option were the relative statistical importance (p = 0.13) and, mostly, the widely known biological role of phosphorus in microalgae growth and composition.24,33,48 To not limit microalgae growth in the RCCD, the remaining non-significant variables, except for NaHCO3, inoculum size and airflow (level −1), were set at level 0 in the RCCD.
3.2. Rotatable central composite design (RCCD)
| #E | P X | X max | Total lipids | SFAs | MUFAs | PUFAs | n − 3 FAs | EPA | DHA | Protein content |
|---|---|---|---|---|---|---|---|---|---|---|
| 1 | 0.262 | 1.57 | 21.95 ± 3.02 | 48.80 ± 1.31 | 18.22 ± 0.23 | 32.98 ± 1.12 | 26.63 ± 0.90 | 16.79 ± 0.72 | 5.11 ± 0.17 | 18.37 ± 0.13 |
| 2 | 0.196 | 1.57 | 20.75 ± 2.17 | 62.23 ± 1.40 | 22.73 ± 0.62 | 15.05 ± 1.42 | 11.79 ± 1.18 | 6.62 ± 0.55 | 3.52 ± 0.43 | 19.64 ± 0.04 |
| 3 | 0.240 | 1.92 | 20.53 ± 1.25 | 43.29 ± 1.69 | 18.63 ± 1.31 | 38.08 ± 0.84 | 32.26 ± 0.63 | 19.28 ± 1.11 | 6.80 ± 0.28 | 27.30 ± 0.47 |
| 4 | 0.249 | 1.99 | 20.76 ± 0.69 | 63.64 ± 2.78 | 20.73 ± 1.21 | 15.63 ± 1.64 | 12.60 ± 1.25 | 7.11 ± 0.72 | 3.75 ± 0.41 | 29.91 ± 0.52 |
| 5 | 0.205 | 1.64 | 28.34 ± 2.85 | 44.65 ± 0.27 | 20.44 ± 0.16 | 34.92 ± 0.11 | 27.80 ± 0.08 | 17.67 ± 0.16 | 5.40 ± 0.09 | 18.04 ± 0.29 |
| 6 | 0.167 | 1.67 | 24.57 ± 2.02 | 56.88 ± 0.48 | 25.50 ± 0.09 | 17.62 ± 0.56 | 13.98 ± 0.50 | 8.99 ± 0.43 | 3.06 ± 0.31 | 17.79 ± 0.37 |
| 7 | 0.239 | 1.91 | 25.66 ± 1.80 | 46.37 ± 1.72 | 19.65 ± 1.26 | 33.97 ± 2.21 | 27.80 ± 2.29 | 18.35 ± 2.27 | 4.74 ± 0.07 | 28.49 ± 0.21 |
| 8 | 0.211 | 2.11 | 22.09 ± 0.41 | 62.78 ± 2.30 | 22.68 ± 0.84 | 14.54 ± 1.59 | 11.54 ± 1.18 | 7.33 ± 0.70 | 2.79 ± 0.33 | 25.23 ± 0.35 |
| 9 | 0.217 | 1.30 | 22.81 ± 1.49 | 45.82 ± 1.79 | 18.54 ± 0.37 | 35.64 ± 2.02 | 29.43 ± 1.75 | 18.84 ± 1.10 | 5.31 ± 0.47 | 22.51 ± 0.31 |
| 10 | 0.255 | 1.53 | 19.95 ± 1.90 | 68.95 ± 2.05 | 18.59 ± 1.10 | 12.46 ± 1.34 | 9.49 ± 0.98 | 5.35 ± 0.65 | 2.84 ± 0.29 | 15.61 ± 0.20 |
| 11 | 0.215 | 1.72 | 20.04 ± 1.08 | 42.40 ± 4.73 | 18.33 ± 0.64 | 39.28 ± 4.10 | 33.14 ± 3.57 | 20.14 ± 2.37 | 5.52 ± 0.66 | 37.57 ± 0.28 |
| 12 | 0.228 | 1.82 | 20.87 ± 0.77 | 61.26 ± 3.57 | 21.95 ± 1.36 | 16.79 ± 2.69 | 13.47 ± 2.25 | 6.70 ± 0.84 | 4.86 ± 1.28 | 33.25 ± 1.02 |
| 13 | 0.183 | 1.46 | 24.12 ± 1.29 | 44.93 ± 2.23 | 21.01 ± 0.49 | 34.06 ± 2.04 | 27.67 ± 1.68 | 16.80 ± 1.08 | 6.26 ± 0.36 | 24.65 ± 0.66 |
| 14 | 0.166 | 1.66 | 25.23 ± 1.76 | 58.76 ± 0.11 | 25.28 ± 0.40 | 15.96 ± 0.51 | 12.36 ± 0.36 | 7.70 ± 0.31 | 2.86 ± 0.08 | 17.43 ± 0.34 |
| 15 | 0.165 | 1.65 | 17.59 ± 1.31 | 44.15 ± 2.98 | 22.59 ± 0.22 | 33.26 ± 3.10 | 27.38 ± 2.82 | 16.39 ± 2.09 | 4.30 ± 0.80 | 35.47 ± 0.94 |
| 16 | 0.220 | 1.76 | 22.46 ± 1.38 | 60.76 ± 1.49 | 23.72 ± 0.23 | 15.52 ± 1.42 | 12.26 ± 1.18 | 7.52 ± 0.59 | 2.99 ± 0.42 | 28.65 ± 0.09 |
| 17 | 0.209 | 1.67 | 24.46 ± 0.97 | 45.54 ± 0.80 | 18.69 ± 0.44 | 35.76 ± 0.83 | 29.44 ± 0.73 | 18.72 ± 0.58 | 5.27 ± 0.14 | 27.73 ± 0.03 |
| 18 | 0.234 | 1.87 | 23.38 ± 2.10 | 61.65 ± 2.68 | 23.45 ± 0.87 | 14.91 ± 1.81 | 12.05 ± 1.50 | 7.64 ± 0.97 | 2.89 ± 0.42 | 19.71 ± 0.02 |
| 19 | 0.222 | 1.33 | 23.27 ± 2.30 | 59.28 ± 1.84 | 23.02 ± 0.55 | 17.69 ± 1.48 | 13.48 ± 1.13 | 8.67 ± 0.78 | 3.06 ± 0.22 | 14.51 ± 0.10 |
| 20 | 0.234 | 2.34 | 17.45 ± 1.28 | 56.37 ± 0.53 | 23.21 ± 0.80 | 20.42 ± 0.28 | 16.11 ± 0.25 | 9.73 ± 0.13 | 4.27 ± 0.17 | 28.61 ± 1.83 |
| 21 | 0.227 | 1.36 | 18.73 ± 2.51 | 59.50 ± 0.85 | 22.77 ± 0.35 | 17.72 ± 0.59 | 13.97 ± 0.52 | 7.74 ± 0.37 | 4.08 ± 0.30 | 37.71 ± 0.63 |
| 22 | 0.245 | 1.96 | 24.22 ± 2.72 | 61.10 ± 4.12 | 20.23 ± 2.49 | 18.67 ± 2.37 | 14.31 ± 1.96 | 8.83 ± 1.08 | 3.68 ± 0.68 | 18.53 ± 0.21 |
| 23 | 0.225 | 1.80 | 23.09 ± 2.61 | 42.47 ± 0.24 | 18.89 ± 0.34 | 38.64 ± 0.57 | 32.07 ± 0.44 | 20.13 ± 0.31 | 6.17 ± 0.08 | 24.41 ± 0.41 |
| 24 | 0.199 | 1.59 | 21.17 ± 0.95 | 39.09 ± 0.92 | 20.06 ± 0.78 | 40.85 ± 0.89 | 33.80 ± 0.72 | 20.32 ± 0.51 | 6.91 ± 0.16 | 32.09 ± 0.87 |
| 25 | 0.234 | 1.87 | 21.16 ± 0.07 | 64.60 ± 0.63 | 22.56 ± 0.35 | 12.84 ± 0.35 | 9.70 ± 0.32 | 6.09 ± 0.14 | 2.37 ± 0.17 | 21.45 ± 0.30 |
| 26 | 0.240 | 1.92 | 21.90 ± 2.30 | 59.47 ± 2.51 | 22.04 ± 0.98 | 18.49 ± 1.56 | 14.17 ± 1.19 | 9.28 ± 0.74 | 3.16 ± 0.37 | 22.14 ± 0.61 |
| 27 | 0.236 | 1.89 | 22.10 ± 1.46 | 56.71 ± 1.73 | 22.83 ± 0.06 | 20.46 ± 1.78 | 16.07 ± 1.49 | 10.08 ± 0.68 | 4.04 ± 0.74 | 23.52 ± 0.19 |
As described in Table 5, and only using the significant terms (p < 0.10), these responses were used to calculate the regression coefficients and to generate a one-order model for PX and a second-order model for Xmax, each one as a function of coded independent variables. Analysis of variance (ANOVA) was carried out to assess the model's fitness. The mathematical model generated for the dependent variable PX showed a low value of R2 (32.0%), turning the production of contour curves unfeasible. This may be explained by the lower range of PX values obtained.49 On the other hand, Xmax presented a satisfactory R2 (84.1%) as well as Fcalc > Ftab, which allowed the generation of the second-order model and subsequent contour curves, as presented in Fig. 1.
| R 2 | F calc | F tab | |
|---|---|---|---|
| a x 1: inoculum size (g AFDW per L); x2: salinity (psu); x3: light intensity (μmolphotons m−2 s−1); x4: air flow (mL min−1); x5: NaNO3 (mg L−1); x6: NaH2PO4·H2O (mg L−1); x7: Na2H2EDTA·2H2O (mg L−1); x8: H3BO3 (mg L−1); x9: FeCl3·6H2O (mg L−1); x10: MnCl2·4H2O (μg L−1); x11: NaHCO3 (mg L−1); x12: ZnCl2 (μg L−1); x13: CoCl2·6H2O (μg L−1); x14: (NH4)6Mo7O24·4H2O (μg L−1); x15: CuSO4·5H2O (μg L−1); x16: thiamin (μg L−1); x17: cyanocobalamin (μg L−1). | |||
| P X (g AFDW per L per day) = 0.22 − 0.01x6 + 0.01x3x15 | 32.0 | 5.66 | 2.54 |
| X max (g AFDW per L) = 1.82 + 0.06x3 + 0.19x5 + 0.07x6 − 0.05x62 − 0.08x15 − 0.04x152 | 84.1 | 17.59 | 2.09 |
| Protein content (% w w−1) = 22.36 − 1.71x3 + 5x5 − 1.95x6 + 1.37x62 + 1.91x15 + 1.40x152 − 1.60x3x15 | 84.44 | 14.73 | 2.06 |
| Total lipids (% w w−1) = 21.61 + 0.64x32 − 1.22x5 + 1.39x6 − 0.64x15 + 0.57x3x5 + 0.77x3x15 − 0.70x5x6 − 0.68x6x15 | 84.25 | 12.04 | 2.04 |
| SFAs% TFA = 59.62 + 6.96x3 − 1.49x32 − 4.69x152 + 1.50x5x6 | 88.20 | 41.10 | 2.22 |
| MUFAs% TFA = 21.94 + 1.39x3 + 0.75x6 − 0.67x152 | 58.50 | 10.81 | 2.34 |
| PUFAs% TFA = 18.07 − 8.35x3 + 1.83x32 + 5.43x152 | 91.97 | 87.83 | 2.34 |
| ∑n − 3 FAs% TFA = 14.06 − 7.06x3 + 1.71x32 + 4.76x152 | 91.27 | 80.11 | 2.34 |
| EPA% TFA = 8.60 − 4.55x3 + 1.13x32 + 2.89x152 + 0.73x3x6 | 92.29 | 65.85 | 2.22 |
| DHA% TFA = 3.65 − 0.90x3 − 0.25x6 + 0.72x152 − 0.43x5x6 | 82.39 | 25.84 | 2.22 |
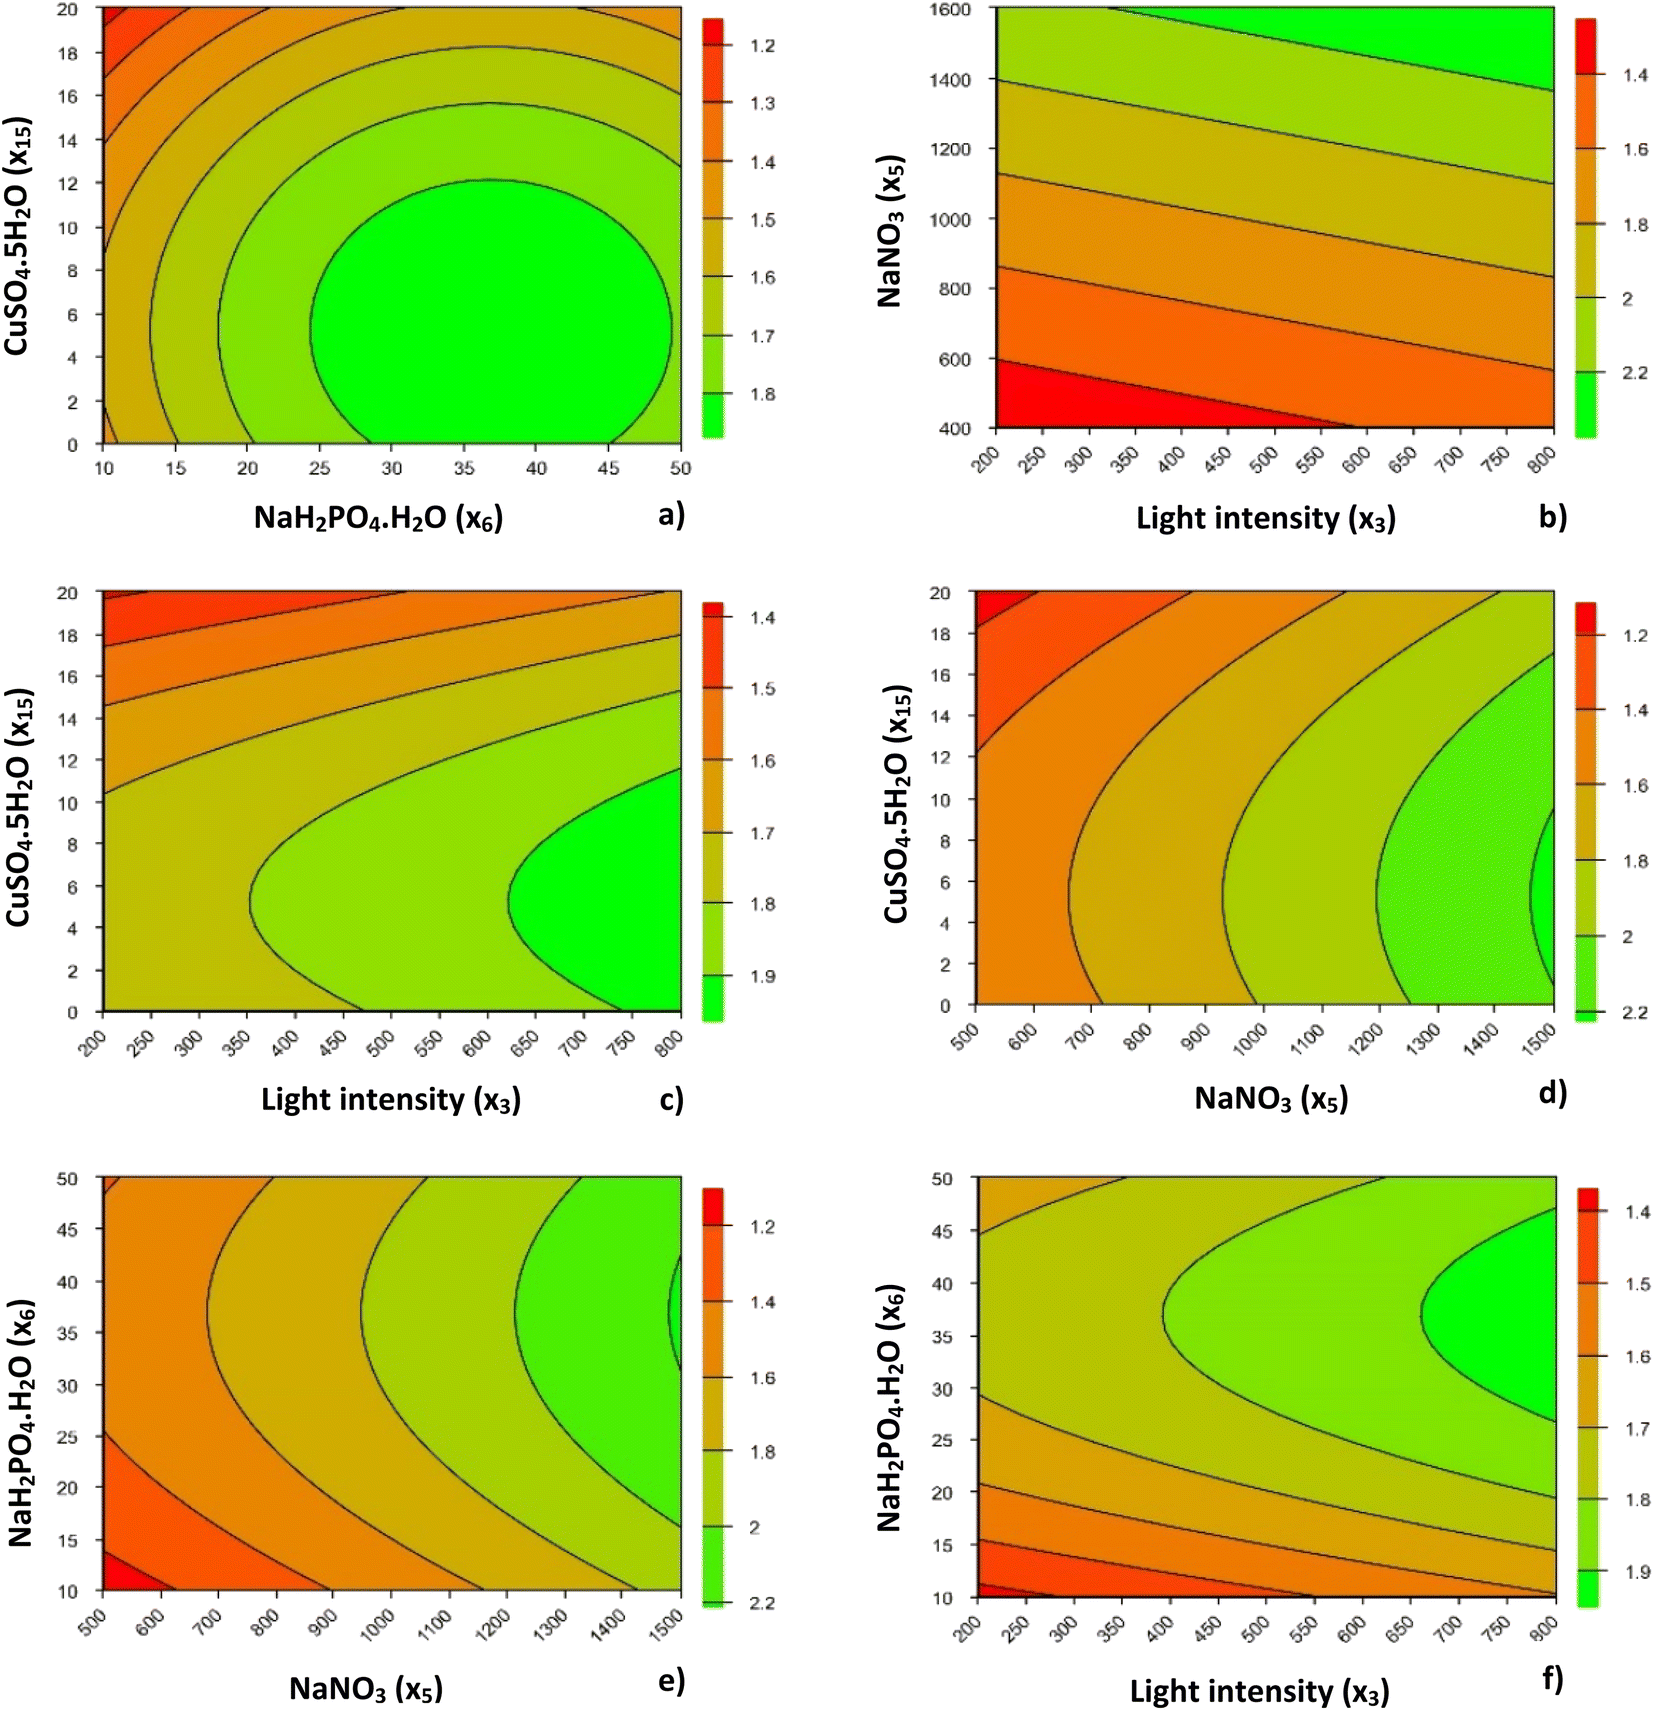 | ||
| Fig. 1 Contour curves for dependent variable Xmax (g AFDW per L), illustrating the interactions between CuSO4·5H2O and NaH2PO4·H2O (a), NaNO3 and light intensity (b), CuSO4·5H2O and light intensity (c), CuSO4·5H2O and NaNO3 (d), NaH2PO4·H2O and NaNO3 (e), and NaH2PO4·H2O and light intensity (f). | ||
Although copper supplementation was reduced in this second optimization step, the increasing concentration of this micronutrient led to reduced biomass production of P. gyrans, as in the PB design. This behavior was more noticeable at higher concentrations (20 μg L−1), being responsible for a reduction of about 0.3–0.4 g AFDW per L when compared with the optimal CuSO4·5H2O concentration range, <12 μg L−1 (≈3 μg L−1 Cu2+), shown in Fig. 1. Purbonegoro et al.50 also described a reduction in the cell density of Pavlova sp. when supplemented with 13 μg L−1 Cu2+ and a growth inhibition of 95.47% with 98 μg L−1 Cu2+.
Concentrations ranging from 0 to 12 μg L−1 of CuSO4·5H2O and from 24 to 49 mg L−1 of NaH2PO4·H2O led to the optimal Xmax of P. gyrans. Fig. 1a also shows a lower Xmax at higher copper and lower phosphorus levels. According to Rocha et al.,51 phosphorus-limited cells presented lower tolerance to Cu, mainly due to changes in membrane permeability and intracellular polyphosphate content.
Concerning the effect of light intensity on Xmax, regardless of the interaction with the other variables (x5, x6, and x15), its increase always promoted higher growth of P. gyrans, showing that there was no apparent photoinhibition under the conditions tested (Fig. 1b, c and f). From Fig. 1b, c, and f, the light conditions considered ideal for Xmax should be above 650 μmolphotons m−2 s−1. However, this feature is highly species-dependent; D. lutheri, for instance, has been reported as having higher growth performance under medium light intensity (100 μmolphotons m−2 s−1),20 while Acutodesmus sp. showed the highest growth rate at 500 μmolphotons m−2 s−1.52
The addition of NaH2PO4·H2O to the RCCD greatly affected the biomass produced by P. gyrans. In fact, the increased range of values in the RCCD allowed understanding that biomass production was favored by the highest values of phosphorus, with optimum values ranging from 27 to 47 mg L−1. Similarly, P. pinguis grown under higher loadings of phosphorus promoted higher biomass production and productivity.33
A similar trend was observed for NaNO3, with higher Xmax reached at the highest concentration (1500 mg L−1). P. pinguis also showed high nitrogen uptake and storage with increasing nitrogen supplementation, from 140 to 1752 μmol L−1.53 However, the highest nitrogen level did not increase the final cell density, possibly due to light limitation during growth, which was 3 to 11 times lower than in the present work. In opposition, D. lutheri showed growth inhibition when NaNO3 concentration exceeded 160 mg L−1, possibly due to enzyme-mediated production of ammonia and nitrite.45
3.2.2.1. Lipid and protein content. The biomass produced from the RCCD was analyzed concerning its lipid and protein contents (Table 4). The lipid content varied between 17.45 (trial 20) and 28.34% (trial 5), whereas the protein concentration ranged from 15.61 (trial 10) to 37.71% (trial 21). For both protein and lipid contents, all the independent variables were statistically significant (p < 0.10; Table 5). Considering the analysis of variance in Table 5 (R2 and Fcalc > Ftab), the second-order models achieved were considered adequate for the responses “total lipids” and “protein content”.49 The effects of the independent variables on these responses are illustrated in the contour curves of ESI S1.†
Briefly, total lipids increase by decreasing NaNO3 concentration (x5), with a common optimal region for concentration values below 600 mg L−1. Likewise, copper concentration (x15) exerted a negative impact on lipid accumulation. The opposite behavior was found for NaH2PO4·H2O (x6), with increased lipid accumulation observed at higher concentrations of phosphorus in the medium, reaching a higher lipid content when NaH2PO4·H2O ranged from 45 to 50 mg L−1. Regarding the importance of light intensity (x3), its quadratic effect and the interaction of this factor with the other independent variables over the total lipids of P. gyrans were noteworthy. Overall, higher lipid accumulation was promoted at low and high light intensities, a trend that was well defined when assessing the interaction between the independent variables light and NaNO3.
Regarding the protein content of P. gyrans, both the concentration of cooper and nitrogen revealed a positive effect. Nitrogen-replete conditions enhanced the production of protein – reaches 40% w/w in the range of 1400–1500 mg L−1 of NaNO3 – attesting its vital role in protein and glycerolipid synthesis.54 High light intensity decreased the protein content, which only exceeded 32% w/w under low and medium light intensities, namely, from 200 to ≈ 400 μmolphotons m−2 s−1 (ESI Fig. S1†). Concerning NaH2PO4·H2O, it was concluded that, generally, the use of larger concentrations of phosphorus led to a decrease in the protein content of P. gyrans. In fact, higher concentrations of this compound (>35% w/w) were only reached when the growth medium was supplemented with a lower concentration of phosphorus (10–20 mg L−1).
The microalgae content of both classes of biocompounds have been described as being interconnected and strongly dependent on the nutritional composition of the growth medium. For instance, the optimal growth conditions (e.g., light and copper level) resulted in better growth performance that may induce faster and higher nutritional deficiencies (e.g., nitrogen availability). Thus, under these conditions, a metabolic change occurs increasing the production of reserve compounds (lipids), with a concomitant decrease in protein synthesis.55,56
3.2.2.2. Fatty acid analysis. The FA profile (% TFA) obtained from the RCCD is presented in Table 4. The different combinations of light intensity, NaH2PO4·H2O, NaNO3, and CuSO4·5H2O had an impact on the content of FAs in biomass, leading to a wide range of values, for example, for PUFAs (12.46–40.85% TFA), SFAs (39.09–68.95% TFA) or EPA content (5.35–20.32% TFA). Using the set of responses and the respective significant terms (p < 0.10), a mathematical model with coded independent variables was generated for each dependent variable of Table 4. According to ANOVA, apart from MUFAs, all dependent variables related to FA composition showed a high R2 value and respected the Fcalc > Ftab condition, attesting the fitness of all second-order models (Table 5). The contour curves of DHA and EPA (% FA/TFA) are presented in ESI Fig. S2.†
According to Table 4, the growth conditions tested promoted a significant impact on EPA content, the value of which ranged between 5.35 and 20.32% TFA. The variation in DHA levels occurred in a narrower range of values, varying between 2.37 and 6.91% TFA. The production of EPA and DHA was strongly reduced with increasing light intensities, especially at medium and high light (ESI Fig. S2†). Guihéneuf et al.20 also reported a reduced content of n − 3 FAs and PUFAs – mainly EPA – in P. lutheri when increasing light intensity from 20 to 340 μmolphotons m−2 s−1. Such behavior occurs since high light intensities are linked to a decreased unsaturation degree of the FAs from different lipid classes.57
For both EPA and DHA, NaNO3 showed no significant effect (p > 0.10); just its interaction with NaH2PO4·H2O was proven significant over DHA production (p < 0.10) – Table 5. According to the calculated coefficients (Table 5), there was a negative correlation between the phosphorus supply and DHA level. This result is in agreement with the variation of DHA content of P. pinguis, which suffered a slight decrease when increasing phosphorus loading from 36.60 to 72.40 μmol L−1.33
On the other hand, copper showed a quadratic effect for both FAs, reaching their highest contents at the limits of the tested range. Considering the biomass production (Fig. 1), the lowest EPA and DHA composition was achieved at intermediate copper concentrations (ESI Fig. S2†), i.e., close to the range of values where P. gyrans produced the highest biomass levels (Xmax). Thus, EPA and DHA contents might be indirectly affected by the copper content through its influence on the growth performance of microalgae, which determines the nutritional properties of P. gyrans growth conditions and, consequently, its biochemical composition.21
3.3. Validation test
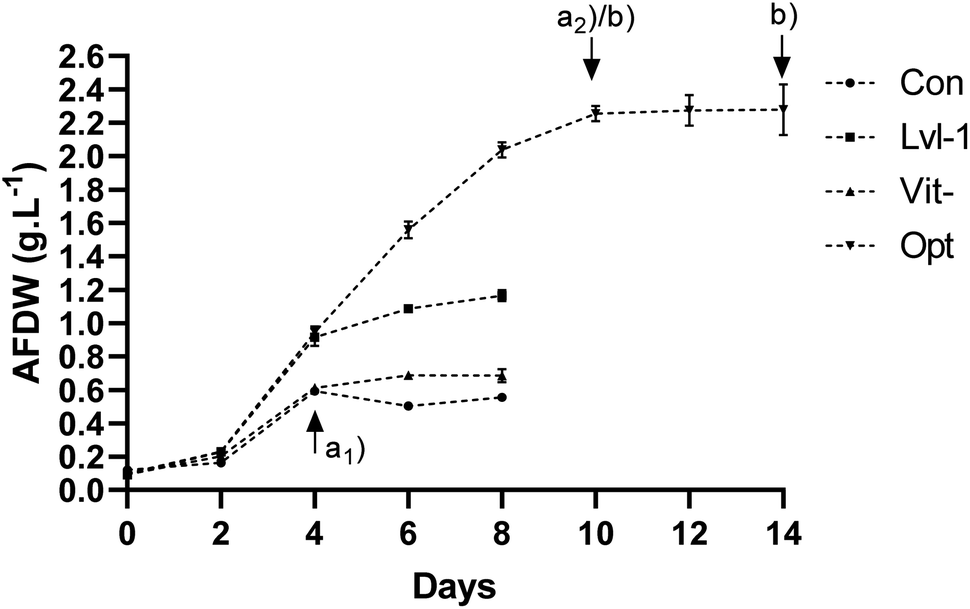 | ||
| Fig. 2 Growth of P. gyrans, ash-free dry weight (g AFDW per L), in the validation assays: optimized conditions, Opt, control/Walne's medium, Con, medium without vitamins, Vit-, and assay with the variables considered non-significant in PB design fixed at level −1, Lvl-1. Data from sampling time (a1) and (a2) were used in the biomass growth analysis. Samples (b) in Opt assay were used in lipid analysis. | ||
The main goal was to validate the mathematical model developed (Table 5) and to compare the growth performance of P. gyrans in the optimal formulation with control conditions (Walne's medium) – ESI Table S2.† Supplementary assays were also carried out to evaluate: (i) the impact of the absence of vitamins and (ii) if all the non-significant variables identified in PB design could be set at their minimum level. However, due to practical issues, an assay with control conditions (Walne's medium) was also conducted under optimal light intensity (700 μmolphotons m−2 s−1).
ESI Table S3† and Fig. 2 show that a very distinctive growth profile was reached with the optimized growth factors. While optimized conditions allowed a constant growth from day 2 to 10, reaching a maximum biomass of 2.26 g AFDW L (p < 0.05), in all the other experiments microalgae cultures ceased their growth on day 4, with the control reaching 0.59 g AFDW L. The two-step optimization adopted here yielded a significant 3.8-fold improvement in the biomass production of P. gyrans (ESI Table S3†). Considering that both trials were performed at the same light intensity, this result seems to be related to the increased supplementation of NaNO3 and NaH2PO4·H2O, and the limitation of CuSO4·5H2O in the growth medium and, to a lesser extent, probably due to the addition of an extra source of inorganic carbon (NaHCO3).21,58
Opt and Con formulations present a N:P molar ratio of 63:1 and 9:1, respectively, suggesting a nitrogen limitation in Con. N and P concentrations in Opt are 15 and 2 times higher than those in Con. The optimal N:P ratio described here is different and higher than those presented by P. pinguis (24:1 and 12:1;33 26:1 and 48:1 53) and Dunaliella tertiolecta (45:1 with a three-fold increase on N and P supply),59 both grown using f/2-Si medium under low lighting. The N:P ratio has been claimed as an important parameter to manage microalgal growth and its biochemical composition. However, its impact strongly depends on the microalgae species and is affected by the study approach performed (uni- or multivariate), nutrient composition and ratios, and other abiotic factors such as lighting, which limits the definition of a common optimal N:P value for microalgae.33 This limitation was observed in the RCCD experiment, where nine N:P ratios were tested producing a diverse and unrelated range of Xmax and biochemical compounds.
Using the coded values for the independent variables, the mathematical models (Table 5) were used to predict the response values for Xmax, total proteins, total lipids, EPA, and DHA (% FA/TFA). The predicted values and associated errors between experimental and predicted data are displayed in ESI Table S4.† Due to their low relative error, the predicted values for Xmax (RE −3.69%) and total protein (RE 0.60%) are in accordance with the experimental values, attesting the fitness of the model. In contrast, the deviation from experimental values for total lipids, and especially for EPA and DHA, was higher, accounting for relative errors of 22.10, 64.39, and 82.54%, respectively.
The assay without vitamins confirmed the crucial role played by these nutrients in P. gyrans. Its growth was severely delayed after the second day and ceased by the fourth day, with a maximum biomass produced similar to the control (p > 0.05) (ESI Table S3†). The inability to grow in vitamin-free environments is in accordance with that described for other haptophytes such as D. lutheri24 and T. lutea,60 in which B12 dependency was underlined.60
Regarding the Lvl-1 assay, these conditions produced the second highest Xmax, with a significative difference from the remaining conditions tested (p < 0.05) – ESI Table S3† and Fig. 2. Despite being presented in PB design as independent variables with no significant effects on Xmax (p > 0.10), reducing these growth parameters at the same time inhibited P. gyrans growth from the fourth day onwards. Similarly, in previous studies, mineral limitation in the culture medium negatively affected the biomass production of D. lutheri, especially when deprived of Ca, Fe, Mn, Zn or Co.24 Some of these nutrients are important cofactors for enzymatic processes involved in protein synthesis, carbon fixation, and chlorophyll production in microalgae,61,62 which may be severely affected under limited mineral conditions.
3.3.2.1. Lipid and protein contents. P. gyrans resulting from the validation assays reached a protein content of 45.86, 42.11, 30.76, and 10.59% w/w under the growth conditions of Vit-, Lvl-1, Opt, and Con, respectively (Table 6). The assays Vit- and Lvl-1 had similar protein amounts, with significant differences (p < 0.05) for Opt and Con. In addition to increasing biomass production, the optimized growth conditions also allowed a 3-fold increase in protein content compared to the control (p < 0.05). Despite the variety of formulations, the highest protein values were achieved in the assays that shared the optimal value of nitrogen, phosphorus, and copper.
| Opt.i (10 days) | Opt (14 days) | Con | Vit- | Lvl-1 | ||
|---|---|---|---|---|---|---|
| Lipids (% w/w) | 22.33 ± 0.32a | 28.30 ± 0.95b | 27.10 ± 0.96b | 19.83 ± 0.68a | 26.73 ± 3.25b | |
| Protein (% w/w) | — | 30.76 ± 4.37a | 10.59 ± 0.32b | 45.86 ± 0.83c | 42.11 ± 0.45c | |
| % TFA | C14:0 | 11.33 ± 0.47 | 10.57 ± 0.89 | 11.55 ± 1.36 | 8.87 ± 1.13 | 9.41 ± 0.91 |
| C16:0 | 17.73 ± 0.21 | 19.32 ± 2.63 | 29.62 ± 2.96 | 20.25 ± 2.15 | 17.73 ± 0.21 | |
| C16:1 n − 7 | 13.92 ± 1.94 | 17.88 ± 1.52 | 17.1 ± 1.49 | 8.83 ± 0.58 | 14.21 ± 0.50 | |
| C16:2 n − 4 | 1.02 ± 0.05 | 0.99 ± 0.36 | 0.39 ± 0.05 | 0.66 ± 0.04 | 0.96 ± 0.15 | |
| C18:0 | 3.46 ± 0.63 | 2.75 ± 0.32 | 2.21 ± 0.40 | 7.45 ± 1.39 | 3.38 ± 0.86 | |
| C18:1 n − 9 | 0.85 ± 0.06 | 1.15 ± 0.09 | 1.59 ± 0.22 | 1.05 ± 0.20 | 1.13 ± 0.13 | |
| C18:1 n − 7 | 1.11 ± 0.51 | 1.21 ± 0.15 | 0.81 ± 0.14 | 4.13 ± 0.83 | 1.82 ± 0.13 | |
| C18:2 n − 6 | 1.74 ± 0.52 | 1.24 ± 0.26 | 2.03 ± 0.37 | 0.28 ± 0.05 | 2.16 ± 0.16 | |
| C18:3 n − 3 | 0.78 ± 0.03 | 0.69 ± 0.15 | 0.42 ± 0.05 | 0.67 ± 0.17 | 1.18 ± 0.13 | |
| C18:4 n − 3 | 7.04 ± 0.80 | 6.56 ± 0.62 | 3.25 ± 0.46 | 7.77 ± 0.97 | 6.70 ± 0.33 | |
| C20:5 n − 3 | 24.33 ± 1.03ac | 20.69 ± 1.61ad | 17.09 ± 1.65bd | 27.03 ± 2.41ce | 23.37 ± 0.51ae | |
| C22:5 n − 6 | 7.36 ± 0.82 | 6.60 ± 0.11 | 8.21 ± 0.99 | 4.30 ± 0.29 | 6.32 ± 0.52 | |
| C22:6 n − 3 | 9.30 ± 0.80a | 10.33 ± 0.30ad | 5.73 ± 0.62b | 8.71 ± 0.80a | 11.65 ± 0.83cd | |
| SFAs | 32.53 ± 1.03ac | 32.65 ± 2.25ac | 43.37 ± 2.25b | 36.57 ± 2.46a | 30.51 ± 1.36c | |
| MUFAs | 15.88 ± 2.29ac | 20.24 ± 1.35b | 19.5 ± 1.62ab | 14.01 ± 1.28cd | 17.16 ± 0.44abd | |
| PUFAs | 51.59 ± 1.54a | 47.11 ± 3.24a | 37.13 ± 3.5b | 49.42 ± 3.45a | 52.33 ± 1.59a | |
| n − 3 FAs | 41.46 ± 0.47ac | 38.27 ± 2.57a | 26.49 ± 2.33b | 44.19 ± 3.20cd | 42.89 ± 1.08ad | |
| n − 6 FAs | 9.10 ± 1.35 | 7.84 ± 0.36 | 10.25 ± 1.24 | 4.57 ± 0.32 | 8.47 ± 0.66 | |
| n − 3/n − 6 | 4.62 ± 0.72 | 4.88 ± 0.15 | 2.59 ± 0.1 | 9.66 ± 0.32 | 5.08 ± 0.28 | |
| HI | — | 1.63 ± 0.21a | 0.96 ± 0.15b | 1.85 ± 0.18a | 2.00 ± 0.12a | |
| AI | — | 0.91 ± 0.05a | 1.34 ± 0.12b | 0.88 ± 0.03a | 0.80 ± 0.06a | |
| TI | — | 0.24 ± 0.03a | 0.45 ± 0.06b | 0.24 ± 0.03a | 0.21 ± 0.01a | |
In terms of lipid content, the experiments Lvl-1, Opt, and Con showed the highest value, ranging from 26.73 to 28.3% w/w (Table 6). The absence of vitamins significantly decreased the amount of lipids compared to the other conditions (p < 0.05), totaling only 19.83% w/w. The effect of time was also assessed in the lipid content and FA profile of optimum growth conditions – Table 6. For that, two different samples were taken throughout P. gyrans growth: one was taken after 10 days (Opt.i) and the second one at the end of microalgae growth (Opt – 14 days) – sample (b) in Fig. 2. Increasing the sampling time for 4 days enabled an increment of 5% in lipid content (p < 0.05), reaching 28.3% w/w at the end of the growth.
3.3.2.2. Fatty acid analysis. The FA profiles of P. gyrans' biomass produced in the validation experiment are presented in Table 6. In general, thirteen FAs (>1% TFA) were identified, of which five stand out most prominently (>10% TFA): C14:0, C16:0, C16:1 n − 7, C20:5 n − 3 and C22:6 n − 3. The FA profile described here is in accordance with that of other Pavlovophyceae species, such as P. viridis,63P. pinguis14 and D. lutheri.31 Among the identified FAs, a common feature of P. gyrans was verified: a high level of both EPA and DHA – which reached a maximum value of 27.03% and 11.65% TFA, respectively.
Optimal growth conditions produced noticeable differences compared to the control. The modifications carried out on growth conditions, mainly those on NaNO3, NaH2PO4·H2O, and CuSO4·5H2O concentrations, resulted in a significant increase (p < 0.05) in the total PUFA content (≈10% TFA) and n − 3 FAs (≈12% TFA), with a concomitant decrease of ≈11% in total SFAs (p < 0.05). Particularly, a substantial improvement in the DHA content was evident, which rose from 5.73 to 10.33% TFA (p < 0.05), with a similar trend for EPA – increased from 17.09 to 20.69% TFA (p > 0.05). Regarding the evolution of the FA profile of Opt between the onset of the stationary (Opt.i) phase and its end (Opt), no significant variation was noticed, except for the total MUFAs (p < 0.05) that increased with culture's aging.
The composition of P. gyrans grown with limited micronutrients presented a similar FA profile to the optimal conditions. Although a lower concentration of a significant number of nutrients hindered biomass production, this change in culture conditions did not greatly affect the FA composition. In fact, the comparison between Opt, Lvl-1, and Con assays allows us to assume that the production of FAs by P. gyrans was strongly dependent on individual or combined availability of nitrogen, phosphorus, and copper. The amount of nitrogen available has been reported as a crucial factor involved in lipids and FAs modelling in microalgae. Under N-replete conditions, microalgae are not stressed, preventing lipid membrane remodeling, in which an increased accumulation of neutral lipids (e.g. TAGs), at the expense of polar lipids, is promoted. Polar lipids are the main components of photosynthetic membranes in microalgae, which are the main sink of PUFAs and may explain the relatively high levels of EPA and DHA, as well as the lower content of SFAs on P. gyrans.21,63
The trial without supplementation of vitamins presented the highest value of EPA compared to Con and Opt (14 days) (p < 0.05). Furthermore, important variations were also obtained in five other FAs (statistical analysis was not carried out). Namely, Vit- had the lowest level of C16:1 n − 7, C18:2 n − 6, and C22:5 n − 6, and the highest level of C18:0 and C18:1 n − 7.
3.3.2.3. Nutritional indices. Taking into account the FA composition, the impact of validation conditions on the nutritional of the lipid fraction of biomass was estimated by the calculation of the hypocholesterolemic (HI), atherogenic (AI), and thrombogenic indices (TI) (Table 6). These indices allow the categorization of food products according to their healthiness for human diet, especially the likelihood to develop cardiovascular disease (CVD), which is usually associated with the accumulation of lipid plaques in the circulatory system (atherogenicity), clot formation in blood vessels (thrombogenicity), and cholesterol increase in blood (hypocholesterolemia).41 In general, a FA composition rich in saturated residues, in contrast to unsaturated FAs, has pro-atherogenic, pro-thrombogenic, and hypercholesterolemic activity, promoting high AI and TI indices, and a reduced HI index.41,64
There was a significant variation (p < 0.05) in the values of AI, TI, and HI compared to the Con experiment (Table 6). The control condition produced the highest values for AI (1.34) and TI (0.45) and the lowest for HI (0.96). Opt assay yielded 0.93, 0.24, and 1.63 for AI, TI, and HI, respectively. This variation amongst the nutritional indices arises from the considerable increase of C16:0 (29.62% TFA) in Con (Table 6), a SFA considered pro-atherogenic, pro-thrombogenic, and hypercholesterolemic, in contrast to microalga biomass enriched with n − 3 FA (38.27% TFA) and PUFAs (47.11% TFA) from Opt.41 Similarly, the ratio ∑n − 3/∑n − 6 (% TFA) almost doubled in Opt (4.88) when compared to Con (2.59).
The nutritional values here reported for optimal growth conditions are in accordance with those of other microalgae. Aussant et al.40 assessed the nutritional value of eight microalgae species and stated that the average values for AI, TI, and HI indices were 0.492–1.424, 0.197–0.836, and 0.523–2.014, respectively. Thus, considering that a healthy diet should be characterized by high intake of n − 3 FAs, low values of AI and TI, and relatively high values of HI,8,64P. gyrans cultured under optimum conditions presents itself as a potential source of healthy lipids for human consumption.
4. Conclusions
The present work studied the importance of seventeen growth parameters on the biomass production and biochemical composition of Pavlova gyrans through a sequential optimization procedure. It allowed the identification of the key variables for microalgae growth and understanding their impact and their interactions both on the growth performance and biochemical composition of P. gyrans. Optimized conditions substantially improved the final Xmax and biochemical composition of biomass, namely the content of PUFAs and protein. These findings highlight the importance of tailoring P. gyrans growth conditions as a key strategy to identify and develop promising sources of healthy lipids with very interesting nutritional indices for human consumption.Author contributions
Filipe Maciel: conceptualization; data curation; formal analysis; investigation; methodology; visualization; writing – original draft; writing – review & editing. Daniela Couto: conceptualization; data curation; formal analysis; investigation; methodology; writing – review & editing. Pedro Geada: conceptualization; writing – review & editing. Hugo Pereira: conceptualization; investigation; resources; writing – review & editing. José Teixeira: funding acquisition; resources; writing – review & editing. M. Rosário Domingues: conceptualization; resources; supervision; writing – review & editing. Joana Silva: conceptualization; resources; supervision; writing – review & editing. António Vicente: conceptualization; funding acquisition; project administration; resources; supervision; validation; writing – review & editing.Conflicts of interest
There are no conflicts to declare.Acknowledgements
This study was supported by the Portuguese Foundation for Science and Technology (FCT) under the scope of the strategic funding of the UIDB/04469/2020 unit and by LABBELS – Associate Laboratory in Biotechnology, Bioengineering and Microelectromechanical Systems, LA/P/0029/2020. This research work was supported by ALGAVALOR – Lisboa-01-0247-FEDER-035234, supported by the Operational Programme for Competitiveness and Internationalization (COMPETE2020), by the Lisbon Portugal Regional Operational Programme (Lisboa 2020) and by the Algarve Regional Operational Programme (Algarve 2020) under the Portugal 2020 Partnership Agreement, through the European Regional Development Fund (ERDF). Filipe Maciel acknowledges the FCT for their fellowships (SFRH/BD/133005/2017). The authors also thank the University of Aveiro, FCT, and Ministério da Ciência Tecnologia e Ensino Superior (MCTES) for the financial support to the research units CESAM (UIDB/50017/2020 + UIDP/50017/2020 + LA/P/0094/2020) and LAQV-REQUIMTE (UIDP/50006/2020 + UIDB/50006/2020) through national funds and, where applicable, co-funded by ERDF, within the Portugal 2020 Partnership Agreement and Compete 2020, and to the Portuguese Mass Spectrometry Network (RNEM, LISBOA-01-0145-FEDER-402-022125).References
- M. Peet and C. Stokes, 2005, Drugs, 2005, 65, 1051–1059 CAS.
- P. M. Kris-Etherton, W. S. Harris and L. J. Appel, Circulation, 2002, 106, 2747–2757 CrossRef PubMed.
- M. Fotuhi, P. Mohassel and K. Yaffe, Nat. Clin. Pract. Neurol., 2009, 5, 140–152 CAS.
- M. P. Judge, O. Harel and C. J. Lammi-Keefe, Am. J. Clin. Nutr., 2007, 85, 1572–1577 CrossRef CAS PubMed.
- EFSA Panel on Dietetic Products Nutrition and Allergies (NDA), EFSA J., 2012, 10(7), 1–48 Search PubMed.
- B. D. Glencross, D. R. Tocher, C. Matthew and J. Gordon Bell, Fish Physiol. Biochem., 2014, 40, 1213–1227 CAS.
- H. A. Hamilton, R. Newton, N. A. Auchterlonie and D. B. Müller, Nat. Food, 2020, 1, 59–62 CrossRef CAS.
- A. P. Simopoulos, Biomed. Pharmacother., 2002, 56, 365–379 CrossRef CAS PubMed.
- BCC Research (b), Global Omega 3 Market Size and Growth Forecast to 2025, https://www.bccresearch.com/partners/verified-market-research/global-omega-3-market-size-and-forecast.html, (accessed 11 April 2022) Search PubMed.
- F. Guihéneuf, V. Mimouni, G. Tremblin and L. Ulmann, J. Agric. Food Chem., 2015, 63, 1261–1267 CrossRef PubMed.
- S. P. Slocombe, Q. Zhang, M. Ross, A. Anderson, N. J. Thomas, Á. Lapresa, C. Rad-Menéndez, C. N. Campbell, K. D. Black, M. S. Stanley and J. G. Day, Sci. Rep., 2015, 5, 1–17 Search PubMed.
- K. I. Reitan, G. Øie, H. Jørgensen and X. Wang, J. Appl. Phycol., 2021, 33, 3831–3842 CrossRef CAS.
- V. Patil, T. Källqvist, E. Olsen, G. Vogt and H. R. Gislerød, Aquacult. Int., 2007, 15, 1–9 CrossRef CAS.
- T. Fernandes, A. Martel and N. Cordeiro, Sci. Rep., 2020, 10, 1–11 CrossRef CAS PubMed.
- A. Kanamoto, Y. Kato, E. Yoshida, T. Hasunuma and A. Kondo, Mar. Biotechnol., 2021, 23, 331–341 CrossRef CAS PubMed.
- S. M. Tibbetts and S. J. J. Patelakis, Aquaculture, 2022, 546, 737236 CrossRef CAS.
- F. Ahmed, W. Zhou and P. M. Schenk, Algal Res., 2015, 10, 210–217 CrossRef.
- S. M. Tibbetts, S. J. J. Patelakis, C. G. Whitney-Lalonde, L. L. Garrison, C. L. Wall and S. P. MacQuarrie, J. Appl. Phycol., 2020, 32, 299–318 CrossRef CAS.
- J. P. Cañavate and C. Fernández-Díaz, Eur. J. Phycol., 2021, 1–21 Search PubMed.
- F. Guihéneuf, V. Mimouni, L. Ulmann and G. Tremblin, J. Exp. Mar. Biol. Ecol., 2009, 369, 136–143 CrossRef.
- F. Guihéneuf and D. B. Stengel, Mar. Drugs, 2013, 11, 4246–4266 CrossRef PubMed.
- K. M. I. Bashir, S. Mansoor, N. R. Kim, F. R. Grohmann, A. A. Shah and M. G. Cho, Ann. Microbiol., 2019, 69, 353–368 CrossRef CAS.
- B. Huang, V. Mimouni, E. Lukomska, A. Morant-Manceau and G. Bougaran, J. Phycol., 2020, 56, 908–922 CrossRef CAS PubMed.
- A. P. Carvalho, I. Pontes, H. Gaspar and F. X. Malcata, Enzyme Microb. Technol., 2006, 38, 358–366 CrossRef CAS.
- A. P. Carvalho and F. X. Malcata, Cryptogam.: Algol., 2000, 21, 59–71 CrossRef.
- M. Li, C. Hu, Q. Zhu, L. Chen, Z. Kong and Z. Liu, Chemosphere, 2006, 62, 565–572 CrossRef CAS PubMed.
- M. Li, Q. Zhu, C. wei Hu, L. Chen, Z. li Liu and Z. Ming Kong, J. Environ. Sci., 2007, 19, 1330–1335 CrossRef CAS PubMed.
- X. Huang, L. Wei, Z. Huang and J. Yan, J. Appl. Phycol., 2014, 26, 105–114 CrossRef CAS.
- M. I. Rodrigues and A. F. Iemma, Experimental Design and Process Optimization, CRC Press, 1st edn, 2014 Search PubMed.
- R. A. Andersen, Algal Culturing Techniques, Elsevier Academic Press, 2005 Search PubMed.
- F. Guihéneuf and D. B. Stengel, Algal Res., 2017, 23, 113–125 CrossRef.
- F. Guihéneuf, L. Ulmann, G. Tremblin and V. Mimouni, Eur. J. Phycol., 2011, 46, 143–152 CrossRef.
- T. Fernandes and N. Cordeiro, J. Appl. Phycol., 2022, 34, 757–775 CrossRef CAS.
- I. Dahmen-Ben Moussa, H. Chtourou, F. Karray, S. Sayadi and A. Dhouib, Bioresour. Technol., 2017, 238, 325–332 CrossRef CAS PubMed.
- J. P. Cañavate, I. Armada and I. Hachero-Cruzado, J. Plant Physiol., 2017, 214, 28–38 CrossRef PubMed.
- H. Pereira, J. Páramo, J. Silva, A. Marques, A. Barros, D. Maurício, T. Santos, P. Schulze, R. Barros, L. Gouveia, L. Barreira and J. Varela, Sci. Rep., 2018, 8, 5112 CrossRef PubMed.
- S. O. Lourenço, E. Barbarino, P. L. Lavín, U. M. Lanfer Marquez and E. Aidar, Eur. J. Phycol., 2004, 39, 17–32 CrossRef.
- D. Couto, T. Melo, T. A. Conde, M. Costa, J. Silva, M. R. M. Domingues and P. Domingues, Algal Res., 2021, 53, 1–15 Search PubMed.
- D. Couto, T. Melo, T. A. Conde, A. S. P. Moreira, P. Ferreira, M. Costa, J. Silva, R. Domingues and P. Domingues, Food Chem., 2022, 375, 1–10 CrossRef PubMed.
- J. Aussant, F. Guihéneuf and D. B. Stengel, Appl. Microbiol. Biotechnol., 2018, 102, 5279–5297 CrossRef CAS PubMed.
- J. Chen and H. Liu, Int. J. Mol. Sci., 2020, 21, 1–24 Search PubMed.
- S. Seoane, M. Zapata and E. Orive, J. Sea Res., 2009, 62, 286–294 CrossRef.
- Y. Su, Sci. Total Environ., 2021, 762 Search PubMed.
- J. H. Janssen, J. Kastenhofer, J. A. de Hoop, P. P. Lamers, R. H. Wijffels and M. J. Barbosa, Algal Res., 2018, 33, 125–132 CrossRef.
- S. H. Kim, I. Y. Sunwoo, H. J. Hong, C. C. Awah, G. T. Jeong and S. K. Kim, Bioprocess Biosyst. Eng., 2019, 42, 1517–1526 CrossRef CAS PubMed.
- L. Kong and N. M. Price, Metallomics, 2020, 12, 1106–1117 CrossRef CAS PubMed.
- B. Debelius, J. M. Forja, Á. DelValls and L. M. Lubián, Ecotoxicol. Environ. Saf., 2009, 72, 1503–1513 CrossRef CAS PubMed.
- L. M. Blank, Curr. Opin. Biotechnol., 2012, 23, 846–851 CrossRef CAS PubMed.
- M. S. Sadahira, M. I. Rodrigues, M. Akhtar, B. S. Murray and F. M. Netto, Food Hydrocolloids, 2016, 58, 1–10 CrossRef CAS.
- T. Purbonegoro, Suratno, R. Puspitasari and N. A. Husna, in IOP Conference Series: Earth and Environmental Science, Institute of Physics Publishing, 2018, vol. 118 Search PubMed.
- G. S. Rocha, A. T. Lombardi and M. da G. G. Melão, Ecotoxicol. Environ. Saf., 2016, 128, 30–35 CrossRef CAS PubMed.
- P. Varshney, S. Sohoni, P. P. Wangikar and J. Beardall, J. Appl. Phycol., 2016, 28, 2631–2640 CrossRef CAS.
- T. Fernandes and N. Cordeiro, Biomass Bioenergy, 2022, 158, 1–12 CrossRef.
- J. Jia, D. Han, H. G. Gerken, Y. Li, M. Sommerfeld, Q. Hu and J. Xu, Algal Res., 2015, 7, 66–77 CrossRef.
- J. C. Nzayisenga, X. Farge, S. L. Groll and A. Sellstedt, Biotechnol. Biofuels, 2020, 13(4), 1–8 Search PubMed.
- F. F. Chu, P. N. Chu, X. F. Shen, P. K. S. Lam and R. J. Zeng, Bioresour. Technol., 2014, 152, 241–246 CrossRef CAS PubMed.
- A. C. Guedes, L. A. Meireles, H. M. Amaro and F. X. Malcata, JAOCS, J. Am. Oil Chem. Soc., 2010, 87, 791–801 CrossRef CAS.
- M. Nayak, W. I. Suh, B. Lee and Y. K. Chang, Energy Convers. Manage., 2018, 156, 45–52 CrossRef CAS.
- R. Jafarpour, S. Vahdat, F. Asadi, H. K. Dardashti, B. Zarei and A. Dadkhah, J. Appl. Phycol., 2023, 35, 1553–1563 CrossRef CAS.
- C. Nef, S. Jung, F. Mairet, R. Kaas, D. Grizeau and M. Garnier, Sci. Rep., 2019, 9, 1–11 CrossRef CAS PubMed.
- G. R. Rout and S. Sahoo, Rev. Agric. Sci., 2015, 3, 1–24 CrossRef.
- N. Farhat, A. Elkhouni, W. Zorrig, A. Smaoui, C. Abdelly and M. Rabhi, Acta Physiol. Plant., 2016, 38(145), 1–10 CAS.
- X. Huang, Z. Huang, W. Wen and J. Yan, J. Appl. Phycol., 2013, 25, 129–137 CrossRef CAS.
- Y. A. Attia, M. A. Al-Harthi, M. A. Korish and M. M. Shiboob, Lipids Health Dis., 2015, 14(136), 1–8 Search PubMed.
Footnote |
| † Electronic supplementary information (ESI) available. See DOI: https://doi.org/10.1039/d3fb00110e |
| This journal is © The Royal Society of Chemistry 2023 |