Utilization of quince (Cydonia oblonga) seeds for production of mucilage: functional, thermal and rheological characterization
Received
1st September 2022
, Accepted 28th October 2022
First published on 13th December 2022
Abstract
The need for food hydrocolloids with specialized functions is now being widely studied. Plant-derived hydrocolloids have a larger advantage over synthetic ones because they have a more pleasant image with customers. Quince seed mucilage (QSM) is one source and plays an essential role in the food sector. The current research was undertaken for the valorization of quince seed waste for the production of mucilage and characterization of its functional, thermal, and rheological parameters. Extraction conditions such as water to seed (W/S) ratio (14.5![[thin space (1/6-em)]](https://www.rsc.org/images/entities/char_2009.gif) :1 to 44.5:1), extraction temperature (30 to 60 °C), extraction time (10–30 min), and pH (5 to 9) for maximum values of extraction yield (EY), viscosity and emulsion stability index (ESI) of QSM were investigated using response surface methodology-central composite rotatable design. Data analysis showed that independent variables significantly influenced all quality parameters. For all responses, the regression models showed a higher coefficient of determination (R2 ≥ 0.99). The optimum extraction conditions, viz., pH, extraction temperature, extraction time, and W/S ratio, determined by numerical optimization were 9, 60 °C, 15 min, and 19:1, respectively. Under these optimum conditions, EY, viscosity, and ESI were 16.17%, 1143.22 mPa s, and 84.62 min, respectively. The results indicated that the mucilage obtained exhibited high water holding capacity and adequate oil holding capacity. Thermal analysis of the mucilage was done with DSC, which showed that QSM was a thermostable hydrogel. Rheometry data depicted that storage modulus was more than loss modulus and both of them increased with an increase of frequency.
:1 to 44.5:1), extraction temperature (30 to 60 °C), extraction time (10–30 min), and pH (5 to 9) for maximum values of extraction yield (EY), viscosity and emulsion stability index (ESI) of QSM were investigated using response surface methodology-central composite rotatable design. Data analysis showed that independent variables significantly influenced all quality parameters. For all responses, the regression models showed a higher coefficient of determination (R2 ≥ 0.99). The optimum extraction conditions, viz., pH, extraction temperature, extraction time, and W/S ratio, determined by numerical optimization were 9, 60 °C, 15 min, and 19:1, respectively. Under these optimum conditions, EY, viscosity, and ESI were 16.17%, 1143.22 mPa s, and 84.62 min, respectively. The results indicated that the mucilage obtained exhibited high water holding capacity and adequate oil holding capacity. Thermal analysis of the mucilage was done with DSC, which showed that QSM was a thermostable hydrogel. Rheometry data depicted that storage modulus was more than loss modulus and both of them increased with an increase of frequency.
Introduction
Polymers obtained from plants have a growing market in many sectors including the food sector because of their extensive range of industrial applications including gelling agents, binders, film coatings, and emulsifiers; consequently, they are extensively used in paper, cosmetic and textile industries.1 Synthetic polymers have numerous detrimental effects on human health due to which our society is increasingly engaged in plant-derived naturally produced biopolymers (cellulose, glucans, gums, and mucilage) as a valuable component for the development of cost-effective, sustainable, and eco-friendly products.2 Mucilage derived from plants is one of the most commonly utilized polysaccharides in the food sector because of its vast range of applications.3 Furthermore, hydrocolloid usage in the food sector has dramatically increased in recent years. Plant seeds offer a lot of potential as novel sources of hydrocolloids because of their accessibility, safety, and low processing value. Gum-like functional characteristics of various polymers derived from several seeds have been documented to be a viable source of commercial hydrocolloids.4
Quince (Cydonia oblonga Miller), which belongs to the Rosaceae family, is among the most essential underexploited fruit species, producing high-nutrient fruits with a beneficial effect on human health. The seeds are brown and oval, with a length of around 7 mm and a width of about 5 mm. When the seeds are immersed in water, they quickly absorb the moisture and generate a tasteless and sticky substance. Furthermore, the composition of quince seed mucilage (QSM) consists of water-soluble polysaccharides and cellulose.5 Edible films produced from QSM have been widely studied with respect to their characteristics as well as applications.6 Many reports have investigated that by-products of quince (seeds and peels) remain a cheap and excellent source of flavonoids, phenolic acids and antioxidants.7 In addition, Silva et al.7 demonstrated that the seeds of quince have a phenolic profile including 5-O-caffeoylquinic, 4-O-caffeoylquinic, 3-O-caffeoylquinic, and 3,5-dicaffeoylquinic acids, stellarin-2, vicenin-2, lucenin-2, 6-C-glucosyl-8-C-pentosylchrysoeriol, 6-C-pentosyl-8-C-glucosyl chrysoeriol, schaftoside, and isoschaftoside.
When numerous independent factors affect the responding variables throughout the extraction process, an optimization technique that can evaluate all of the variables is likely to be used. Response surface methodology (RSM) is considered a valuable statistical procedure for process optimization when the independent factors have a cumulative impact on the desired response. The extraction of hydrocolloids is influenced by several variables, such as pH, temperature, water to seed (W/S) ratio, and time.8 Several scientists have employed RSM to optimize the extraction of hydrocolloids.8–11 Furthermore, when hydrocolloids are used to alter the textural qualities of food, their rheological behavior is of remarkable importance.12 It is also well known that while planning and modeling, the rheological characteristics of fluid food should be carefully examined. Concentration, dispersion, temperature, dissolution, mechanical treatment, electrolyte, and structure all influence the rheological characterization of hydrocolloids, which affects food processing conditions.13 Researchers and scientists are keen for a different hydrocolloid source that can provide a stable source of income for the producing countries due to the various functionalities of mucilage.13,14 Sustainability is a major driving force for efficient utilization of existing resources and as such quince seed mucilage has not been fully explored for industrial and medical applications. In order to valorize this industrial waste, the present work was aimed to optimize conditions for extraction of mucilage from quince seeds and characterize the mucilage for thermal, functional, and rheological attributes.
Materials and methods
Plant material and reagents
Quince seeds were procured at the maturity stage in the month of October (2020) from the experimental farm of Sher-e-Kashmir University of Agricultural Sciences and Technology of Kashmir, Srinagar, J&K, India. Broken seeds, as well as foreign matter like stones, dirt, dust, and chaff, were manually cleaned and removed. Ethanol was obtained from Merck Chemical Co. All the chemicals used in the experiment were of analytical grade.
Extraction of mucilage
Extraction of aqueous QSM from whole seeds was carried out in distilled water in designed variable parameters such as W/S ratio varying from 14.5 to 44.5 at pH 5–9, temperature of the water bath varying from 30 to 60 °C and extraction period from 10 to 30 min. The pH of the suspension was adjusted by 0.1 N NaOH or HCl. The water-seed slurry was agitated with an electric mixing paddle throughout the extraction period to remove the mucilage layer from the surface of the seed. The solutions were then filtered and collected mucilage was oven-dried at 45 ± 1 °C to a constant weight. The dried mucilage was then bottled and kept under a cool and dry atmosphere.
Experimental design
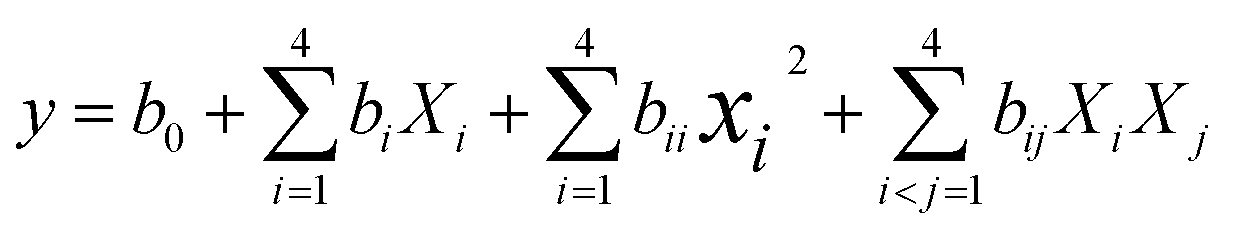
Central Composite Rotatable Design (CCRD) was used to design experiments using RSM, which included both central and axial points. pH, extraction time, extraction temperature, and W/S ratio were independent factors, and extraction yield, viscosity, and emulsion stability index were dependent responses. The experimental ranges as well as the respective coded levels of independent factors are presented in Table 1. To fit the experimental data for each response, second-order polynomial models for dependent responses were generated by applying Statistical Software Design Expert 12 (Stat Ease Inc, Minneapolis, MN, USA). Multiple regression models were used to analyze the data, and analysis of variance (ANOVA) was employed to establish the statistical significance of each result. For all the parameters, the second-order polynomial model was used, which is given in eqn (1):| | 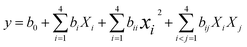 | (1) |
where xi (i = 1, 2, 3 and 4), xi2, and xixj are linear, quadratic, and interaction effects of independent variables on the response y and bo, bi, bii, and bij are regression coefficients for intercept, linear, quadratic, and interactive effects, respectively. The optimum condition parameters employed for numerical optimization were to maximize yield, viscosity, and emulsion stability index.
Table 1 Central composite rotatable design for the independent variables (coded and decoded levels)
| Independent variables |
Code |
Levels in coded form |
| −2 |
−1 |
0 |
+1 |
+2 |
| Water to seed ratio |
A |
85.5:14.5 |
78:22 |
70.5:29.5 |
63:37 |
55.5:44.5 |
| Extraction temperature (°C) |
B |
30 |
37.5 |
45 |
52.5 |
60 |
| Extraction time (min) |
C |
10 |
15 |
20 |
25 |
30 |
| pH |
D |
5 |
6 |
7 |
8 |
9 |
Extraction yield (EY)
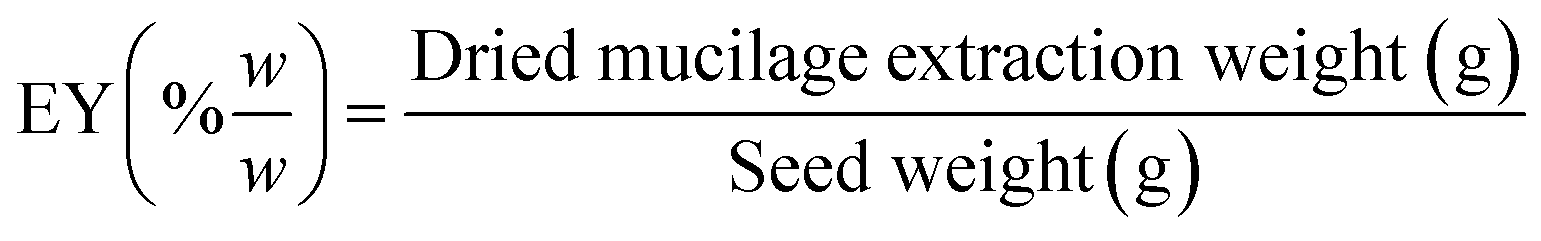
EY was computed as the dry weight of the mucilage powder relative to the seed weight,15 given in eqn (2):| |  | (2) |
Viscosity
A rotational viscometer (AntonPar; Visco-QC-300-R) with a heating circulator was used to measure dynamic shear viscosity by analyzing the torque required to rotate a spindle submerged in the sample at a shear rate of 7.5 s−1. The experiment was conducted at 25 °C.
Emulsion stability index (ESI)
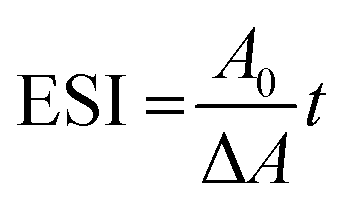
Turbidimetric methods were used to determine the ESI (min),16 which was determined by eqn (3) as follows:| |  | (3) |
where A0 is the absorbance of the diluted emulsion immediately after homogenization; ΔA is the change in absorbance between 0 and 10 min (A0_A10); and t is the time interval, 10 min in this case. Absorbance readings were taken at 500 nm (Spectrophotometer, UV-160A, Shimadzu, Japan).
Proximate composition
The QSM was evaluated for its fat, ash, and moisture contents by using the standard protocols.17 Total nitrogen content (N2) was estimated using the Kjeldahl method, and protein content was calculated by multiplying the nitrogen value by 6.25.11 Carbohydrate content (CHO) was calculated by the subtraction method as shown in eqn (4) below:| | | CHO (%) = 100 − (% moisture + % fat + % protein + % fibre + % ash) | (4) |
Functional properties
Water-holding (WHC) and oil-holding (OHC) capacities were evaluated following the protocols elucidated by Punia & Dhull.18
Differential scanning calorimetry – thermal analysis
Differential scanning calorimeter (DSC) equipment (Mettler–Toledo, Staresystems, Switzerland) was employed to study the thermal transition properties of QSM. Approximately 5 mg of mucilage powder was loaded in an aluminum pan followed by the addition of 8 μL water and sealed hermetically. Under a nitrogen atmosphere flowing at a rate of 40 mL min−1, the temperature of the equipment was designed to increase from −50 °C to 350 °C at a heating rate of 10 °C min−1. The following characteristic thermal parameters were analyzed in the system software after interpreting the data: onset temperature (To), peak temperature (Tp), conclusion temperature (Tc), and enthalpy (ΔH).
Dynamic rheometry
The rheological measurements of QSM were performed on a dynamic rheometer (MCR-101, Anton Paar, Austria) with a 40 mm diameter cone and plate configuration. The strain sweep test was performed to obtain the linear viscoelastic region of the sample, the sample showed 0.01 to 100 LVR region and 1% strain was selected to study the dynamic oscillatory rheology of the samples. 3 mL of QSM sample was placed between the probe and the plate of the rheometer with a gap of 0.5 mm and a thin layer of low-density silicone oil was poured on the sample edges to minimize evaporation losses. The mechanical spectra were initially analyzed by estimating storage (G′) and loss (G′′) moduli against angular frequency (0.01–100 Hz) within the linear viscoelastic range.
Attenuated total reflectance (ATR)-Fourier transform infrared spectroscopy (FTIR)
An FTIR spectrometer system equipped with an ATR accessory (Cary 630 FTIR, Agilent Technologies, USA) was employed to obtain the ATR-FTIR spectra of QSM in the wavelength range of 4000–400 cm−1.
Statistical analysis
All the experiments were performed at least in triplicate. The data were plotted into graphical representations using graphing software (OriginPro 8.5).
Results and discussion
Model fitting
Table 2 depicts an ANOVA for fitting models, which showed that the models developed for EY, viscosity, and ESI were influenced significantly (p < 0.0001) by independent variables. The statistical analysis depicted that the proposed predicted model for EY, viscosity, and ESI was adequate with satisfactory R2 values (multiple correlation coefficient) and no significant lack of fit was observed for all the responses. For EY, viscosity, and ESI, the R2 values were 0.9974, 0.9998, and 0.9996, respectively. Predicted R2 and adjusted R2 were found to be in reasonable agreement for all the significant models.
Table 2 Analysis of variance for the fitted models
|
|
Source |
Coefficient |
Sum of square |
Degree of freedom |
Mean square |
F-value |
p-value |
| Extraction yield (%) |
Residual |
|
0.2682 |
15 |
0.0179 |
|
|
| Lack of fit |
|
0.2375 |
10 |
0.0237 |
3.86 |
<0.0001 |
| Pure error |
|
0.0307 |
5 |
0.0061 |
|
|
| Total |
|
104.94 |
29 |
|
|
|
|
R
2
|
0.9974 |
|
|
|
|
|
| Adj-R2 |
0.9951 |
|
|
|
|
|
| CV |
0.7872 |
|
|
|
|
|
| Adequate precision |
85.13 |
|
|
|
|
|
| Viscosity (mPa s) |
Residual |
|
0.3557 |
15 |
0.0237 |
|
|
| Lack of fit |
|
0.2806 |
10 |
0.0281 |
1.87 |
<0.0001 |
| Pure error |
|
0.0751 |
5 |
0.0150 |
|
|
| Total |
|
1650.90 |
29 |
|
|
|
|
R
2
|
0.9998 |
|
|
|
|
|
| Adj-R2 |
0.9996 |
|
|
|
|
|
| CV |
0.0135 |
|
|
|
|
|
| Adequate precision |
301.73 |
|
|
|
|
|
| Emulsion stability index (min) |
Residual |
|
0.1749 |
15 |
0.0117 |
|
|
| Lack of fit |
|
0.1528 |
10 |
0.0153 |
3.45 |
<0.0001 |
| Pure error |
|
0.0221 |
5 |
0.0044 |
|
|
| Total |
|
478.99 |
29 |
|
|
|
|
R
2
|
0.9996 |
|
|
|
|
|
| Adj-R2 |
0.9993 |
|
|
|
|
|
| CV |
0.1325 |
|
|
|
|
|
| Adequate precision |
232.03 |
|
|
|
|
|
Extraction yield (EY)
The mean values of EY ranged between 13.18 and 21.45% (Table 3). The predicted model for yield in terms of coded levels is given in eqn (6),| | | EY = 16.74 + 4.02A + 0.9667B + 0.385C + 0.6458A2 + 0.3358B2 | (6) |
Table 3 Effect of independent variables on dependent variables
| S. no. |
Water to seed ratio |
Extraction temperature (°C) |
Extraction time (min) |
pH |
Extraction yield (%) |
Viscosity (mPa s) |
Emulsion stability index (min) |
| 1 |
22.00 |
52.50 |
25 |
6 |
15.88 |
1148.24 |
85.13 |
| 2 |
22.00 |
37.50 |
15 |
8 |
14.25 |
1151.95 |
86.65 |
| 3 |
29.50 |
45.00 |
10 |
7 |
16.28 |
1143.11 |
81.89 |
| 4 |
37.00 |
52.50 |
15 |
8 |
19.33 |
1133.68 |
76.87 |
| 5 |
37.00 |
37.50 |
15 |
8 |
18.27 |
1134.90 |
77.71 |
| 6 |
37.00 |
37.50 |
25 |
8 |
18.61 |
1134.42 |
77.29 |
| 7 |
29.50 |
45.00 |
20 |
5 |
16.88 |
1142.82 |
81.15 |
| 8 |
37.00 |
37.50 |
25 |
6 |
18.84 |
1134.21 |
77.18 |
| 9 |
22.00 |
37.50 |
25 |
6 |
14.93 |
1150.42 |
86.00 |
| 10 |
29.50 |
45.00 |
20 |
7 |
16.63 |
1142.70 |
81.82 |
| 11 |
22.00 |
37.50 |
15 |
6 |
14.47 |
1151.64 |
86.16 |
| 12 |
29.50 |
45.00 |
20 |
9 |
16.94 |
1143.08 |
82.02 |
| 13 |
29.50 |
45.00 |
30 |
7 |
17.06 |
1141.51 |
81.42 |
| 14 |
37.00 |
52.50 |
15 |
6 |
19.53 |
1133.18 |
76.66 |
| 15 |
22.00 |
52.50 |
15 |
8 |
15.34 |
1149.94 |
85.79 |
| 16 |
44.50 |
45.00 |
20 |
7 |
21.45 |
1124.43 |
71.87 |
| 17 |
29.50 |
45.00 |
20 |
7 |
16.68 |
1142.64 |
81.77 |
| 18 |
29.50 |
30.00 |
20 |
7 |
16.19 |
1143.30 |
82.64 |
| 19 |
29.50 |
60.00 |
20 |
7 |
17.82 |
1139.91 |
81.08 |
| 20 |
22.00 |
37.50 |
25 |
8 |
14.69 |
1150.82 |
86.44 |
| 21 |
22.00 |
52.50 |
15 |
6 |
15.51 |
1149.34 |
85.58 |
| 22 |
29.5.0 |
45.00 |
20 |
7 |
16.73 |
1142.58 |
81.74 |
| 23 |
37.00 |
52.50 |
25 |
6 |
19.82 |
1132.24 |
76.12 |
| 24 |
22.00 |
52.50 |
25 |
8 |
15.74 |
1149.05 |
85.35 |
| 25 |
14.50 |
45.00 |
20 |
7 |
13.18 |
1157.51 |
89.34 |
| 26 |
29.50 |
45.00 |
20 |
7 |
16.79 |
1142.51 |
81.70 |
| 27 |
29.50 |
45.00 |
20 |
7 |
16.84 |
1142.45 |
81.67 |
| 28 |
37.00 |
37.50 |
15 |
6 |
18.46 |
1135.05 |
77.47 |
| 29 |
37.00 |
52.50 |
25 |
8 |
19.71 |
1132.76 |
76.43 |
| 30 |
29.50 |
45.00 |
20 |
7 |
16.79 |
1142.37 |
81.64 |
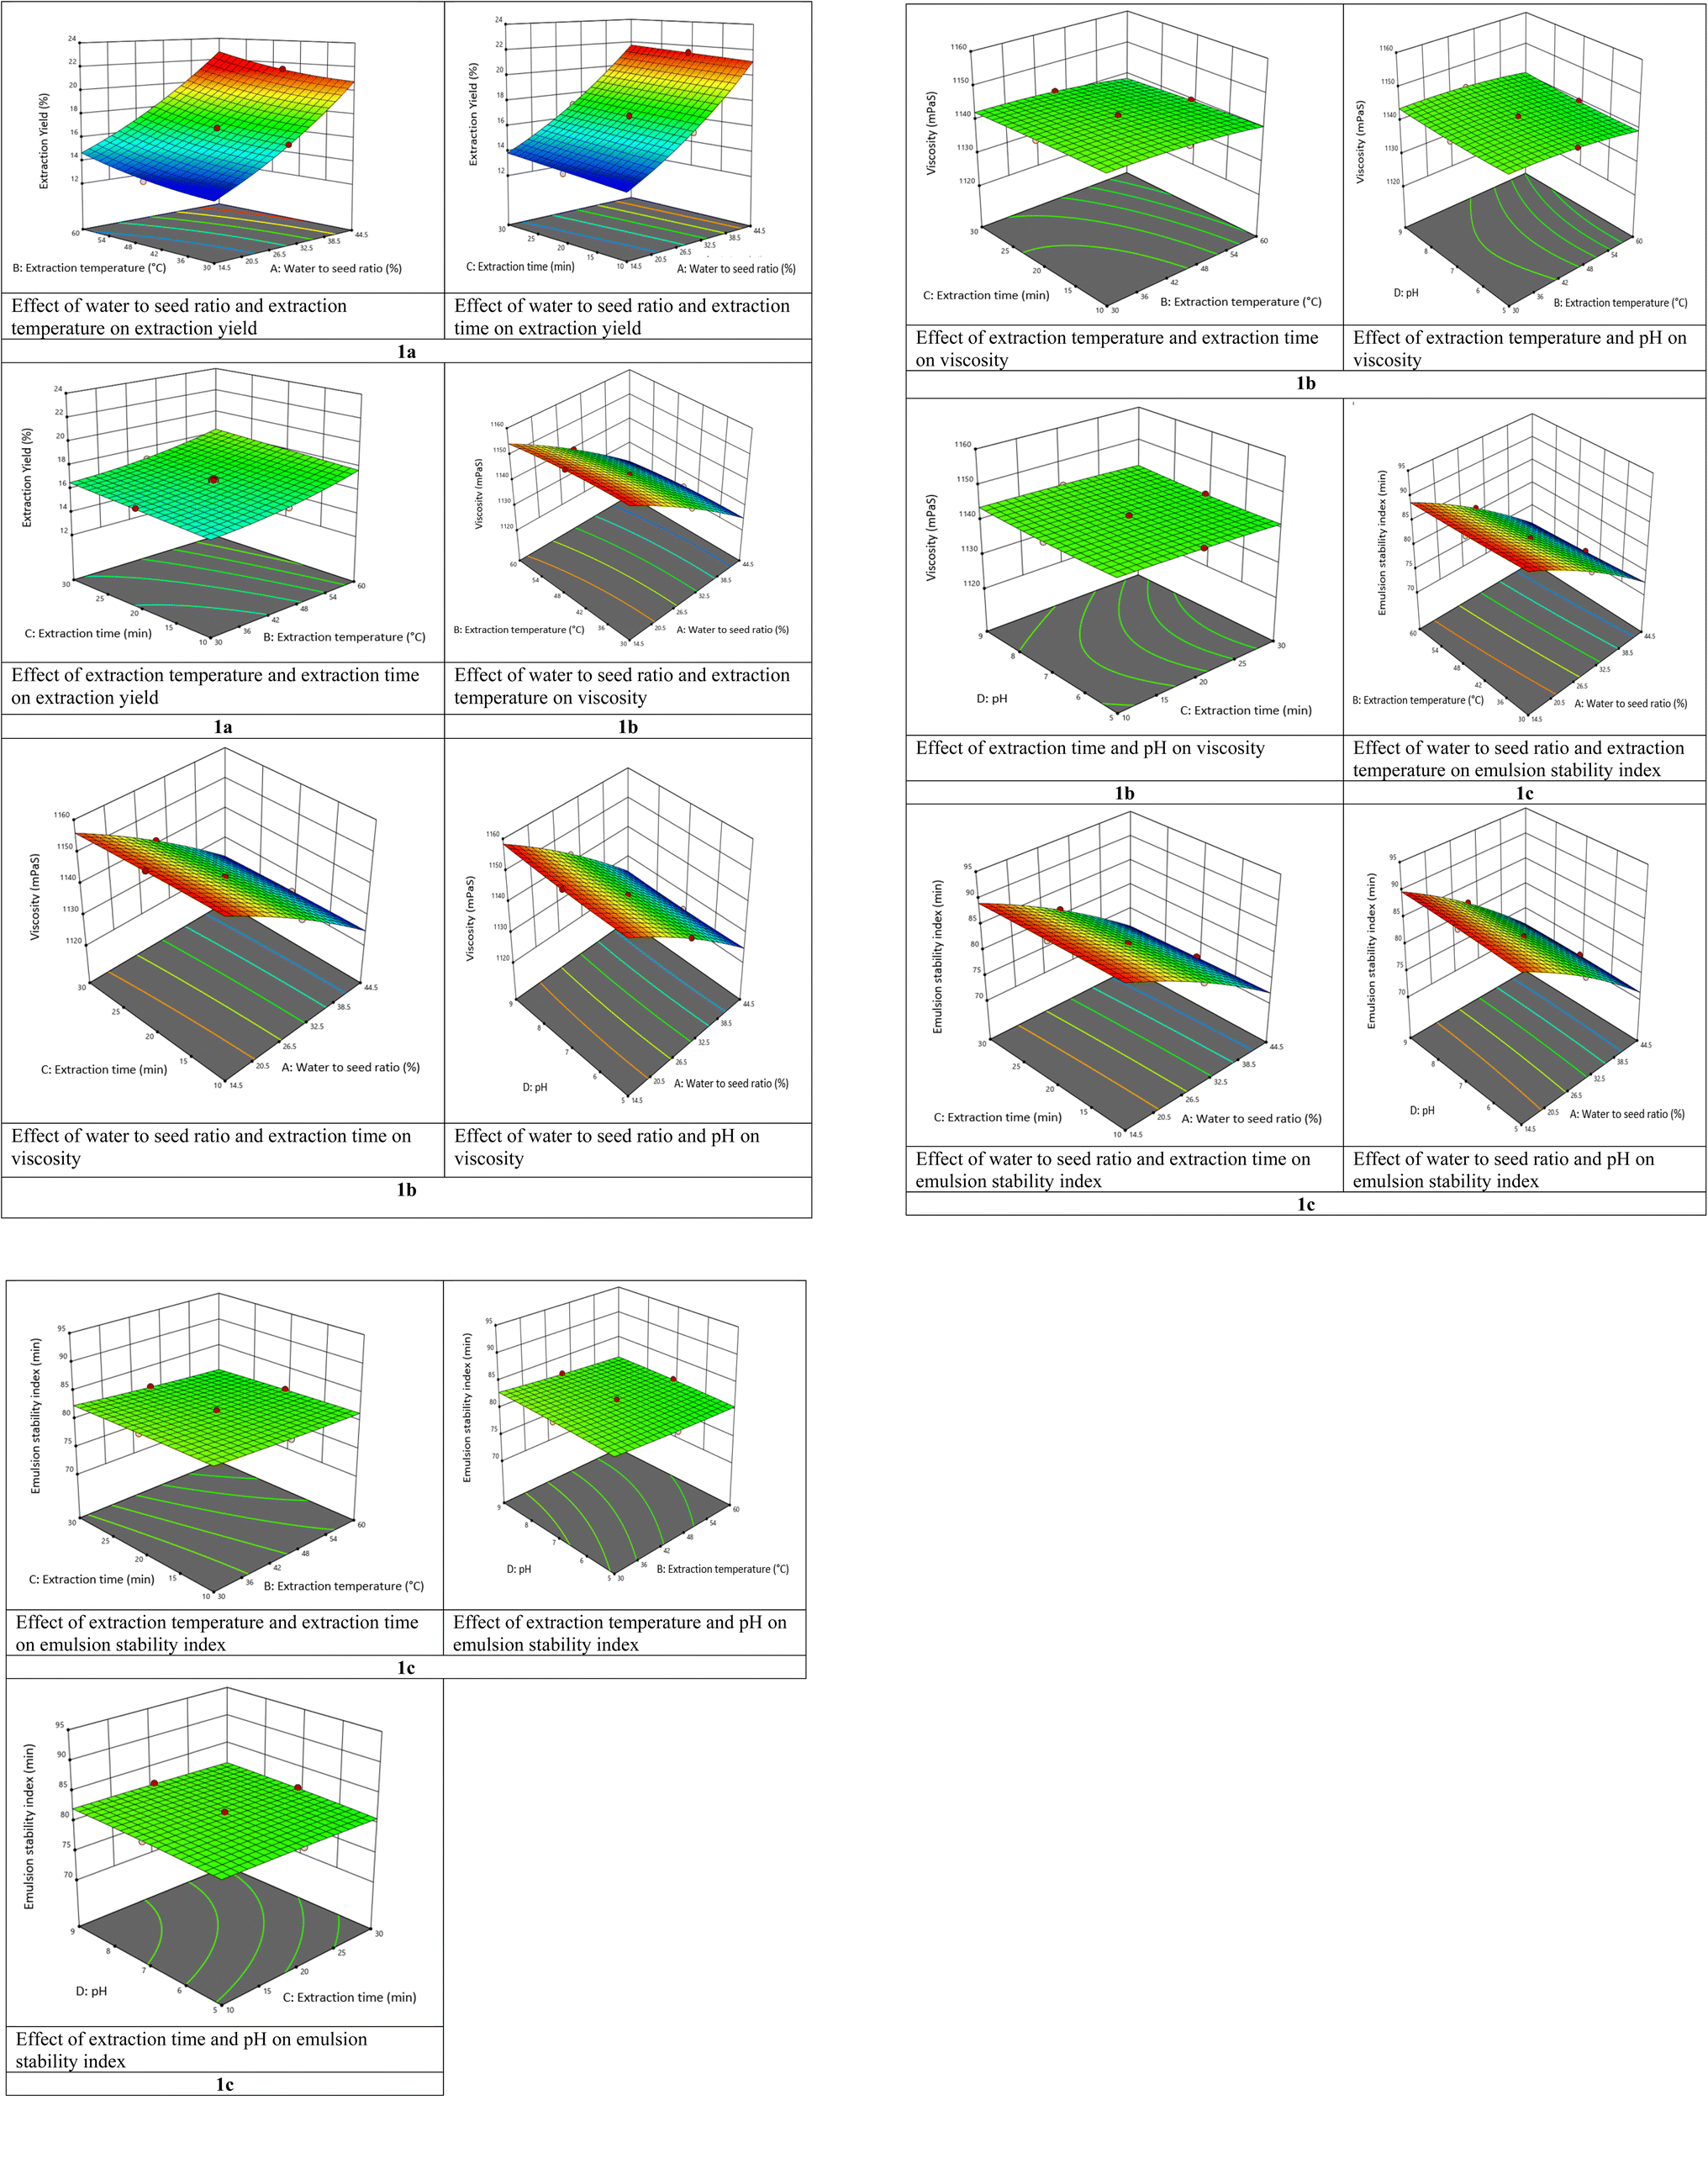
From the model of EY, positive linear effects of W/S ratio (A), extraction temperature (B), and extraction time (C) were significant (p < 0.0001). Therefore, increased extraction time, W/S ratio, and extraction temperature enhance the EY of mucilage from quince seeds (Fig. 1a). The EY increased considerably at a higher W/S ratio, which may be because of the accessibility of extra fluid that enhances the driving force of mucilage out of the seeds.13,19 Jouki et al.11 observed similar findings during extraction of quince mucilage. The EY also improved linearly with temperature. Temperature enhances the capacity of the liquid solvent to dissolve substances besides a decrease in viscosity, permitting the solvent to penetrate deeper into the matrix of solid.13,19 The EY is also influenced by extraction time, which could be attributed to the duration of time when the QSM was exposed to the release medium during which the fluid penetrated the quince seed, dissolved the mucilage, and eventually diffused out of the raw materials.11 Samavati19 investigated the EY of okra crude polysaccharides, which improved with time linearly. pH had no significant effect on EY. The results are in line with Koocheki et al.20 who recorded the minimal influence of pH on EY in Alyssum homolocarpum.
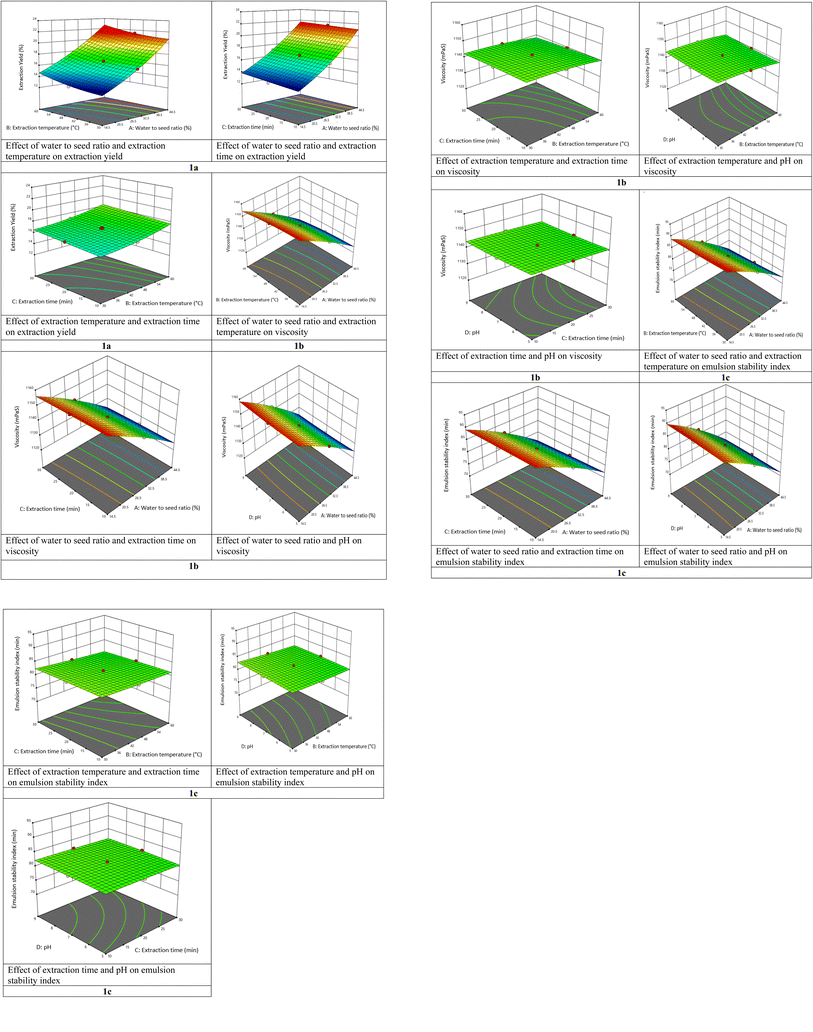 |
| | Fig. 1 Effect of independent variables on dependent variables. | |
Viscosity
The mean values of viscosity ranged between 1124.43 and 1157.51 mPa s (Table 3). The regression model for viscosity in terms of coded levels is given in eqn (7),| | | V = 1142.54 – 16.43A − 1.81B − 0.893C − 0.310D + 0.385AB − 1.55A2 | (7) |
From the model of viscosity, negative linear effects of W/S ratio (A), extraction temperature (B) and extraction time (C), and positive linear effect of pH (D) were significant (p < 0.0001). Therefore, higher extraction temperature, W/S ratio, and extraction time reduce the viscosity, while higher pH enhances the viscosity of QSM (Fig. 1b). Viscosity reduced with increasing W/S ratio. This could be owing to the differences in the components and gel structure, such as minerals, proteins, polysaccharides, and lipid fraction, which all directly affect the viscosity.11 Further, the viscosity also decreased as the extraction temperature and time were raised from 30 to 60 °C and 10 to 30 minutes, respectively. This is due to the weakening of the associations of the molecules in solution as the temperature rises. The decline in mucilage viscosity with increasing temperature could be due to irreversible conformational changes in molecules.21 The results were in line with those obtained by Koocheki et al.13 for mucilage isolated from Lepidium perfoliatum seeds. Higher pH at low W/S ratio enhanced the viscosity intensely. Amini et al.22 revealed a similar pattern for Balangu seed gum.
Emulsion stability index (ESI)
ESI demonstrates the capacity to provide strength to the emulsion to withstand destabilizing changes including flocculation, creaming, coalescence, or sedimentation over a specific period of time.23 The mean values of ESI ranged between 71.87 and 89.34 min (Table 3). The regression model for ESI in terms of coded levels is given in eqn (8),| | | ESI = 81.72 – 8.86A − 0.84B − 0.324C + 0.33D − 1.12A2 | (8) |
From the model of ESI, negative linear effects of W/S ratio (A), extraction temperature (B) and extraction time (C), and positive linear effect of pH (D) were significant (p < 0.0001). Therefore, higher extraction temperature, W/S ratio, and extraction time reduce ESI, while higher pH enhances the ESI of QSM (Fig. 1c). The ESI of mucilage declined with higher time as well as temperature. A rise in extraction time at elevated temperatures had minimal influence on the stabilizing characteristics of mucilage isolated from quince seeds. The stabilizing influence of mucilage was proportional to the W/S ratio and declined exponentially as the W/S ratio increased. At higher W/S ratio, pH had no influence on the stabilizing characteristic of mucilage; however, at lesser W/S ratio, higher pH marginally improved this effect.13 These parameters have a similar influence on the stabilizing property of QSM as was recorded for the viscosity of this mucilage. According to Bostan et al.24 increased temperature reduced the stabilizing impact of hydrocolloids isolated from S. macrosiphon seeds, while pH had no influence on this property.
Optimization and validation
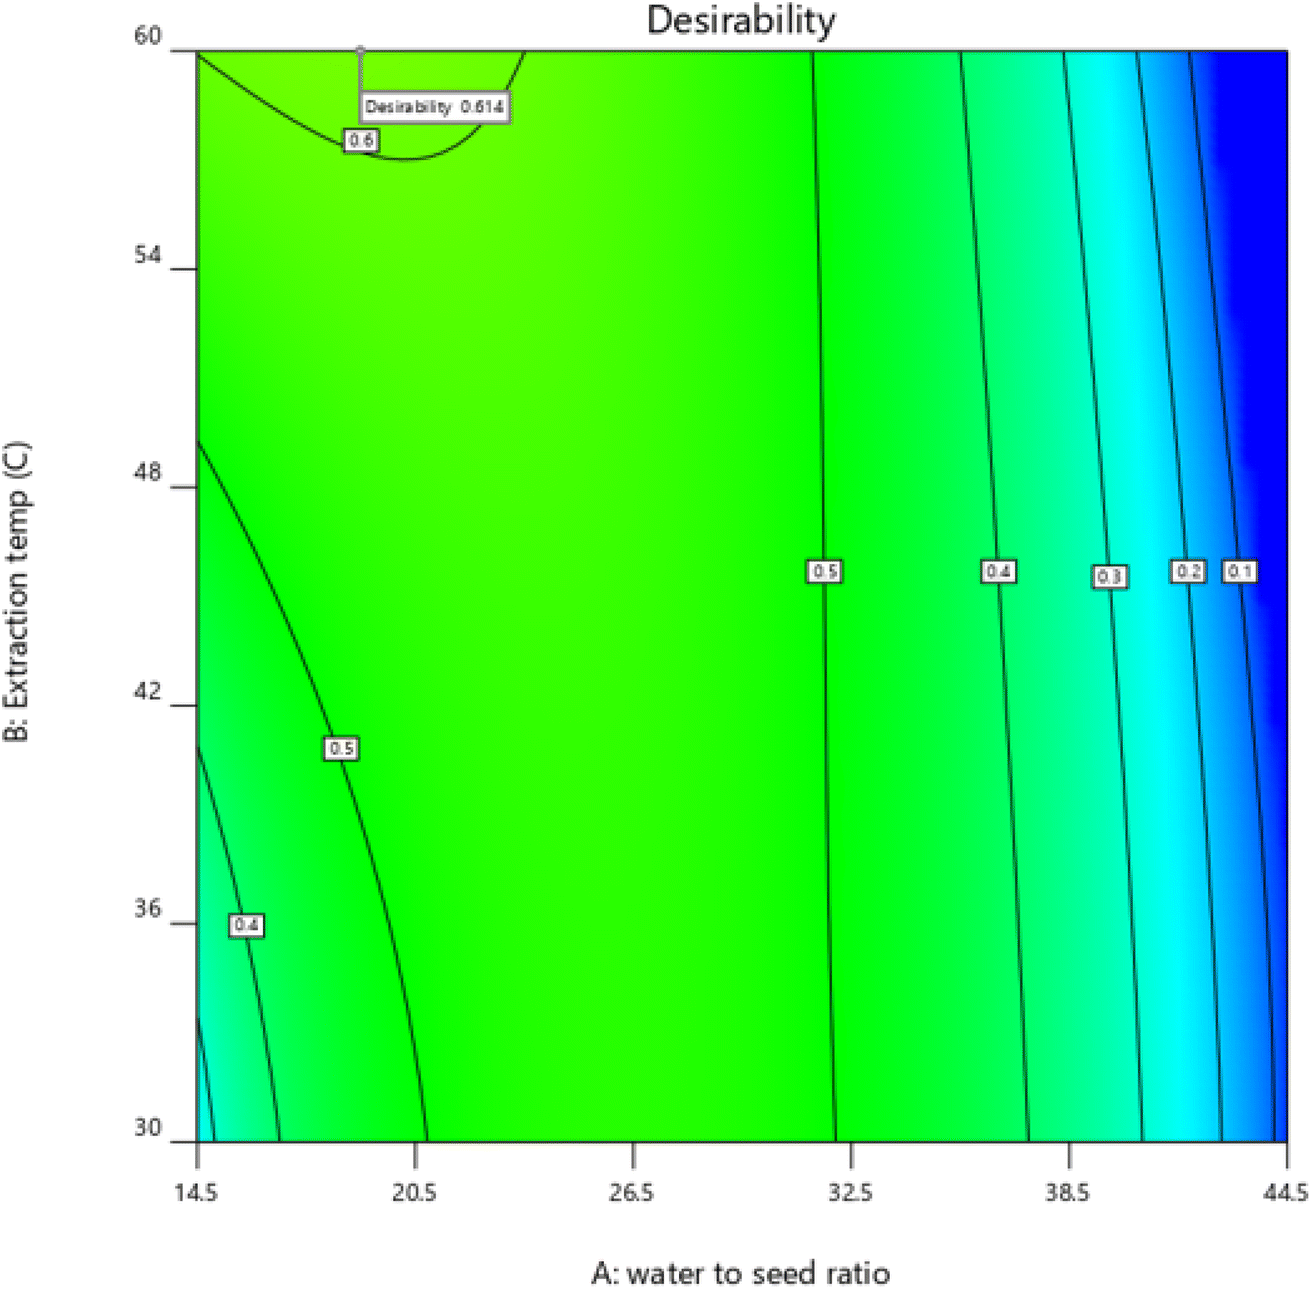
The optimum extraction conditions for QSM were designed to maximize EY, viscosity, and ESI. The predicted conditions provide the maximum value of EY = 16.1%, viscosity = 1150.50 mPa s, and ESI = 86.40 min. This suggests that the following conditions were optimum for extracting mucilage from quince seeds: 19:1 W/S ratio, 60 °C extraction temperature, 15 min extraction time, and 9 pH. Fig. 2 depicts a graphical optimum extraction region. The experimental values for EY (16.17%), viscosity (1143.22 mPa s), and ESI (84.62 min) were almost comparable to the predicted values with a variation of less than 4%. These findings depicted that the predicted and experimental values were in reasonable agreement, implying that the models are satisfactory and accurate. Earlier, Jouki et al.11 observed that the optimum condition for QSM was a temperature of 65 °C, a time of 5 min, and W/S ratio of 25.1:1 to give a yield = 11.58% and viscosity = 1473.96 mPa s, which is very close to the present study. Similarly, Bostan et al.16 observed that the optimum condition for wild sage seeds (Salvia macrosiphon) was a pH of 5.5, W/S ratio of 51:1 and temperature of 25 °C, to give a viscosity of 316 (mPa s), and yield of 9.97% at a shear rate of 122 s−1.
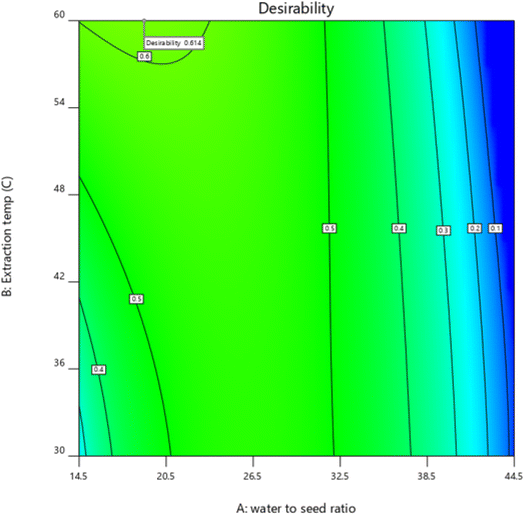 |
| | Fig. 2 Desirability function of QSM. | |
Proximate composition
Table 4 lists the proximate composition of mucilage extracted from quince seeds under the optimum conditions. The data revealed that QSM showed 7.41% moisture, 6.53% ash, 1.87% fat, 2.67% protein, and 81.52% carbohydrates. The results were comparable to the previous reports on chemical composition conducted by Jouki et al.11 on QSM. Because of the high total carbohydrate content, the QSM was extremely pure, composed largely of saccharides. Razavi et al.25 similarly reported sage seed gum to contain a significant polysaccharide content (69.96%).
Table 4 Chemical composition and functional properties of quince seed mucilagea
| Parameters |
Quince seed mucilage |
|
Values are mean ± SD of three determinations.
|
|
Proximate
|
| Moisture (%) |
7.41 ± 0.56 |
| Fat (%) |
1.87 ± 0.07 |
| Ash (%) |
6.53 ± 0.43 |
| Protein (%) |
2.67 ± 0.15 |
| Carbohydrates (%) |
81.52 ± 1.78 |
|
|
Functional
|
| Water holding capacity (g g−1) |
92.50 ± 1.63 |
| Oil holding capacity (g g−1) |
19.30 ± 0.59 |
Functional properties
Table 4 lists the functional properties of QSM extracted under the optimum conditions. Water holding capacity (WHC) expresses the potential of a moist polymer to retain moisture when subjected to an external centrifugal force of gravity. It contains the sum of hydrodynamic water, physically bound water, and linked water, with the former contributing most to this value.26 QSM exhibited a high level of WHC (92.5 ± 1.63 g g−1), which may be due to the presence of protein substituents and hydroxyl groups in the mucilage and gum structure.27 Certain food items require a high degree of WHC in order to strengthen their structure and decrease loss of moisture during the cooking process.28 Oil holding capacity (OHC) is the most critical functional feature of hydrocolloids, which reflects oil absorption capacity. QSM was reported to have an adequate OHC (19.3 ± 0.59 g g−1), enabling it to play a pivotal role in the processing of food, since fat acts on flavor retention and improves the mouthfeel of foods. Therefore, QSM can be used as a useful functional component in food formulations.18
Differential scanning calorimetry
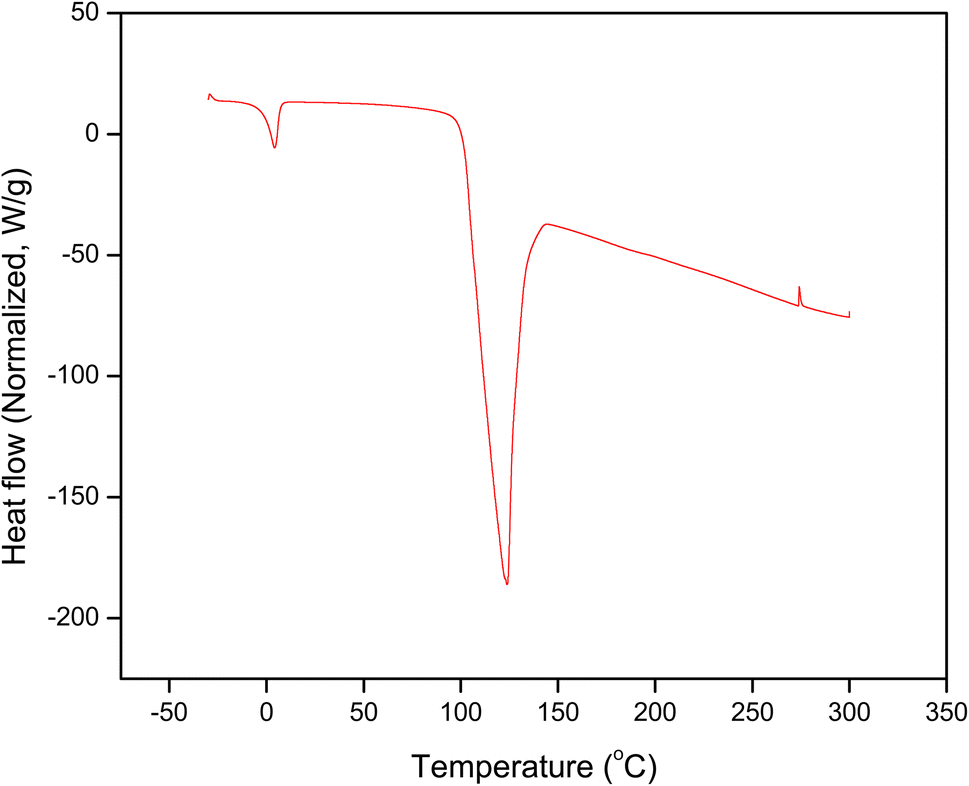
Outcomes of differential scanning calorimetry of QSM are presented in Fig. 3, which indicates the important endothermic as well as exothermic phases of heat transfer. The endothermic and exothermic peaks are related to the moisture evaporation and the degradation of gums.29 The initial endothermic transition was noticed between 4.66 and 9.42 °C with the peak at 5.08 °C, which is related to the removal of moisture (free water) from the QSM powder. Another endothermic transition for QSM was noticed in the temperature range of 101.20 °C to 142.84 °C with the peak at 123.75 °C, which is ascribed to the release of hydrating water (bound water). Water vaporization indicates the presence of hydrophilic groups in the samples.3 The two endothermic peaks correspond to enthalpy changes (ΔH) of 109.50 J g−1 and 288.80 J g−1, respectively. Also, an exothermic peak for QSM was recorded in the DSC thermograms with a temperature range of 273.44 °C to 276.17 °C with the peak at 274.81 °C, indicating oxidative degradation or decomposition of the polysaccharide structure. ΔH values (7.26 J g−1) of the exothermic peak were much lower compared to endothermic peaks. The endothermic peak has a greater ΔH value, suggesting that it takes more energy to release water due to the loss of crystallization and hydrogen bonds.18 Timilsena et al.30 previously observed that chia seed gum had two endothermic and one exothermic peaks.
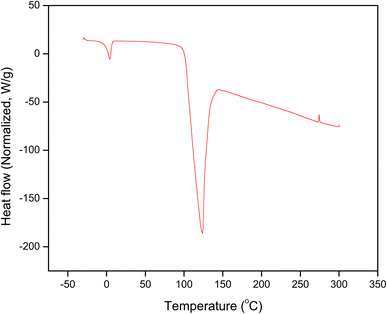 |
| | Fig. 3 Differential scanning calorimetry of quince seed mucilage. | |
Dynamic rheometry
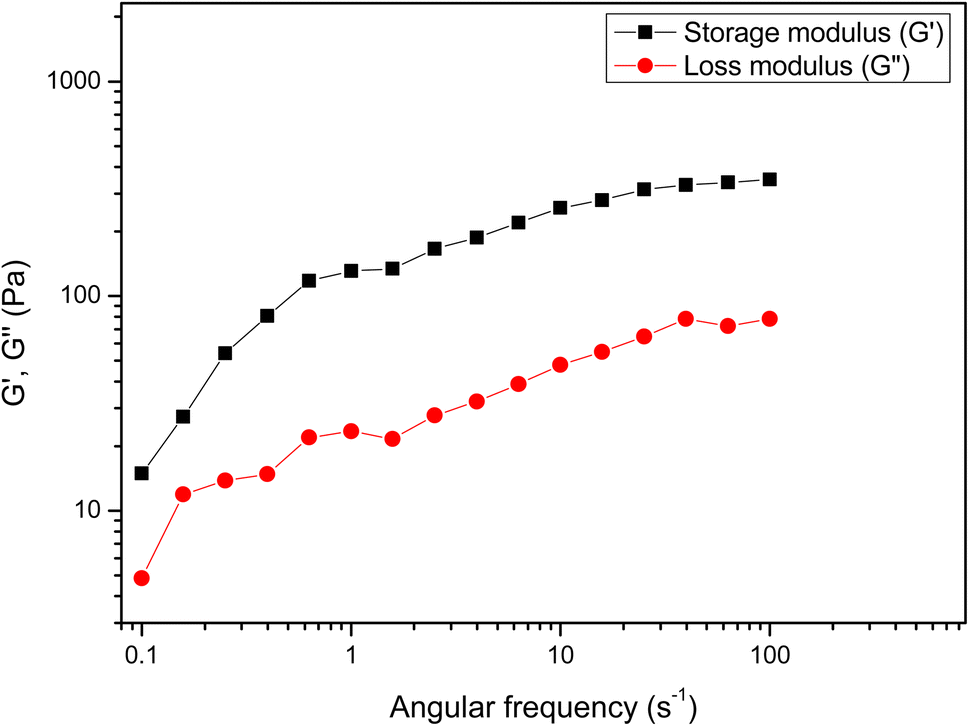
The dynamic storage (G′) and loss (G′′) moduli, which define elastic and viscous properties, are typically examined using the frequency sweep test. The rheological characteristics of QSM in terms of G′ and G′′ against frequency change (0.01–100 Hz) are presented in Fig. 4. It was observed that both G′ and G′′ were frequency-dependent and the G′ was larger than G′′ throughout the whole range of frequency, which confirmed that QSM exhibited more semi-solid like than liquid-like behaviour. G′ was higher than G′′, which depicted that the QSM tended to form macromolecular networks with a more elastic behavior. Medina-Torres et al.31 recorded a greater elastic behavior compared to viscous behavior (G′ > G′′) due to the temporal network structure in QSM. Abbastabar et al.32 revealed a similar observation for quince seed mucilage.
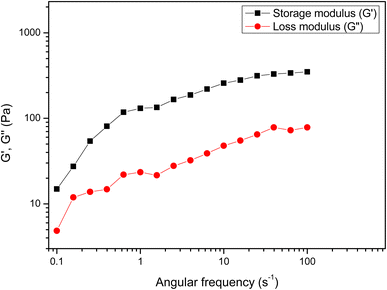 |
| | Fig. 4 Dynamic rheometry of quince seed mucilage. | |
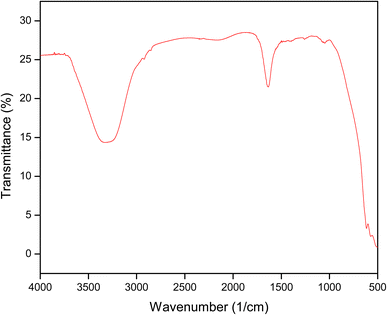
ATR-FTIR
QSM was characterized using ATR-FTIR spectroscopy based on spectral differences observed from 4000 to 400 cm−1 (Fig. 5). The QSM showed a broad band at 3323 cm−1, which corresponds to stretching of –OH groups of QSM, thus indicating the higher strengthening of inter and intramolecular bonds.33 Furthermore, the band observed between 1633 and 1784 cm−1 corresponds to C![[double bond, length as m-dash]](https://www.rsc.org/images/entities/char_e001.gif) O asymmetric and symmetric stretching vibrations of COOH. According to Dodi et al.34 the addition of carboxymethyl groups into the gum molecule is responsible for CO asymmetric and symmetric stretching. The characteristic peaks observed at 1437 to 1534 cm−1 could be attributed to resonance as COOH functional groups exist as COO− ions.35 The peaks observed between 614 and 1254 cm−1 could be ascribed to the β-D-glycosidic linkages of uronic acid in the polysaccharide structures.36 These characteristic functional groups in mucilage have previously been investigated by different researchers.11,30
O asymmetric and symmetric stretching vibrations of COOH. According to Dodi et al.34 the addition of carboxymethyl groups into the gum molecule is responsible for CO asymmetric and symmetric stretching. The characteristic peaks observed at 1437 to 1534 cm−1 could be attributed to resonance as COOH functional groups exist as COO− ions.35 The peaks observed between 614 and 1254 cm−1 could be ascribed to the β-D-glycosidic linkages of uronic acid in the polysaccharide structures.36 These characteristic functional groups in mucilage have previously been investigated by different researchers.11,30
 |
| | Fig. 5 ATR-FTIR of quince seed mucilage. | |
Conclusion
The response surface methodology was proven to be successful for optimization of extraction conditions of QSM. The study revealed the significant effect of independent variables on dependent variables such as EY, viscosity, and ESI. Extraction yield increased with an increase in W/S ratio, whereas viscosity and ESI reduced with a rise in W/S ratio. The same pattern was recorded concerning extraction time and temperature. However, pH had the least significant effect on all the dependent variables studied. The optimum extraction condition determined by numerical optimization was found to be pH 9, extraction time of 15 min, extraction temperature of 60 °C, and W/S ratio of 19:1. Furthermore, the optimized extraction condition was examined for functional, thermal, and rheological characteristics. QSM showed high WHC and adequate OHC, which depicted that it can be used as a functional constituent in formulations of food. Thermal analysis showed that mucilage exhibited both endothermic and exothermic peaks, while the frequency sweep test determined that storage modulus was higher than the loss modulus at all frequencies. The ATR-FTIR spectrum of mucilage was recorded to explore the chemical structure of mucilage. We believe there may be a huge market for quince seed hydrocolloid products which consumers may find appealing due to their natural origin and therapeutic benefits.
Conflicts of interest
The authors declare no conflict of interest.
Acknowledgements
Authors are thankful to Dr Nusrat Jan and SKUAST-Kashmir for assistance.
References
- F. Ma, R. Wang, X. Li, W. Kang, A. E. Bell, D. Zhao, X. Liu and W. Chen, Food Chem., 2020, 311, 126039 CrossRef CAS PubMed.
- T. K. F. S. Freitas, V. M. Oliveira, M. T. F. de Souza, H. C. L. Geraldino, V. C. Almeida, S. L. Fávaro and J. C. Garcia, Ind. Crops Prod., 2015, 76, 538–544 CrossRef CAS.
- G. Archana, K. Sabina, S. Babuskin, K. Radhakrishnan, M. A. Fayidh, P. Azhagu Saravana Babu, M. Sivarajan and M. Sukumar, Carbohydr. Polym., 2013, 98, 89–94 CrossRef CAS PubMed.
-
M. Glicksman, Food Hydrocolloid,CRC Press Inc, Boca Raton, 1982 Search PubMed.
-
F. Smith and R. Montgomery, The Chemistry of Plant Gums and Mucilages, Rein-hold, New York, 1959 Search PubMed.
- M. Jouki, F. T. Yazdi, S. A. Mortazavi and A. Koocheki, Int. J. Biol. Macromol., 2013, 62, 500–507 CrossRef CAS PubMed.
- B. M. Silva, P. B. Andrade, F. Ferreres, R. M. Seabra, M. B. P. P. Oliveir and M. A. Ferreira, Nat. Prod. Res., 2005, 19(3), 275–281 CrossRef CAS PubMed.
- Y. Wu, S. W. Cui, J. Tang and X. Gu, Food Chem., 2007, 105, 1599–1605 CrossRef CAS.
- V. Samavati and A. Manoochehrizadeh, Int. J. Biol. Macromol., 2013, 60, 427–436 CrossRef CAS PubMed.
- H. Karazhiyan, S. M. A. Razavi and G. O. Phillips, Food Hydrocolloids, 2011, 25, 915–920 CrossRef CAS.
- M. Jouki, A. A. Mortazavi, F. T. Yazdi and A. Koocheki, Int. J. Biol. Macromol., 2014, 66, 113–124 CrossRef CAS PubMed.
- J. V. Patmore, H. D. Goff and S. Fernandes, Food Hydrocolloids, 2003, 17, 161–169 CrossRef CAS.
- A. Koocheki, A. R. Taherian, S. M. A. Razavi and A. Bostan, Food Hydrocolloids, 2009, 23, 2369–2379 CrossRef CAS.
-
P. A. Williams and G. O. Phillips, Handbook of Hydrocolloid, Woodhead Publishing, New York, 2nd edn, 2009 Search PubMed.
- V. Samavati and F. Skandari, Int. J. Biol. Macromol., 2014, 67, 172–179 CrossRef CAS PubMed.
- A. Bostan, S. M. A. Razavi and R. Farhoosh, Int. J. Food Prop., 2010, 13(6), 1380–1392 CrossRef CAS.
-
AOAC, AOAC Official Methods of Analysis, Association of Official Analytical Chemists, Arlington, 18th edn, 2005 Search PubMed.
- S. Punia and S. B. Dhull, Int. J. Biol. Macromol., 2019, 140 Search PubMed.
- V. Samavati, Carbohydr. Polym., 2013, 95(1), 588–597 CrossRef CAS PubMed.
- A. Koocheki, S. A. Mortazavi, F. Shahidi, S. M. A. Razavi, R. Kadkhodaee and J. Milani, J. Food Process Eng., 2010, 33(5), 861–882 Search PubMed.
- M. Estevez, C. Saenz, M. L. Hurtado, B. Escobar, S. Espinoza and C. Suarez, J. Sci. Food Agric., 2004, 84, 1487–1492 CrossRef.
-
M. A. Amini, M. H. Haddad Khodaparast and R. Farhoosh, Effect of Balangu Seed Gum on the Rheological and Sensory Properties of Iranian Flat Bread, MSc thesis, Ferdowsi University of Mashhad, Iran, 2007 Search PubMed.
- E. Drozlowska, L. Lopusiewicz, M. Mezynska and A. Bartkowiak, Biomolecules, 2020, 10, 153 CrossRef CAS PubMed.
-
A. Bostan, S. M. A. Razavi and R. Farhoosh, Optimization of Extraction Process of Crude Hydrocolloid from Wild Sage Seed (Salvia Macrosiphon) and Evaluation of its Time-independent Rheological Properties, MSc thesis, Ferdowsi University of Mashhad, Iran, 2008 Search PubMed.
- S. M. A. Razavi, S. W. Cui, Q. Guo and H. Ding, Food Hydrocolloids, 2014, 35, 453–462 CrossRef CAS.
- E. Alpizar-Reyes, H. Carrillo-Navas, R. Gallardo-Rivera, V. Varela-Guerrero, J. Alvarez-Ramirez and C. Pérez-Alonso, J. Food Eng., 2017, 209, 68–75 CrossRef CAS.
- M. M. Tosif, A. Najda, A. Bains, R. Kaushik, S. B. Dhull, P. Chawla and M. Walasek-Janusz, Polymers, 2021, 13(7), 1066 CrossRef CAS PubMed.
- B. L. Olivos-Lugo, M. A. Valdivia-Lopez and A. Tecante, Food Sci. Technol. Int., 2010, 16(1), 89–96 CrossRef CAS PubMed.
- R. M. A. Daoub, A. H. Elmubarak, M. Misran, E. A. Hassan and M. E. Osman, J. Saudi Soc. Agric. Sci., 2016, 17(3), 241–249 Search PubMed.
- Y. P. Timilsena, R. Adhikari, S. Kasapis and B. Adhikari, Carbohydr. Polym., 2016, 136, 128–136 CrossRef CAS PubMed.
- L. Medina-Torres, E. Brito-De La Fuente, B. Torrestiana-Sanchez and S. Alonso, Carbohydr. Polym., 2003, 52(2), 143–150 CrossRef CAS.
- B. Abbastabar, M. H. Azizi, A. Adnani and S. Abbasi, Food Hydrocolloids, 2014, 1–6 Search PubMed.
- H. Hosseinzadeh and S. Mohammadi, Carbohydr. Polym., 2015, 134, 213–221 CrossRef CAS PubMed.
- G. Dodi, D. Hritcu and M. I. Popa, Cellul. Chem. Technol., 2011, 45(3), 171–176 CAS.
- T. J. Hakala, V. Saikko, S. Arola, T. Ahlroos, A. Helle, P. Kuosmanen, K. Holmberg, M. B. Linder and P. Laaksonen, Tribol. Int., 2014, 77, 24–31 CrossRef CAS.
- P. Khondka, Mycobiology, 2009, 37(4), 286 CrossRef PubMed.
|
| This journal is © The Royal Society of Chemistry 2023 |
Click here to see how this site uses Cookies. View our privacy policy here. 
 Open Access Article
 This Open Access Article is licensed under a
  and
Shrikant S.
Maktedar
*
and
Shrikant S.
Maktedar
*