
 Open Access Article
 This Open Access Article is licensed under a
 Creative Commons Attribution 3.0 Unported Licence
Analysis of environmental sustainability of Cameroon tea production: an LCA study
Rufis Fregue
Tiegam Tagne
 *ab,
Amos
Ncube
c,
Junie Albine
Kenfack Atangana
a,
Donald Raoul
Tchuifon Tchuifon
*bd,
Francois Rene
Ateba
a and
Ivane Christelle
Azambou
b
*ab,
Amos
Ncube
c,
Junie Albine
Kenfack Atangana
a,
Donald Raoul
Tchuifon Tchuifon
*bd,
Francois Rene
Ateba
a and
Ivane Christelle
Azambou
b
aDepartment of Paper Sciences and Bioenergy, University Institute of Wood Technology, University of Yaoundé I, Mbalmayo, Cameroon. E-mail: rufistagne@yahoo.fr
bDepartment of Chemistry, Research Unit of Noxious Chemistry and Environmental Engineering, Faculty of Science, University of Dschang, Dschang, Cameroon
cDepartment of Science and Technology, Parthenope University of Napoli, Italy
dDepartment of Process Engineering, National Higher Polytechnic School of Douala, University of Douala, Douala, Cameroon
First published on 19th December 2022
Abstract
Tea has received a lot of attention over the past few decades as the second most consumed beverage in the world after water. Due to the complex nature of tea cultivation and its high production and consumption intensity, concern over its environmental impact is warranted. This study consists of assessing the environmental sustainability of tea cultivation, harvesting and processing as a case study, based on the Cameroon Tea Estates company. The life cycle methodology (LCA) at the screening level is applied to identify critical hotspots to allow for the reduction of environmental impacts associated with tea production in Cameroon. The company “Cameroon Tea Estates”, which is the first national tea production company, was proposed as a case study. Data were collected through face-to-face questionnaires with the company's employers. SimaPro software version 9.1.1.1, the Ecoinvent database v.3.6 and the ReCiPe Midpoint (H) (2016) method were used for the assessment. All 18 impact categories from the ReCiPe method were included in assessing the environmental impacts of tea production. According to the results, reported for 1 ha of cultivation as a functional unit, the global warming potential gives a total value of 34 kg CO2 eq. The most affected impact categories include freshwater ecotoxicity, marine ecotoxicity and human carcinogenic toxicity potential with normalized impacts amounting respectively to 120 × 10; 80 × 10 and 20 × 10 were associated with the use of nitrogen fertilizers and pesticides in the agricultural phase. The typical hotspots are packaging material, herbicides, fertilizers and wood for energy purposes. The results of the flux replacement scenarios showed an attenuation of these hotspots of the order of 95%, 83%, 99% and 98%, respectively. The results of this study draw up an inventory of environmental benefits linked to tea production in Cameroon, which can be considered as the very first regulatory database for this sector, which plays an important role in the country's economy.
1 Introduction
Tea, which is mainly used for its stimulating effects, is an important agricultural export product mainly in an economic context. Its main characteristics such as richness in antioxidants, a moderate caffeine content and the protection of aging cells make tea the second most consumed aromatic drink in the world after water.1 In 2021, more than 6628.4 million kilograms of tea were consumed by two billion people in 125 different countries.2 Cameroon Tea Estates is an agro-industrial company dedicated to the production and marketing of tea. The company's activities revolve around three pillars: the production of tea leaves, their processing into finished products and their marketing. Perched at an altitude of 1850 m, the plantation covers 1660 ha, more than a third of which is covered with tea trees.3 Despite rapid industrialization, Cameroon's economy is mainly based on agriculture and more particularly the cultivation of tea. The company specializes in the production and marketing of black tea. Tea production in Cameroon has increased from 1110 tons in 1971 to 5631 tons in 2020 with an average annual growth of 4.85%, or 0.12% of world teas.4 In 2020, Cameroon Tea Estates produced 4500 tons of tea leaves, of which only 10% is reserved for Cameroon, the rest being exported to Chad or Sudan. Cameroon Tea Estates tea is among the most popular teas in the world because of its quality flavors and growing conditions. Tea is a resource recognized in the country as a main vector for the growth of the Cameroonian economy.3 Cameroon Tea Estates is a real institution which can employ up to 1000 people depending on the needs. The Cameroonian government in the fight against poverty has set aside a special fund worth 1 billion for the digital economy in order to improve the living conditions of farmers. The development of the tea sector is therefore part of one of the main challenges of the government, which is committed to satisfying the local and export markets with significant tea production. However, the practice of this activity has revealed several environmental problems in the target countries, including climate change and pollution.5 Indeed, these agricultural activities have been shown to generate nearly 15% of greenhouse gas emissions, which has been recognized as a problem in agricultural production systems.6In view of the significant production of tea by several national and international companies, it becomes imperative to assess the environmental benefit linked to the production and transformation of this resource by appropriate analytical techniques. In response, Life Cycle Assessment (LCA), recognized as a quantitative analysis method intended to assess the potential environmental impact of a process throughout its life cycle, was developed for this circumstance. The assessment of environmental impacts by this technique is governed by the ISO 14040 standard considered as an environmental analysis tool for the agricultural industry with the aim of verifying the main contributors to the impact.7–10 The main objectives of the LCA are to evaluate the technology implemented, the benefits from an environmental point of view for the inputs, the transformation and the product, which started from creation to the final product.11,12 Several other issues can be considered besides greenhouse gas (GHG) emissions in the environmental impact analysis of tea, such as depletion of abiotic resources, global warming, land use, human toxicity, stratospheric ozone depletion, eutrophication, acidification, and ecotoxicity.13
A review of the literature shows that several studies have already been carried out in order to assess the environmental impacts associated with tea production. Several tea cultivation studies in different countries and regions have shown positive impacts such as carbon sequestration.14–16 Indeed, the work carried out by Taulo et al.17 on the quantification of the environmental impact of the production of one kg of black tea in a production unit in Malawi has shown a global warming potential of 21.14 kg of CO2 equivalent and a eutrophication potential of 0.0028 kg PO4− equivalent. Likewise, the work carried out by Doublet and Jungbluth18 on the analysis of the environmental impact of a 250 ml cup of tea showed an average global warming potential of 0.48 kg of CO2 equivalent with the consumption of electricity as the main contributor. Other work carried out by Yi-Wen1 on Oolong tea has shown that the tea processing phase represents on average 15% of the total impacts. The results obtained from these previous studies suggest the importance of an environmental study from downstream to upstream, that is to say of the production and simultaneous processing of tea in a production plant with the aim to expand the limits of the tea analysis system to bring about more phases to the tea life cycle. These studies have provided good results as a basis for an environmental repertoire of tea production, but have certain limitations such as not taking into account fundamental aspects of the origins of tea/tea varieties. These limitations can best be overcome by performing LCA in multiple geographic areas, where culture is increasingly expressed locally.
Cultivation practices and land use management systems can greatly affect ecosystems and contribute, with a wide array of emissions, to different environmental impacts, including climate change, while tea cultivation is an important factor in this regard given the tea's global consumption patterns. As such, the investigation of the environmental sustainability of tea production systems is a subject that merits further investigation, even though it has already been examined under different cultivation systems and spatial settings. This LCA adds data for a spatial extent (Cameroon) and a company (Cameroon Tea Estates) that have not been covered in the literature, which comprise its main strength. Although Cameroon is the leading tea producer in Central Africa, no research to date has been done to assess the environmental impact linked to tea production in Cameroon. In addition to its rank as a leader in production, many questions and problems arise, namely (1) is this tea production and transformation process in Cameroon an environmentally friendly process? And (2) what is the environmental benefit of the domestic tea production and processing process? Therefore, this study aims to assess the environmental impact associated with the production and processing of Cameroon Tea Estates. This study therefore aims to take stock of the life cycle impact associated with the production of tea plantations in Cameroon by assessing the main contributors during the process. The objective of this study concerns Cameroonian tea, produced by a company called “Cameroon Tea Estates” created in 2002. The novelty value of this study consists in filling a gap related to the origin of Cameroonian tea by carrying out a life cycle analysis of the tea production chain by identifying the hot spots relating to the highest environmental impacts. This study finds its interest in the concern of a sustainable development making it possible to quantify the environmental impacts in order to better inform the industry of Cameroon Tea Estates and the Cameroonian government for decision making.
2 Materials and methods
The present study was carried out in the West region of Cameroon, Menoua division where tea cultivation is the main agricultural activity generating resources and covering more than 80% of the total tea produced in Cameroon.3 The basic data namely fertilizers, pesticides, irrigation, energy and labor designed and developed on the basis of the ISO 14044 standard were collected during a field visit to the officials and employers of Cameroon Tea Estates.19 Regarding the production of green leaves for Cameroon Tea Estates, the plants and cuttings are placed in the nursery. After a year of ripening, they are planted in the fields. When the leaves have reached the required maturity, they are picked and then transported to factories for processing. The officials of Cameroon Tea Estates with several years of experience provided us with data on the cultivation and production of tea of the said company. The environmental loads associated with leaf production, processing and packaging of tea in this study were assessed using the LCA methodology based on ISO 14040.7 In addition, the transport of leaves to the production unit was not taken into account in this study. The functional unit in a LCA study represents the reference for all calculations and how to assess environmental impacts.20 Choosing this reference is an essential step for any AVC study due to the possibility of producing several products from a single one initially, which can make it difficult to identify the main function of the system requiring additional when analyzing the results. According to the work carried out by Ahlgren et al. in 2013,21 there are three different ways to choose the functional unit, either by the quantity of input and by the output of a single product or the combination of several outputs. Knowing that the main objective of this work is the study of the sustainability of tea production systems in an environmental approach, the choice of the reference unit according to the targeted product must be consistent throughout the study to facilitate comparison with other studies. For this reason, 1 ha of culture equivalent to 2 tons of tea production was chosen as the functional unit. The data were obtained in 2020. The inputs used are summarized in Table 1 and additional foreground data compiled from EcoInvent v3.6.22 Transport processes are not taken into account in this study due to the difficulties associated with collecting data and this will be addressed in future studies for a complete LCA.| Production stage | Item | Amount | Unit |
|---|---|---|---|
| Culture | Urea (20.10.10) | 500 | kg |
| Herbicides | 200 | L | |
| Water for irrigation | 3 | m3 | |
| Soil occupation | 1 | ha | |
| Diesel fuel | 25 | L | |
| Harvest | Diesel fuel | 10 | L |
| Tractor | 1 | — | |
| Electricity | 100 | kW h | |
| Wood | 4 | m3 | |
| Natural gas | — | kg | |
| Diesel fuel | — | L | |
| Conditioning | Bags | 10 | kg |
| Electricity | 0.5 | kW h |
2.1. Life cycle assessment (LCA)
The LCA methodology aims to assess the environmental loads associated with a process, by recording its material and energy flows with the aim of proposing alternative ways of environmental improvement.7 This methodology consists of four steps according to ISO 14040 (ref. 7) and ISO 14044:19 the definition of objectives and scope, life cycle inventory, life cycle impact assessment and interpretation of results.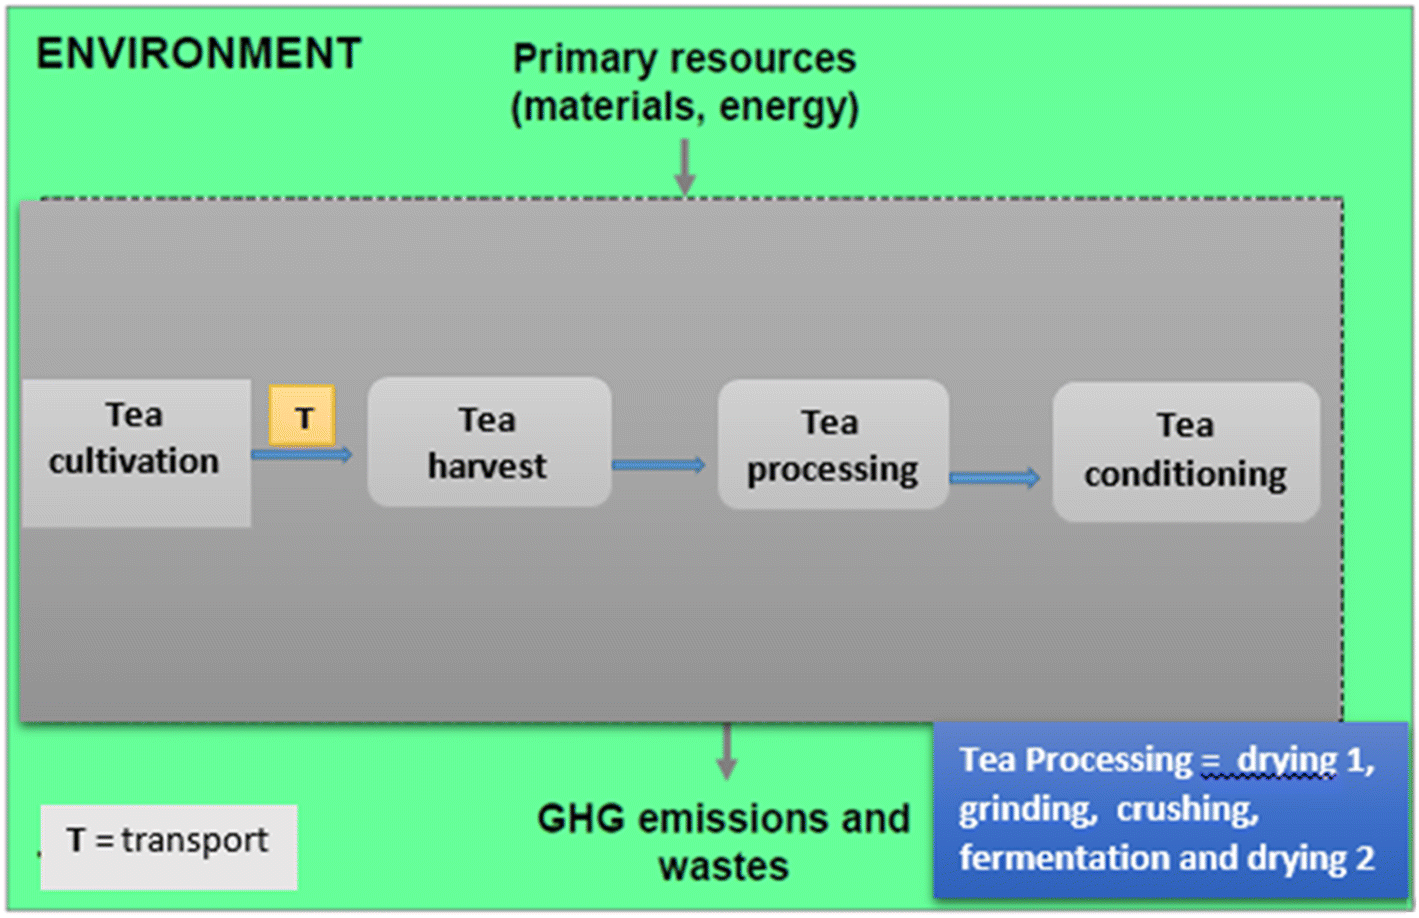 | ||
| Fig. 1 System boundaries associated with obtaining tea. | ||
| Impact category | Label | Unit |
|---|---|---|
| Fine particulate matter formation potential | PMFP | kg PM2.5 eq. |
| Fossil resource scarcity potential | FSP | kg oil eq. |
| Freshwater ecotoxicity potential | FETP | kg 1,4-DCB |
| Freshwater eutrophication potential | FEP | kg P eq. |
| Global warming potential | GWP | kg CO2 eq. |
| Human carcinogenic toxicity potential | HCTP | kg 1,4-DCB |
| Human non-carcinogenic toxicity potential | HNTP | kg 1,4-DCB |
| Ionizing radiation potential | IRP | kBq Co-60 eq. |
| Land use potential | LUP | m2a crop eq. |
| Marine ecotoxicity potential | METP | kg 1,4-DCB |
| Marine eutrophication potential | MEP | kg N eq. |
| Mineral resource scarcity potential | MSP | kg Cu eq. |
| Ozone formation, human health potential | OFHP | kg NOx eq. |
| Ozone formation, terrestrial ecosystem potential | OFTP | kg NOx eq. |
| Stratospheric ozone depletion potential | ODP | kg CFC11 eq. |
| Terrestrial acidification potential | TAP | kg SO2 eq. |
| Terrestrial ecotoxicity potential | TETP | kg 1,4-DCB |
| Water consumption potential | WCP | m3 |
3 Results and discussion
3.1. Global environmental results
The analysis of the entire tea life cycle including the agricultural phase, harvesting, processing and packaging is presented as the results. All these process-related steps are presented together. The remodeling of all the steps associated with the production of the tea into one system rather than separate systems is shown in Fig. 2. The impact calculation results were obtained following a status quo analysis on the basis of the inventory data provided. All the impacts relate to the functional unit of 1 ha of production (2 tons).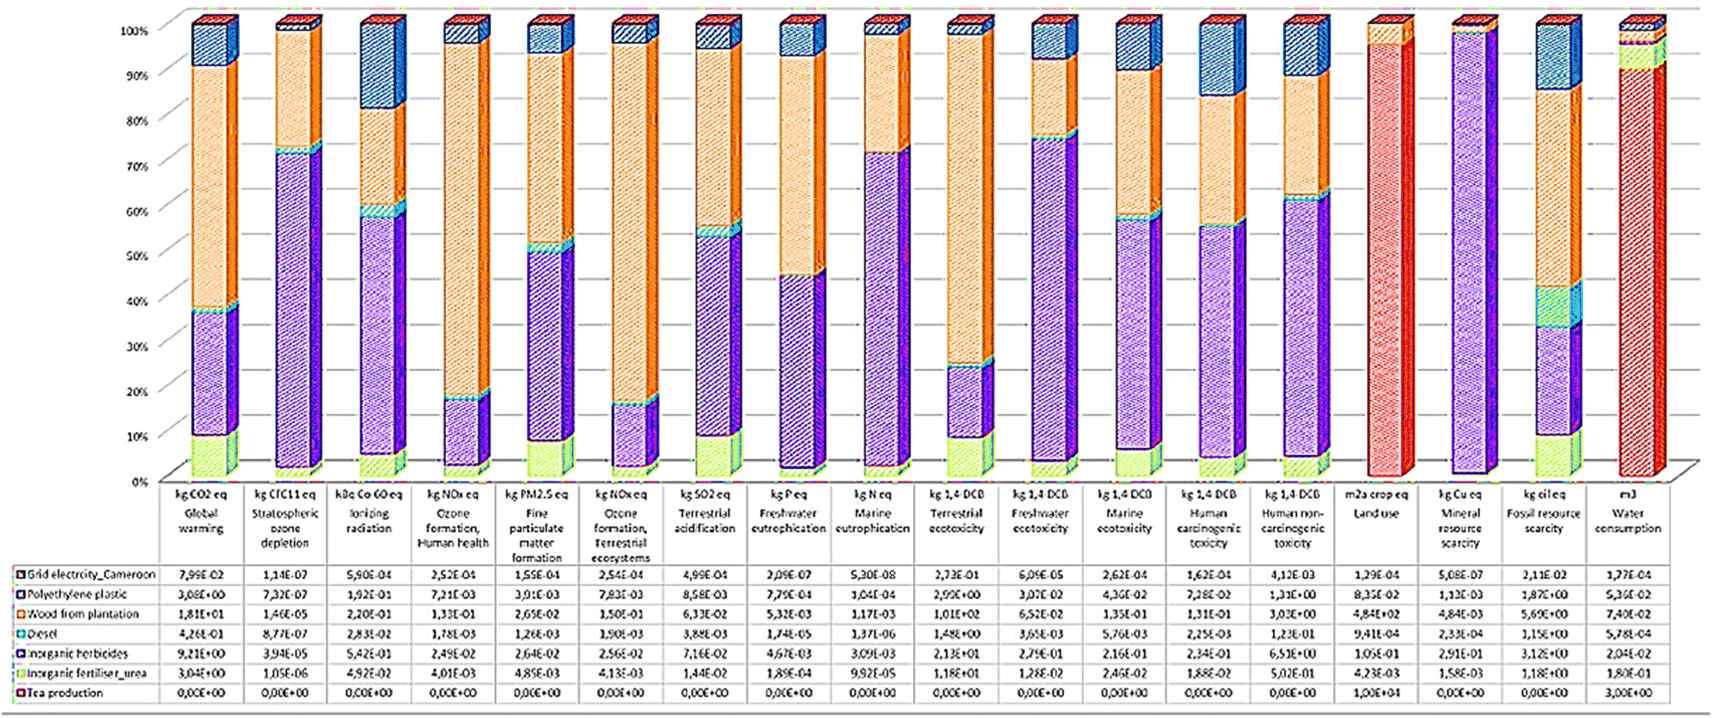 | ||
| Fig. 2 Contribution of each inflow to the ReCiPe 2016 Midpoint v.1.04 characterized impacts for 1 ha production of Cameroon Tea Estates. | ||
Based on these results, salient differences in the profiles from growing to packaging tea are assessed against each input or chemical used in each phase. The results show the global warming potential with a total value of 34 kg CO2 eq. per functional unit of the study, i.e. 18.1 kg CO2 eq. due to the use of wood, 9.2 kg CO2 eq. as a result of herbicides, 3.03 kg CO2 eq. fertilizers, 3.08 kg CO2 eq. polyethylene plastics with grid electricity and diesel having a negligible GWP value share. Based on these results, wood is used for drying tea leaves by means of large blowers, plastics are used as packaging, and herbicides and fertilizers are used to improve the agricultural yield. The results show that the use of wood for tea drying is the main factor related to the impact of GWP representing nearly 54% of the total GWP associated with the national company system. The other impacts observed on the GWP are the use of herbicides in the agricultural phase (27%), followed by the use of polyethylene plastics (9.06%). One of the most significant impact factors can be associated with the use of energy as a source of heat for the operation of machinery. The processing step has the highest environmental burden when compared to other steps, e.g., culture and conditioning. With regard to the freshwater ecotoxicity (101.1 kg 1,4-DCB) and marine ecotoxicity (128.61 kg 1,4-DCB) impact categories, the use of machinery and nitrogen fertilizers was the main hot spot identified. These values are comparable with those obtained by Penchah et al.31 of 41.63 kg 1,4-DCB for freshwater ecotoxicity and 63.88 kg 1,4-DCB for marine ecotoxicity. They are mainly due to the use of machines and nitrogenous fertilizers as shown by the work carried out by Penchah et al.31
The use of herbicides and urea during the agricultural phase presents significant contributions to the categories of global warming (12.25 kg CO2 eq.), terrestrial ecotoxicity (11![[thin space (1/6-em)]](https://www.rsc.org/images/entities/char_2009.gif) 180.36 kg 1,4-DCB), freshwater ecotoxicity (331 kg 1,4-DCB), human non-carcinogenic toxicity (7.02 kg 1,4-DCB), land use (10000 m2a crop eq.) and fossil resource scarcity (4.42 kg oil eq.). In view of these results, it appears that herbicides and the use of urea during the cultivation stage require appropriate management throughout the supply chain. The use of diesel fuel in the agricultural phase is relatively the most ecological, because its contributions to the impact categories considered are not very significant. These results also show that the environmental load related to each impact category can be reduced significantly by controlling the amount of nitrogen fertilizers and pesticides effectively. From another perspective of resolution, it will be important to use rather phosphate and potassium fertilizers because nitrogen fertilizers require more energy leading to environmental consequences.32
180.36 kg 1,4-DCB), freshwater ecotoxicity (331 kg 1,4-DCB), human non-carcinogenic toxicity (7.02 kg 1,4-DCB), land use (10000 m2a crop eq.) and fossil resource scarcity (4.42 kg oil eq.). In view of these results, it appears that herbicides and the use of urea during the cultivation stage require appropriate management throughout the supply chain. The use of diesel fuel in the agricultural phase is relatively the most ecological, because its contributions to the impact categories considered are not very significant. These results also show that the environmental load related to each impact category can be reduced significantly by controlling the amount of nitrogen fertilizers and pesticides effectively. From another perspective of resolution, it will be important to use rather phosphate and potassium fertilizers because nitrogen fertilizers require more energy leading to environmental consequences.32
The production of polyethylene packaging requires the consumption of energy resources that are almost entirely obtained from non-renewable sources responsible for greenhouse gas (GHG) emissions. The results show that global warming, terrestrial ecotoxicity and human carcinogenicity are the most impacted impact categories due to the use of low-density polyethylene packaging materials used at the tea harvesting stage. The use of electricity seems insignificant during the harvest phase; however due to the electrical mix sometimes derived from fossil fuels, carbon emissions throughout the supply chain can be observed. In summary, these results indicate that the use of fossil fuel-based polyethylene packaging does indeed make a significant positive contribution to energy efficiency and climate protection goals. An alternative path will be to resort to the use of biodegradable plastics with the aim of helping to save resources throughout the life cycle. Indeed, the work of Brandt & Pilz (2011)33 showed that the use of biodegradable plastics would contribute to reducing the life cycle energy demand by 24% and GHG emissions by 27%.
In the end, the results observed in this figure show that the typical hotspots are wood from plantation, herbicides, packaging materials and fertilizers, respectively.
In view of having a sustainable production of Cameroon Tea Estates, alternative scenarios have been created by substituting the parameters of each input stream, for example inorganic fertilizers with organics and electricity from solar. The characterized environmental impacts obtained by these alternative scenarios related to 1 ha production of Cameroon Tea Estates are presented in Fig. 3.
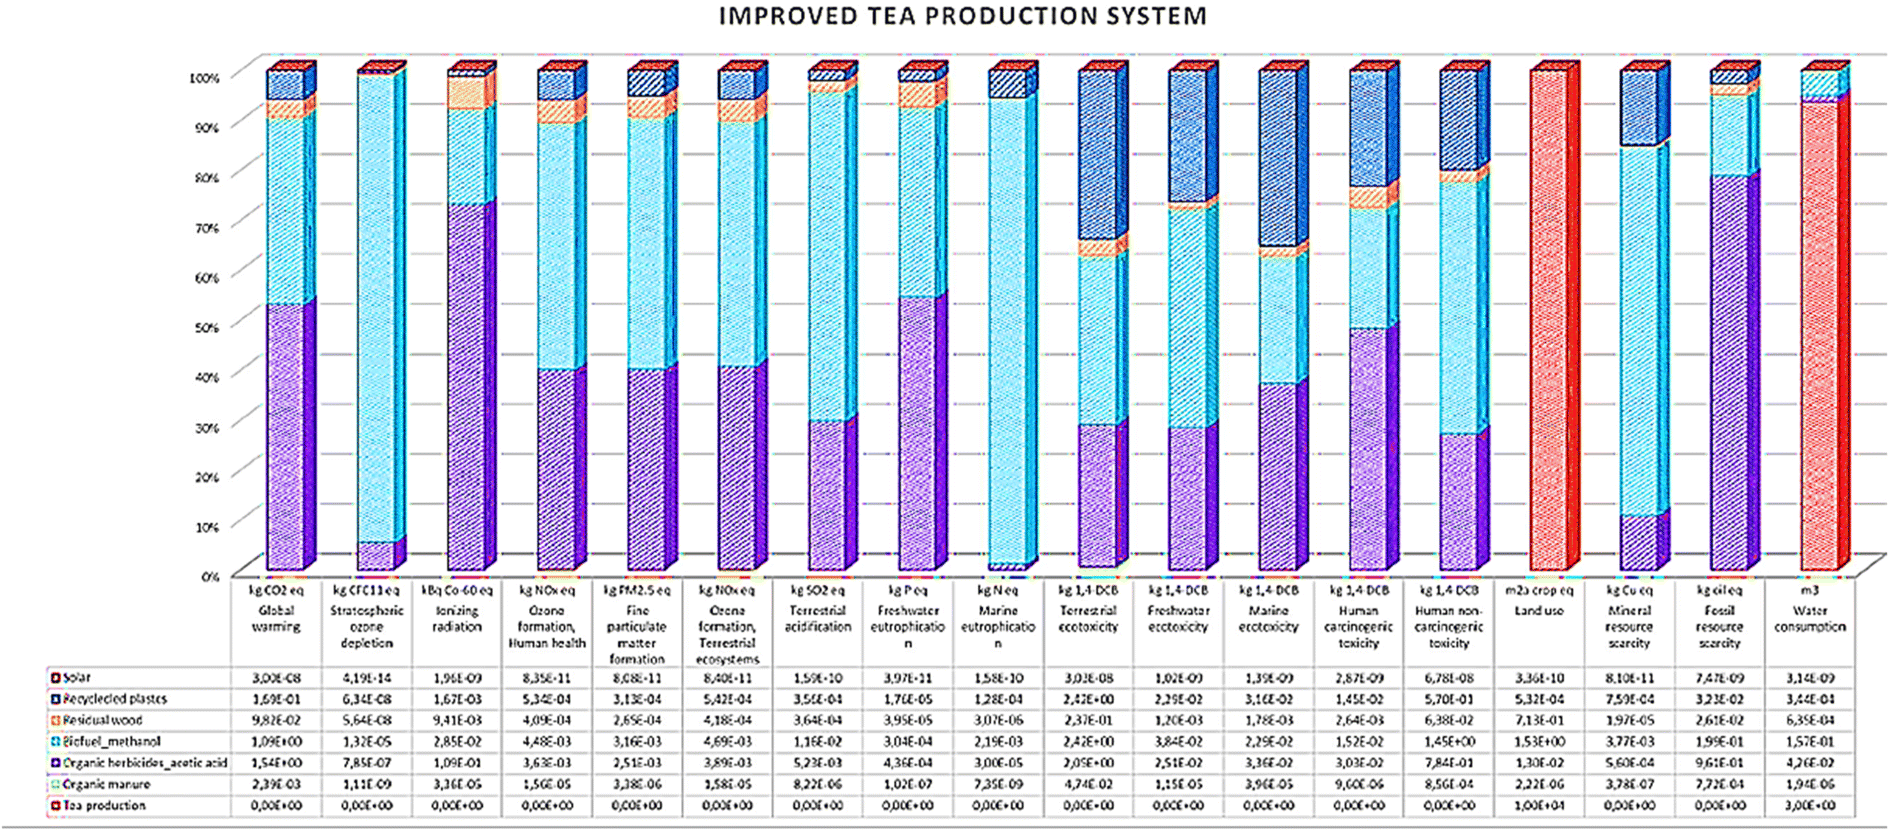 | ||
| Fig. 3 Contribution of each inflow to the ReCiPe 2016 Midpoint v.1.04 characterized impacts obtained by the agricultural system with improvement scenarios related to 1 ha production of Cameroon. | ||
The results of the replacement scenarios show a significant improvement in the main impacts. In fact, the hot spots, in particular packaging materials, herbicides, fertilizers and the wood used, have an attenuation of the order of 95%, 83%, 99% and 98%, respectively.
A sensitivity test scenario to see how our business as usual results compare to the production of the globally and how they compare when we have an improved agricultural system using organic matter and renewable energy sources was performed. The results obtained are presented in Table 3.
| Unit | Tea production_status quo | Tea production_organic | Tea, dried {RoW}| production for tea, dried| cut-off, U | |
|---|---|---|---|---|
| Global warming | kg CO2 eq. | 3.40 × 101 | 2.90 | 3.81 × 10³ |
| Stratospheric ozone depletion | kg CFC11 eq. | 5.68 × 10⁻⁵ | 1.41 × 10⁻⁵ | 2.68 × 10⁻² |
| Ionizing radiation | kBq Co-60 eq. | 1.03 | 1.48 × 10⁻¹ | 9.14 × 101 |
| Ozone formation, human health | kg NOx eq. | 1.71 × 10⁻¹ | 9.06 × 10⁻³ | 8.96 |
| Fine particulate matter formation | kg PM2.5 eq. | 6.30 × 10⁻² | 6.26 × 10⁻³ | 8.68 |
| Ozone formation, terrestrial ecosystems | kg NOx eq. | 1.90 × 10⁻¹ | 9.55 × 10⁻³ | 9.23 |
| Terrestrial acidification | kg SO2 eq. | 1.62 × 10⁻¹ | 1.75 × 10⁻² | 3.48 × 101 |
| Freshwater eutrophication | kg P eq. | 1.10 × 10⁻² | 7.98 × 10⁻⁴ | 1.58 |
| Marine eutrophication | kg N eq. | 4.46 × 10⁻³ | 2.35 × 10⁻³ | 1.23 × 101 |
| Terrestrial ecotoxicity | kg 1,4-DCB | 1.38 × 10² | 7.17 | 5.48 × 10³ |
| Freshwater ecotoxicity | kg 1,4-DCB | 3.91 × 10⁻¹ | 8.76 × 10⁻² | 3.08 × 10² |
| Marine ecotoxicity | kg 1,4-DCB | 4.25 × 10⁻¹ | 8.98 × 10⁻² | 9.90 × 101 |
| Human carcinogenic toxicity | kg 1,4-DCB | 4.59 × 10⁻¹ | 6.27 × 10⁻² | 4.58 × 101 |
| Human non-carcinogenic toxicity | kg 1,4-DCB | 1.15 × 101 | 2.87 × 10 | 2.04 × 10³ |
| Land use | m2a crop eq. | 1.05 × 10⁴ | 1.00 × 10⁴ | 1.08 × 10⁴ |
| Mineral resource scarcity | kg Cu eq. | 2.99 × 10⁻¹ | 5.11 × 10⁻³ | 8.20 |
| Fossil resource scarcity | kg oil eq. | 1.30 × 101 | 1.22 | 4.28 × 10² |
| Water consumption | m3 | 3.33 | 3.20 | 5.27 × 10³ |
The comparative study of the performance of electricity produced from wood pellets compared to electricity produced from other fuels such as coal and natural gas shows that the use of electricity with wood pellets offers GHG emission advantages over coal-fired electricity under the conditions examined. The use of coal-fired electricity has been recognized as a hot spot for the impact categories of global warming, terrestrial ecotoxicity and land use. This result may clarify the important role that sustainably produced wood pellets play in the urgent progress of decarbonization. The results obtained on the basis of inventory data show that Cameroon's organic tea production scenario system is more sustainable (2.9 kg CO2 eq.), followed by status quo (34 kg CO2 eq.). The Rest of the World (RoW) data for tea production were also compared with organic tea production and status quo and it can be observed that RoW has a significant GWP value of 3.81 × 10³ kg CO2 eq. The significant difference comparing the RoW GWP value with Cameroon's status quo and organic scenario can be attributed to different inventory datasets. RoW includes more granular inventories of growing and harvesting as less detailed inventory of Cameroon is observed from transport to processing, thus calling for other life cycle inventories related to tea production in Africa.
3.2. Sensitivity analysis of results by Monte Carlo
Due to several factors including the quality of data, assumptions made, system boundaries and methods used for impact assessment which affects the overall results of the LCA study, uncertainties still exist.34 Furthermore, uncertainties are related to factors that affect the data quality, such as variations in agricultural systems that can influence the yield of tea. Against this background, a Monte Carlo uncertainty assessment at a 95% confidence interval is performed using SimaPro software to test the reliability and robustness of the results. The table shows the results of the selected midpoint impact indicator categories related to business as usual/status quo tea production systems indicating the mean, standard deviation (SD), coefficient of variation (Cv, defined as the ratio between the SD and the mean), and standard error of the mean (SEM, defined as the standard deviation of the sampling distribution of the mean). Cv ranges of 5–51% are regarded as lower variations and this included all impact categories except for human carcinogenic toxicity, thus confirming that the results in these categories have good reliability. Human carcinogenic ecotoxicity shows a relatively higher uncertainty range above 51%, thus calling for further checks and studies on more localized, specific data over longer periods in order to reduce uncertainty linked to this impact category (Table 4).| Impact category | Unit | Mean | Median | SD | CV | 2.5% | 97.5% | SEM |
|---|---|---|---|---|---|---|---|---|
| Fine particulate matter formation | kg PM2.5 eq. | 0.00 | 0.00 | 0.00 | 15.19 | 0.00 | 0.00 | 0.00 |
| Fossil resource scarcity | kg oil eq. | 1.15 | 1.14 | 0.08 | 7.32 | 1.00 | 1.33 | 0.00 |
| Freshwater ecotoxicity | kg 1,4-DCB | 0.00 | 0.00 | 0.00 | 23.90 | 0.00 | 0.01 | 0.00 |
| Freshwater eutrophication | kg P eq. | 0.00 | 0.00 | 0.00 | 44.68 | 0.00 | 0.00 | 0.00 |
| Global warming | kg CO2 eq. | 0.43 | 0.43 | 0.02 | 5.40 | 0.38 | 0.47 | 0.00 |
| Human carcinogenic toxicity | kg 1,4-DCB | 0.00 | 0.00 | 0.00 | 77.01 | 0.00 | 0.01 | 0.00 |
| Human non-carcinogenic toxicity | kg 1,4-DCB | 0.12 | 0.11 | 0.03 | 28.22 | 0.08 | 0.22 | 0.00 |
| Ionizing radiation | kBq Co-60 eq. | 0.03 | 0.03 | 0.01 | 43.62 | 0.01 | 0.06 | 0.00 |
| Land use | m2a crop eq. | 10000.00 |
10000.00 |
0.00 | 0.00 | 10000.00 |
10000.00 |
0.00 |
| Marine ecotoxicity | kg 1,4-DCB | 0.01 | 0.01 | 0.00 | 22.12 | 0.00 | 0.01 | 0.00 |
| Marine eutrophication | kg N eq. | 0.00 | 0.00 | 0.00 | 10.00 | 0.00 | 0.00 | 0.00 |
| Mineral resource scarcity | kg Cu eq. | 0.00 | 0.00 | 0.00 | 5.26 | 0.00 | 0.00 | 0.00 |
| Ozone formation, human health | kg NOx eq. | 0.00 | 0.00 | 0.00 | 22.64 | 0.00 | 0.00 | 0.00 |
| Ozone formation, terrestrial ecosystems | kg NOx eq. | 0.00 | 0.00 | 0.00 | 21.40 | 0.00 | 0.00 | 0.00 |
| Stratospheric ozone depletion | kg CFC11 eq. | 0.00 | 0.00 | 0.00 | 35.90 | 0.00 | 0.00 | 0.00 |
| Terrestrial acidification | kg SO2 eq. | 0.00 | 0.00 | 0.00 | 16.45 | 0.00 | 0.01 | 0.00 |
| Terrestrial ecotoxicity | kg 1,4-DCB | 1.47 | 1.34 | 0.57 | 38.85 | 0.79 | 3.03 | 0.02 |
| Water consumption | m3 | 3.00 | 3.00 | 0.02 | 0.70 | 2.95 | 3.04 | 0.00 |
To substantiate the environmental results of the assessed profiles, an analysis of the contribution of environmental loads resulting from Fig. 4 in the assessed impact categories was carried out, with the aim of identifying environmental hotspots.
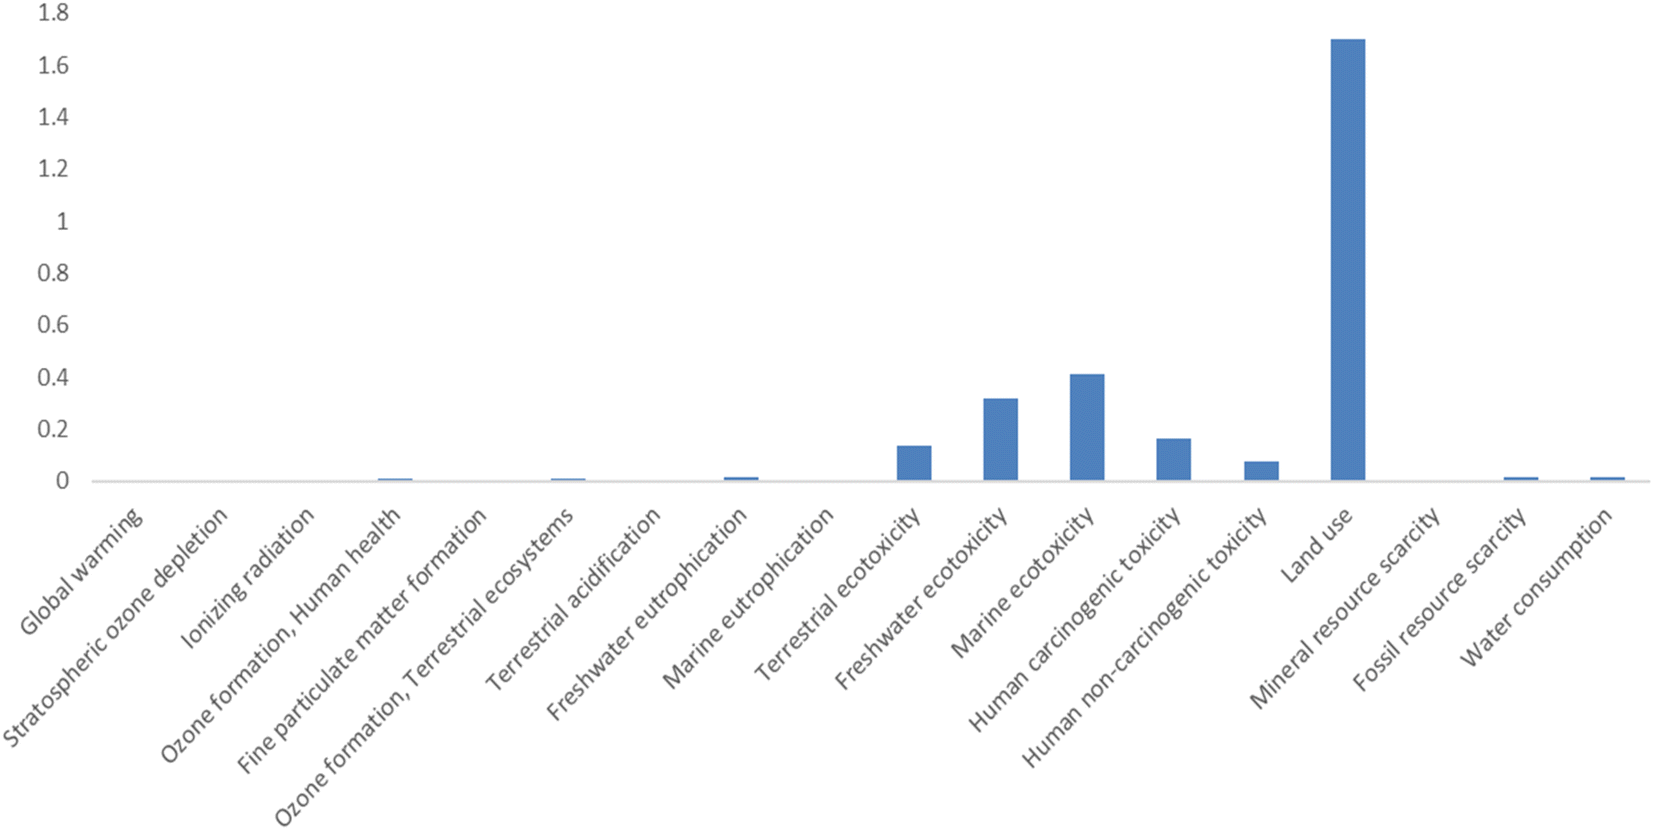 | ||
| Fig. 4 ReCiPe 2016 Midpoint v.1.04 World (2010) normalized impacts for 1 ha production of Cameroon Tea Estates. | ||
Normalized impact generally provides a visual interpretation to highlight environmental impact categories affected by a certain process or activity. As expected, land use, marine ecotoxicity, freshwater ecotoxicity, terrestrial toxicity and human carcinogenic toxicity are the impact categories mostly affected during the production of tea. Toxicity impacts are largely due to the usage of chemicals in agricultural systems. The results obtained have a salient difference with those obtained by Fard et al.35 of 1422 kg CO2 eq. ha−1 and Nikkhah et al.36i.e. 1281.82 kg CO2 eq. ha−1 during the tea cultivation phase. The work of Mila et al.37 on the application of life cycle analysis (LCA) on green tea showed a global warming potential of around 475557.7 kg CO2 eq., i.e. 28 times higher than that obtained in the present work. A study by Adisa38 on the ‘cradle to grave’ life cycle analysis of Kenyan tea of a functional unit of 1 kg of dry tea obtained a global warming potential of 24.8 g CO2 eq. Also, the same work carried out on Darjeeling tea18 obtained a global warming potential of 49.5 g CO2 eq. Moreover, the same study on a Chinese tea39 obtained a global warming potential of 39.7 g CO2 eq. These results are comparable to this study. The small discrepancy observed can be justified by several factors, including the geographical location of the tea plantations, the excessive use of diesel fuel and electricity, the characteristics of the soil, the types of tea and the climate which governs this practice. Indeed, old machines that consume a lot of energy are frequently used in the tea making process, which can significantly increase the carbon footprint. In Darjeeling tea,18 the conventional dryers used are an example. It has been reported that the drying and grading of tea requires a large amount of electric power. In an environmental impact assessment process through LCA, it is also important to highlight and identify the input streams (hotspots) that are responsible for the environmental load at each stage.
3.3. Environmental impact assessment though the endpoint perspective
In order to obtain ecosystem damage due to the use of chemicals in agricultural systems thus calling for application of sustainable agricultural systems through organic farming practices, an environmental comparison was carried out. Fig. 5 illustrates the result of the comparison obtained. By performing an in-depth analysis of the scores and the distribution between the level of damage on human health, ecosystems and resources, the damage to ecosystems dominates by 2 to 5 times the environmental score in the agricultural phase. This high contribution can be justified by the use of fossil resources in agricultural activities. The contribution to the single ecosystem score of approximately 60% in the cultivation stage can be associated with the emissions from the background processes involved and the production of the energy requirements in this phase. The resource contribution is 5% and is associated with the use of fossil resources in the downhole processes involved in the production plant. In view of the results, we can conclude that the best phase in the production of tea with the best environmental profile is the harvest phase, because it has the lowest environmental score.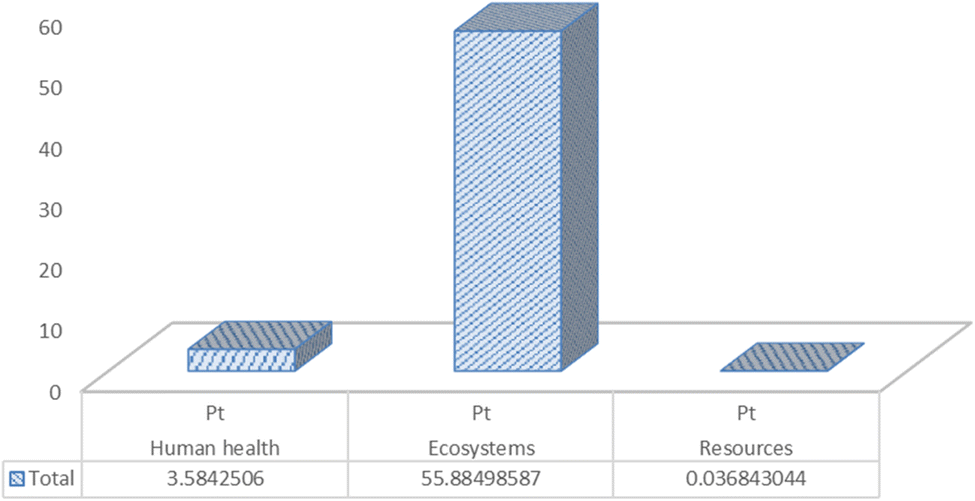 | ||
| Fig. 5 Overall impact on human health, ecosystems and resources. | ||
The limits of this study are related to the failure to take into account the transport process from the acquisition of raw materials to delivery. However, this lack of data could be addressed in future studies.
3.4. Final insights
Tea is a high-yield tropical crop whose environmental impact could be improved by using inorganic fertilizers and renewable energy and reducing associated local emissions.Typical hotspots are packaging materials, herbicides, fertilizers and wood waste.
The production of tea was carried out in three phases, namely cultivation, harvesting, and processing and packaging.
To improve the environmental impact linked to the production of tea, reducing the quantities of fertilizers and pesticides used during cultivation is a key parameter.
4 Conclusion
The purpose of this study was to perform a cradle-to-gate analysis of Cameroon Tea Estates tea and assess the main impacts arising from the agricultural phase to packaging through harvesting and processing. An analysis of impact categories was reviewed with the aim of identifying key hotspots requiring improvement. The results reveal a global warming potential of a total value of 34 kg CO2 eq. per functional unit. Packaging material, herbicides, fertilizers and wood have been identified as the major hotspots. In view of these results, the tea producers of Cameroon Tea Estates can adopt a roadmap to make their activities more ecological, in particular the use of potassium or phosphate fertilizers in favor of nitrogenous fertilizers responsible for emissions. Although this analysis seems limited by the availability of certain data, this investigation made it possible to obtain a more or less complete overview of the environmental benefits linked to the cultivation, harvesting and processing of tea in Cameroon. The results obtained can be used for decision making by public authorities with a view to sustainable tea production in Cameroon. Due to the growing awareness of the positive impact associated with the cultivation and processing of tea in Cameroon, it is necessary to take into account the concept of responsibility, which is the 12th SDG (United Nations Department of Public Information, 2016)40 to produce more environmentally friendly products. Otherwise, there will be no sustainable future for the production of Cameroon Tea Estates. Finally, with a view to contributing to the United Nations SDGs and climate action, a recommendation emerges from the fact that solutions resulting from this study such as the management of inputs (nitrogen fertilizers and pesticides) are imperative for achieving these goals by 2030.Data availability
The authors declare that data supporting the fundings of this study are available within the article.Author contributions
Rufis Fregue Tiegam Tagne: conceptualization, methodology, software, validation, formal analysis, investigation, data curation, writing – original draft, writing – review & editing, visualization, supervision, project administration, and funding acquisition. Amos Ncube: conceptualization, methodology, software, validation, formal analysis, investigation, data curation, writing – original draft, writing – review & editing, and visualization. Junie Albine Kenfack Atangana: conceptualization, methodology, validation, resources, writing – review & editing, and supervision. Donald Raoul Tchuifon Tchuifon: conceptualization, methodology, validation, resources, and writing – review & editing. Francois Rene Ateba: conceptualization, methodology, validation, resources, and writing – review & editing. Ivane Christelle Azambou: conceptualization, methodology, validation, resources, and writing – review & editing.Conflicts of interest
The authors declare that they have no known competing financial interests or personal relationships that could have appeared to influence the work reported in this paper.Abbreviations
| LCA | Life cycle assessment |
| LCI | Life cycle inventory |
| PMFP | Particulate matter formation potential |
| FETP | Freshwater eco-toxicity potential |
| FEP | Freshwater eutrophication potential |
| GWP | Global warming potential |
| HCTP | Human carcinogenic toxicity potential |
| HNTP | Human non-carcinogenic toxicity potential |
| IRP | Ionizing radiation potential |
| LUP | Land use potential |
| METP | Marine eco-toxicity potential |
| MEP | Marine eutrophication potential |
| MSP | Mineral resource scarcity potential |
| OFHP | Ozone formation, human health potential |
| OFTP | Ozone formation, terrestrial ecosystem potential |
| TAP | Terrestrial acidification potential |
| TETP | Terrestrial eco-toxicity potential |
| WCP | Water consumption potential |
Acknowledgements
The authors greatly thank all the members of the Research Unit/RU-NOGEE of the University of Dschang, Cameroon. The co-author (Amos Ncube) research contribution has been funded by the following European Commission's research programmes: H2020-SC5-2020-2 scheme, Grant Agreement 101003491 (JUST2CE project) and H2020 EU's Marie Skłodowska-Curie ITN program ReTraCE Project, “Realising the Transition towards the Circular Economy: Models, Methods and Applications” (Grant No. 814247).References
- Y.-W. Chiu, Environmental Implications of Taiwanese Oolong Tea and the Opportunities of Impact Reduction, Sustainability, 2019, 11, 6042, DOI:10.3390/su11216042.
- J. Langford Natalie, From Global to Local Tea Markets: The Changing Political Economy of Tea Production within India's Domestic Value Chain, Dev. Change, 2021, 1–28, DOI:10.1111/dech.12652.
- M. Olivier, The Cameroon Tea Estate plans to turn to the high end, Jeune Afr., 2017, 18, 27 Search PubMed.
- Food and Agriculture Organization (FAO), International Tea Committee (ITC), Lipton, PG Tips, Pukka Tea, Starbucks, T2, Tea Research Association (TRA), Tetley Tea, Unilever, 2020 Search PubMed.
- K. P. Hamed, N. P. Ashkan, O. Jean and S. Mohammad, Environmental Management of Tea Production Using Joint of Life Cycle Assessment and Data Envelopment Analysis Approaches, Environ. Prog. Sustainable Energy, 2017, 2, 321 Search PubMed.
- G. Cichorowski, B. Joa, H. Hottenroth and M. Schmidt, Scenario analysis of life cycle greenhouse gas emissions of Darjeeling tea, Int. J. Life Cycle Assess., 2015, 20(4), 426–439 CrossRef CAS.
- ISO (International Organization for Standardization), Environmental Management—Life Cycle Assessment—Principles and Framework; Standard ISO14040, ISO, Geneva, Switzerland, 2006 Search PubMed.
- M. Giraldi-Díaz, D. Medina-Salas, E. Castillo-González and D. La Cruz-Benavides, Environmental Impact Associated with the Supply Chain and Production of Biodiesel from Jatropha curcas L. through Life Cycle Analysis, Sustainability, 2018, 10, 1451 CrossRef.
- B. Adhikari and T. Prapaspongsa, Environmental Sustainability of Food Consumption in Asia, Sustainability, 2019, 11, 5749 CrossRef.
- R. Rahul, B. Miriam, B. Sander and M. Erik, Analyse du cycle de vie de la valorisation de la struvite et de l'utilisation finale des boues d'épuration: une illustration flamande, Resour., Conserv. Recycl., 2022, 182, 106325 CrossRef.
- A. Ncube, G. Fiorentino, M. Colella and S. Ulgiati, Sci. Total Environ., 2021, 775, 145809 CrossRef CAS.
- N. S. Theanne, A. Romare, F. Delfina, C. Yueh-Ting, T. J. Christian, E. Shanece, K. S. Gwen, M. Grace, A. Dong, T. R. Sebastian, M. C. Adrian, G. Susanne, M. V. Anne, C. N. Chasse, K. K. Sanat and H. L. Helen, Microbial nanocellulose biotextiles for a circular materials economy, Environ. Sci., 2022, 1, 276 Search PubMed.
- F. Brentrup, J. Kusters, H. Kuhlmann and J. Lammel, Environmental impact assessment of agricultural production systems using the life cycle assessment methodology I. Theoritical concept of a LCA method tailored to crop production, Eur. J. Agron., 2004, 20, 247–264 CrossRef.
- C. Kamau and D. Harorimana, Does knowledge sharing and withholding of information in organizational committees affect quality of group decisionmaking?, Proceedings of the Ninth European Conference on Knowledge Management Academic Publishing: Reading, 2008, pp. 341–348 Search PubMed.
- T. L. Wijeratne, W. A. J. M. De Costa and M. A. Wijeratne, Carbon sequestration: an underexploited environmental benefit of tea plantations in Sri Lanka, Tea Bulletin, 2014, 23(1&2), 1–5 Search PubMed.
- T. L. Wijeratne, Estimation of carbon sequestration by Sri Lankan tea plantations and its variation with future climate change, PhD thesis, Postgraduate Institute of Agriculture, University of Peradeniya, Sri Lanka, 2015.
- J. L. Taulo and A. B. Sebitosi, Material and energy flow analysis of the Malawian tea industry, Renewable Sustainable Energy Rev., 2016, 56, 1337–1350 CrossRef.
- G. Doublet and N. Jungbluth, Life cycle assessment of drinking Darjeeling tea. Conventional and organic Darjeeling tea, ESU-services Ltd., Uster, 2010 Search PubMed.
- ISO (International Organization for Standardization), Environmental Management—Life Cycle Assessment—Requirements and Guidelines, Standard ISO 14044, ISO, Geneva, Switzerland, 2006 Search PubMed.
- B. Santiago, T. M. María, F. Gumersindo and G. G. Sara, Waste Manag., 2022, 142, 77–87 CrossRef CAS.
- S. Ahlgren, A. Björklund, A. Ekman, H. Karlsson, J. Berlin, P. Börjesson, T. Ekvall, G. Finnveden, M. Janssen and I. Strid, LCA of biorefineries identification of key issues and methodological recommendations, Report from an f3 project, 2013 Search PubMed.
- Ecoinvent, Ecoinvent. Retrieved from Ecoinvent, 2020, April 29, https://www.ecoinvent.org/database/system-models-in-ecoinvent-3/system-models-inecoinvent-3.html.
- N. Augustine and A. George, J. Clean. Prod., 2008, 16, 1735–1740 CrossRef.
- J. Martínez-Blanco, A. Inaba and M. Finkbeiner, Int. J. Life Cycle Assess., 2015, 20(6), 829–841 CrossRef.
- M. Oele, SimaPro. Retrieved from SimaPro, https://simapro.com/2019/whats-new-in-simapro-9-0/, 2019, November 20.
- G. Wernet, C. Bauer, B. Steubing, J. Reinhard, E. Moreno-Ruiz and B. Weidema, Int. J. Life Cycle Assess., 2016, 21(9), 1218–1230 CrossRef.
- C. Vezzoli, Design for Environmental Sustainability: Life Cycle Design of Products, Springer, London, 2nd edn, 2018 ISBN 9781447173649 Search PubMed.
- A. Arias, S. González-García, S. González-Rodríguez, G. Feijoo and M. T. Moreira, Cradle-to-gate Life Cycle Assessment of bio-adhesives for the wood panel industry. A comparison with petrochemical alternatives, Sci. Total Environ., 2020, 738, 140357, DOI:10.1016/j.scitotenv.2020.140357.
- M. Huijbregts, Z. J. N. Steinmann, P. M. F. M. Elshout, G. Stam, F. Verones, M. D. M. Vieira, M. Zijp and R. van Zelm, ReCiPe 2016 – A harmonized life cycle impact assessment method at midpoint and endpoint level. Report I: Characterization, Natl. Inst. Public Heal. Environ., 2016, 194 Search PubMed.
- J. A. Chayer and K. Kicak, Life Cycle Assessment of coffee consumption: comparison of single-serve coffee and bulk coffee brewing, Quantis Final Report, 2015, pp. 321–345 Search PubMed.
- H. K. Penchah, P. Ashkan Nabavi, O. Jean and S. Mohammad, Environmental Management of Tea Production Using Joint of Life Cycle Assessment and Data Envelopment Analysis Approaches, Environ. Prog. Sustainable Energy, 2017, 4, 36 Search PubMed.
- T. N. Maraseni, G. Cockfield, J. Maroulis and G. Chen, An assessment of greenhouse gas emissions from the Australian vegetables industry, J. Environ. Sci. Health, Part B, 2010, 45(6), 578–588 CrossRef CAS.
- B. Brandt and H. Pilz, The Impact of Plastic Packaging on Life Cycle Energy Consumption and Greenhouse Gas Emissions in Europe, http://denkstatt-group.com/files/the_impact_of_plastic_packaging_on_life_cycle_energy_consumption_and_greenhouse_gas_emissions_in_europe.pdf Search PubMed.
- M. Cellura, L. Sonia and M. Marina, Life Cycle Assessment (LCA) of protected crops: an Italian case study, J. Cleaner Prod., 2011, 28, 56–62 CrossRef.
- F. S. Fard, K. P. Hamed, G. N. R. Mahmoud and C. Guangnan, Cradle to grave environmental-economic analysis of tea life cycle in Iran, J. Clean. Prod., 2018, 196, 953–960 CrossRef.
- A. Nikkhah, B. Emadi and S. Firouzi, Greenhouse gas emissions footprint of agricultural production in Guilan province of Iran, Sustain. Energy Technol. Assessments, 2015, 12, 10–14 CrossRef.
- G. Mila, B. Primasari and R. Aziz, Application of Life Cycle Assessment (LCA) On Green Tea Product (Case Study in the X Company), IOP Conf. Ser. Mater. Sci. Eng., 2020, 1041012025 Search PubMed.
- A. Azapagic, Life cycle assessment of tea produced in Kenya, in National Multi-Stakeholder Workshop Held on 2013, 29–30 April at Naivasha Search PubMed.
- Q. Xu, K. Hu, X. Wang, D. Wang and M. T. Knudsen, Carbon footprint and primary energy demand of organic tea in China using a life cycle assessment approach, J. Clean. Prod., 2019, 233, 782–792 CrossRef.
- United Nations Department of Public Information, Sustainable Development Goals; Guidelines for the Use of the SDG Logo, Including the Colour Wheel and Seventeen Icons, 2016 Search PubMed.
| This journal is © The Royal Society of Chemistry 2023 |