 Open Access Article
A sustainable viscosity-sensitive isoliquiritigenin-based molecular sensor for liquid food safety inspection†
Lingfeng
Xu
 *ab,
Minqing
Kang
a,
Fangzhi
Xiong
a,
Yanrong
Huang
c and
Xiuguang
Yi
d
aKey Laboratory of Biodiversity and Ecological Engineering of Jiangxi Province, Jinggangshan University, Ji'an 343009, Jiangxi, China
bState Key Laboratory of Luminescent Materials & Devices, Guangdong Provincial Key Laboratory of Luminescence from Molecular Aggregates, College of Materials Science & Engineering, South China University of Technology, Guangzhou 510640, China. E-mail: rs7lfxu@outlook.com
cSchool of Food Science and Engineering, Guangdong Province Key Laboratory for Green Processing of Natural Products and Product Safety, South China University of Technology, Guangzhou 510640, China
dSchool of Chemistry and Chemical Engineering, Nanchang University, Nanchang 330031, China
First published on 13th December 2022
Abstract
A non-invasive and effective viscosity inspection method during the liquid deterioration process needs to be developed urgently. To develop novel approaches to eliminate or reduce the substantial use of organic solvents and toxic reagents from the preparation procedure, we developed a natural product extracted from licorice, isoliquiritigenin (ILG), as an activatable molecular sensor for monitoring liquid microenvironmental viscosity alterations for metamorphic extent determination. The method displayed rapid detection, high sensitivity, simple operation, and visual result presentation. The sensor comprised a phenol donor and carbonyl acceptor, and displayed a typical twisted intramolecular-charge transfer (TICT) feature, with good photostability, selectivity, and adaptability in various commercial liquids. With the aid of isoliquiritigenin, the thickening effects of liquid thickeners can be captured. More importantly, isoliquiritigenin was explored to visualize the viscosity variations in the liquids at the spoilage stage, and it was found that the viscosity level in microenvironments is highly dependent on the liquid food spoilage period. It is noticeable that this approach can facilitate the continued perfection of molecular tools obtained from natural products for food quality and safety inspection.
1. Introduction
Liquid safety is a major public health issue around the world, and corruption usually occurs during long-term transportation and storage procedures.1–3 Various food-borne illnesses (including kidney and liver failure or even death) may be caused by liquid deterioration, so inspection is urgent.4,5 Generally, the growth of bacteria, mould and yeast may cause obvious changes in the microenvironment during the deterioration process.6 Viscosity is a physical parameter that typically changes during the food deterioration process.7,8 It is proposed that the rate of substance movement, reaction rate, and physiological metabolism of bacteria are closely related to viscosity.9–11 Thus, it is proposed that viscosity variations are closely connected with the stages of deterioration.12 Unfortunately, conventional viscosity measuring devices are designed for macroscopic fluids and cannot be applied to visualize microenvironmental viscosity variations at a molecular level. They require a large number of test samples, complex pre-treatment processes, and a longer test time, and which strongly depend on the device.13,14 Therefore, a method for the determination of microenvironment viscosity with rapid detection, high sensitivity, and visualized output needs to be exploited urgently.Among the multiple approaches, luminescent materials have been proven to be an effective tool for detecting related molecules and environmental factors in liquid systems due to their excellent characteristics of high sensitivity and high detection quality.15,16 To date, most organic fluorophores have been designed for viscosity sensing in biological systems, such as mitochondrial viscosity tracking,17 lysosomal viscosity investigation,18 and other methods of physiological viscosity change determination.19,20 Most reported probes have been developed in biological systems (as collected in Table S1, ESI†), in environmental ecology,21,22 and chemical analysis programs.23 Generally, the fluorescent intensity may be changed by the conformations of an individual fluorophore via twisted intramolecular charge transfer (TICT) based on the typical donor–π–acceptor (D–π–A) molecular structure. Using this feature, several kinds of molecules from natural plants can be developed as molecular tools for viscosity detection. Unlike most previously reported studies, natural products do not rely on the post-synthesis procedure, and no toxic chemical reagents need to be consumed. Moreover, these natural licorice derivatives show sustainable, reproducible, and degradable features. The effective utilization of reproducible resources is a critical topic in the long-term evolution process. However, organic fluorophores extracted from natural products for viscosity detection are still lacking; thus, there is an urgent need to exploit promising sustainable energy resources for liquid safety investigation.
In this study, a novel molecular sensor isoliquiritigenin (ILG) extracted from licorice was selected as a kind of molecular tool. As a natural product, it was constructed from a phenol electron donor (D) group and a carbonyl electron acceptor (A) group, linked with a conjugated olefin structure, which formed the flexible D–π–A chemical structure. The ILG sensor can respond to a change in viscosity in solutions and a turn-on mode can be observed with an increase in viscosity, as displayed in Scheme 1. We hypothesized that rotation can be inhibited in high-viscosity media, and will undergo a TICT mechanism from the donor to the acceptor. The fluorescence intensity was gradually enhanced at 432 nm, which confirmed its sensing capacity toward viscosity. Meanwhile, it displayed wide adaptability, high selectivity, and excellent photostability in various commercial liquids. The thickening effect can be specifically identified with different mass contents of food thickeners. More importantly, the ILG sensor can serve as a powerful molecular tool to track viscosity during the deterioration process: spoiled liquids can be discriminated from fresh ones through the florescent method. Hence, our work will promote the development of natural products as a multi-functional molecular tool for liquid safety inspection in a sustainable way.
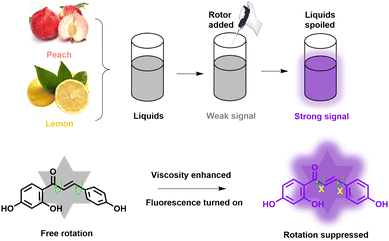 | ||
| Scheme 1 Viscosity sensing mechanism of the natural sensor isoliquiritigenin toward the liquid metamorphic process. | ||
2. Experimental sections
2.1. Materials and methods
Isoliquiritigenin, potassium carbonate, tetrahydrofuran (THF), toluene, dimethylsulfoxide (DMSO), N,N-dimethylformamide (DMF), acetonitrile, methanol, ethanol, ethyl acetate (EA), glycerol and various metal salts, such as sodium chloride and sodium nitrate, were purchased from Shanghai Aladdin Bio-Chem Technology Co., Ltd. Common food additives including glucose, taurine, sodium carboxymethyl cellulose (SCC), pectin (Pec), xanthan gum (XG), trisodium citrate dehydrate (TCD), vitamin C (VC), sodium benzoate (SB) and beet molasses (BM) were obtained from Energy-Chemical Technology (Anhui) Co., Ltd. Amino acids, such as cysteine (Cys), homocysteine (Hcy), and glutathione (GSH), were obtained from Sigma-Aldrich (Merck Life Sciences Co., Ltd., Shanghai, China). All the chemical reagents used in this work were of analytical grade and used as received. Triple-distilled water was used in the experiments.Fluorescence spectra were measured with a Hitachi F-7000 fluorescence spectrophotometer. Absorption spectra were recorded on a Hitachi U-3010 UV-vis spectrophotometer. The viscosity determination test was performed on a rotating viscometer (DV2T, Brookfield, AMETEK Corp., USA).
2.2 Optical properties investigation
The natural molecular sensor ILG was dissolved in DMSO to prepare a stock solution with a concentration of 1 mM, and stored in the dark at a temperature of 5 °C. During the test procedure, the concentration of natural molecular sensor ILG was controlled at 10 μM. The viscosity determination procedure was as follows. The sensor was added into a 3 mL solution consisting of various volume percentages of distilled water and glycerol (from 0% to 99%, including 1% DMSO), and the fluorescence spectra and UV-vis absorption measurements were carried out in this mixture system. Corresponding viscosity values were recorded and measured with the viscometer. Solvents with various polarities, such as ethanol, EA, and DMSO, were selected to test the emission properties of natural molecular sensor ILG in the complex solvent environment. ILG was added to selected solvents and shaken before the test. In the specificity test, solutions with various potential interfering analytes (including NaCl, K2CO3, and glucose) were prepared with distilled water, and ILG was added to each interference test. The resulting solutions were mixed uniformly before the spectra were recorded. In the temperature effect experiment, ILG was added to glycerol under different temperatures, such as normal body temperature (37 °C), fresh-maintenance temperature (5 °C) and common room temperature (25 °C) with 1% DMSO included. In all measurements, the mixed solutions were transferred to the quartz cell. The excitation wavelength was set as 350 nm.2.3 Fluorescence analysis of the thickening effect
Three kinds of food thickeners, sodium carboxymethyl cellulose, pectin and xanthan gum with various mass concentrations (from 1 g kg−1 to 5 g kg−1) were dissolved in triple-distilled water, followed by the addition of natural molecular sensor ILG (dilution 10 μM). Before the test, the mixtures were treated by ultrasound for 10 min to eliminate bubbles in the high-viscous solution, and kept at room temperature for 1 h.2.4 Viscosity tracking in the food spoilage process
Two kinds of commercial liquid beverages, pear juice and peach oolong, were stored at different temperatures (25 °C and 5 °C) and exposed to the air for 7 days. Fluorescence emission spectra were recorded within this time interval (at day 0, day 2, day 5, and day 7) with the addition of natural molecular sensor ILG (dilution 10 μM). The relationship between fluorescence intensity enhancement and viscosity variation was fitted into the linear equation: (ηn − η0)/η0 ∼ (Fn − F0)/F0, in which ηn and η0 are defined as the viscosity of beverages at day 0 and day n (0 < n < 8), F0 and Fn display the fluorescence intensities of liquids at day 0 and day n (0 < n < 8).2.5 The Förster–Hoffmann equation
The relationship between the fluorescence intensity of the natural molecular sensor ILG and viscosity can be determined with the following Förster–Hoffmann equation:log![[thin space (1/6-em)]](https://www.rsc.org/images/entities/char_2009.gif) I = C + x I = C + x![[thin space (1/6-em)]](https://www.rsc.org/images/entities/char_2009.gif) log log![[thin space (1/6-em)]](https://www.rsc.org/images/entities/char_2009.gif) η η | (1) |
3. Results and discussion
3.1 Molecular sensor design
Commonly, viscosity probes are established by intramolecular rotation and contain donors and acceptors. In consideration of the donor and acceptor, we found phenol and carbonyl groups were extracted from the licorice-based natural product, which was called isoliquiritigenin (ILG). In terms of the phenol, it can act as the donor (D) group, whereas the carbonyl is displayed as the acceptor (A), and by coincidence they are hosted in one natural molecule. We hypothesized that the as-selected optical sensor will undergo an intramolecular charge transfer (ICT) process from the D moiety to the A group, and the detailed chemical structure is shown in Scheme 1. When the ILG sensor absorbs a photon, it first reaches a planar excited state by charge transfer and then reaches a twisted excited state by intramolecular rotation of the carbonyl group. The rotation typically leads to a dark non-emissive excited state.23 Based on this, we anticipated that in lower viscosity media, the ILG sensor can rotate freely, resulting in rapid consumption of the energy of the ICT state through a non-invasive relaxation pathway, so weaker fluorescence can be found. In contrast, in higher viscosity media, the rotation of the sensor can be inhibited, energy consumption by the non-radiative pathway will be reduced, and stronger fluorescence will be released. A typical twisted intramolecular charge transfer (TICT) system was formed. In this case, ILG may be able to discriminate higher viscosity from lower with the assistance of the fluorescent technique, and this character showed its capability of detecting microenvironmental viscosity fluctuations in liquid.3.2 Optical properties toward viscosity
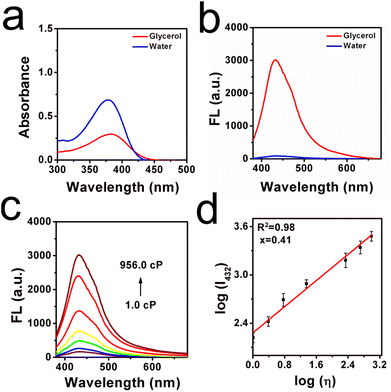
Initially, the optical responsibility of the ILG sensor toward viscosity was investigated. In Fig. 1a, the absorption peak was around 378.2 nm in low-viscous water, whereas the absorption wavelength was slightly red-shifted toward 383.1 nm in high-viscous glycerol. This phenomenon may be attributed to the parallel stacking of molecular sensors in highly viscous media, by which the conjugation was enlarged.24 In the emission spectra, the fluorescence signal increased obviously in glycerol, and a weaker fluorescence signal was found in low-viscous water (as seen from Fig. 1b). This phenomenon may be attributed to the rotation suppression effect because of the higher microscopic viscosity. Moreover, the optical responsibility toward viscosity was detected in detail, as displayed in Fig. 1c and d, and the fluorescence intensity was gradually enhanced upon an increase in the content of glycerol (volume fraction from 0% to 99%). The rotatable parts in the molecular sensor were inhibited to some extent in this procedure, leading to a radiative pathway to consume the excited energy.25 Moreover, a good linear relationship was found between the logarithmic function of fluorescence intensity (log![[thin space (1/6-em)]](https://www.rsc.org/images/entities/char_2009.gif) I432) and viscosity value (log
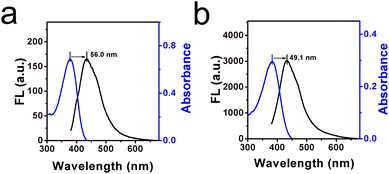
I432) and viscosity value (log![[thin space (1/6-em)]](https://www.rsc.org/images/entities/char_2009.gif) η) by fitting the Förster–Hoffmann equation,26 where R2 = 0.98, x = 0.41. The detection limit of this sensor for viscosity was determined to be 1.233 cP, as shown in Fig. S1 (ESI†). In addition, the Stokes shifts in high-viscous glycerol and low-viscous water were determined to be 49.1 nm and 56.0 nm, respectively, as shown in Fig. 2a and b. In comparison with the prepared probes, as listed in Table S1 (ESI†), though the Stokes shift is not larger than most of these man-made sensors, it is enough to avoid auto-fluorescence and the signal-to-noise ratio can be enhanced.
η) by fitting the Förster–Hoffmann equation,26 where R2 = 0.98, x = 0.41. The detection limit of this sensor for viscosity was determined to be 1.233 cP, as shown in Fig. S1 (ESI†). In addition, the Stokes shifts in high-viscous glycerol and low-viscous water were determined to be 49.1 nm and 56.0 nm, respectively, as shown in Fig. 2a and b. In comparison with the prepared probes, as listed in Table S1 (ESI†), though the Stokes shift is not larger than most of these man-made sensors, it is enough to avoid auto-fluorescence and the signal-to-noise ratio can be enhanced.
In addition, the viscosity may be enhanced when liquid food is stored at a lower temperature, whereas a higher temperature can cause the viscosity to decrease. Subsequently, the fluorescence intensities of glycerol under different temperatures were investigated. As shown in Fig. S2 (ESI†), the fluorescence spectra of glycerol stored at different temperatures were recorded. The fluorescence intensity was found to increase when the glycerol test system was stored at a lower temperature. By contrast, the fluorescence signal became weaker when the glycerol was stored at higher temperature. On the other hand, the viscosity was determined with a viscometer as well, and similar results could be found. Moreover, the capability of this natural molecular sensor ILG in various commercial liquids was investigated. In detail, eight kinds of common liquids were selected herein: peach oolong, pear juice, strawberry juice, milk, mango tea, lemon juice, watermelon juice and edible oil. As shown in Fig. S3 (ESI†), various fluorescence intensities can be found in these commercial liquids, which may be attributed to the viscosity variations in these liquids. Finally, the viscosities of these commercial liquids were measured with the viscometer, and the results in Table S2 (ESI†) were inconsistent with those from fluorescent methods.
To enhance the consistency, homogeneity and texture of liquids, several kinds of food thickener are often added to the liquids.27 Commonly, the viscosity will increase with the added amounts of thickeners, and the time to flow through the oesophagus may be increased.28 Thus, three kinds of food thickener with different amounts (from 1 g kg−1 to 5 g kg−1), were dissolved in pure water, and we expected that the thickening effect could be monitored by the fluorescent method. As shown in Fig. S4a (ESI†), it was found that the viscosity increased with the additional amount of each thickener, and the range of increase of each thickener was quite different. From a quantitative aspect, xanthan gum (XG) shared the highest thickening efficiency among these three kinds of thickener, while sodium carboxymethyl cellulose (SCC) displayed the lowest. An approximate linear relationship was found between the fluorescent intensity and addition amount, as shown in Fig. S4b (ESI†). Overall, the results demonstrated the superior viscosity detection capability of the ILG sensor through the fluorescent method.
3.3 Adaptability, selectivity, photostability, and mechanism verification
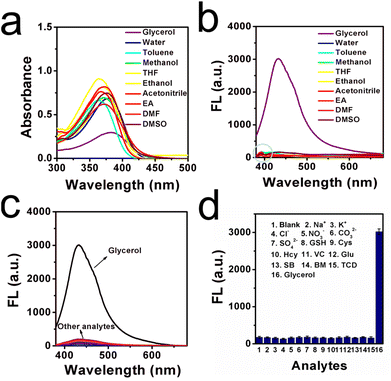
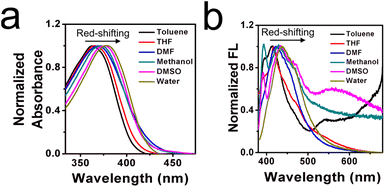
Inspired by detailed optical results, the adaptability in various common solvents was tested, since the microenvironment is complex in those commercial liquids, especially the polarity. In this case, absorption and emission spectra in various solvents with different polarities were studied, as shown in Fig. 3a and b. Herein, ten kinds of common solvent with different dielectric constants (ε) were selected: glycerol, water, toluene, methanol, THF, ethanol, acetonitrile, EA, DMF, and DMSO. It is found that the absorption peak in glycerol was slightly red-shifted by contrast with other absorption peaks in the low-viscous media. This finding may be attributed to the parallel stacking in the highly viscous microenvironment, leading to the conjugation being enlarged.29 In the emission spectra, strong fluorescence signals occurred in the high viscous glycerol, whereas the fluorescence signals were very much weaker in other solvents. This result may be ascribed to the intramolecular free rotation which consumes the excited energy in a non-radiative pathway. Detailed photophysical properties of the ILG sensor in these solvents are displayed in Table S3 (ESI†). Not only the polarity is complex in the commercial liquids, but also various additives (including the ions, reactive species, amino acids, etc.) are existed in the liquids. Therefore, the selectivity of ILG was tested further. Several representative ions, food additives, and reactive species were selected, as shown in Fig. 3c and d. It is observed that an obvious emission signal can be found in the high-viscous glycerol, and weaker signals occurred in the low pure water with the existence of various analytes. The corresponding intensity showed these results intuitively. Test results show that ILG is favourable for the investigation of viscosity over other related potential analytes. On the other hand, the sensor should have excellent photostability performance when used for viscosity detection. Thus, photostability experiments were carried out to investigate the stability of ILG in a wide pH range of 3.0–12.0. As shown in Fig. S5 (ESI†), fluorescent intensity was relatively stable in the common pH range of 3.0–12.0, which leads to the feasibility of applications in most commercial liquids. Next, the ILG sensor was placed in pure water, glycerol, and another eight kinds of common liquids, and then irradiated continuously with excitation wavelength light for 60 min. As displayed in Fig. S6 (ESI†), the fluorescence intensity changed slightly over the test time range in these representative commercial liquids, which suggests that ILG has high photostability for practical application. Overall, this ILG sensor showed wide adaptability, high selectivity, and excellent photostability in various commercial liquids.Moreover, to demonstrate the TICT effect, a theoretical calculation based on DFT/B3LYP/6-31G was performed using Gaussian 09 software. As shown in Fig. S7 (ESI†), the HOMOs were calculated to be mainly located in the phenol group and the LUMOs were calculated to be basically distributed over carbonyl whenever the carbonyl adopted optimized angles. Such a separation between a HOMO and LUMO may have led to strong charge transfer and the occurrence of an ICT process. Furthermore, energy gaps of sensor ILG at different rotation states were calculated to be 3.94 eV and 4.28 eV, respectively. The oscillator strength fem values were calculated to be 0.0671 and 0.0049 for dihedral angles of 0° and 90° between the phenol and carbonyl groups, respectively. These results indicated that the intramolecular rotation of the molecular sensor can form a typical twisted excited state. Next, a dual emission phenomenon usually occurred in the TICT system. Herein, it is found that a typical dual emission phenomenon existed in the emission spectra, as shown in the light blue circle in Fig. 3b, which suggests an important role played by solvent polarity in determining the excited-state electronic conformation by the TICT processes.30 In addition, the solvatochromism of the ILG sensor was measured in six representative solvents varying in polarity, as shown in Fig. 4. Typical red-shifting phenomena were found in both absorption and fluorescence spectra, which may be attributed to the stabilization of ICT occurring between the terminal phenol donor and carbonyl acceptor. All those test results indicated that a typical TICT mechanism existed in this molecular sensor.
3.4 Deterioration process detection
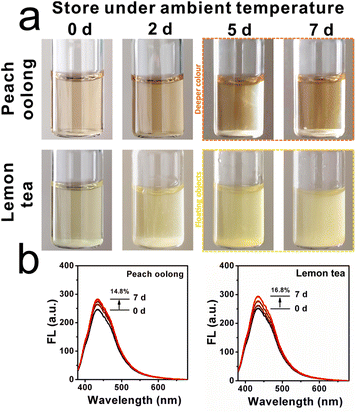
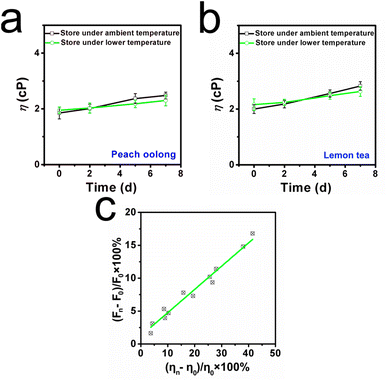
Subsequently, the application of the ILG sensor for viscosity imaging in the liquid deterioration process was then investigated, since fresh liquids are easily corrupted during long-term transportation and storage procedures.31 Thus, two kinds of commercial liquid (peach oolong and lemon tea) were utilized herein. These liquids were stored at ambient temperature and freshness-maintenance temperature for 7 days, respectively. Digital images were recorded during the storage time, as presented in Fig. 5a, and it was found that the colour of commercial peach oolong gradually became deeper after day 5 at ambient temperature. And floating objects can be observed in another commercial lemon tea after day 5. By contrast, the apparent situation was better when these two kinds of commercial liquid were stored at lower temperature. Light colour and transparent phenomena appeared in these commercial liquids even after day 5. Considering viscosity is a robust marker during this corruption procedure, the capability of ILG to identify viscosity fluctuations was further explored. Notably, to achieve effective deterioration investigation for timely intervention, the ILG sensor was added to each commercial liquid, and fluorescent spectra were recorded over the test time range. As shown in Fig. 5b, when these two kinds of commercial liquid were stored at ambient temperature, the fluorescent intensities increased by 14.8% and 16.8% for peach oolong and lemon tea, respectively. By comparison, the fluorescent intensities enhanced only 7.6% in the peach oolong and 9.1% in the lemon tea, as shown in Fig. S8 (ESI†). The spoilage progress became slower, and the results are in consistent with the predicted apparent images. Such results indicate that lower temperatures can prolong the storage time and freshness can be maintained to some extent.To consolidate this conclusion, the viscosity of the liquids was investigated with the viscometer from a quantitative perspective. As can be seen from Fig. 6a and b, when the beverages were stored at ambient temperature, the viscosities of cranberry tea and mango juice increased by 38.1% and 42.0%, respectively. On the other hand, the viscosities of these beverages increased by only 12.5% and 26.2% when stored at the lower storage temperature. The results were consistent with the fluorescence spectra. Notably, a linear fitting relationship can be established between the viscosity increment percentage (ηn − η0)/η0 × 100% and the fluorescence intensity increment percentage (Fn − F0)/F0 × 100%, as displayed in Fig. 6c. Those data further confirmed the capability of the ILG sensor to monitor viscosity variations during the deterioration process of liquids, supplying a novel method for liquid safety tracking in situ.
4. Conclusions
Herein, an activatable molecular sensor ILG was rationally designed, which has been used to detect variations in the microenvironment viscosity in the liquid system. Notably, this ILG sensor was extracted from the natural plant licorice, a clean and reproducible resource. An obvious turn-on signal can be found in the high-viscosity media since the rotation of the large conjugated olefin released energy from the excited dye molecule via the TICT process. From the results of experiments, wide adaptability, high selectivity, and excellent photostability in various commercial liquids can be observed. Based on these features, this sensor has been utilized to sense the variations in viscosity with the addition of various food thickeners with different mass concentrations, and the thickening effects were determined. More importantly, the viscosity in commercial liquids at different spoilage stages was detected through the fluorescent technique, and a linear relationship was found between the fluorescence increment percentage and enhanced degree of viscosity. We believe that our trial can effectively combine molecular luminescence and fluorescence imaging technology, which will facilitate the development of natural molecular tools for liquid safety investigation.Author contributions
Lingfeng Xu: conceptualization, writing – original draft, methodology, validation, visualization, funding acquisition. Minqing Kang & Fangzhi Xiong: formal analysis, investigation. Yanrong Huang & Xiuguang Yi: resources, writing – review & editing.Conflicts of interest
There are no conflicts to declare.Acknowledgements
This work was supported by this study was supported by the Natural Science Foundation of Jiangxi Province (20212BAB214031), National Natural Science Foundation of China (22168018), Doctoral Research Foundation of Jinggangshan University (JZB2006), Innovation and Entrepreneurship Training Program for College Students of Jiangxi Province (202210419011), Science and Technology Program of Jiangxi Provincial Education Bureau (GJJ211032), Innovation and Entrepreneurship Training Program for College Students of Jinggangshan University (JDX2022150).References
- T. King, M. Cole, J. M. Farber, G. Eisenbrand, D. Zabaras, E. M. Fox and J. P. Hill, Trends Food Sci. Technol., 2017, 68, 160–175 CrossRef CAS.
- X. Luo, Y. Han, X. Chen, W. Tang, T. Yue and Z. Li, Trends Food Sci. Technol., 2020, 95, 149–161 CrossRef CAS.
- Y. Han, W. Yang, X. Luo, X. He, H. Zhao, W. Tang, T. Yue and Z. Li, Crit. Rev. Food Sci. Nutr., 2022, 62, 244–260 CrossRef CAS PubMed.
- M. Lv, Y. Liu, J. Geng, X. Kou, Z. Xin and D. Yang, Biosens. Bioelectron., 2018, 106, 122–128 CrossRef CAS PubMed.
- J. Yates, M. Deeney, H. B. Rolker, H. White, S. Kalamatianou and S. Kadiyala, Nat. Food, 2021, 2, 80–87 CrossRef.
- P. Arora, A. Sindhu, N. Dilbaghi and A. Chaudhury, Biosens. Bioelectron., 2011, 28, 1–12 CrossRef CAS PubMed.
- S. Wibowo, C. Buvé, M. Hendrickx, A. Van Loey and T. Grauwet, Trends Food Sci. Technol., 2018, 73, 76–86 CrossRef CAS.
- F. Kweku Amagloh, A. N. Mutukumira, L. Brough, J. L. Weber, A. Hardacre and J. Coad, Food Nutr. Res., 2013, 57, 18717 CrossRef PubMed.
- M. Ma, Q.-J. Sun, M. Li and K.-X. Zhu, Food Chem., 2020, 318, 126495 CrossRef CAS PubMed.
- X. Chai, Z. Meng and Y. Liu, Food Chem., 2020, 317, 126382 CrossRef CAS PubMed.
- F. Morreale, R. Garzón and C. M. Rosell, Food Hydrocolloids, 2018, 77, 629–635 CrossRef CAS.
- J. Nsor-Atindana, H. Douglas Goff, W. Liu, M. Chen and F. Zhong, Carbohydr. Polym., 2018, 200, 436–445 CrossRef CAS PubMed.
- N. Mäkelä, O. Brinck and T. Sontag-Strohm, Food Hydrocolloids, 2020, 100, 105422 CrossRef.
- Y. Tang, Y. Ma, J. Yin and W. Lin, Chem. Soc. Rev., 2019, 48, 4036–4048 RSC.
- H. Chen, B. Dong, Y. Tang and W. Lin, Acc. Chem. Res., 2017, 50, 1410–1422 CrossRef CAS PubMed.
- J.-T. Hou, K.-K. Yu, K. Sunwoo, W. Y. Kim, S. Koo, J. Wang, W. X. Ren, S. Wang, X.-Q. Yu and J. S. Kim, Chem, 2020, 6, 832–866 CAS.
- Y. Ma, Y. Zhao, R. Guo, L. Zhu and W. Lin, J. Mater. Chem. B, 2018, 6, 6212–6216 RSC.
- B. Shen, L. F. Wang, X. Zhi and Y. Qian, Sens. Actuators, B, 2020, 304, 127271 CrossRef CAS.
- H. Li, W. Shi, X. Li, Y. Hu, Y. Fang and H. Ma, J. Am. Chem. Soc., 2019, 141, 18301 CrossRef CAS PubMed.
- L. Hu, D. Shi, X. Li, J. Zhu, F. Mao, X. Li, C. Xia, B. Jiang, Y. Guo and J. Li, Dyes Pigm., 2020, 177, 108320 CrossRef CAS.
- B. Sk, S. Khodia and A. Patra, Chem. Commun., 2018, 54, 1786–1789 RSC.
- D. Su, C. L. Teoh, L. Wang, X. Liu and Y.-T. Chang, Chem. Soc. Rev., 2017, 46, 4833 RSC.
- D. Li, X. Tian, A. Wang, L. Guan, J. Zheng, F. Li, S. Li, H. Zhou, J. Wu and Y. Tian, Chem. Sci., 2016, 7, 2257–2263 RSC.
- G. Chen, W. Li, T. Zhou, Q. Peng, D. Zhai, H. Li, W. Z. Yuan, Y. Zhang and B. Z. Tang, Adv. Mater., 2015, 27, 4496–4501 CrossRef CAS PubMed.
- Y. Deng and G. Feng, Anal. Chem., 2020, 92, 14667–14675 CrossRef CAS PubMed.
- Y.-J. Jin, Y.-G. Choi and G. Kwak, J. Mol. Liq., 2019, 276, 1–6 CrossRef CAS.
- A. Moret-Tatay, J. Rodrıguez-Garcı, E. Martı-Bonmatı, I. Hernando and M. J. Hernandez, Food Hydrocolloids, 2015, 51, 318–326 CrossRef CAS.
- L. Xu, F. Xiong, M. Kang, Y. Huang and K. Wu, Analyst, 2022, 147, 4132–4140 RSC.
- G. Chen, W. Li, T. Zhou, Q. Peng, D. Zhai, H. Li, W. Z. Yuan, Y. Zhang and B. Z. Tang, Adv. Mater., 2015, 27, 4496–4501 CrossRef CAS PubMed.
- J. Li, C. Yang, X. Peng, Y. Chen, Q. Qi, X. Luo, W.-Y. Lai and W. Huang, J. Mater. Chem. C, 2018, 6, 19–28 RSC.
- X. Luo, Y. Han, X. Chen, W. Tang, T. Yue and Z. Li, Trends Food Sci. Technol., 2020, 95, 149–161 CrossRef CAS.
Footnote |
| † Electronic supplementary information (ESI) available. See DOI: https://doi.org/10.1039/d2fb00013j |
| This journal is © The Royal Society of Chemistry 2023 |

