Adsorption property and mechanism of glutaraldehyde-crosslinked chitosan for removal of 2,4-dichlorophenoxyacetic acid from water†
Qing
Li
 a,
Heng
Su
b,
Yunhui
Yang
c,
Jingjing
Zhang
a,
Chuanhai
Xia
b and
Zhanyong
Guo
a,
Heng
Su
b,
Yunhui
Yang
c,
Jingjing
Zhang
a,
Chuanhai
Xia
b and
Zhanyong
Guo
 *a
*a
aKey Laboratory of Coastal Biology and Bioresource Utilization, Yantai Institute of Coastal Zone Research, Chinese Academy of Sciences, Yantai 264003, Shandong, China. E-mail: zhanyongguo@hotmail.com
bSchool of Resources and Environmental Engineering, Ludong University, Yantai 264025, Shandong, China
cCollege of Life Sciences, Yantai University, Yantai 264003, Shandong, China
First published on 6th December 2022
Abstract
In this work, glutaraldehyde-crosslinked chitosan (GCC) was prepared and its ability to remove 2,4-dichlorophenoxyacetic acid (2,4-D) from aqueous solutions was systematically studied. Batch experiments on adsorption conditions, isotherm models, kinetic models, and thermodynamics were performed to evaluate the ability of GCC for 2,4-D removal from aqueous solution. Under optimal adsorption conditions, the adsorption capacity for 2,4-D reached 252.55 mg g−1 with a dosage of 500 mg L−1 at pH 3. The adsorption isotherm of 2,4-D could be represented by the Freundlich model due to the high R2 (0.9986). Adsorption kinetics could be better represented by pseudo-second order kinetics (R2 > 0.99). The effect of temperature and thermodynamic experiments illustrated that the adsorption was exothermic and spontaneous. For other two phenoxycarboxylic acid herbicides (4-chlorophenoxyacetic acid and 2-(2,4-dichlorophenoxy)propionic acid), GCC also showed good adsorption performance under identical experimental conditions. Meanwhile, GCC can remove 75.2% of 2-chlorophenoxyacetic acid (2-CPA), 77.9% of 4-CPA, and 87.2% of 2,4-D from diluted industrial effluent. The reusability experiments indicated that GCC retained its usability after being regenerated with ethanol for five cycles.
Water impactCross-linked chitosan has good adsorption effects on a variety of heavy metals and organic pollutants and has been applied as an adsorbent in wastewater treatment. Glutaraldehyde-crosslinked chitosan was prepared and applied for adsorbing phenoxycarboxylic acid herbicides represented by 2,4-D from water with maximum adsorption capacity towards 2,4-D (252.55 mg g−1). This implies that cross-linked chitosan can be used in the treatment of wastewater to achieve the adsorption removal of one more pollutant (phenoxycarboxylic acid herbicides) without changing the treatment process. |
1. Introduction
2,4-Dichlorophenoxyacetic acid (2,4-D) is a selective herbicide belonging to the group of phenyoxycarboxylic acid herbicides. 2,4-D is used to control various weed species for many crops, such as sorghum, sugarcane, rice, maize, potato, barley, and wheat in many countries around the world.1–3 It was reported that 2,4-D caused serious liver and kidney damage in animals and humans at high concentrations.1,4 Due to its high mobility and low biodegradation, 2,4-D could be discharged from agricultural fields to ground and surface water.5 A certain concentration of 2,4-D (0.14–0.24 μg g−1) was detected in the urine of adults and children in southern China.6,7 The World Health Organization (WHO) designated 2,4-D as moderately hazardous (class II), and the United States Environmental Protection Agency (USEPA) categorized it as slightly to moderately toxic (class II–III).8As an important aspect of contamination, water plays an important role in the transmission of 2,4-D. Commonly used wastewater treatment technologies are ion exchange, coagulation and flocculation, adsorption, oxidation and extraction, membrane filtration, and biological methods.9 Among them, adsorption has been employed as a low-cost and efficient technique to remove 2,4-D with low concentrations at large volumes.10–13 In recent years, various adsorbents have been developed to remove organic pollutants from wastewater. As a porous material, activated carbon is widely used as an adsorbent in water treatment. A magnetic composite of activated carbon was reported to remove dyes from wastewater due to its quick and easy isolation, not leading to secondary pollution and having high efficiency.9,14 Activated carbon from various sources was developed as adsorbents for 2,4-D and other phenoxyacetic acid-based herbicides.2,15,16 Similar porous materials such as organophilic clay, biochar, and graphene were also used for 2,4-D removal from wastewater.17–19 Polysaccharides, such as chitin and chitosan, and by-products of agriculture such as peanut bark were also used for the removal of 2,4-D.1,2,20
Chitosan, as one of the most abundant natural polysaccharides, possesses several biological properties such as high biodegradability, non-toxicity, high chemical stability, and environmental benignity.21–23 Chitosan is one kind of natural cationic polymer and therefore has many applications related to this property. The amino and hydroxyl groups on chitosan chains can serve as coordination and electrostatic interaction sites, and thus contribute a lot to the high affinity towards adsorbates, which makes chitosan widely used in wastewater treatment.24–26 Bakasse et al. used chitin and chitosan as adsorbents for the removal of 2,4-D, but the adsorption capacity was only 6 and 11 mg g−1, respectively.20 Unfortunately, several disadvantages such as low mechanical stability and poor chemical stability in an acidic solution limit the widespread application of chitosan.27 In recent years, improving the adsorption capacity of chitosan by chemical modification has attracted increasing attention, and a great deal of effort has been made on the exploration of chitosan derivatives to obtain improved adsorption capacity.28–31
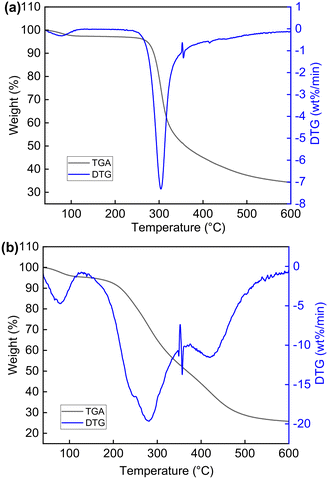
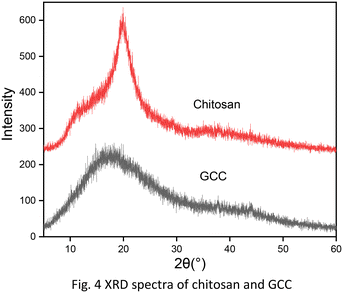
In this paper, we prepared glutaraldehyde-crosslinked chitosan (GCC) though simple chemical modification with glutaraldehyde. Glutaraldehyde is the most widely distributed bifunctional cross-linking reagent. The bridging part formed by glutaraldehyde and the amino group on chitosan makes GCC insoluble in water and provides sufficient space between linear polymers, which could offer more adsorption sites. The crosslinked-chitosan derivatives were reported to have improved adsorption capacity on metal ions, organometallic compounds, and inorganic salts.32–37 The chemical structure of GCC was characterized by Fourier transform infrared spectroscopy (FT-IR) and 13C nuclear magnetic resonance (13C NMR). Thermogravimetric analysis (TGA), scanning electron microscopy (SEM), X-ray diffraction (XRD) characterizations were conducted to evaluate the physical properties of chitosan and GCC. The adsorption experiments were performed with the GCC under different experimental conditions to investigate the adsorption capacity towards the removal of 2,4-D. Meanwhile, kinetic, equilibrium, and thermodynamic studies were conducted to provide a detailed evaluation of the adsorption performance of GCC and the adsorption mechanism. Furthermore, the adsorption capacity of GCC on other two phenoxyacid herbicides, industrial effluent, and the reusability of GCC were examined to investigate the practical applicability of GCC in water treatment.
2. Materials and methods
2.1 Materials
Chitosan was purchased from Zhejiang Golden Shell Pharmaceutical Co. (Zhejiang, China). Glutaraldehyde (50%), 2,4-dichlorophenoxyacetic acid (2,4-D), 4-chlorophenoxyacetic acid (4-CPA), and 2-(2,4-dichlorophenoxy)propionic acid (2,4-DP) were purchased from Merck Life Science (Shanghai) Co. Ltd. (Shanghai, China) with a minimum purity of 97%. The other reagents such as potassium bromide (KBr), and solvents are of analytical grade and were supplied by Sinopharm Chemical Reagent Co., Ltd., Shanghai, China.2.2 Characterization methods
FT-IR spectra were measured on an IS50 FT-IR Fourier transform infrared spectrometer (US, Thermo Fisher Scientific, Shanghai, China) with KBr disks. 13C Nuclear magnetic resonance (13C NMR) was measured with a Bruker AVANCEIII-600 spectrometer (Bruker Tech. and Serv. Co., Ltd., Beijing, China). The zeta potential was obtained by electrophoretic light scattering (ELS) on a nanometer particle size measuring instrument (Litesizer 500, Anton Paar Instruments, Graz, Austria). The surface morphology was examined by scanning electron microscopy (SEM, S-4800, Hitachi, Japan). 2,4-D's concentration was determined with a high performance liquid chromatogram (Thermo UltiMate 3000) equipped with a diode array detector (DAD-3000RS) using an Eclipse XDB-C18 column (4.6 × 150 mm, 5 μm) as the stationary phase. Thermo gravimetric-differential thermal analysis (TGA-DTA) was conducted by using a thermogravimetric analyzer (Mettler 5MP, Mettler-Toledo, Greifensee, Switzerland). The pore volume and surface area were determined using the Brunauer–Emmett–Teller (BET) technique (Kubo X1000, Beijing Builder Electronic Technology co., ltd, Beijing, China). The crystalline structure was studied by X-ray diffraction (XRD-6100, Shimadzu, Japan).2.3 Preparation of glutaraldehyde-crosslinked chitosan (GCC)
The synthetic routes for the preparation of GCC are shown in Fig. S1.† GCC was prepared according to methods reported previously with minor modification.31,37 1.5 g chitosan was dissolved in 180 ml acetic acid (5%) overnight. 18 mL glutaraldehyde solution (50%) was added rapidly to the chitosan solution. The mixture was stirred vigorously for 3 h at room temperature. The mixture became yellow after gelation, and was adjusted to neutral with sodium hydroxide solution (0.2 M). The mixture was poured into excess deionized water, and the precipitation was filtered off and washed carefully with ethanol and deionized water three times. The product was dried at 60 °C for 24 h and ground. Then the powder was passed through a 100 mesh sieve to ensure an upper limit on the product particle size. After being washed by a second cycle with ethanol and deionized water, the product was freeze dried.2.4 Adsorption experiment
To investigate the adsorption capacity of the adsorbent for 2,4-D, batch adsorption experiments were performed. 2,4-D solutions were prepared daily by dissolving 2,4-D in distilled water. Four parameters, including initial concentration of the adsorbent and 2,4-D, temperature, and pH were investigated with a thermostatic stirrer under constant stirring at 200 rpm. The pH of the aqueous solution was adjusted using 0.1 M HCl or 0.1 M NaOH solution.For the 2,4-D initial concentration study, 40 mg adsorbent was mixed with 40 mL 2,4-D aqueous solution (pH = 3) and stirred at 25 °C. 2,4-D's initial concentrations were 50, 100, 150, 200, and 250 mg L−1. For the adsorbent's initial concentration study, the adsorbent dosage was equal to 500, 800, 1000, or 1200 mg L−1 mixed with 40 mL 2,4-D aqueous solution (200 mg L−1, pH = 3) and stirred at 25 °C. For the pH and temperature studies, 40 mg adsorbent was mixed with 40 mL 2,4-D aqueous solution (200 mg L−1) and stirred. The pH values were 3, 4, 5, and 6. The tested temperatures were 25, 35, and 45 °C. At predetermined time intervals, 0.5 mL solution was collected and filtered, and the concentrations of 2,4-D were evaluated. Each experiment was performed in two replicates and the data were expressed as mean ± standard deviation (SD).
The adsorption capacity of the adsorbents was calculated using the following equation:
 | (1) |
2.5 Adsorption isotherms
Four adsorption isotherms were applied for the modelling of the adsorption process. Langmuir models and associated parameters are expressed by eqn (2). | (2) |
For the Langmuir model, the dimensionless separation factor (RL) is often used to estimate if the isotherm is favourable (0 < RL < 1), unfavourable (RL > 1), linear (RL = 1), or irreversible (RL = 0). RL is expressed by eqn (3).
 | (3) |
The Freundlich model is expressed by eqn (4).
 | (4) |
The Temkin model is expressed by eqn (5).
qe = B![[thin space (1/6-em)]](https://www.rsc.org/images/entities/char_2009.gif) ln ln![[thin space (1/6-em)]](https://www.rsc.org/images/entities/char_2009.gif) KT + B KT + B![[thin space (1/6-em)]](https://www.rsc.org/images/entities/char_2009.gif) ln ln![[thin space (1/6-em)]](https://www.rsc.org/images/entities/char_2009.gif) Ce Ce | (5) |
The D–R model and associated parameters are expressed by eqn (6)–(8), respectively.
ln![[thin space (1/6-em)]](https://www.rsc.org/images/entities/char_2009.gif) qe = ln qe = ln![[thin space (1/6-em)]](https://www.rsc.org/images/entities/char_2009.gif) qmD − KDε2 qmD − KDε2 | (6) |
ε = RT![[thin space (1/6-em)]](https://www.rsc.org/images/entities/char_2009.gif) ln(1 + 1/Ce) ln(1 + 1/Ce) | (7) |
| E = 1/KD1/2 | (8) |
The determination coefficient (R2), adjusted R2 (R2 (adj)), and standard error (SE) were employed to provide a quantitative comparison between the observed and estimated data.
2.6 Adsorption kinetics
In this work, kinetic data of the adsorption process were mainly explained by four kinetic models: the pseudo-first order, pseudo-second order, intraparticle diffusion, and Elovich models. The kinetic models are expressed by eqn (9)–(12):ln(qe − qt) = −k1t + ln![[thin space (1/6-em)]](https://www.rsc.org/images/entities/char_2009.gif) qe qe | (9) |
 | (10) |
| qt = kdt0.5 + C | (11) |
qt = (ln![[thin space (1/6-em)]](https://www.rsc.org/images/entities/char_2009.gif) αβ)/β + ln αβ)/β + ln![[thin space (1/6-em)]](https://www.rsc.org/images/entities/char_2009.gif) t/β t/β | (12) |
2.7 Thermodynamic study
The van't Hoff equation was used to calculate the entropy change (ΔS°) and the enthalpy change (ΔH°). Meanwhile, the Gibbs free energy change (ΔG°) can be calculated using the data obtained from the adsorption isotherm (eqn (13)). The van't Hoff equation can be expressed as eqn (14): | (13) |
 | (14) |
3. Results and discussion
3.1 Characterization and physical properties
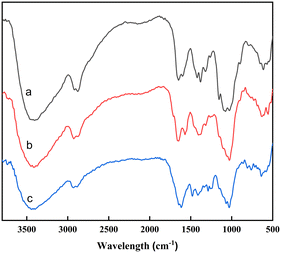
In the FT-IR spectrum of chitosan (Fig. 1a), the strong band around 3400 cm−1 corresponded to the N–H or O–H vibration. The bands at 2926 cm−1 and 2872 cm−1 referred to the vibration of the C–H bond in CH and CH2. The peak at 1602 cm−1 was the vibration of the N–H bond in NH2.38 After the cross-linking reaction (Fig. 1b), the peak at 1602 cm−1 disappeared and a new peak corresponding to C![[double bond, length as m-dash]](https://www.rsc.org/images/entities/char_e001.gif) N could be found at 1664 cm−1.39 These could confirm the successful formation of a Schiff base between chitosan and glutaraldehyde.30 After adsorption (Fig. 1c), new bands appeared at 1480 cm−1 and 1288 cm−1, which meant the vibrations of O–H and C–O in 2,4-D.
N could be found at 1664 cm−1.39 These could confirm the successful formation of a Schiff base between chitosan and glutaraldehyde.30 After adsorption (Fig. 1c), new bands appeared at 1480 cm−1 and 1288 cm−1, which meant the vibrations of O–H and C–O in 2,4-D.
To observe the changes in chemical bonds, 13C NMR spectra of chitosan and GCC were acquired and shown in Fig. S2.† The peaks at 61.1–102.0 ppm in the two spectra were identified as the carbon in the pyranose ring. In the 13C NMR spectrum of GCC, new peaks at 146.0 were assigned to ![[C with combining low line]](https://www.rsc.org/images/entities/char_0043_0332.gif) H
H![[double bond, length as m-dash]](https://www.rsc.org/images/entities/char_e001.gif) N in the Schiff base,39 and new peaks at 23.2–43.6 ppm were ascribed to
N in the Schiff base,39 and new peaks at 23.2–43.6 ppm were ascribed to ![[C with combining low line]](https://www.rsc.org/images/entities/char_0043_0332.gif) H2–
H2–![[C with combining low line]](https://www.rsc.org/images/entities/char_0043_0332.gif) H2–
H2–![[C with combining low line]](https://www.rsc.org/images/entities/char_0043_0332.gif) H2 in the bridging part between linear polymers.40
H2 in the bridging part between linear polymers.40
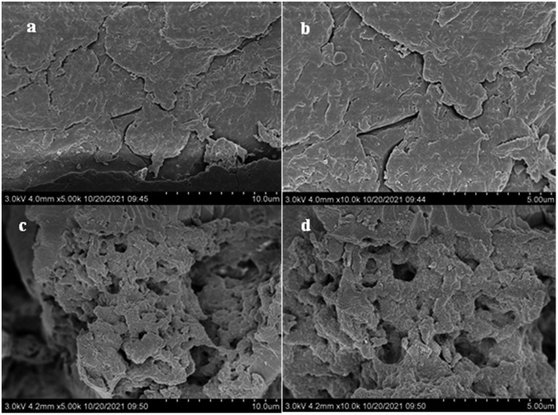
![[thin space (1/6-em)]](https://www.rsc.org/images/entities/char_2009.gif) 000 times magnification. We found that the morphology of chitosan changed after the cross-linking reaction with glutaraldehyde. Chitosan had a laminar structure with a smooth surface (Fig. 3a and b), whereas GCC had a porous structure with an irregular surface (Fig. 3c and d). A structure with pores and cavities was formed on the surface of GCC, which indicated a relatively high surface area (Fig. 3c and d). The presence of glutaraldehyde ensured sufficient space between linear polymers, and the porous structure formed by cross-linking could provide more adsorption sites.30
000 times magnification. We found that the morphology of chitosan changed after the cross-linking reaction with glutaraldehyde. Chitosan had a laminar structure with a smooth surface (Fig. 3a and b), whereas GCC had a porous structure with an irregular surface (Fig. 3c and d). A structure with pores and cavities was formed on the surface of GCC, which indicated a relatively high surface area (Fig. 3c and d). The presence of glutaraldehyde ensured sufficient space between linear polymers, and the porous structure formed by cross-linking could provide more adsorption sites.30
3.2 Adsorption properties of GCC
The influences of contact time, pH, GCC dosage, initial 2,4-D concentration, and temperature on the adsorption properties of GCC on 2,4-D were assessed. The removal rate and the experimental amount of adsorbed 2,4-D at the state of equilibrium by adsorption onto GCC for all the studied parameters are presented in Table 1.| Parameters | q e(exp) (mg g−1) | Removal (%) | |
|---|---|---|---|
| a T = 25 °C, pH = 3, C0 = 200 mg L−1. b T = 25 °C, Cadsorbent = 1000 mg L−1, C0 = 200 mg L−1. c T = 25 °C, pH = 3, Cadsorbent = 1000 mg L−1. d pH = 3, Cadsorbent = 1000 mg L−1, C0 = 200 mg L−1. | |||
| C adsorbent (mg L−1)a | 1200 | 149.36 ± 0.47 | 89.61 ± 0.29 |
| 1000 | 174.53 ± 0.87 | 87.26 ± 0.43 | |
| 800 | 199.26 ± 4.62 | 85.81 ± 0.69 | |
| 500 | 252.55 ± 1.78 | 63.14 ± 0.44 | |
| pHb | 3 | 174.53 ± 0.87 | 87.26 ± 0.43 |
| 4 | 159.93 ± 2.80 | 80.0 ± 1.40 | |
| 5 | 121.05 ± 0.39 | 60.53 ± 0.19 | |
| 6 | 121.91 ± 0.84 | 61.0 ± 0.42 | |
| C 0 (mg L−1)c | 250 | 211.76 ± 0.16 | 84.7 ± 0.06 |
| 200 | 174.53 ± 0.87 | 87.26 ± 0.43 | |
| 150 | 132.61 ± 0.16 | 88.41 ± 0.11 | |
| 100 | 92.65 ± 0.48 | 92.65 ± 0.48 | |
| 50 | 50.00 | 100.00 | |
| T (°C)d | 45 | 167.75 ± 1.57 | 83.88 ± 0.78 |
| 35 | 169.83 ± 1.70 | 84.92 ± 0.85 | |
| 25 | 174.53 ± 0.87 | 87.26 ± 0.43 | |
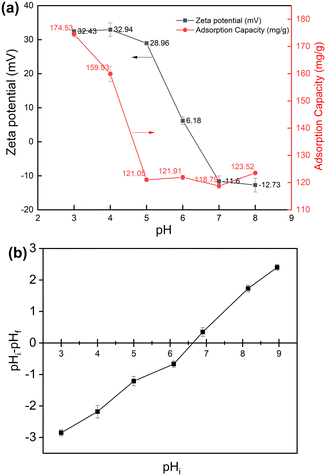
Batch experiments with four adsorbent concentrations were conducted to investigate the effect of the adsorbent concentration on the adsorption of 2,4-D onto GCC (Fig. 6a). As shown in Fig. 6a, the adsorption capacity decreased as the initial 2,4-D concentration increased from 500 to 1200 mg L−1. The maximal adsorption capacity was 252.55 mg g−1 at the adsorbent concentration equal to 500 mg L−1 (C0: 200 mg L−1; pH: 3.0; 25 °C). And high removal efficiency (89.61%) was achieved at high adsorbent concentration (1200 mg L−1). Meanwhile, the effect of 2,4-D initial concentration was also investigated. As implied in Fig. 6b, the adsorption capacity increased as the initial 2,4-D concentration increased from 50 to 250 mg L−1. The highest removal efficiency (100%) was achieved at 2,4-D initial concentration equal to 50 mg L−1 (adsorbent dosage: 1000 mg L−1; pH: 3.0; 25 °C). Fig. 6c illustrates the variation in adsorption capacity and removal efficiency with contact time for GCC (adsorbent dosage: 500 mg L−1; C0: 200 mg L−1; pH: 3.0; 25 °C). The adsorption capacity and removal efficiency of GCC increased rapidly within 60 min and gradually approached adsorption equilibrium after 120 min. The pH value is an important factor affecting both the adsorbate and adsorbent of the adsorption process in aqueous solutions. The effect of pH is attributed to the electrostatic interaction between the adsorbate molecule and the adsorbent surface. As can be seen in Fig. 5a, the adsorption ability of GCC towards 2,4-D decreased when the pH value increased (adsorbent dosage: 1000 mg L−1; C0: 200 mg L−1; 25 °C). The pH of zero point charge (pHzpc) was also determined using a method in the literature with some modification.47 The pHzpc of the adsorbent is the pH at which the electric charge density on the surface of the material is nil. The calculated pHzpc of GCC was 6.62 (Fig. 5b). In other words, there would be a net positive charge when pH < 6.62, and there would be a net negative charge on the surface of GCC when pH > 6.62. Moreover, 2,4-D was present in the anionic form when the pH was higher than 2.8.15,17 Consequently, electrostatic attraction occurred among the negatively charged 2,4-D ions and the positively charged GCC, which brought on high removal of 2,4-D at pH 3–4. The positive charge on the GCC surface gradually decreased as the pH increased, which could lead to a decrease in electrostatic attraction and adsorption capacity gradually at pH 5–8 (Fig. 5a). The low adsorption capacity may be due to agglomeration of the particles and the increase of the negative charge on the surface of the GCC particles.
 | ||
| Fig. 6 Effect of (a) adsorbent concentration, (b) 2,4-D initial concentration and (c) contact time on 2,4-D adsorption characteristics onto GCC. | ||
Batch experiments at different temperatures can help us to investigate whether the adsorption process of 2,4-D onto GCC is exothermic or endothermic. As presented in Table 1, the maximum experimental adsorption capacity decreased as the temperature increased, but not significantly. This indicated that the adsorption of 2,4-D onto GCC was an exothermic process and could achieve high adsorption capacity at room temperature.
3.3 Effect of ionic strength
Different amounts of NaCl (0–20 mmol L−1) were dissolved in the solution of 2,4-D to examine the effect of ionic strength on 2,4-D adsorption. As shown in Fig. S3,† the presence of NaCl at low concentrations had little effect on 2,4-D adsorption. And the adsorption of 2,4-D decreased gradually as the concentration of NaCl increased. It was reported that the adsorption capacity of 4-N-nonylphenol and bisphenol-A on magnetic reduced graphene oxides increased slightly with increasing NaCl concentration (0–100 mmol L−1). They suggested that NaCl decreased the solubility of the organic compound in solution and enhanced the adsorption.48 Since the solubility of 2,4-D in water is relatively high, 2,4-D will not be precipitated by the addition of NaCl in this study. It was speculated that the presence of NaCl caused a decrease in the positive charge on the surface of GCC, thus causing a decrease in adsorption.3.4 Adsorption isotherm study
The adsorption isotherm represents the surface properties and the affinity degree of the adsorbent, and the interaction between the adsorbate and adsorbent in aqueous solution under equilibrium conditions.49 Four isotherm models (Langmuir, Freundlich, Temkin, and D–R) were used to investigate the adsorption process. Fig. 7 displays the graphs of the four isotherm models of 2,4-D onto GCC, and the corresponding parameters are presented in Table 2.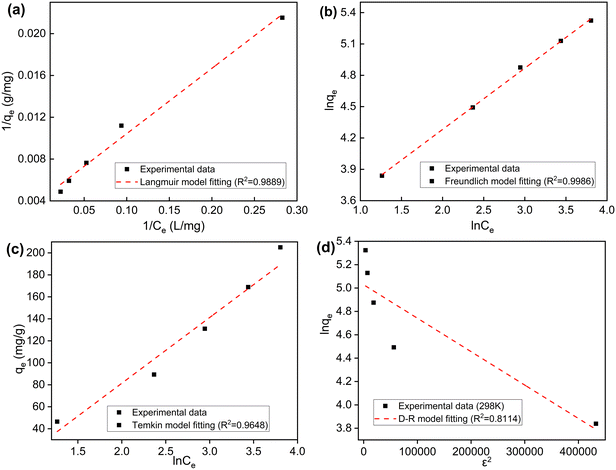 | ||
| Fig. 7 (a) Langmuir, (b) Freundlich, (c) Temkin and (d) D–R isotherm models for adsorption of 2,4-D onto GCC (adsorbent dosage: 1000 mg L−1; pH: 3.0, 25 °C). | ||
| Model | Parameters | Dataa |
|---|---|---|
| a T = 25 °C. | ||
| Langmuir | q m (mg g−1) | 238.10 |
| K L (L mg−1) | 0.067 | |
| R L | 0.015 | |
| R 2 | 0.9889 | |
| R 2 (adj) | 0.9852 | |
| SE | 0.0038 | |
| Freundlich | K F [(mg g−1)(L mg−1)1/n] | 22.28 |
| 1/n | 0.588 | |
| R 2 | 0.9986 | |
| R 2 (adj) | 0.9982 | |
| SE | 0.0127 | |
| Temkin | K T (L g−1) | 0.5008 |
| B | 61.83 | |
| R 2 | 0.9648 | |
| R 2 (adj) | 0.9530 | |
| SE | 6.8223 | |
| D–R | K D (mol2 J−2) | 3 × 10⁻⁶a |
| q mD (mg g−1) | 152.6 | |
| E (J mol−1) | 577.3503 | |
| R 2 | 0.8114 | |
| R 2 (adj) | 0.7485 | |
| SE | 7.9620 | |
The Langmuir isotherm model assumes that the adsorption process takes place on a homogeneous surface in the monolayer pattern, and there is no interaction between the adsorbate molecules. The maximum adsorption capacity (qm) obtained from the Langmuir isotherm was 238.10 mg g−1. The value of the Langmuir constant (KL) calculated from the linear regression equation of the Langmuir isotherm was 0.067 L mg−1, indicating good affinity between GCC and 2,4-D. The equilibrium parameter of the Langmuir isotherm (RL) was 0.015, which is much smaller than 1.0. This revealed that the adsorption of GCC onto 2,4-D was favourable. The Freundlich model hypothesizes that the process occurs on heterogeneous surfaces in the multilayer pattern.28 The energy of adsorption decreases exponentially as the adsorption process completes. In this model, constants KF and 1/n refer to the adsorption capacity and adsorption intensity. The value of 1/n was 0.589, suggesting that the 2,4-D adsorption onto GCC was favourable and little interaction existed between the adsorbed molecules. The Freundlich model exhibited slightly better R2 values than the Langmuir model, demonstrating the formation of multilayer interaction action between the adsorbent and adsorbate.50 As shown in Table 2, the values of correlation coefficients (R2) for the Freundlich model were much higher than those for the Temkin and D–R models. It denoted that the adsorption of 2,4-D could be represented by Freundlich models due to the high R2 values.
For the D–R model, the energy constant (E) is often used to predict adsorption of chemical or physical nature. If the value of E is less than 8 kJ mol−1, it means that the adsorption occurs mostly by physical adsorption. And for values between 9 and 16 kJ mol−1, chemisorption is predominant.18 As implied in Table 2, the value of E calculated was 0.577 kJ mol−1, which was the result of physical adsorption between GCC and 2,4-D.
3.5 Adsorption kinetics study
Kinetic models were investigated to determine the efficacy of adsorption and identify the adsorption mechanism, chemical reaction rate, and potential rate controlling steps. The experimental data were fitted to four kinetics models, including the pseudo-first order model, pseudo-second order model, Elovich model, and intraparticle diffusion model. The predicted kinetic rate constant of the adsorption process and the statistical parameters, such as R2 and SE, under various experimental conditions are included in Table 3.| Parameters | Kinetic models and parameters | ||||||||||||||
|---|---|---|---|---|---|---|---|---|---|---|---|---|---|---|---|
| Pseudo-first order model | Pseudo-second order model | Elovich model | |||||||||||||
| k 1 | R 2 | R 2 (adj) | SE | q 2 (mg g−1) | k 2 × 10⁻³ | R 2 | R 2 (adj) | SE | α × 10−3 | β | R 2 | R 2 (adj) | SE | ||
| a T = 25 °C, pH = 3, C0 = 200 mg L−1. b T = 25 °C, Cadsorbent = 1000 mg L−1, C0 = 200 mg L−1. c T = 25 °C, pH = 3, Cadsorbent = 1000 mg L−1. d pH = 3, Cadsorbent = 1000 mg L−1, C0 = 200 mg L−1. | |||||||||||||||
| C adsorbent (mg L−1)a | 1200 | 0.008 | 0.447 | 0.368 | 0.003 | 151.52 | 4.49 | 0.999 | 0.999 | 1.2 × 10⁻⁴ | 86.78 | 0.091 | 0.728 | 0.689 | 2.539 |
| 1000 | 0.011 | 0.686 | 0.641 | 0.003 | 172.41 | 3.09 | 0.999 | 0.999 | 1.5 × 10⁻⁴ | 1.9 | 0.051 | 0.879 | 0.858 | 2.991 | |
| 800 | 0.007 | 0.552 | 0.488 | 0.002 | 196.08 | 1.78 | 0.998 | 0.998 | 2.2 × 10⁻⁴ | 1.8 | 0.047 | 0.812 | 0.785 | 3.859 | |
| 500 | 0.006 | 0.641 | 0.59 | 0.002 | 232.56 | 1.43 | 0.993 | 0.992 | 4.0 × 10⁻⁴ | 0.83 | 0.034 | 0.898 | 0.884 | 3.715 | |
| pHb | 3 | 0.011 | 0.686 | 0.641 | 0.003 | 172.41 | 3.09 | 0.998 | 0.999 | 1.5 × 10⁻⁴ | 1.9 | 0.051 | 0.879 | 0.858 | 2.991 |
| 4 | 0.054 | 0.824 | 0.789 | 0.015 | 140.85 | 5.93 | 0.999 | 0.999 | 1.1 × 10⁻⁴ | 6.48 | 0.07 | 0.891 | 0.869 | 2.227 | |
| 5 | 0.089 | 0.873 | 0.848 | 0.015 | 125.00 | 5.98 | 0.998 | 0.997 | 2.3 × 10⁻⁴ | 3.63 | 0.076 | 0.872 | 0.846 | 2.265 | |
| 6 | 0.072 | 0.798 | 0.758 | 0.016 | 126.58 | 6.86 | 0.995 | 0.994 | 2.9 × 10⁻⁴ | 11.67 | 0.086 | 0.837 | 0.804 | 2.302 | |
| C 0 (mg L−1)c | 250 | 0.025 | 0.745 | 0.703 | 0.006 | 208.33 | 2.53 | 0.995 | 0.994 | 2.7 × 10⁻⁴ | 1.79 | 0.04 | 0.908 | 0.893 | 3.214 |
| 200 | 0.011 | 0.686 | 0.641 | 0.003 | 172.41 | 3.09 | 0.999 | 0.999 | 1.5 × 10⁻⁴ | 1.9 | 0.051 | 0.879 | 0.858 | 2.991 | |
| 150 | 0.022 | 0.67 | 0.615 | 0.006 | 131.58 | 4.90 | 0.999 | 0.999 | 1.1 × 10⁻⁴ | 3.94 | 0.075 | 0.862 | 0.839 | 2.185 | |
| 100 | 0.018 | 0.735 | 0.69 | 0.004 | 88.50 | 6.55 | 0.999 | 0.999 | 2.2 × 10⁻⁴ | 1.52 | 0.104 | 0.88 | 0.86 | 1.443 | |
| 50 | 0.04 | 0.732 | 0.688 | 0.01 | 49.26 | 17.84 | 0.993 | 0.992 | 7.9 × 10⁻⁴ | 23.61 | 0.263 | 0.77 | 0.731 | 0.85 | |
| T (°C)d | 45 | 0.016 | 0.512 | 0.43 | 0.006 | 166.67 | 4.74 | 0.996 | 0.996 | 1.7 × 10⁻⁴ | 51.98 | 0.094 | 0.694 | 0.651 | 2.667 |
| 35 | 0.021 | 0.648 | 0.589 | 0.006 | 169.49 | 3.78 | 0.999 | 0.999 | 8.4 × 10⁻⁵ | 53.77 | 0.077 | 0.746 | 0.709 | 2.853 | |
| 25 | 0.011 | 0.686 | 0.641 | 0.003 | 172.41 | 3.09 | 0.998 | 0.999 | 1.5 × 10⁻⁴ | 1.9 | 0.051 | 0.879 | 0.858 | 2.991 | |
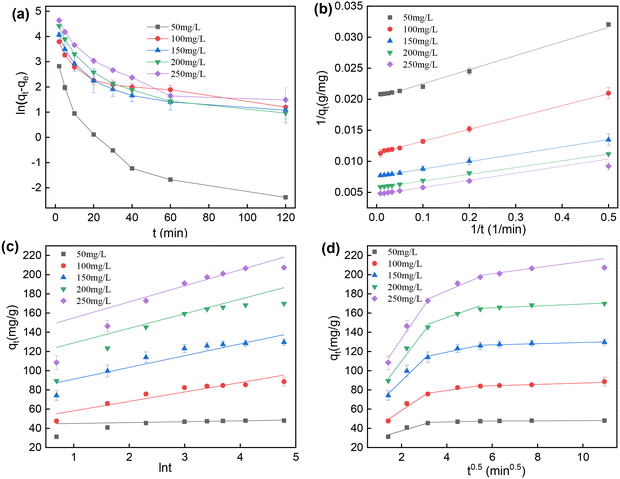
The curves of the pseudo-first order model and the fitting curves to the pseudo-second order model and Elovich model are shown in Fig. 8a–c. Based on the low R2 values, 2,4-D adsorption onto GCC did not follow the pseudo-first order and Elovich models.
According to the fitting curves to the pseudo-second order model (Fig. 8b) and the fitted parameters in Table 3, it can be seen that all the values of the correlation coefficient were very high (R2 > 0.99), and the SE values were very low. Moreover, from the fitted parameters listed in Tables 1 and 3, the values of qe calculated by the pseudo-second order model under all conditions tested agreed well with the experimental values of qe (qe(exp)). These experimental data suggested that the pseudo-second order model could better describe the adsorption of 2,4-D onto GCC. The valence force interaction by sharing electrons between 2,4-D molecules and the surface of GCC resulted in a rate-limiting step mediated by a chemical reaction.30,51 The pseudo-second order model is also interpreted as a special case of Langmuir kinetics. Compared to other kinetics models, the pseudo-second order model was very predictive for the determination of qe,18 which was verified in this work.
In Fig. 8d, it can be observed that the fitting curves to the intraparticle diffusion model had three sections of straight lines. As shown in the data in Table S2,† the diffusion rate constant (kd) decreased gradually as the adsorption proceeded. It was inferred that it was not a process controlled by intraparticle diffusion alone. In the first stages of the process, the high slope could be attributed to a possible rapid transportation of 2,4-D from the solution to the pores of GCC and a fast diffusion onto the external surface.28 The second linear part could be attributed to the pore diffusion of 2,4-D into the matrix of GCC. In the last stage of adsorption, the low slope meant the low speed of adsorption before reaching adsorption equilibrium. In the three linear segments, the value of C increased as the initial concentration of 2,4-D increased from 50 to 250 mg L−1, indicating that the boundary layer thickness and effect increased with the increase of 2,4-D initial concentration.16 Furthermore, all the fitting curves in the intraparticle diffusion model did not pass through the origin of the x-axis. It implied that the adsorption process was influenced by both mass transfer and intraparticle diffusion.30
3.6 Thermodynamic study
A thermodynamic study in the adsorption of 2,4-D onto GCC was conducted to determine the effect of temperature on the adsorption behaviour and the adsorption mechanism. The plot of ln(qe/Ce) vs. 1/T is shown in Fig. 9, and the parameters calculated according to the fittings of experimental data are illustrated in Table S3.† The values of ΔG° at different temperatures were all negative, indicating that the adsorption process was spontaneous. Meanwhile, the value of ΔG° decreased as the temperature raised, hinting that the adsorption of 2,4-D onto GCC was more favourable at low temperatures. All the values of ΔH° were negative, indicating that the adsorption was an exothermic process. This implied that the maximum adsorption capacity decreased as the temperature rose, which was consistent with the variation of ΔG° values. The positive values of ΔS° suggested that the randomness increased at the solid–liquid interface during the adsorption process of 2,4-D onto GCC.30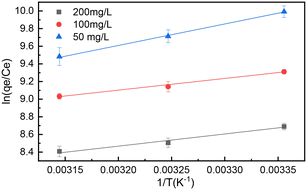 | ||
| Fig. 9 van't Hoff's plot for the determination of the thermodynamic parameters at different equilibrium 2,4-D concentrations (adsorbent dosage: 1000 mg L−1; pH: 3.0). | ||
3.7 Adsorption mechanism and comparative evaluation of adsorption capacity
To study the interaction of 2,4-D with GCC, we combined the obtained knowledge from the FTIR spectra (Fig. 1), pHzpc, and adsorption capacity of GCC at different pH values (Fig. 5b). As shown in the FTIR spectra (Fig. 1), the hydroxyl (–OH) peak of GCC shifted from 3417 cm−1 to 3443 cm−1 after adsorption 2,4-D, suggesting the formation of hydrogen bonding.19 Hydrogen bonding was probably not the main cause of 2,4-D adsorption, as it would be weakened seriously when the fraction of neutral 2,4-D decreased with increasing pH.On the other hand, the adsorption mechanism was investigated according to the surface charge of 2,4-D and GCC at different pH values. At low pH (3 and 4), the amino (–NH2) and –OH groups of GCC were protonated in the following reactions:
| R − NH2 + H+ → R − NH3+ |
(protonation of the amino group)
| R − OH + H+ → R − OH2+ |
(protonation of the hydroxyl group)
Therefore, GCC was positively charged at low pH.
Meanwhile, 2,4-D was present in the anionic form when the pH was higher than 3 (pKa 2.8), which meant that 2,4-D was negatively charged. 2,4-D changed to the anionic form in the following reaction:
(anionic form of 2,4-D)
Thus, we deduced that the adsorption by electrostatic and cation–dipole attraction took place between the 2,4-D anionic form (due to the positive charge of the 2,4-D molecule in the pH range of 3–5) and the protonated amino and hydroxyl groups in GCC.20 The process was as shown in the following reactions:
(electrostatic attraction)
(cation–dipole attraction)
Moreover, electrostatic adsorption is a type of spontaneous and exothermic reaction, which is consistent with the results of thermodynamic calculations.
To verify this mechanism and further to investigate the adsorption performance of GCC on phenyoxycarboxylic acid herbicides, the adsorption efficiency of GCC to 2,4-D was compared with those of other two herbicides, 4-CPA and 2,4-DP, under identical experimental conditions (adsorbent dosage: 1000 mg L−1, herbicide dosage: 200 mg L−1, 25 °C). The adsorption capacity at equilibrium of 2,4-D, 4-CPA, and 2,4-DP onto GCC was 174.53, 157.64, and 146.22 mg g−1, respectively. 4-CPA and 2,4-DP were structurally similar to 2,4-D and were present in the anionic form at low pH. This suggested that the high adsorption performance of GCC to 4-CPA and 2,4-DP was due to the electrostatic and cation–dipole attraction between the protonated GCC and anionic herbicides. In conclusion, GCC had a good adsorption effect on phenyoxycarboxylic acid herbicides.
Furthermore, a comparison with other reported adsorbents is presented in Table 4 to evaluate the adsorption capacity for removing 2,4-D from water. Compared with chitosan and chitin (11.16 and 6.08 mg g−1),20 the adsorption capacity of the product after simple cross-linking (GCC) was greatly improved. After comparing the maximum adsorptive capacity of different materials, with the exception of some activated carbon and composite, the GCC presented in this study had high efficiency (252.55 mg g−1) in removing 2,4-D.
| Adsorbents | q m (mg g−1) | Dosage (mg L−1) | pH | Ref. |
|---|---|---|---|---|
| a Adsorbents that obtained the best fit for the Langmuir isotherm. | ||||
| Canola stalk-derived activated carbon | 135.8 | 150 | 2 | Amiri et al., 2020 (ref. 2) |
| Acid-treated peanut skina | 246.72 | 25–200 | 2 | Georgin et al., 2021 (ref. 1) |
| Magnetic graphenea | 32.31 | 5–50 | 3 | Liu et al., 2016 (ref. 19) |
| Biomixturea | 155.7 | — | 5.5–6.8 | Ballari et al., 2022 (ref. 8) |
| Organophilic claya | 148.62 | 5–110 | 3–8 | de Souza et al., 2019 (ref. 18) |
| Ferrospinel compositea | 400 | 250 | 2 | Sayğılı, 2020 (ref. 52) |
| Chitin/chitosana | 6.08/11.16 | 20 | 3.7 | El Harmoudi et al., 2014 (ref. 20) |
| Corn cob biochara | 37.4 | 20–60 | 2 | Binh et al., 2020 (ref. 17) |
| Corncob ACa | 334.77 | 50–400 | 3.5 | Njoku et al., 2011 (ref. 16) |
| Polymer-based activated carbon-polyvinyl alcohola | 55.9 | 20–100 | 3 | Lelifajri et al., 2018 (ref. 15) |
| GCC | 252.55 | 50–250 | 3 | This work |
3.8 Recycling of GCC
To study the reusability of GCC, five consecutive desorption/regeneration cycles were performed (adsorbent dosage: 1000 mg L−1; C0: 50 mg L−1; pH: 3.0; 25 °C). It was reported that the affinity of 2,4-D for alcohols was stronger than the electrostatic interactions with GCC surface functional groups.6 Therefore, ethanol was selected as the regeneration solvent. The 2,4-D adsorption capacity decreased from 48.7 to 40.8 mg g−1 when the adsorbent was regenerated with ethanol and reused five times. As presented in Fig. 10, the adsorbent retained 97.4% of its original capacity in the second regeneration cycle, and after five cycles the adsorption efficiency of 2,4-D remained above 81.6%. These results demonstrated the high efficiency and stability of GCC during the adsorption–desorption processes. Considering the simple and environmentally-friendly method of preparation and regeneration, GCC was a promising adsorbent for removing 2,4-D from wastewater.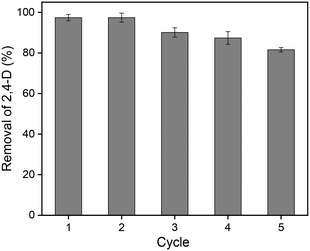 | ||
| Fig. 10 Removal percentage of 2,4-D by CSAC after 5 cycles of regeneration (adsorbent dosage: 1000 mg L−1; C0: 50 mg L−1; pH: 3.0; 25 °C). | ||
3.9 Remediation of industrial effluent
We also evaluated the adsorption capacity of GCC on industrial effluent. The effluent was taken from an incineration plant and contained a variety of chlorinated organic pollutants, which were diluted and analysed by liquid chromatography-mass spectrometry (LC-MS) for the content of phenoxycarboxylic acid compounds. GCC was used to the treatment of diluted industrial effluent under optimal adsorption conditions (adsorbent dosage: 1000 mg L−1; 25 °C). The initial and residual concentrations of organic pollutants, adsorption capacity, and removal percentage are represented in Table 5. After adsorption, 75.2% of 2-CPA, 77.9% of 4-CPA, and 87.2% of 2,4-D were eliminated from the solution. GCC had an adsorption capacity of 166.0 mg g−1 after 60 min for an initial herbicide concentration of 201 mg g−1. This demonstrated that GCC was a promising and reliable material for eliminating herbicide from real water.4. Conclusions
In this paper, GCC as an eco-friendly adsorbent was synthesized from chitosan and employed to adsorb 2,4-D from aqueous solution. The adsorption experiments were conducted with changes in the influence factors of contact time, pH, GCC dosage, initial 2,4-D concentration, and temperature. The adsorption of 2,4-D on GCC was favourable at low pH and lower temperature, and the maximum adsorption capacity qe(exp) was equal to 252.55 mg g−1 for 2,4-D with an adsorbent dosage of 500 mg L−1. We compare four isotherm models (Langmuir, Freundlich, Temkin, and D–R) and four kinetic models (pseudo-first order, pseudo-second order, Elovich, and intraparticle diffusion) in modelling the adsorption of 2,4-D onto GCC. The results illustrated that both the Langmuir and Freundlich models provided a good fit for the equilibrium adsorption data. For adsorption kinetics, the pseudo-second order model could better describe the adsorption of 2,4-D onto GCC, and the adsorption process was influenced by both mass transfer and intraparticle diffusion. According to the thermodynamic parameters calculated, the adsorption was an exothermic and spontaneous process. In addition, experiments with GCC in practical applicability were also conducted. GCC exhibited a very high adsorption effect on 4-CPA and 2,4-DP, which indicated that the adsorption of these three anionic phenoxycarboxylic acid herbicides on GCC was based on the same adsorption mechanism. Meanwhile, GCC can remove more than 75% of 2-CPA, 4-CPA and 2,4-D from diluted industrial effluent and also retained its usability for five cycles. Thus, GCC can be effectively used as an adsorbent for the removal of phenyoxycarboxylic acid herbicides from contaminated waters. This highly-efficient and biodegradable adsorbent for phenyoxycarboxylic acid herbicides could be a promising material for contaminated water treatment.Author contributions
Qing Li: writing-original draft, writing-review and editing, investigation; formal analysis. Heng Su: formal analysis. Yunhui Yang: investigation and validation. Jingjing Zhang: project administration and funding acquisition. Zhanyong Guo: funding acquisition, writing-review and editing. Chuanhai Xia: data curation.Conflicts of interest
There are no conflicts to declare.Acknowledgements
This work was financially supported by Natural Science Foundation of Shandong Province (ZR2022MD094), National Natural Science Foundation of China (22006063), Natural Science Foundation of Shandong Province (ZR2020QB145), and TaiShan industrial Experts Programe (tscy 20200124).References
- J. Georgin, D. S. P. Franco, M. S. Netto, D. G. A. Piccilli, E. L. Foletto and G. L. Dotto, Adsorption investigation of 2,4-D herbicide on acid-treated peanut (Arachis hypogaea) skins, Environ. Sci. Pollut. Res., 2021, 28, 36453–36463 CrossRef CAS PubMed.
- M. J. Amiri, R. Roohi, M. Arshadi and A. Abbaspourrad, 2,4-D adsorption from agricultural subsurface drainage by canola stalk-derived activated carbon: insight into the adsorption kinetics models under batch and column conditions, Environ. Sci. Pollut. Res., 2020, 27, 16983–16997 CrossRef CAS PubMed.
- E. B. Martínez-Ruiz and F. Martínez-Jerónimo, Exposure to the herbicide 2,4-D produces different toxic effects in two different phytoplankters: A green microalga (Ankistrodesmus falcatus) and a toxigenic cyanobacterium (Microcystis aeruginosa), Sci. Total Environ., 2018, 619-620, 1566–1578 CrossRef.
- Z.-F. Li, J.-X. Dong, N. Vasylieva, Y.-L. Cui, D.-B. Wan, X.-D. Hua, J.-Q. Huo, D.-C. Yang, S. J. Gee and B. D. Hammock, Highly specific nanobody against herbicide 2,4-dichlorophenoxyacetic acid for monitoring of its contamination in environmental water, Sci. Total Environ., 2021, 753, 141950 CrossRef CAS PubMed.
- Y. Sun, M. Cao, Y. Wan, H. Wang, J. Liu, F. Pan, W. He, H. Huang and Z. He, Spatial variation of 2,4-D and MCPA in tap water and groundwater from China and their fate in source, treated, and tap water from Wuhan, Central China, Sci. Total Environ., 2020, 727, 138691 CrossRef CAS PubMed.
- B. Liu, N. Guo, Z. Wang, Y. Wang, X. Hao, Z. Yang and Q. Yang, Adsorption of 2,4-dichlorophenoxyacetic acid over Fe–Zr-based metal-organic frameworks: Synthesis, characterization, kinetics, and mechanism studies, J. Environ. Chem. Eng., 2022, 10, 107472 CrossRef CAS.
- W. Song, Y. Wan, Y. Jiang, Z. Liu and Q. Wang, Urinary concentrations of 2,4-D in repeated samples from 0–7 year old healthy children in central and south China, Chemosphere, 2021, 267, 129225 CrossRef CAS.
- M. E. Fernandez, M. d. R. Morel, A. C. Clebot, C. S. Zalazar and M. d. l. M. Ballari, Effectiveness of a simple biomixture for the adsorption and elimination of 2,4-dichlorophenoxyacetic acid (2,4-D) herbicide and its metabolite, 2,4-dichlorophenol (2,4-DCP), for a biobed system, J. Environ. Chem. Eng., 2022, 10, 106877 CrossRef CAS.
- A. J. Jafari, B. Kakavandi, R. R. Kalantary, H. Gharibi, A. Asadi, A. Azari, A. A. Babaei and A. Takdastan, Application of mesoporous magnetic carbon composite for reactive dyes removal: Process optimization using response surface methodology, Korean J. Chem. Eng., 2016, 33, 2878–2890 CrossRef CAS.
- Y. L. d. O. Salomón, J. Georgin, D. S. P. Franco, M. S. Netto, D. G. A. Piccilli, E. L. Foletto, L. F. S. Oliveira and G. L. Dotto, High-performance removal of 2,4-dichlorophenoxyacetic acid herbicide in water using activated carbon derived from Queen palm fruit endocarp (Syagrus romanzoffiana), J. Environ. Chem. Eng., 2021, 9, 104911 CrossRef.
- A. E. Orduz, C. Acebal and G. Zanini, Activated carbon from peanut shells: 2,4-D desorption kinetics study for application as a green material for analytical purposes, J. Environ. Chem. Eng., 2021, 9, 104601 CrossRef CAS.
- V. Rizzi, D. Lacalamita, J. Gubitosa, P. Fini, A. Petrella, R. Romita, A. Agostiano, J. A. Gabaldón, M. I. Fortea Gorbe, T. Gómez-Morte and P. Cosma, Removal of tetracycline from polluted water by chitosan-olive pomace adsorbing films, Sci. Total Environ., 2019, 693, 133620 CrossRef CAS.
- M. Bahrami, M. J. Amiri and B. Beigzadeh, Adsorption of 2,4-dichlorophenoxyacetic acid using rice husk biochar, granular activated carbon, and multi-walled carbon nanotubes in a fixed bed column system, Water Sci. Technol., 2018, 78, 1812–1821 CrossRef CAS.
- R. R. Kalantry, A. J. Jafari, A. Esrafili, B. Kakavandi, A. Gholizadeh and A. Azari, Optimization and evaluation of reactive dye adsorption on magnetic composite of activated carbon and iron oxide, Desalin. Water Treat., 2016, 57, 6411–6422 CrossRef.
- Lelifajri, M. A. Nawi, S. Sabar, Supriatno and W. I. Nawawi, Preparation of immobilized activated carbon-polyvinyl alcohol composite for the adsorptive removal of 2,4-dichlorophenoxyacetic acid, J. Environ. Chem. Eng., 2018, 25, 269–277 Search PubMed.
- V. O. Njoku and B. H. Hameed, Preparation and characterization of activated carbon from corncob by chemical activation with H3PO4 for 2,4-dichlorophenoxyacetic acid adsorption, Chem. Eng. J., 2011, 173, 391–399 CrossRef CAS.
- Q. A. Binh and H.-H. Nguyen, Investigation the isotherm and kinetics of adsorption mechanism of herbicide 2,4-dichlorophenoxyacetic acid (2,4-D) on corn cob biochar, Bioresour. Technol. Rep., 2020, 11, 100520 CrossRef.
- F. M. de Souza, O. A. Andreo dos Santos and M. G. Adeodato Vieira, Adsorption of herbicide 2,4-D from aqueous solution using organo-modified bentonite clay, Environ. Sci. Pollut. Res., 2019, 26, 18329–18342 CrossRef CAS PubMed.
- W. Liu, Q. Yang, Z. Yang and W. Wang, Adsorption of 2,4-D on magnetic graphene and mechanism study, Colloids Surf., A, 2016, 509, 367–375 CrossRef CAS.
- H. El Harmoudi, L. El Gaini, E. Daoudi, M. Rhazi, Y. Boughaleb, M. A. El Mhammedi, A. Migalska-Zalas and M. Bakasse, Removal of 2,4-D from aqueous solutions by adsorption processes using two biopolymers: chitin and chitosan and their optical properties, Opt. Mater., 2014, 36, 1471–1477 CrossRef CAS.
- P. Kaur and P. Kaur, β-Cyclodextrin-chitosan biocomposites for synergistic removal of imazethapyr and imazamox from soils: Fabrication, performance and mechanisms, Sci. Total Environ., 2020, 710, 135659 CrossRef CAS.
- S. Olivera, H. B. Muralidhara, K. Venkatesh, V. K. Guna, K. Gopalakrishna and Y. Kumar K, Potential applications of cellulose and chitosan nanoparticles/composites in wastewater treatment: A review, Carbohydr. Polym., 2016, 153, 600–618 CrossRef CAS PubMed.
- K. Li, P. Li, J. Cai, S. Xiao, H. Yang and A. Li, Efficient adsorption of both methyl orange and chromium from their aqueous mixtures using a quaternary ammonium salt modified chitosan magnetic composite adsorbent, Chemosphere, 2016, 154, 310–318 CrossRef CAS PubMed.
- A. Geuna, M. Alvarez and A. J. Satti, Adsorbent composites of montmorillonite and chitosan of different molecular weight, obtained by gamma irradiation, J. Environ. Chem. Eng., 2022, 10, 107080 CrossRef CAS.
- L. Pietrelli, I. Francolini and A. Piozzi, Dyes adsorption from aqueous solutions by chitosan, Sep. Sci. Technol., 2015, 50, 1101–1107 CrossRef CAS.
- C. Septhum, S. Rattanaphani, J. B. Bremner and V. Rattanaphani, An adsorption study of A1(III) ions onto chitosan, J. Hazard. Mater., 2007, 148, 185–191 CrossRef CAS.
- S. Liu, Y. Li, J. Yan, Y. Zhou, C. Liu, Y. Zuo and D. Liu, Effective removal of ruthenium(III) ions from wastewater by xanthate-modified cross-linked chitosan, J. Environ. Chem. Eng., 2021, 9, 104818 CrossRef CAS.
- T. Kekes and C. Tzia, Adsorption of indigo carmine on functional chitosan and beta-cyclodextrin/chitosan beads: Equilibrium, kinetics and mechanism studies, J. Environ. Manage., 2020, 262, 110372 CrossRef CAS.
- P. F. P. Barbosa, L. R. Cumba, R. D. A. Andrade and D. R. do Carmo, Chemical modifications of cyclodextrin and chitosan for biological and environmental applications: Metals and organic pollutants adsorption and removal, J. Polym. Environ., 2019, 27, 1352–1366 CrossRef CAS.
- Y. Jiang, B. Liu, J. Xu, K. Pan, H. Hou, J. Hu and J. Yang, Cross-linked chitosan/beta-cyclodextrin composite for selective removal of methyl orange: Adsorption performance and mechanism, Carbohydr. Polym., 2018, 182, 106–114 CrossRef CAS.
- L. D. Wilson, D. Y. Pratt and J. A. Kozinski, Preparation and sorption studies of β-cyclodextrin-chitosan-glutaraldehyde terpolymers, J. Colloid Interface Sci., 2013, 393, 271–277 CrossRef CAS PubMed.
- N. A. Ekrayem, A. A. Alhwaige, W. Elhrari and M. Amer, Removal of lead (II) ions from water using chitosan/polyester crosslinked spheres derived from chitosan and glycerol-based polyester, J. Environ. Chem. Eng., 2021, 9, 106628 CrossRef CAS.
- B. Trung Huu, W. Lee, S.-B. Jeon, K.-W. Kim and Y. Lee, Enhanced Gold(III) adsorption using glutaraldehyde-crosslinked chitosan beads: Effect of crosslinking degree on adsorption selectivity, capacity, and mechanism, Sep. Purif. Technol., 2020, 248, 116898 Search PubMed.
- S. Nagireddi, V. Katiyar and R. Uppaluri, Pd(II) adsorption characteristics of glutaraldehyde cross-linked chitosan copolymer resin, Int. J. Biol. Macromol., 2017, 94, 72–84 CrossRef CAS PubMed.
- M. H. Mahaninia and L. D. Wilson, A kinetic uptake study of roxarsone using cross-linked chitosan beads, Ind. Eng. Chem. Res., 2017, 56, 1704–1712 CrossRef CAS.
- M. H. Mahaninia and L. D. Wilson, Phosphate uptake studies of cross-linked chitosan bead materials, J. Colloid Interface Sci., 2017, 485, 201–212 CrossRef CAS PubMed.
- D. Y. Pratt, L. D. Wilson and J. A. Kozinski, Preparation and sorption studies of glutaraldehyde cross-linked chitosan copolymers, J. Colloid Interface Sci., 2013, 395, 205–211 CrossRef CAS PubMed.
- F. Luan, Q. Li, W. Tan, L. Wei, J. Zhang, F. Dong, G. Gu and Z. Guo, The evaluation of antioxidant and antifungal properties of 6-amino-6-deoxychitosan in vitro, Int. J. Biol. Macromol., 2018, 107, 595–603 CrossRef CAS PubMed.
- Q. Li, J. Ren, F. Dong, Y. Feng, G. Gu and Z. Guo, Synthesis and antifungal activity of thiadiazole-functionalized chitosan derivatives, Carbohydr. Res., 2013, 373, 103–107 CrossRef CAS PubMed.
- Q. Li, W. Tan, C. Zhang, G. Gu and Z. Guo, Novel triazolyl-functionalized chitosan derivatives with different chain lengths of aliphatic alcohol substituent: Design, synthesis, and antifungal activity, Carbohydr. Res., 2015, 418, 44–49 CrossRef CAS PubMed.
- W. Tan, J. Zhang, Y. Mi, Q. Li and Z. Guo, Synthesis and characterization of α-lipoic acid grafted chitosan derivatives with antioxidant activity, React. Funct. Polym., 2022, 172, 105205 CrossRef CAS.
- N. H. Elsayed, A. Alatawi and M. Monier, Diacetylmonoxine modified chitosan derived ion-imprinted polymer for selective solid-phase extraction of nickel (II) ions, React. Funct. Polym., 2020, 151, 104570 CrossRef CAS.
- M. S. Valencia, M. Franco da Silva Júnior, F. H. Xavier Júnior, B. de Oliveira Veras, E. Fernanda de Oliveira Borba, T. Gonçalves da Silva, V. L. Xavier, M. Pessoa de Souza and M. d. G. Carneiro-da-Cunha, Bioactivity and cytotoxicity of quercetin-loaded, lecithin-chitosan nanoparticles, Biocatal. Agric. Biotechnol., 2021, 31, 101879 CrossRef CAS.
- K. Zhao, Y. Sun, G. Chen, G. Rong, H. Kang, Z. Jin and X. Wang, Biological evaluation of N-2-hydroxypropyl trimethyl ammonium chloride chitosan as a carrier for the delivery of live Newcastle disease vaccine, Carbohydr. Polym., 2016, 149, 28–39 CrossRef CAS PubMed.
- D. J. Sullivan, M. Cruz-Romero, T. Collins, E. Cummins, J. P. Kerry and M. A. Morris, Synthesis of monodisperse chitosan nanoparticles, Food Hydrocolloids, 2018, 83, 355–364 CrossRef CAS.
- J. Hao, B. Guo, S. Yu, W. Zhang, D. Zhang, J. Wang and Y. Wang, Encapsulation of the flavonoid quercetin with chitosan-coated nano-liposomes, LWT–Food Sci. Technol., 2017, 85, 37–44 CrossRef CAS.
- N. Liu, M. Zhu, H. Wang and H. Ma, Adsorption characteristics of Direct Red 23 from aqueous solution by biochar, J. Mol. Liq., 2016, 223, 335–342 CrossRef CAS.
- Z. Jin, X. Wang, Y. Sun, Y. Ai and X. Wang, Adsorption of 4-n-nonylphenol and bisphenol-a on magnetic reduced graphene oxides: A combined experimental and theoretical studies, Environ. Sci. Technol., 2015, 49, 9168–9175 CrossRef CAS PubMed.
- M. Massoudinejad, A. Asadi, M. Vosoughi, M. Gholami, B. Kakavandi and M. A. Karami, A comprehensive study (kinetic, thermodynamic and equilibrium) of arsenic (V) adsorption using KMnO4 modified clinoptilolite, Korean J. Chem. Eng., 2015, 32, 2078–2086 CrossRef CAS.
- J. S. Calisto, I. S. Pacheco, L. L. Freitas, L. K. Santana, W. S. Fagundes, F. A. Amaral and S. C. Canobre, Adsorption kinetic and thermodynamic studies of the 2, 4 - dichlorophenoxyacetate (2,4-D) by the Co-Al-Cl layered double hydroxide, Heliyon, 2019, 5, e02553 CrossRef PubMed.
- X. Guo, S. Zhang and X.-Q. Shan, Adsorption of metal ions on lignin, J. Hazard. Mater., 2008, 151, 134–142 CrossRef CAS PubMed.
- G. A. Sayğılı, Conversion of a renewable bio-resource to a functional composite material: Product design, comprehensive characterization and adsorption of 2,4-D herbicide, Sustainable Chem. Pharm., 2020, 18, 100338 CrossRef.
Footnote |
| † Electronic supplementary information (ESI) available. See DOI: https://doi.org/10.1039/d2ew00638c |
| This journal is © The Royal Society of Chemistry 2023 |

