Improved VRC-3R− model for bulk water residual chlorine decay in the UV/Cl2 process for a water distribution network†
Haipei
Wang‡
 *a,
Bing
Wang
*a,
Yi
Peng
b,
John C.
Crittenden
c,
Haifeng
Pan
a and
Lixin
Wang
a
*a,
Bing
Wang
*a,
Yi
Peng
b,
John C.
Crittenden
c,
Haifeng
Pan
a and
Lixin
Wang
a
aSchool of Municipal and Environmental Engineering, Shenyang Jianzhu University, Shenyang, China. E-mail: 15524470995@163.com; 18202460111@163.com; P13353264073@163.com; 2928611991@qq.com
bSDIC Xinkai Water Environment Investment Co., Ltd, Beijing, China. E-mail: py301103@163.com
cSchool of Civil and Environmental Engineering and the Brook Byers Institute for Sustainable Systems, Georgia Institute of Technology, Atlanta, USA. E-mail: john.crittenden@ce.gatech.edu
First published on 1st December 2022
Abstract
The combination of UV irradiation and chlorine (UV/Cl2), as a new and efficient process, has been widely applied in drinking water disinfection. In this study, an improved VRC-3R− (variable rate coefficient – 3 reactants minus other reactants) residual chlorine decay model was proposed in the UV/Cl2 process in a water distribution network. Firstly, the single-factor experimental method was employed to assess the effects of initial residual chlorine concentration in the UV disinfection stage (C01) and pipe network decay stage (C02), UV intensity (F), inorganic nitrogen ([NO2−]), ammonia nitrogen ([NH4+]), and total organic carbon (TOC) on residual chlorine decay during the UV disinfection stage and pipe network decay stage. Next, the response surface method (RSM) was used to establish multivariate functions among the decay coefficients in the UV disinfection stage (k) and pipe network decay stage (K), C01, C02, temperature (T), and pH as correction coefficients. Finally, the model was calibrated using EPANET 2.0. In conclusion, (1) the optimal residual chlorine concentration and UV dose were 7.75 mg L−1 and 50.1 mJ cm−2, respectively; the pipe network disinfection by-product safety was confirmed. (2) The longest hydraulic retention time (HRT) in the pipe network was 5.12 h before the secondary chlorination. (3) The additional decay model by UV irradiation was established by subtracting the residual chlorine decay function with and without UV irradiation using the RSM's fitting results. (4) The calibration function value of the new model for two cases reached δ1win (C) = 0.18, δ1sum (C) = 0.16, δ2win (C) = 0.16 and δ2sum (C) = 0.14 in summer & autumn and spring & winter, respectively, which were less than the minimum (0.33) and standard values (0.25). (5) The residual chlorine concentration at the end of the water distribution network was less than 0.1 mg L−1 in summer & autumn, exhibiting the importance of secondary chlorination to provide a reference for this process's application in water distribution networks.
Water impactOptimal parameters for the UV/Cl2 process were determined: 6 W UV lamp and 7.75 mg-Cl2 per L NaClO ensured 30 min contact time, enabling treated water's residual chlorine concentration of more than 0.03 mg L−1; the minimum UV dose was 50.1 mJ cm−2 by calculation and the maximum HRT was 5.12 h entering the water distribution network. This information was useful for the UV/Cl2 process's control. |
1. Introduction
Chlorine disinfection is widely used to disinfect drinking water. However, it is easy to form chlorine-containing disinfection by-products (DBPs) that reduce the chlorine-resistant microorganisms' inactivation rate. To reduce health risks, UV (ultraviolet)/Cl2 has become one of the most popular advanced oxidation processes (AOPs) and disinfection processes.1 UV/Cl2 is divided into two categories: (1) chlorination followed by UV irradiation that is commonly used; (2) UV irradiation followed by chlorination to improve the disinfection capacity with a large amount of active free radical production and less power consumption.2 Although the latter has many problems, such as more DBP production and higher cost which restrict its application, it is still attractive for two reasons. Firstly, the UV/Cl2 process does not require additional chlorine to quench the residual H2O2; secondly, the HOCl and OCl˙ radical generation has higher reaction coefficients, quantum yields and lower energy demands than residual H2O2 under irradiation via 254 nm UV lamps. Therefore, it has an excellent energy-saving effect.3The residual chlorine decay during chlorine disinfection has always been the interest of researchers and has been studied since the 1950s, focusing on the temperature effect.4 Then, other factors' effects, including total organic carbon (TOC), pH and initial residual chlorine concentrations, were summarised in the 1990s.5 In China, the residual chlorine decay theoretical system was first systematically described in 1998.6,7 Since then, its related theories have been continuously improved. Recently, the development of computer technology and mathematical tools significantly advanced the residual chlorine decay model's specificity and accuracy. In 2009, the variable rate coefficient model (VRC) was proposed, highlighting the key effect of different reaction rates between various in-water substances and residual chlorine species on residual chlorine decay.8 In 2011, the 2R (2 reactants) model was proposed, considering the difference in the reaction rates between different chlorine-reactive species and substances in water, causing the decay rate divergence.9 In 2015, the TOC effect on variable reaction rates was explained, showing that booming new models would further discuss the factors and their mechanisms.10
In recent years, significant progress has been made in studying residual chlorine decay. In 2016, the basic process, using single-factor experiments to determine the different factors' influence on the residual chlorine decay mechanisms, the correction coefficient equation was formulated and proposed.11 Then, the RSM (response surface method) was raised in 2018 to integrate the effects of TOC, initial residual chlorine concentration (C0, including C01 and C02), and pH to further improve the correction coefficient's accuracy.12 Additionally, the influences of secondary chlorine,13 the hydraulic model14 and the wall decay coefficient15 on residual chlorine decay have attracted much attention recently. Therefore, both the theoretical system and engineering application have been becoming increasingly robust.
Although most studies on the UV/Cl2 process have focused on water treatment, recent studies on residual chlorine decay in the UV/Cl2 process have also been reported. In 2007, the UV disinfection effect on residual chlorine decay in tanks was first proposed.16 In 2016, the UV/Cl2 process was studied in secondary disinfection by monitoring and evaluating the residual chlorine concentration.17 In 2020, the relationship between the residual chlorine decay coefficient and UV dose was proposed, initially revealing the UV dose mechanism on residual chlorine decay.18 However, a proper discussion regarding the correction coefficient mechanism was needed. Excluding the transformation of ClO− to ClO2−, the mechanism was discussed corresponding to different halogen elements, and the proportion of various active species was revealed at different pH values in 2017 and 2020.19,20 However, the photochemical reaction analysis between UV and residual chlorine was still lacking in the residual chlorine decay model, negatively affecting the model's accuracy.
In this study, by mixing the VRC and 2R model, an improved VRC-3R− (variable rate coefficient – 3 reactants minus other reactants) bulk residual chlorine decay model in the UV/Cl2 process was established by analysing the photochemical reaction among radicals produced by UV, water molecules and residual chlorine.13 Firstly, the Dahuofang reservoir water was taken as the water sample, and the relationship between additional residual chlorine decay and UV intensity was derived by analysing the photochemical reaction and products mentioned above. Simultaneously, the disinfection by-product safety effects at the optimal residual chlorine concentration, UV dose and hydraulic residence time (HRT) were also evaluated. Secondly, the single-factor experiment and RSM were used to fit the correction coefficient model to provide a reference for the process's efficient use in drinking water disinfection. Finally, the calibration function was constructed for a virtual case and an actual case each. Through field experiments and laboratory experiments, EPANET 2.0 software was used for modelling, simulation, and ultimately verifying the model's accuracy.
2. Model establishment
2.1 The bulk water residual chlorine decay model on UV irradiation
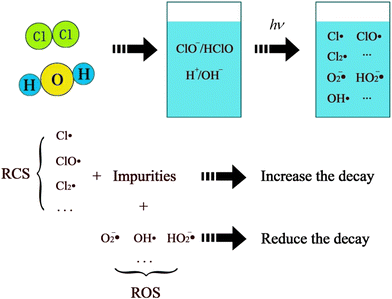
After using the UV/Cl2 process, active free radicals played an important role in degradation and disinfection by water ionization, chlorine hydrolysis and UV irradiation.22 The species of Cl˙, ClO˙, and Cl2˙ were commonly referred to as reactive chlorine species (RCS), represented by the CRCS.23 Similarly, OH˙, O2˙, and any other non-chlorine radicals were called reactive oxide species (ROS), represented by CROS.24 The theoretical diagram was shown in Fig. 1.The RCS had a clear reaction with soluble organic impurities more quickly, while non-radical free chlorines (ClO−, HClO, ClO2−, ClO3−, etc., called NRFC) reacted more slowly.25 Meanwhile, the NRFC was also divided into faster and slower parts. The presence of multiple free radicals in the reaction system caused variations in different types of RCS and ROS reaction rate constants. Therefore, simply describing the residual chlorine decay with the 2R model would be biased. Therefore, the VRC model was introduced to describe the residual chlorine decay process, further improving the 2R model.8 The residual chlorine total amount was expressed as the sum of NRFC and RCS, and residual chlorine decay should be included in the process effect because RCS played a more dominant role in microbial inactivation and pollutant degradation in the UV/Cl2 process than NRFC.1 Moreover, the previous experiments above demonstrated that the residual chlorine decay on UV irradiation was significantly faster than that without irradiation, thus, the effects of RCS and ROS should not be ignored.
The reaction rate constant should be decomposed and extended to construct the 3R (3 reactants) model. Additionally, the chlorine reactants reduced by ROS equivalent were corrected, and the temperature factor was considered in the experiment design and data fitting. Thus, the model was eventually called the VRC-3R− model.13 It was worth mentioning that if the relative proportions of RCS and ROS changed over time, the decay coefficients in the UV disinfection stage (k) and pipe network decay stage (K) would not be constant. However, the radical types and their proportions varied with external conditions, such as the initial residual chlorine concentration in the UV disinfection stage (C01) and pipe network decay stage (C02), pH and temperature (T). The RSM can be used to describe the interrelationship between k, K, pH, C01, C02, and T. k is a multifactorial variable, and external conditions affected k by affecting the proportion of RCS and ROS. Because ROS bore the impurities that the effective chlorine (RCS and NRFC) should bear to be degraded, the impurity concentration that reacted with the available chlorine, as well as the reaction rate between the effective chlorine and impurities, was reduced, resulting in the residual chlorine decay coefficient reduction.26 Hence, the kinetic equations of the residual chlorine and impurity reaction minus the one for the ROS and impurity reaction explained the reduction of the residual chlorine decay coefficient under ROS pressure.
In summary, the VRC-3R− model was represented as follows:
 | (1) |
 | (2) |
All free radicals' reaction coefficients were indicated by eqn (3) to consider the self-quenching influence between conspecific free radicals. The indirect or direct reactions between heterologous free radicals were also considered.19
| koverall = kdirect + kindirect − kreformation | (3) |
2.2 Establishment and simplification of the bulk residual chlorine decay model in the UV disinfection stage in the UV/Cl2 process
The total reaction rate increased even if CROS objectively reduced the residual chlorine decay rate, and this change was caused by UV irradiation. The residual chlorine decay rate constant in the UV/Cl2 process minus the one of the chlorine disinfection process was the total effect of UV on residual chlorine decay, which was explained by eqn (4):| κ1f × CRCS + (κ2s + κ3s) × CNRFC − κ4s × CROS = (kbulk + kRCS − kROS)[Cl2] | (4) |
| i.e. kUV = kRCS − kROS |
Therefore, the simplified and modified residual chlorine decay model was shown as eqn (5):
 | (5) |
| kbulk = kself + kTOC + kNO2− + kNH4+ | (6) |
Eqn (7) and (8) defined the UV dose as the product of UV intensity and time,27i.e.
| I = Ft | (7) |
| kUV = f(I) = C0e−f(I) | (8) |
In conclusion, the residual chlorine decay model was simplified as eqn (9)
| Ct = C01 × e−kt1 | (9) |
k was the total decay coefficient expression in the UV disinfection stage, h−1, which was expressed as eqn (10):
| k = (θT × θpH × θC01) × [kself + kTOC + kNO2− + kNH4+ + kUV] | (10) |
The RSM was used to fit the multivariate relationship of k and three factors: T, C01 and pH, to obtain more accurate results shown as eqn (11):
| k = θ(T, pH, C01) × kbulk | (11) |
The mechanistic model above defined the UV effect as a correction factor expressed by (kRCS–kROS). The method mentioned above could adjust the parameters more accurately than the single-factor model without affecting the whole model. In addition, the parameter regulation's independence and various factors' theoretical relevance were reflected. Particularly, the correction coefficients in the model were separated into UV and non-UV factor correction coefficients, making finding problems in the experiments and process easy and resolvable within the time frame.
2.3 Establishment and simplification of the bulk residual chlorine decay model in the pipe network decay stage in the UV/Cl2 process
Since the presence of UV led to the reaction of active free radicals with organic matter, microorganisms and other substances in water, the specific indicators of organic matter and disinfection by-product composition were changed. Then the results of the chlorine disinfection in the water distribution network analysed by the bulk residual chlorine decay model would be different.Similarly, the bulk residual chlorine decay was indicated by eqn (12):
| Ct = C02e−Kt2 | (12) |
| C02 = C01e−kt1max | (13) |
| K = (ΘT × ΘpH × ΘC02) × (Kself + KTOC + KNO2− + KNH4+) | (14) |
| i.e. Kbulk = Kself + KTOC + KNO2− + KNH4+ |
It was also checked that Kbulk = kbulk = 0.0013 h−1.11ΘT, ΘpH and ΘC02 were the correction coefficients of T, pH, and C02 on residual chlorine decay in the pipe network decay stage, respectively. Similar to section 2.2, to consider the interaction influence between multiple factors, the RSM was used for fitting the multivariate relationship between k and three factors: T, C02 and pH, to obtain more precise results,12i.e.
| K = Θ(T, pH, C02) × Kbulk | (15) |
3. Experiment materials and methods
3.1 Experiment purpose
Firstly, in the UV disinfection and pipe network decay stages of the UV/Cl2 process, the correction coefficient of UV intensity (F), the initial residual chlorine concentration (C01 & C02) in the two stages, NO2−, NH4+ and TOC to residual chlorine decay was determined; secondly, the model's accuracy was further corrected using the RSM. Finally, the experimental results established a more accurate residual chlorine decay model.3.2 Experiment materials
1 bottle of 1500 g norm NaClO (analytically pure), 1 pack of residual chlorine A reagent and residual chlorine B reagent each, and Milli-Q ultrapure water as the solvent were purchased from Qiwei Instrument and Technology Corporation in Zhejiang. The residual chlorine content was measured using standard methods. One bottle of 100 g norm KH2PO4, 1 bottle of 200 g norm NaOH, 1 bottle of 100 g norm NaNO2 and NH4Cl each, 100 mL of configured humic acid solution and 1000 mL HCl solution. All reagents above, which were analytically pure, were purchased from Shanghai Sinopharm Reagent Corporation.3.3 Experiment devices and instruments
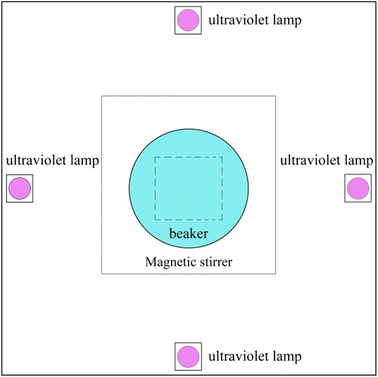
Since the objective was bulk residual chlorine decay, it was not necessary to consider the residual decay loss from the pipe wall. Therefore, the beaker experiment's sealing process in the reactor was used to measure the bulk residual chlorine decay.The reactor was a UV irradiation reactor made of cardboard: (1) a large, enclosed cardboard container; (2) 6 W, 12 W, 16 W, 20 W and 25 W low-pressure mercury lamps each, producing 254 nm UV light; (3) thermostatic magnetic stirrers.
The device is shown in Fig. 2 below.
The UV lamp was assembled to the center of the cardboard reactor's four sides. Each specific lamp was selected for the experiment, pulled back down, replaced with a new one and so on.1 The different lamps' UV intensities were measured using KI/KIO3 photometry in the reactor. Each lamp was measured using 9.96 g KI, 2.14 g KIO3 and 0.381 g Na2B4O7. It was configured as 1 L solution for photolysis experiments to measure the UV intensity and dose in a fixed volume reactor at different UV lamp powers.28–30
This experiment device used the instrument protocol for the UV/ chlorine-free process in 2021.3 Meanwhile, the UV intensity and dose were measured and calculated by the principle modelling scheme.29 Furthermore, the measured UV intensities were corrected using the correction method proposed, and all UV lights were equipped with gratings to improve the illumination uniformity. Besides, the Petri coefficient was increased to 1 to improve the measurement's accuracy.30
3.4 Measurement index
The indicators to be measured in the experiment are shown in Table 1.| Index | Unit | Analytical technique | Detectability |
|---|---|---|---|
| pH | — | Portable pH measuring meter | 0.01 |
| Dimness | NTU | Portable turbidity measuring meter | 0.01 |
| Chrominance | Degree | Colorimeter | 5 |
| NH4+ | mgN L−1 | Naer reagent color method | 0.025 |
| NO2− | mgN L−1 | N-(1-Naphthyl)-ethylenediamine photometry | 0.025 |
| NO3− | mgN L−1 | UV spectrophotometry | 0.01 |
| CODMn | mg L−1 | Acid process | 0.01 |
| TOC | mg L−1 | Total organic carbon analyzer | 0.05 |
| UV254 | AU cm−1 | UV spectrophotometry | 0.002 |
| Residual chlorine | mg-Cl2 per L | Portable residual chlorine tester | 0.01 |
| T | °C | Mercury thermometer | 0.1 |
| TP | mg L−1 | Total phosphorus tester | 0.01–0.6 |
| TN | mg L−1 | Total nitrogen tester | 0.05–0.2 |
The water samples for the experiment were taken from Dahuofang reservoir. The measured water quality indicators are shown in Table 2.
| Index | Filtered water | UV/Cl2-treated water |
|---|---|---|
| pH | 7.5 | 7.7 |
| Dimness | 0.31–0.65 | 0.10–0.25 |
| TP | 0.02–0.04 | 0.01–0.02 |
| TN | 1.8–2.0 | 1.0–1.4 |
| Chrominance | 3–5 degrees | 1–3 degrees |
| NH4+ | 0.07–0.17 | 0.02–0.05 |
| NO3− | 1.24–1.4 | 0.5–0.8 |
| NO2− | 0.12–0.15 | 0.03–0.06 |
| CODMn | 2.64–2.95 | 2.20–2.32 |
| TOC | 2.34–2.58 | 0.3–0.6 |
| Residual chlorine | 0 | 0.4–0.7 |
| T | 25 °C | 25 °C |
3.5 Experiment procedures
Before performing the residual chlorine decay experiments, a 1000 ml beaker was filled with 10 mg-Cl2 per L sodium hypochlorite solution. After 24 hours of placement, it was thoroughly washed with Milli-Q ultrapure water to meet the chlorine-free requirement.31The UV power was determined to be 16 W. A sample of 3.5 mg-Cl2 per L and two samples of 1000 mL norm were prepared for residual chlorine decay experiments with UV irradiation and without UV irradiation, both in 30 min. To investigate the effect of three factors on k, NO2−, NH4+ and TOC concentrations in the other samples were adjusted from 0.01 to 0.05 mg L−1, 0 to 3.5 mg L−1 and 0.2 to 1 mg L−1, respectively. The interval was set to ensure that the decrease in residual chlorine concentration among the measurements did not exceed 10%. According to the method above, the residual chlorine concentration was measured at regular intervals to determine the optimal residual chlorine concentration and UV dose. Then the single-factor relationship among k & K, NO2−, NH4+ and TOC, as well as the multifactorial relationship between k & K, pH, C01 & C02 and T, was investigated in the UV disinfection stage and pipe network decay stage to plot the fit curves and response surfaces, respectively. The duration of UV irradiation was 30 min. After the removal, UV irradiation was set for 2 h, and the measurement method remained unchanged.
The following methods controlled each factor: different amounts of NaClO were added to the other samples to simulate the different C01 in the water distribution network from 2.5 to 4.5 mg L−1; the pH was adjusted from 6.5 to 8.5 by mixing NaOH solution with HCl solution; meanwhile, the pH remained constant using the KH2PO4–NaOH buffer solution; the sample solution was adjusted in the incubator from 25 to 35 °C, ensuring that T was constant during the whole decay process; the NaNO2 and NH4Cl solutions were used to adjust the [NO2−] and [NH4+], ranging from 0 to 0.05 mg L−1 and 0 to 3.5 mg L−1, respectively; at the same time, a humic acid solution was used to simulate TOC in the samples from 0.2 to 1 mg L−1. When each factor was studied, all others were controlled and unchanged.
The Origin software was not only used to fit the residual chlorine decay curve and correction coefficient but also determined the relationship between each factor and residual chlorine decay coefficient, which was the function between the correction coefficient and each factor. Ultimately, the RSM experiments were designed by DesignExpert software, and then the updated expression of k and K was further obtained by fitting the response surface in two stages. All experimental data were the results after averaging over three times measurements.
4. Results and discussion
4.1 Effect of UV dose
According to the experiment conditions, the UV doses corresponding to each residual chlorine concentration were calculated.The curve of UV dose and residual chlorine concentration was measured. According to the experiment fitting results, the transient residual chlorine concentration after UV irradiation showed the obvious exponential function relationship, which was as follows (eqn (16)):
| C1(I) = 3.54e−0.03I | (16) |
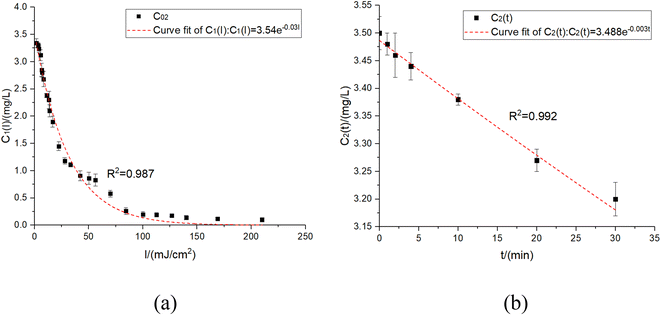 | ||
| Fig. 3 The relationship between different UV doses and residual chlorine concentrations in residual chlorine decay. (a) UV irradiation experiment. (b) Blank experiment. | ||
By turning off the UV lamp, a blank experiment was conducted on the residual chlorine decay. The residual chlorine decay expression with C01 = 3.5 mg L−1 obtained under the blank experiment was shown as eqn (17):
| C2(t) = 3.488e−0.003t | (17) |
According to the figure above, the basic form of eqn (16) and Fig. 3-a was consistent with the previous results.18 The experimental data showed that the residual chlorine drops quickly before about 7 mJ cm−2 but slowly after about 25 mJ cm−2.
4.2 Optimum initial residual chlorine concentration (C01) and UV dose
To solve the problem of low residual chlorine in the treated water due to fast residual chlorine decay and obtain the amount of NaClO which met the treated water residual chlorine specification, the residual chlorine decay equation was transformed as: | (18) |
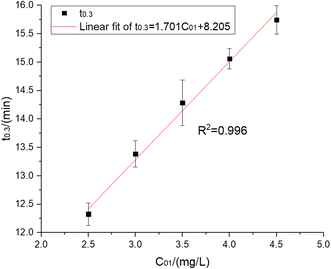
When Ct = 0.3 mg L−1 and the UV power was 16 W, eqn (18) obtained the time required for residual chlorine decaying to Ct = 0.3 mg L−1 with the various initial concentrations of residual chlorine solution irradiated by UV, as shown in Table 3 and Fig. 4.
| C 01/(mg L−1) | t 0.3/(min) |
|---|---|
| 2.5 | 12.327 |
| 3 | 13.387 |
| 3.5 | 14.283 |
| 4 | 15.060 |
| 4.5 | 15.744 |
After fitting, the relationship between t0.3 and C01 was:
| t0.3 = 1.701C01 + 8.205, R2 = 0.996 | (19) |
When t0.3 = 30 min, C01 = 12.8 mg L−1 was obtained. This meant that when the UV power was 16 W, the residual chlorine C01 = 12.8 mg L−1 should be added to ensure that the treated water residual chlorine met the specifications, and there was also enough contact time to kill E. coli and other microorganisms. However, more disinfection by-products were generated due to a large amount of chlorine. In addition, the UV dose was calculated to be I = 126 mJ cm−2, much higher than the previously determined doses of 20 mJ cm−2 and 80 mJ cm−2.21 Therefore, the supplementary experiment was conducted: if the initial residual chlorine concentration was set at 12.8, 10.8, 8.8, 6.8 and 4.8 mg L−1, 6 W and 12 W UV lamps would be used for the irradiation experiment in 30 min to determine the residual chlorine decay coefficient and fit the decay coefficient's change rule varied with UV intensity and residual chlorine concentration. The experimental results are shown in Fig. 5 and 6 and Table 4.
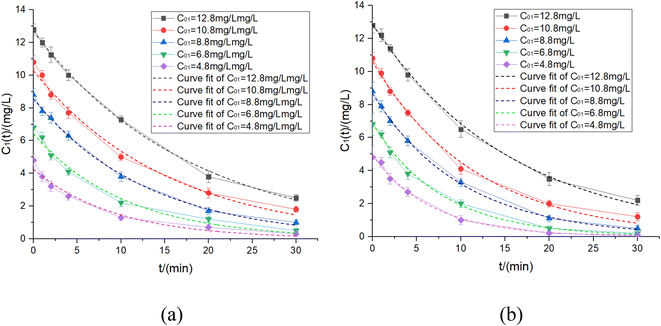 | ||
| Fig. 5 Experiment results of different initial residual chlorine concentrations at 6 W & 12 W UV power. (a) 6 W. (b) 12 W. | ||
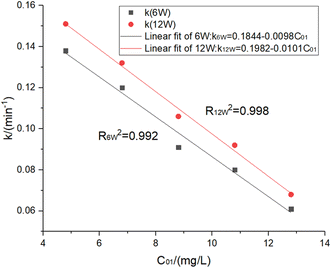 | ||
| Fig. 6 Fitting results of different initial residual chlorine concentrations at 6 W & 12 W UV power. | ||
| 6 W | 12 W | ||||
|---|---|---|---|---|---|
| C 0 | k | R 2 | C 0 | k | R 2 |
| 12.8 | 0.061 | 0.998 | 12.8 | 0.068 | 0.999 |
| 10.8 | 0.08 | 0.990 | 10.8 | 0.092 | 0.995 |
| 8.8 | 0.091 | 0.997 | 8.8 | 0.106 | 0.999 |
| 6.8 | 0.12 | 0.986 | 6.8 | 0.132 | 0.995 |
| 4.8 | 0.138 | 0.984 | 4.8 | 0.151 | 0.994 |
Therefore, the relationships between the residual chlorine decay coefficient and initial residual chlorine concentration under UV irradiation were proposed by eqn (20) and (21):
| k6w = 0.1844 − 0.0098C01, R2 = 0.992 | (20) |
| k12w = 0.1982 − 0.0101C01, R2 = 0.998 | (21) |
By respectively substituting Ct = 0.3 mg L−1 and eqn (20) and (21) into the residual chlorine decay equation, the following eqn (22) and (23) were obtained as follows:
| 0.3 = C01−1e−(0.1844−0.0098C01−1)t1max, t1max = 30 min, P = 6 W | (22) |
| 0.3 = C01−2e−(0.1982−0.0101C01−2)t1max, t1max = 30 min, P = 12 W | (23) |
In conclusion, the following two process parameters met the specifications:
(1) When the UV power was 6 W, the minimum NaClO of 7.75 mg-Cl2 per L met the specifications, and the calculated UV dose was 50.1 mJ cm−2.
(2) When the UV power was 12 W, the minimum NaClO of 8.56 mg-Cl2 per L met the specifications, and the calculated UV dose was 100.2 mJ cm−2.
The optimal parameter was clearly scheme 1. It was measured that the process parameters mentioned above decreased the E. coli inactivation rate to 7.0 and reduced the coliform value below 3 CFU L−1.32 Simultaneously, all detection indices during UV disinfection, such as the initial residual chlorine (7.5 mg L−1), UV intensity (5.7–10 mW cm−2), and ammonia nitrogen (1.5 mg L−1), were much lower than the national standard value especially since the ammonia nitrogen concentration in this study was much lower than previous studies.33 Therefore, the content of treated water disinfection by-products, including THMs (trihalomethanes) and HAAs (haloacetic acids), was safe. In addition, according to the disinfection by-products mentioned, the UV/Cl2 process pipe network decay stage was generally monotonous and decreasing, further ensuring the safety of water quality.18 More importantly, In scheme 1, the UV dose was 50.1 mJ cm−2 < 80 mJ cm−2, thus reducing power consumption. Although the residual chlorine concentration was 7.75 mg L−1 > 3 mg L−1, less UV dose allowed more residual chlorine to disinfect. So this parameter was considered positive in improving UV utilization.21
4.3 Inorganic nitrogen ([NO2−])
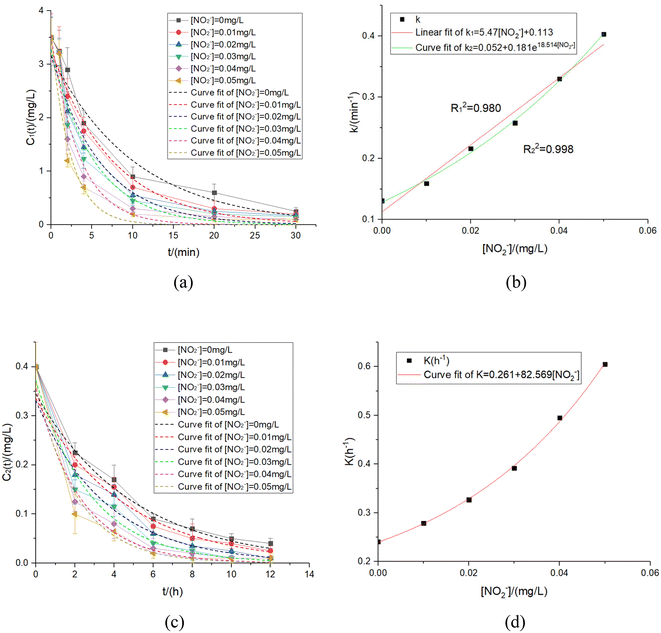
According to the experiment conditions above, the experiment results were fitted to obtain the relationship between k & K and [NO2−].The images and experimental data were shown in Fig. 7 and Table 5.
| k (min−1) | [NO2−]/(mg L−1) | R 2 | k = f([NO2−]) | K (h−1) | [NO2−]/(mg L−1) | R 2 | K = f([NO2−]) |
|---|---|---|---|---|---|---|---|
| 0.131 | 0 | 0.987 | k 1 = 5.47[NO2−] + 0.113 | 0.241 | 0 | 0.993 | K = 0.261 + 82.569[NO2−]1.828 |
| 0.159 | 0.01 | 0.989 | R 1 2 = 0.980 | 0.279 | 0.01 | 0.989 | R 2 = 0.999 |
| 0.216 | 0.02 | 0.984 | k 2 = 0.18e[NO2−] + 0.052 | 0.327 | 0.02 | 0.984 | |
| 0.258 | 0.03 | 0.975 | R 2 2 = 0.998 | 0.392 | 0.03 | 0.985 | |
| 0.33 | 0.04 | 0.965 | 0.495 | 0.04 | 0.985 | ||
| 0.403 | 0.05 | 0.946 | 0.605 | 0.05 | 0.987 |
There were two fitting results as follows (eqn (24) and (25)) in the UV disinfection stage:
| k′ = 5.47[NO2−] + 0.113 | (24) |
| k′′ = 0.181e18.514[NO2−] + 0.052 | (25) |
| K = 0.261 + 82.569[NO2]1.828 | (26) |
The kinetic model was established as shown in eqn (27):
 | (27) |
In the case of the blank experiments,
| (NO2−) = 0 | (28) |
| kNH2Cl = kx1[X] | (29) |
| kNO2− = kx2[NO2−] | (30) |
According to kNH2Cl = 0.131 min−1, therefore:
| kNO2− = k − kNH2Cl = 5.74[NO2−] − 0.018 | (31) |
Similarly
| K = KNH2Cl + KNO2− | (32) |
| KNO2− = K − KNH2Cl = 0.02 + 82.569[NO2]1.828 | (33) |
4.4 Ammonia nitrogen
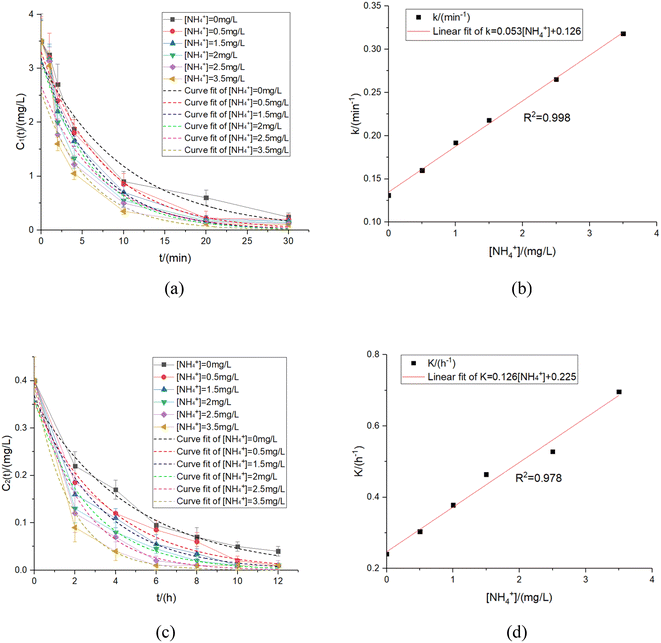
The ammonia nitrogen existed as ammonium ions and free ammonia in water, and there was a chemical balance relationship between them. The pH at equilibrium was found to be 9.25. When the pH was below 9.25, the reaction was spontaneously directed in the direction of NH4+ generation process.29,36,37 Additionally, the ammonia nitrogen in the water also formed chloramine with HClO, and NO˙ free radicals were also generated to participate in the reaction under ultraviolet irradiation, which also affected the residual chlorine decay rate. In contrast, NO2− also reacted with chloramine and NO˙ radicals, thus, using only NO2− to indirectly study the ammonia effects, nitrogen was no longer precise. Therefore, [NH4+] was used as the dominant ammonia nitrogen condition for a more comprehensive study.In spite of experimental conditions, the residual chlorine decay experimental results and fitting curves in the UV disinfection stage and pipe network decay stage were obtained, and the relationships between k & K and [NH4+] were further fitted to obtain the results shown in Fig. 8 and Table 6.
| k/(min−1) | NH4+/(mg L−1) | R 2 | k = f([NH4+]) | K/(h−1) | NH4+/(mg L−1) | R 2 | K = f([NH4+]) |
|---|---|---|---|---|---|---|---|
| 0.131 | 0 | 0.987 | k = 0.053[NH4+] + 0.126 | 0.241 | 0 | 0.993 | K = 0.126[NH4+] + 0.225 |
| 0.160 | 0.5 | 0.993 | R 2 = 0.998 | 0.304 | 0.5 | 0.985 | R 2 = 0.978 |
| 0.192 | 1 | 0.988 | 0.378 | 1 | 0.991 | ||
| 0.218 | 1.5 | 0.984 | 0.464 | 1.5 | 0.990 | ||
| 0.265 | 2.5 | 0.979 | 0.528 | 2.5 | 0.992 | ||
| 0.318 | 3.5 | 0.974 | 0.696 | 3.5 | 0.995 |
The linear function satisfied the accuracy requirement. The two stages' equations obtained from the fitting were shown as eqn (34) and (35):
| k = 0.053[NH4+] + 0.126 | (34) |
| K = 0.126[NH4+] + 0.225 | (35) |
Similar to section 4.3, ammonia nitrogen was replaced by chlorine to produce NH2Cl, which had a weak ability for disinfection. Inadequate disinfection capacity meant less HClO produced, causing various degrees of reduced residual chlorine concentrations.
In addition, in the UV disinfection stage, chloramine and ammonia nitrogen produced NO˙ radicals under UV irradiation. These radicals weakened the disinfectants' degradation ability and were easily oxidized, making it more difficult to compete with residual chlorine and further increasing the residual chlorine decay rate.34 Therefore, the residual chlorine decay coefficients, k & K, fitted in this experimental step, included the residual chlorine decay decreasing value contributed by the reaction between organic matter and chloramine. Hence, the residual chlorine decays coefficient caused by the reaction between NH2Cl and organics should be subtracted, similar to eqn (31) and (32), the relationship between the residual chlorine decay coefficient and [NH4+] was expressed by eqn (36) and (37), i.e.:
| kNH4+ = k − kNH2Cl = 0.053[NH4+] − 0.005 | (36) |
| KNH4+ = K − KNH2Cl = 0.126[NH4+] − 0.016 | (37) |
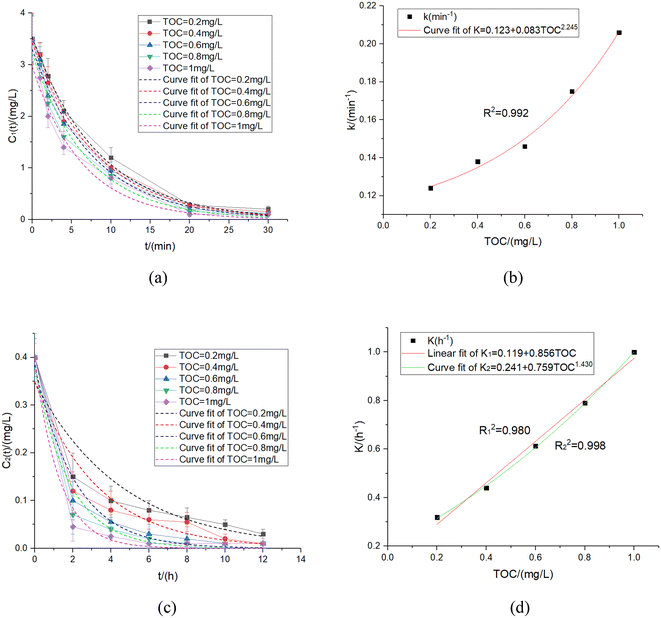
4.5 TOC
Organic matter in water is one of the most important factors affecting residual chlorine decay in the UV disinfection and pipe network decay stages. The residual chlorine decay experimental data and the relationships between k & K and TOC under the specified experimental conditions were measured and fitted. The results were shown in Fig. 9 and Table 7.| k (min−1) | TOC/(mg L−1) | R 2 | k = f(TOC) | K (h−1) | TOC/(mg L−1) | R 2 | K = f(TOC) |
|---|---|---|---|---|---|---|---|
| 0.124 | 0.2 | 0.997 | k = 0.123 + 0.083TOC2.245 | 0.319 | 0.2 | 0.937 | K 1 = 0.119 + 0.856TOC |
| 0.138 | 0.4 | 0.997 | R 2 = 0.992 | 0.440 | 0.4 | 0.956 | R 1 2 = 0.980 |
| 0.146 | 0.6 | 0.995 | 0.613 | 0.6 | 0.988 | K 2 = 0.241 + 0.759TOC1.430 | |
| 0.175 | 0.8 | 0.989 | 0.790 | 0.8 | 0.990 | R 1 2 = 0.998 | |
| 0.206 | 1 | 0.982 | 1 | 1 | 0.996 |
Therefore, the residual chlorine decay correction coefficient obtained in the two stages was shown as eqn (38)–(40):
| k = 0.123 + 0.083TOC2.245 | (38) |
| K′ = 0.856TOC + 0.119 | (39) |
| K′′ = 0.241 + 0.759TOC1.430 | (40) |
Since the TOC concentration in the water was low in most cases, the decay rule could be expressed by the expression above. However, if the sudden water pollution led to high TOC in the water, especially with TOC concentration increasing to more than 1 mg L−1, the residual chlorine decay coefficient's upper appreciation would decline, and even the slope would decline by nearly 20 times.11 In addition, the high TOC produced many disinfection by-products, which would become a major hidden danger affecting human health. Therefore, plenty of research is still required during the safety evaluations of disinfection by-products produced by high TOC.
5. Model establishment by the RSM
According to the residual chlorine decay model's basic form, the residual chlorine decay correction coefficients for the three factors, C0, pH and temperature (T), were connected by multiplier numbers, and there was an apparent mutual correlation between each factor. Therefore, C0, pH and T were selected for the RSM experimental design to determine the interactive relationship between the three factors and the bulk residual chlorine decay coefficient.For the UV disinfection and pipe network decay stages, the experimental design was performed by the Box–Behnken surface response design using DesignExpert software.12 The 3 factors' interaction test was designed, taking three levels for each factor. Because the number of factors was 3, 12 + 3 = 15 trials were performed to obtain the RSM image and fitting results which would be directly substituted as correction coefficients. Then the additional decay model by UV was to be further derived.38
5.1 The correction coefficients by the interaction of C01, pH and T
| Experiment data | ||||||
|---|---|---|---|---|---|---|
| Std | Run | C 01 | pH | T/°C | k | Predicted value |
| 2 | 1 | 4.5 | 6.5 | 32.5 | 0.348 | 0.3516 |
| 7 | 2 | 2.5 | 7.5 | 45 | 0.662 | 0.6705 |
| 14 | 3 | 3.5 | 7.5 | 32.5 | 0.226 | 0.226 |
| 8 | 4 | 4.5 | 7.5 | 45 | 0.508 | 0.4988 |
| 12 | 5 | 3.5 | 8.5 | 45 | 0.452 | 0.4471 |
| 4 | 6 | 4.5 | 8.5 | 32.5 | 0.162 | 0.1761 |
| 10 | 7 | 3.5 | 8.5 | 20 | 0.068 | 0.0624 |
| 6 | 8 | 4.5 | 7.5 | 20 | 0.112 | 0.1035 |
| 5 | 9 | 2.5 | 7.5 | 20 | 0.187 | 0.1963 |
| 1 | 10 | 2.5 | 6.5 | 32.5 | 0.559 | 0.5449 |
| 15 | 11 | 3.5 | 7.5 | 32.5 | 0.226 | 0.226 |
| 3 | 12 | 2.5 | 8.5 | 32.5 | 0.251 | 0.2474 |
| 9 | 13 | 3.5 | 6.5 | 20 | 0.244 | 0.2489 |
| 13 | 14 | 3.5 | 7.5 | 32.5 | 0.226 | 0.226 |
| 11 | 15 | 3.5 | 6.5 | 45 | 0.728 | 0.7336 |
The correction coefficient expression was obtained by fitting the data above as follows (eqn (41)):
| k = 5.2238 − 0.5874C01 − 0.983125pH − 0.000404T + 0.0305C01 × pH − 0.00158C01 × T − 0.002pH × T + 0.049125C012 + 0.054875pH2 + 0.00059T2, AdjR2 = 0.996, PreR2 = 0.977 | (41) |
The ANOVA (analysis of variance) table is shown in Table 9.
| Source | Sum of squares | df | Mean square | F-Value | p-Value | |
|---|---|---|---|---|---|---|
| Model | 0.578 | 9 | 0.0642 | 377.02 | <0.0001 | Significant |
| A–C01 | 0.035 | 1 | 0.035 | 205.34 | <0.0001 | |
| B–pH | 0.1119 | 1 | 0.1119 | 656.67 | <0.0001 | |
| C–T | 0.378 | 1 | 0.378 | 2219.05 | <0.0001 | |
| AB | 0.0037 | 1 | 0.0037 | 21.84 | 0.0055 | |
| AC | 0.0016 | 1 | 0.0016 | 9.16 | 0.0292 | |
| BC | 0.0025 | 1 | 0.0025 | 14.68 | 0.0122 | |
| A2 | 0.0089 | 1 | 0.0089 | 52.31 | 0.0008 | |
| B2 | 0.0111 | 1 | 0.0111 | 65.27 | 0.0005 | |
| C2 | 0.0313 | 1 | 0.0313 | 183.95 | <0.0001 | |
| Residual | 0.0009 | 5 | 0.0002 | |||
| Lack of fit | 0.0009 | 3 | 0.0003 | |||
| Pure error | 0 | 2 | 0 | |||
| Cor total | 0.5789 | 14 |
According to the ANOVA, the imputed item was not significant. Moreover, AdjR2 = 0.996 and PreR2 = 0.977, so the model fits well and could be used to analyze and predict the residual chlorine concentration.
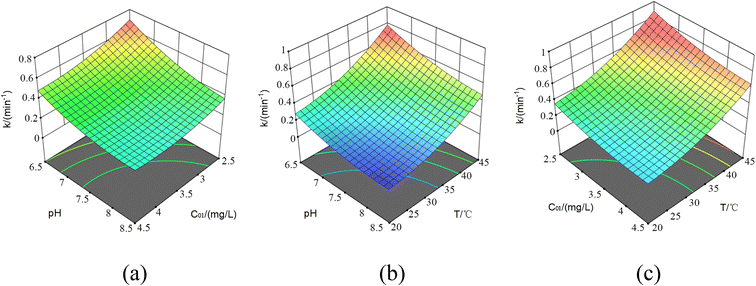
Next, the response surfaces under the effect of T, pH, and C01 are plotted in Fig. 10, respectively.
Observing the response surface, it was concluded that all pairwise factor interactions were relatively significant, and the contour distribution was dense and uniform. It was also found that the influence of pH and T on the surface was relatively curly, showing that the effect of pH and T on the residual chlorine decay was nonlinear; the increase of T greatly improved the degradation rate at different C01 and pH values as well, which needs to be noted in practical application. The present results also supported the previous experiments' findings.12 At the same time, the increasing pH hindered the residual chlorine decay process caused by the temperature increase and reduced the declining decay rate value caused by the C01 increase. The reason was that when the C01 and even pH increase led to faster decomposition, plenty of residual chlorine was retained to ensure normal disinfection and degradation capacity. Moreover, free radicals were produced in the UV disinfection stage, and a large number of OH˙ free radicals produced under alkaline conditions shared the pollutant degradation pressure with residual chlorine, so the residual chlorine decay rate was also slowed down.39 Additionally, the increase of C01 significantly reduced the negative impact of temperature on the residual chlorine decay. Hence, in the high-water temperature area, the chlorine addition amount should be appropriately increased according to the model prediction results to ensure the appropriate residual chlorine concentration at the end of the water distribution network, especially since the decay rate is significantly faster in the UV/Cl2 process.40
| Experiment data | ||||||
|---|---|---|---|---|---|---|
| Std | Run | C 02 | pH | T/°C | K | Predicted value |
| 3 | 1 | 0.2 | 8.5 | 32.5 | 0.204 | 0.1891 |
| 10 | 2 | 0.4 | 8.5 | 20 | 0.135 | 0.146 |
| 14 | 3 | 0.4 | 7.5 | 32.5 | 0.205 | 0.203 |
| 4 | 4 | 0.6 | 8.5 | 32.5 | 0.149 | 0.1446 |
| 6 | 5 | 0.6 | 7.5 | 20 | 0.163 | 0.1564 |
| 11 | 6 | 0.4 | 6.5 | 45 | 0.678 | 0.667 |
| 15 | 7 | 0.4 | 7.5 | 32.5 | 0.202 | 0.203 |
| 13 | 8 | 0.4 | 7.5 | 32.5 | 0.202 | 0.203 |
| 12 | 9 | 0.4 | 8.5 | 45 | 0.525 | 0.5333 |
| 5 | 10 | 0.2 | 7.5 | 20 | 0.278 | 0.2819 |
| 8 | 11 | 0.6 | 7.5 | 45 | 0.472 | 0.4681 |
| 7 | 12 | 0.2 | 7.5 | 45 | 0.703 | 0.7096 |
| 9 | 13 | 0.4 | 6.5 | 20 | 0.323 | 0.3148 |
| 1 | 14 | 0.2 | 6.5 | 32.5 | 0.475 | 0.4794 |
| 2 | 15 | 0.6 | 6.5 | 32.5 | 0.142 | 0.1569 |
From the data, the correction coefficient expression was obtained as follows (eqn (42)):
| K = 5.224 − 0.5874C02 − 0.9831pH − 0.0004T + 0.0305C02 × pH − 0.002C02 × T − 0.002pH × T + 0.0491C022 + 0.0549pH2 + 0.0006T2, AdjR2 = 0.995, PreR2 = 0.971 | (42) |
| Source | Sum of squares | df | Mean square | F-Value | p-Value | |
|---|---|---|---|---|---|---|
| Model | 0.5389 | 9 | 0.0599 | 304.65 | <0.0001 | Significant |
| AC02 | 0.0673 | 1 | 0.0673 | 342.63 | <0.0001 | |
| BpH | 0.0458 | 1 | 0.0458 | 232.78 | <0.0001 | |
| C–T | 0.2734 | 1 | 0.2734 | 1391.15 | <0.0001 | |
| AB | 0.0193 | 1 | 0.0193 | 98.3 | 0.0002 | |
| AC | 0.0034 | 1 | 0.0034 | 17.12 | 0.009 | |
| BC | 0.0003 | 1 | 0.0003 | 1.56 | 0.2672 | |
| A2 | 0.0007 | 1 | 0.0007 | 3.75 | 0.1106 | |
| B2 | 0.0024 | 1 | 0.0024 | 12.1 | 0.0177 | |
| C2 | 0.1289 | 1 | 0.1289 | 656.04 | <0.0001 | |
| Residual | 0.001 | 5 | 0.0002 | |||
| Lack of fit | 0.001 | 3 | 0.0003 | 108.53 | 0.0091 | Significant |
| Pure error | 6.00 × 10⁻⁶ | 2 | 3.00 × 10⁻⁶ | |||
| Cor total | 0.5399 | 14 |
According to the ANOVA, the imputed item wasn't significant. Moreover, because AdjR2 = 0.995 and PreR2 = 0.971, the model fits well and could be used to analyze and predict the residual chlorine decay. The misfit term was 0.0091 < 0.01, which had good significance and could be used as the residual chlorine decay model correction coefficient.
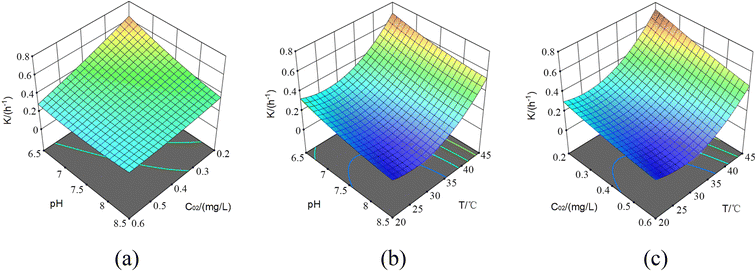
Next, the response surfaces under the effect of T, pH, and C02 were plotted, respectively, as shown in Fig. 11.
By observation, a similar trend to the UV disinfection stage was obtained. Firstly, the increasing C02 offsets the pH effect on residual chlorine decay, but without the OH˙ radical assistance, the response surface eased a lot. As the pH decreased, the decline of C02 also enhanced the residual chlorine decay coefficient. Secondly, as T increased, the pH effect on the residual chlorine decay decreased, and the K increase was not apparent in the UV disinfection stage. Similarly, when the pH and C02 decreased, the improved K value was limited to some extent. Finally, the temperature still weakened different C02 decay.
Notably, in the pipe network decay stage, when C02 was higher (4–4.5 mg L−1) and T was lower (20–25 °C), the curve appeared that the residual chlorine decay coefficient increased with pH. But it did not occur during the UV disinfection stage. The reason may be that in the UV disinfection stage, the pollutants in the water have been oxidized by free radicals into substances more likely to react with the residual chlorine, accelerating the residual chlorine decay rate;41 as C02 increased, the reaction rate accelerated, partly offsetting the effect of the decreasing residual chlorine decay rate caused by increasing pH. This revealed a greater risk of secondary contamination from the disinfection by-products generated in the UV/Cl2 process. Additionally, economic and safety concerns also arose at low temperatures, high initial residual chlorine concentration, and high pH, which were also worth further exploration.
5.2 Correction coefficient superposition of [NO2−], [NH4+], and TOC
In the previously established model, it was found that the correction coefficients of the three factors, inorganic nitrogen, ammonia nitrogen and organic matter, were connected with plus signs.Adding the self-decomposition rate together:
| kself = Kself = 0.0013 h−1 = 0.078 min−1 |
| kbulk = kself + kTOC + kNO2− + kNH4+ |
| Kbulk = Kself + KTOC + KNO2− + KNH4+ |
| kbulk = 0.078 + 0.113 + 5.47[NO2−] + 0.053[NH4+] + 0.126 + 0.123 + 0.083TOC2.245 | (43) |
| Kbulk = 0.013 + 0.02 + 82.569[NO2−]1.828 + 0.126[NH4+] − 0.016 + 0.241 + 0.759TOC1.430 | (44) |
5.3 The model's experiment results
The experimental fitting results above were added to eqn (10) and (14) from section 2, and then the final residual chlorine decay correction coefficient model was obtained:1) In the UV disinfection stage:
| k = (5.2238 − 0.5874C01 − 0.9831pH − 0.000404T + 0.0305C01 × pH − 0.00158C01 × T − 0.002pH × T + 0.049125C012 + 0.054875pH2 + 0.00059T2)[0.078 + 0.113 + 5.47[NO2−]1.828 + 0.053[NH4]+ + 0.126 + 0.123 + 0.083TOC2.245 + 0.034F − 0.06] | (45) |
| K = (5.224 − 0.587C02 − 0.983pH − 0.0004T + 0.031C02 × pH − 0.002C02 × T − 0.002pH × T + 0.049C022 + 0.055pH2 + 0.0006T2)[0.0013 + 0.02 + 82.569[NO2−]1.828 + 0.126[NH4+] − 0.016 + 0.241 + 0.759TOC1.430] | (46) |
 | (47) |
1) In the UV disinfection stage:
| Ct = C01 × (e−kbulkt − e−kt), t ≤ t1max | (48) |
| Ct = C01e−kbulkt − C02e−K(t−t1max), t ≥ t1max | (49) |
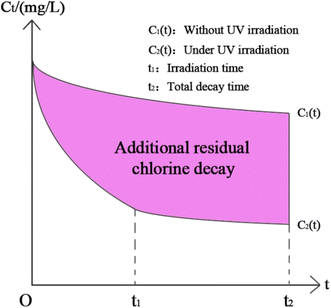 | ||
| Fig. 12 The function graph of the additional decay effect of UV irradiation on the residual chlorine. | ||
Based on the model above, Ct = 0.05 mg L−1, C0 = 0.3 mg L−1 and the treated water index measured in Table 2 was brought into the residual chlorine decay model, and the longest HRT was obtained to be 5.12 h.
6. Model operation and validation
6.1 Calibration model establishment
In general, the residual chlorine reaction rate constant with wall attachments was recorded as kw, and the transmission rate constant between substances was recorded as kf. A lot of experimental data were used to summarize the standard of three rate constants: kb was 0.03/h, kw was 10−6 m s−1 and kf was 10−7 m s−1.42Eqn (45) and (46) were used as the bulk decay coefficient kb & Kb expression.43Since the wall residual chlorine decay didn't involve UV irradiation, the wall residual chlorine decay coefficient Kwall was expressed as eqn (50):44
Kwall = 133.2962 × e1.805![[thin space (1/6-em)]](https://www.rsc.org/images/entities/char_2009.gif) log log![[thin space (1/6-em)]](https://www.rsc.org/images/entities/char_2009.gif) Re × Ct10.24531 × pH−4.89502 × k0 Re × Ct10.24531 × pH−4.89502 × k0 | (50) |
The pump water from S city's booster pump station was selected as the water quality monitoring point. The measured water quality data are shown in Table 12.
| Seasons | UV dose/(mJ cm−2) | Average T/°C | Average TOC/(mg L−1) | Average pH | Average [NH4+]/(mg L−1) | Average [NO2−]/(mg L−1) | Residual chlorine pumped out/(mg L−1) | Bulk residual chlorine decay coefficient/h−1 |
|---|---|---|---|---|---|---|---|---|
| Spring & winter | 50.1 | 13 | 0.05 | 7.7 | 0.025 | 0.025 | 0.5 | 0.003 |
| Summer & autumn | 50.1 | 22 | 0.07 | 7.3 | 0.028 | 0.027 | 0.55 | 0.009 |
Moreover, kw was mainly limited by the biofilm attached to the pipe wall, and the biofilm formation was related to the pipe's material and age. Therefore, the initial kw value was set according to the different kinds of pipe materials and age, and then the water quality model was corrected by comparing the simulated value with the measured value in the later period to meet the water quality model's accuracy requirements. The author also sorted out the wall initial residual chlorine decay coefficient from the different types of pipe walls. The detailed data are shown in Table 13:
| Types | The wall initial residual chlorine decay coefficient/(m d−1) |
|---|---|
| DN200 ductile iron pipe | 0.024 |
| DN300 ductile iron pipe | 0.022 |
| DN350 ductile iron pipe | 0.021 |
| DN400 ductile iron pipe | 0.020 |
The water quality model calibration's purpose was to adjust the error as low as possible to ensure high model accuracy. It required solving the reaction coefficients to construct the following objective functions as eqn (51):
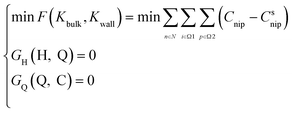 | (51) |
Python IDE available in Chinese Python Net (https://www.cnpython.com/pypi/epanet2/) was used to enter the restriction parameter conditions and solve the function. Then the residual chlorine decay coefficient was fed into the water quality model, and the residual chlorine was calculated and analyzed.
It was proposed that the residual chlorine model's calibration accuracy (δ) was less than 50% as the calibration standard value, which was defined as eqn (52):
 | (52) |
Meanwhile, combined with the minimum sum of square calibration function (min f(C)), which was as follows (eqn (53)):
 | (53) |
The following accuracy function of the minimum sum of square calibration (min δ(C)) was derived as eqn (54):
 | (54) |
6.2 Simulation and calibration results
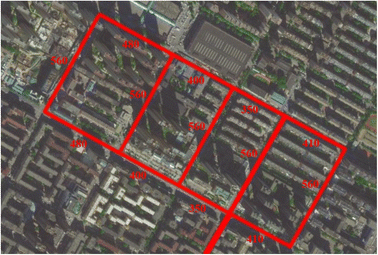
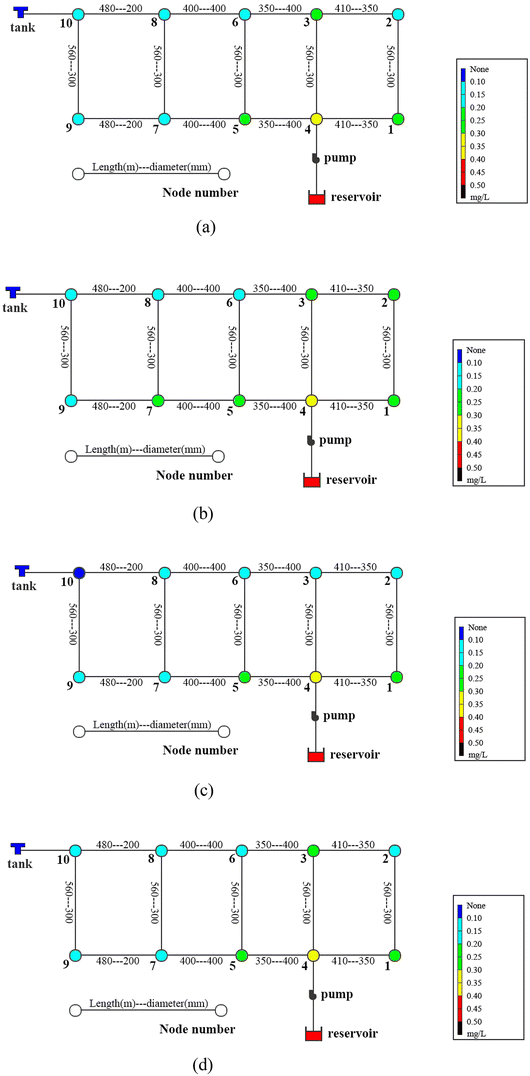
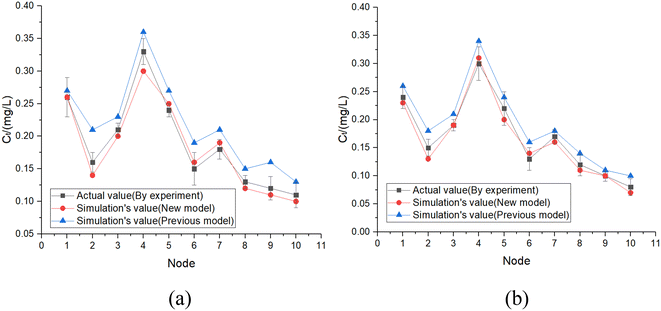
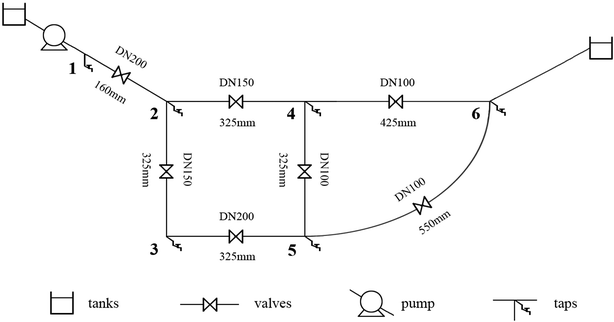
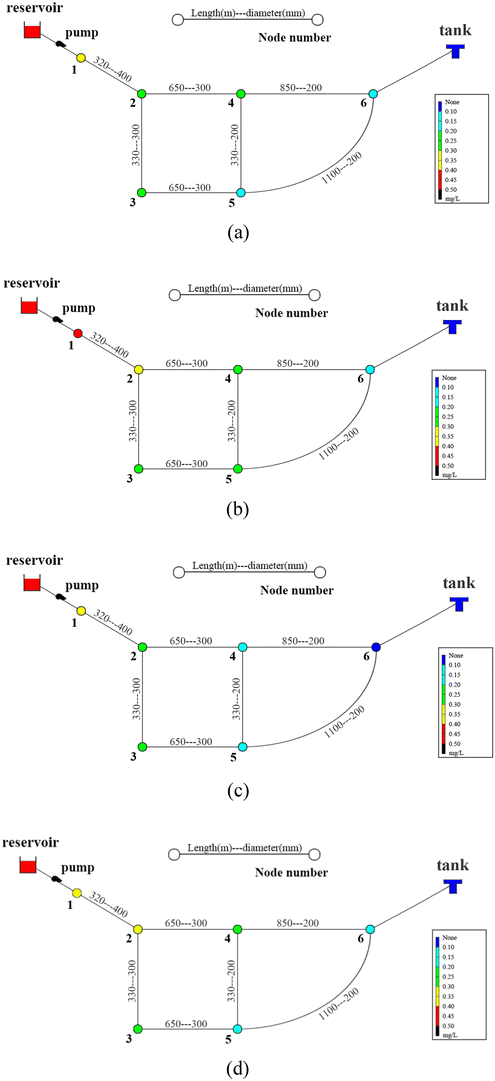
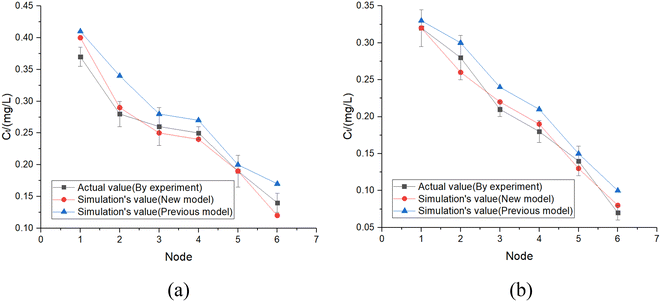
The pipes were made of ductile iron, the same as case 1. After setting the water quality conditions shown in Tables S12 and S13,† the water distribution network in this area was modelled using EPANET 2.0 as well. According to the parameters in section 6.1, the residual chlorine concentrations in winter & spring and summer & autumn were simulated. The field measured experimental values and the previous model's simulation values were compared with the new model's simulation values in section 6.1, which are shown in Fig. 17 and 18.
6.3 Simulation conclusion
Based on the comprehensive analysis and comparison results of the two cases above, the conclusions were as follows:(1) The new model's calibration function reached δ1win(C) = 0.18, δ1sum(C) = 0.16, δ2win(C) = 0.16 and δ2sum(C) = 0.14 in the summer & autumn and spring & winter, respectively, which were less than the minimum value of the previous model equivalent to 0.33 and the standard value equivalent to 0.25. So, the water quality model's accuracy met the requirements.
(2) Because the direct and secondary effects of UV on residual chlorine decay were not considered and TOC was high in summer & autumn, the disinfection by-products further accelerated the residual chlorine decay, causing the old model's data to be too large. When using the UV/Cl2 process, the new model's prediction results confirmed that the residual chlorine concentration was less than 0.1 mg L−1 at the distal end of the water distribution network in summer & autumn, so secondary chlorination measures should be taken in certain seasons.
(3) The new model's accuracy was greater in summer & autumn than in spring & winter. The reason was that the organic matter, as well as the temperature, was low in spring & winter, hence, decreasing the reaction rate. Ice in some regions led to uneven concentration distributions and reaction rate differences. In addition, the actual water consumption in the region was small in winter & spring, and the model experiment of water consumption distribution equilibrium was different from the actual working conditions, but each point's error between the simulated values and measured experimental values could be controlled within 0.25.
(4) Case 1 was an actual water distribution network with a large scale but with a larger error, while case 2 was a virtual water distribution network with a small scale and a smaller error. Therefore, in addition to the water distribution network's scale that might affect the prediction accuracy, laboratory studies with small errors might also deviate from the actual situation. In all, it is still necessary to promote and apply the UV/Cl2 process to practical engineering and large-scale water distribution networks to acquire more accurate conclusions through further research.
7. Final conclusion
Through the residual chlorine decay model establishment above under the UV/Cl2 process, the conclusions were as follows:1. Through analysing the UV/Cl2 process's reaction mechanism, an improved VRC-3R− model of residual chlorine decay was constructed. In theoretical derivation, the three correction coefficients T, C0, and pH were multiplied, and five correction coefficients F, [NO2−], [NH4+], TOC and self-decomposing were added.
2. The residual chlorine decay model applying the UV factor was successfully constructed by fitting the experimental data. In addition, a segment function of the additional decay effect of ultraviolet light on the residual chlorine was derived.
3. A 6 W UV lamp with at least 7.75 mg-Cl2 per L NaClO met the specification of 30 min contact time to keep the treated water's residual chlorine concentration more than 0.03 mg L−1; after calculation, the UV dose was 50.1 mJ cm−2; the longest HRT under the conditions above was 5.12 h entering the pipe network. The disinfection by-products met the safety specifications as well.
4. Through the RSM, the functions among the k & K, T, pH and C01 & C02 were fitted in two stages with R2 > 0.97, all of which met the accuracy requirements.
5. The new model's calibration function reached δ1win(C) = 0.18, δ1sum(C) = 0.16, δ2win(C) = 0.16 and δ2sum(C) = 0.14 in summer & autumn and spring & winter, respectively, which were less than the previous and standard values. This predicted that the residual chlorine concentration at the distal end of the water distribution network was less than 0.1 mg L−1, revealing the necessity for secondary chlorination.
6. The network's scale and laboratory environment might affect the simulation prediction's accuracy, which required further experiments and numerical simulations in different regions & water quality and extensive networks to reveal more practical conclusions. The Dahuofang reservoir's water quality in northeast China, as the subject of research, provided a technical basis for the operation and design of the water distribution network in the area.
Author contributions
In this research work, Haipei Wang was involved in the conceptualization, methodology, software, formal analysis, and validation under the joint supervision of Bing Wang and John C. Crittenden; Haifeng Pan and Lixin Wang wrote and translated the paper, respectively. All authors approved the paper's final version.Conflicts of interest
There are no conflicts to declare.Acknowledgements
This study was supported by the Liaoning Provincial Department of Education (No. lnqn202011).References
- W. Wang, Study on the effect of organic micropollutants in water by UV/free chlorine, MA thesis, Shenyang Jianzhu University, 2020 Search PubMed.
- D. Wang, E. Li, G. Li, J. Liang and Z. Zhao, Research progress on UV/chlorine combined disinfection process for drinking water, Jingshui Jishu, 2020, 39(10), 94–101 Search PubMed.
- B. Wang, Q. Zhang, Y. Fu, Z. Ran, J. C. Crittenden, W. Zhang and H. Wang, Degradation of trimethoprim using the UV/free chlorine process: influencing factors and optimal operating conditions, Water, 2021, 13, 1656–1669 CrossRef CAS.
- F. Tang, W. Lu and X. Zhang, Progress in residual chlorine decay in water stage of water distribution network, China Society of Civil Engineering& China Federation of Industrial Economy, 2005, pp. 529–538 Search PubMed.
- A. Jadas-HeAcart, L. Kiene and O. Wable, The chorline demand of treated water, Water Res., 1992, 26, 1073–1084 CrossRef.
- W. Wu, H. Zhao and L. Li, Research on the water quality model of the water distribution network, China Urban Water Supply, 1998, 04, 6–11 Search PubMed.
- H. Zhao and X. Yan, Theory and analysis of water distribution network System, China Construction Industry Publishing Society, 2003 Search PubMed.
- D. Zhong, Study on residual chlorine decay model and influencing factors of water distribution network, PhD dissertation, Harbin Institution of Technology, 2010 Search PubMed.
- I. Fisher, G. Kastl and A. Sathasivan, New model of chlorine-wall reaction for simulating chlorine concentration in drinking water distribution systems, Water Res., 2017, 125, 427–437 CrossRef CAS PubMed.
- P. Hua, E. Vasyukoua and W. Uhl, A variable reaction rate model for chlorine decay in drinking water due to the reaction with dissolved organic matter, Water Res., 2015, 75, 109–122 CrossRef CAS PubMed.
- L. Qi, Establishment and application of water quality model based on residual chlorine decay, MA thesis, Harbin University of Technology, 2016 Search PubMed.
- H. Zhang, Y. Yang, X. Li, Y. Liu and L. Zhao, Study on the residual chlorine decay law of the transfer and water supply system in high-rise buildings, Water supply and drainage, 2018, 44(1), 115–121 CrossRef.
- X. Jiang, Study on residual chlorine decay's AVRC model based on quality safety of water distribution network, PhD dissertation, Harbin Institution of Technology, 2018 Search PubMed.
- Y. Wang, Construction and application of residual chlorine decay model of T city's water distribution network based on hydraulic model, MA thesis, Shenyang Jianzhu University, 2015 Search PubMed.
- R. Tonev and G. Dimova, Investigation of chlorine wall decay in an old, decommissioned metallic pipe using a pipe section reactor, Water Sci. Technol.: Water Supply, 2020, 20(2), 123–133 Search PubMed.
- L. Zhang, W. Liu and W. Zhang, UV disinfection used for building's tank to control the water quality research, Building Water Supply and Drainage Professional Committee of China Engineering Construction Standardization Association, Building Water Supply and Drainage Committee of Water Industry Branch of China Civil Engineering Society's 20 anniversary article collection, 2007, pp. 156–162.
- D. An, X. Huang and W. Gao, et al., Demonstration and application effect of ultraviolet disinfection in Shanghai residential area's secondary water supply, Water supply and drainage, 2016, S1, 141–144 Search PubMed.
- R. Bi, UV chlorine sequence disinfection technique controls the generation of carbon disinfection by-products in drinking water, MA thesis, Huaqiao University, 2020 Search PubMed.
- Y. H. Chuang, S. Chen, C. J. Chinn and W. A. Mitch, Comparing the UV/Monochloramine and UV/free chlorine advanced oxidation processes (AOPs) to the UV/H2O2 AOP under scenarios relevant to potable reuse, Environ. Sci. Technol., 2017, 51, 13859–13868 CAS.
- W. Lee, Y. Lee, S. Allard, V. R. Ji and Y. Lee, Mechanistic and kinetic understanding of the UV254 photolysis of chlorine and bromine species in water and formation of oxyhalides, Environ. Sci. Technol., 2020, 54, 11546–11555 CrossRef CAS PubMed.
- Y. Pang, J. Xi, H. Hu, Q. Wu, R. Lu and R. Jiang, Study on the Characteristics of UV/chlorine combined disinfection process in reclaimed water, China Environ. Sci., 2014, 6, 1429–1434 Search PubMed.
- N. Huang, T. Wang, W. Wang, Q. Wu, A. Li and H. Hu, UV/chlorine as an advanced oxidation process for the degradation of benzalkonium chloride: Synergistic effect, transformat- ion products and toxicity evaluation, Water Res., 2017, 114, 246–253 CrossRef CAS PubMed.
- X. Kong, Z. Wu, Z. Ren, K. Guo, S. Hou and Z. Hua, Degradation of lipid regulators by the UV/chlor- ine process: Radical mechanisms, chlorine oxide radical (ClO• )-mediated transforma- tion pathways and toxicity changes, Water Res., 2018, 137(15), 242–250 CrossRef CAS PubMed.
- N. M. Zholobak, A. B. Shcherbakov, A. S. Bogorad-Kobelska, O. S. Ivanova, A. Y. Baranchikov, N. Y. Spivak and V. K. Ivanov, Panthenol-stabilized cerium dioxide nanoparticles for cosmeceutic formulations against ROS-induced and UV-induced damage, J. Photochem. Photobiol., B, 2014, 130, 102–108 CrossRef CAS PubMed.
- I. Fisher, A. Sathasivan, G. Kastl and V. Jegatheesan, Suitability of chlorine bulk decay models for planning and management of water distribution systems, Crit. Rev. Environ. Sci. Technol., 2011, 41(2), 1843–1882 CrossRef CAS.
- Y. Xiang, J. Fang and C. Shang, Kinetics and Pathways of Ibuprofen Degradation by the UV/Chlorine Advanced Oxidation Process, Water Res., 2015, 90, 301–308 CrossRef PubMed.
- E. Lee, T. Yoon, M. Lee, S. H. Han and J. O. Ka, Inactivation of environmental mycobacteria by free chlorine and UV, Water Res., 2010, 44(5), 1329–1334 CrossRef CAS PubMed.
- W. Li, M. Li, Z. Qiang, J. Bolton, P. Chen and F. Zhang, The calibration of the UV irradiometer by KI/KIO3 chemical photometry, China Water Supply and Drainage Magazine Annual Conference & Drinking Water Safety and Water Environment Comprehensive Improvement Summit Forum, China Water Supply and Drainage, 2013, pp. 30–39.
- X. Zhang, Efficiency and mechanism of removing ammonia nitrogen and controlling DBPs by UV/chlorine combined process, PhD dissertation, Harbin Institution of Technology, 2018 Search PubMed.
- J. R. Bolton and K. G. Linden, Standardization of methods for fluence (UV dose) determination in bench-scale UV experiments, J. Environ. Eng., 2003, 129(3), 209–215 CrossRef CAS.
- Y. Wang, Y. Wu, Y. Du, Q. Li, Y. Cong, Z. Huo, Z. Chen, H. Yang, S. Liu and H. Hu, Quantifying chlorine-reactive substances to establish a chlorine decay model of reclaimed water using chemical chlorine demands, Chem. Eng. J., 2019, 356, 791–798 CrossRef CAS.
- Z. Zhang, Drinking water sanitation standards (GB5749-2022)’ s interpretation, Standardization of Engineering Construction, 2022, 5, 32–35 Search PubMed.
- L. Xia, Synchronous Control of Ammonia nitrogen and Disinfection by-products by UV / Chlorine Coupled Process, MA thesis, Harbin Institute of Technology, 2016 Search PubMed.
- Z. Gao, T. Zhang, P. Huang and B. Xu, Characteristics of removing ammonia nitrogen using UV/chlorine combinated process, J. Environ. Sci., 2019, 39(1), 3427–3433 CAS.
- W. Chu, N. Gao, S. W. Krasner, M. R. Templeton and D. Yin, Formation of halogenated C- and N-DBPs from chlor (am) ination and UV irradiation of tyrosine in drinking water, Environ. Pollut., 2015, 161, 8–14 CrossRef PubMed.
- S. Kanno, S. Ochiai and T. Tanabe, Hygienic-chemical Studies on Public Water (IV): Relation among Ammonia Nitrogen, Nitrite Nitrogen and Residual Chlorine, Japanese, J. Toxicol. Environ. Health, 1964, 10(1), 22–26 Search PubMed.
- M. S. Vohra, S. M. Selimuzzaman and M. S. Al-Suwaiyan, NH4+-NH3 removal from simulated wastewater using UV-TiO2 photocatalysis: effect of co-pollutants and pH, Environ. Technol., 2010, 31(6), 641–654 CrossRef CAS PubMed.
- Y. Li, Water treatment's experimental technology, China Construction Industry Publishing House, 2nd edn, 2004 Search PubMed.
- R. Xu, T. Wu, R. Suo and Y. Qian, Advanced oxidation techniques for the removal of norfloxacin in water based on different free radicals, Environmental Engineering Technical Journal, 2020, 010(003), 433–439 Search PubMed.
- C. Fan, Decay and sterilization rules of residual chlorine in domestic hot water, Jingshui Jishu, 2019, 038(007), 85–88 Search PubMed.
- W. Zhang, S. Zhou, Y. Wu, S. Zhu and J. C. Crittenden, Computerized pathway generator for the UV/free chlorine process: prediction of byproducts and reactions, Environ. Sci. Technol., 2021, 55(4), 2608–2617 CrossRef CAS PubMed.
- T. Deng, Optimization theory and computing method of chlorination mode in water distribution network, MA thesis, Harbin Institution of Technology, 2007 Search PubMed.
- Z. Zeng, J. Yu, S. Shen and H. Xu, Study on the variation law of bulk water turbidity in simulated water distribution network, Town Water Supply, 2014, 02, 68–70 Search PubMed.
- K. Wang, Effect of multi-stage disinfection on DBPs and biological stability of water quality in urban and rural water distribution network, MA thesis, Southeast University, 2020 Search PubMed.
- J. Ye, Simulation study on water quality of water distribution network, MA thesis, Chongqing University, 2016 Search PubMed.
- S. Shu, W. He, M. Zhao, J. Gao and Y. Yuan, Problems and countermeasures of water quality model verification of water distribution network, Proceedings of the Third International Symposium on China Urban Water Development, 2008, 95–99 Search PubMed.
Footnotes |
| † Electronic supplementary information (ESI) available. See DOI: https://doi.org/10.1039/d2ew00647b |
| ‡ First author. |
| This journal is © The Royal Society of Chemistry 2023 |

