Adsorption removal of Mn2+ and NH4+–N from electrolytic manganese metal wastewater by modified phosphate ore flotation tailings†
Received
2nd July 2022
, Accepted 6th October 2022
First published on 15th November 2022
Abstract
Electrolytic metal manganese wastewater (EMMW) is industrial wastewater produced in the process of producing electrolytic metal manganese, which contains Mn2+ and NH4+–N pollutants. How to deal with low concentrations of Mn2+ and NH4+–N from EMMW is an urgent problem for electrolytic manganese enterprises. In this study, Mn2+ and NH4+–N were removed via adsorption by modified phosphate ore flotation tailings (MPOFTs). The results indicated that the concentration of Mn2+ and NH4+–N in the EMMW decreased from 165 mg L−1 to 0.001 mg L−1 and from 70 mg L−1 to 1.73 mg L−1, respectively, when the solid–liquid ratio of MPOFTs to EMMW was 1![[thin space (1/6-em)]](https://www.rsc.org/images/entities/char_2009.gif) :
:![[thin space (1/6-em)]](https://www.rsc.org/images/entities/char_2009.gif) 200, the reaction temperature was 323 K, the reaction time was 2.5 h and the initial solution pH was 9.0. The adsorption process was more consistent with the pseudo-first-order adsorption kinetic model and Weber's intraparticle diffusion model, and the results showed that this adsorption reaction was an endothermic reaction. This study provided a new research idea for EMMW and POFT treatment and disposal.
200, the reaction temperature was 323 K, the reaction time was 2.5 h and the initial solution pH was 9.0. The adsorption process was more consistent with the pseudo-first-order adsorption kinetic model and Weber's intraparticle diffusion model, and the results showed that this adsorption reaction was an endothermic reaction. This study provided a new research idea for EMMW and POFT treatment and disposal.
Water impact
Electrolytic manganese metal wastewater (EMMW) contains a low concentration of Mn2+ and NH4+–N, which easily pollute the surrounding ecological environment. Phosphate ore flotation tailings (POFTs) are solid wastes that are produced by phosphate ore after flotation. In this study, Mn2+ and NH4+–N were removed via adsorption by modified phosphate ore flotation tailings (MPOFTs) with H2C2O4. The results indicated that the concentration of Mn2+ in the EMMW decreased from 165 mg L−1 to 0.001 mg L−1, and NH4+–N decreased from 70 mg L−1 to 1.73 mg L−1, when the solid–liquid ratio of MPOFTs to EMMW was 1![[thin space (1/6-em)]](https://www.rsc.org/images/entities/char_2009.gif) : :![[thin space (1/6-em)]](https://www.rsc.org/images/entities/char_2009.gif) 200, the reaction temperature was 323 K, the reaction time was 2.5 h and the initial solution pH was 9.0. The adsorption process was more consistent with the pseudo-first-order adsorption kinetic model and Weber's intraparticle diffusion model, and the results showed that this adsorption reaction was an endothermic reaction. NH4+–N was removed mainly by struvite (MgNH4PO4·6H2O), and Mn2+ was removed mainly by Mn(OH)2, Mn3O4, Mn3(PO4)2·7H2O and Mn(OH)2. This study provided a new research idea for EMMW and POFT treatment and disposal. 200, the reaction temperature was 323 K, the reaction time was 2.5 h and the initial solution pH was 9.0. The adsorption process was more consistent with the pseudo-first-order adsorption kinetic model and Weber's intraparticle diffusion model, and the results showed that this adsorption reaction was an endothermic reaction. NH4+–N was removed mainly by struvite (MgNH4PO4·6H2O), and Mn2+ was removed mainly by Mn(OH)2, Mn3O4, Mn3(PO4)2·7H2O and Mn(OH)2. This study provided a new research idea for EMMW and POFT treatment and disposal.
|
1 Introduction
Electrolytic metal manganese is a single metal which is obtained from manganese ore by acid leaching and then sent to the electrolytic cell for electrolytic precipitation. In 2021, China produced more than 1.31 million tons of metal manganese annually, accounting for about 96.5% of the world's total production.1,2 Nowadays, electrolytic manganese residue (EMR) in China has exceeded 160 million tons.3–5 Owing to historical and technical reasons, these piles of EMR will produce a large amount of electrolytic metal manganese wastewater (EMMW). EMMW containing low concentrations of Mn2+ and NH4+–N will cause harm to human production, life and physical health.6–8 How to deal with low concentrations of Mn2+ and NH4+–N from EMMW is an urgent problem for electrolytic manganese enterprises.
Mn2+ and NH4+–N can be removed by catalytic oxidation, chemical oxidation, physicochemical adsorption, breaking point chlorination, membrane treatment, biophysical methods, electrochemical, chemical precipitation and stripping methods.9–19 In industrial production, Mn2+ and NH4+–N in EMMW are often removed by neutralization precipitation and flocculation precipitation methods, and Mn2+ and NH4+–N were main removed in the form of solidified precipitates and converted to ammonia gas, respectively. The above methods can remove high concentrations of Mn2+ and NH4+–N, but low concentrations of Mn2+ and NH4+–N also remain in the EMMW.20 Thus, the development of low concentration Mn2+ and NH4+–N removal technology is extremely important for electrolytic manganese enterprises.
In fact, adsorption methods have the characteristics of simple operation, high efficiency, reusable adsorbent, and less possibility of secondary pollution.21 They are suitable for the removal of Mn2+ and NH4+–N with low concentrations. However, the available adsorbents are difficult to recycle due to their high cost and poor stability, which limit the development of adsorption technology.22–24 Therefore, finding a low-cost adsorbent is essential to achieving the removal of Mn2+ and NH4+–N with low concentrations.
Phosphate ore flotation tailings (POFTs) are solid wastes that are produced by the enrichment of P2O5 from low-grade phosphate ore.25 Approximately 10 million tons of POFTs are released in China annually, and the massive accumulation of POFTs has brought about environmental pollution problems.26,27 POFTs are rich in available elements such as P, Mg, Ca and Si, which are high-quality resources with potential for development and utilization.28–30 Therefore, effective utilization of Ca, Mg, P and other resources in POFTs is essential for its resource utilization.
In this study, modified phosphate ore flotation tailings (MPOFTs) were used to remove Mn2+ and NH4+–N. The influence of the concentration of MPOFTs, different pH, different reaction time, and different aeration intensity on the removal efficiency of Mn2+ and NH4+–N was investigated. This study provided a new method for Mn2+ and NH4+–N removal, and POFT resource utilization.
2 Materials and methods
2.1 Materials
The EMMW used in this study was collected from an electrolytic manganese enterprise in Guizhou Province in China. The POFTs were sampled from a phosphate mining company in Chongqing and stored at room temperature. Sodium hydroxide (NaOH), sulfuric acid (H2SO4), oxalic acid dihydrate (C2H2O4·2H2O), and sodium oxalate (Na2C2O4) used in the experiment were produced by Chengdu Kelong Chemical Co., Ltd., and all chemical reagents were all of analytical grade.
2.2 Experimental processes
H2C2O4-modified POFTs (MPOFTs #1): first, 0.5 mol L−1 H2C2O4 solution was prepared (solution #1). Following a solid–liquid ratio of 1![[thin space (1/6-em)]](https://www.rsc.org/images/entities/char_2009.gif) :
:![[thin space (1/6-em)]](https://www.rsc.org/images/entities/char_2009.gif) 5, ground POFTs were added to solution #1. Second, the solid–liquid mixture was stirred adequately at a constant temperature of 353 K for 1.5 hours to obtain a slurry (slurry #1). The pH of slurry #1 was maintained at 8 with NaOH, and slurry #3 was obtained after 6 hours of reaction. Finally, H2C2O4-modified POFTs were obtained.
5, ground POFTs were added to solution #1. Second, the solid–liquid mixture was stirred adequately at a constant temperature of 353 K for 1.5 hours to obtain a slurry (slurry #1). The pH of slurry #1 was maintained at 8 with NaOH, and slurry #3 was obtained after 6 hours of reaction. Finally, H2C2O4-modified POFTs were obtained.
Na2C2O4-modified POFTs (MPOFTs #2): first, 0.5 mol L−1 Na2C2O4 solution was prepared (solution #2). Following a solid–liquid ratio of 1![[thin space (1/6-em)]](https://www.rsc.org/images/entities/char_2009.gif) :
:![[thin space (1/6-em)]](https://www.rsc.org/images/entities/char_2009.gif) 5, ground POFTs were added to solution #1. Second, the solid–liquid mixture was stirred adequately at a constant temperature of 353 K for 1.5 hours to obtain a slurry (slurry #2). The pH of slurry #2 was maintained at 8 by NaOH, and slurry #4 was obtained after 6 hours of reaction. Finally, Na2C2O4-modified POFTs were obtained.
5, ground POFTs were added to solution #1. Second, the solid–liquid mixture was stirred adequately at a constant temperature of 353 K for 1.5 hours to obtain a slurry (slurry #2). The pH of slurry #2 was maintained at 8 by NaOH, and slurry #4 was obtained after 6 hours of reaction. Finally, Na2C2O4-modified POFTs were obtained.
Adsorption process of MPOFTs: the effects of the concentration of MPOFTs, initial solution pH, reaction time, and reaction temperature on the removal efficiencies of Mn2+ and NH4+–N were explored. Based on the adsorption behavior of the MOPTs on Mn2+ and NH4+–N in the EMMW, the adsorption kinetics and adsorption thermodynamics of NH4+–N were studied.
The formulas of Mn2+ and NH4+–N adsorption removal efficiencies are as follows:
| |  | (1) |
| |  | (2) |
where
CMn2+ (mg L
−1−1) and
CNH4+ (mg L
−1−1) are the concentrations of Mn
2+ and NH
4+–N. Subscripts 0 and
t denote the initial and sampling time, respectively.
2.3 Adsorption kinetics and adsorption thermodynamics experiments
Since the Mn2+ in the EMMW was almost completely removed when the initial solution pH was 9.0, in this study, the adsorption of Mn2+ by the MPOFTs was no longer considered. The concentration of NH4+–N, adsorption times and adsorption temperatures was measured. The initial solution pH of the system was adjusted with NaOH solution or H2SO4, and the solution was quickly separated from the adsorbent through a 0.22 μm aqueous filter membrane after the reaction.31–33 The calculation formula and analysis methods are shown in the ESI.†
3 Results and discussion
3.1 Effect of POFT modification
As shown in Fig. 1, the concentration of Mn2+ in the EMMW decreased from 165.00 mg L−1 to 85.07 mg L−1, 89.53 mg L−1 and 92.45 mg L−1, respectively, when 5 g mL−1 of MPOFTs #1, MPOFTs #2, and POFTs were added to the EMMW, respectively. The concentration of NH4+–N decreased from 70.00 mg L−1 to 35.29 mg L−1, 41.77 mg L−1 and 44.42 mg L−1, respectively. The pH and concentrations of Mn2+ and NH4+–N in the EMMW that was treated with MPOFTs were lower than those in the EMMW that was treated with POFTs. MPOFTs #1 outperformed MPOFTs #2 in processing Mn2+ and NH4+–N in the EMMW. According to the results after modification, the POFT treatment effect on the EMMW improved, and the modification of H2C2O4 had a better effect on the POFT adsorption capacity than the modification of Na2C2O4. At the same time, the use of Na2C2O4 introduced as Na+ into the system produced by-products and affected the treatment results. In summary, modification can improve the adsorption capacity of POFTs, and H2C2O4-modified POFTs are more suitable for the treatment of EMMW.
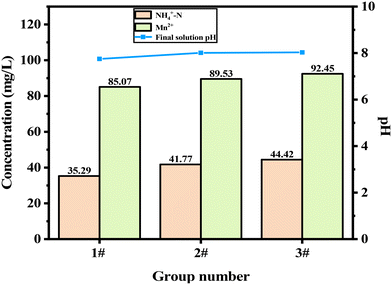 |
| | Fig. 1 Treatment effect of POFT modification (1#: MPOFTs #1; 2#: MPOFTs #2 and 3#: POFTs). | |
3.2 Effects of the concentration of MPOFTs and the initial solution pH
In Fig. 2a, the concentrations of Mn2+ and NH4+–N decreased from 102.05 mg L−1 and 45.58 mg L−1 to 48.49 mg L−1 and 31.01 mg L−1, respectively, and the final solution pH of the system increased from 7.57 to 8.34, when the concentration of MPOFTs was increased from 1 g L−1 to 30 g L−1. The results indicated that the concentration of MPOFTs was proportional to the removal effect of Mn2+ and NH4+–N. The surface area and the number of adsorption sites were increased by the increase of the concentration of MPOFTs. The MPOFTs were weakly alkaline, so when the concentration of MPOFTs was increased, the pH of the system increased accordingly. In Fig. 2b, when the initial solution pH increased from 8.0 to 9.5, the concentration of Mn2+ that remained in the EMMW decreased from 85.07 mg L−1 to 0.001 mg L−1, and the concentration of NH4+–N decreased from 35.29 mg L−1 to 18.96 mg L−1. The results showed that weakly alkaline reaction condition were more suitable for the adsorption system. In summary, when the concentration of MPOFTs was 5 g L−1, the reaction time was 1 h, the reaction temperature was 293 K, and the initial solution pH was 9.0, the concentrations of Mn2+ and NH4+–N in the EMMW were 0.001 mg L−1 and 33.60 mg L−1, respectively, and the final solution pH of the system was 8.41.
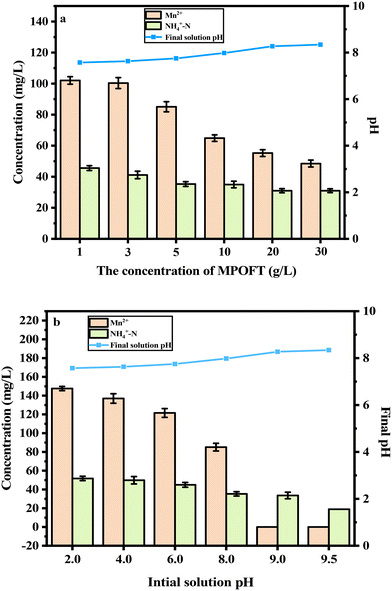 |
| | Fig. 2 Effects of the concentration of MPOFTs and the initial solution pH (a: the concentration of MPOFTs; b: the initial solution pH). | |
3.3 Effects of the reaction time and reaction temperature
When the reaction time increased from 0.5 h to 3.0 h, the concentration of Mn2+ was decreased, and NH4+–N decreased from 41.20 mg L−1 to 21.78 mg L−1, as well as the final solution pH decreasing from 8.48 to 8.16 (Fig. 3a). The final solution pH of the reaction was 8.25, the concentration of Mn2+ was 0.001 mg L−1 and the concentration of NH4+–N was 22.20 mg L−1, when the reaction time was 2.5 h. The concentration of NH4+–N did not meet the Integrated Wastewater Discharge Standard (GB8978-1996); hence, the effect of the reaction temperature on the adsorption results was studied and next explored. In Fig. 3b, as the reaction temperature increased, the concentration of Mn2+ remained at 0.001 mg L−1. When the reaction temperature increased from 293 K to 343 K, the concentration of NH4+–N decreasing from 22.20 mg L−1 to 0.001 mg L−1. It could be shown that an increase in temperature could enhance the decreases in the concentrations of Mn2+ and NH4+–N in the EMMW. Because of the energy consumption, 323 K was selected as the reaction temperature.
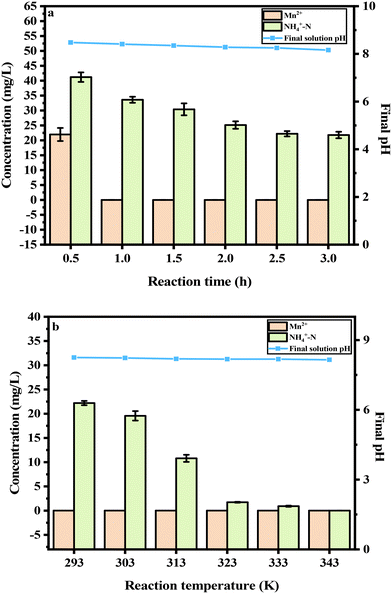 |
| | Fig. 3 Effects of the reaction time and reaction temperature (a: reaction time; b: reaction temperature). | |
3.4 Adsorption isotherms, kinetics and thermodynamics
The adsorption isotherm curve is shown in Fig. S1,† and the fitting result of the adsorption isotherm model is shown in Table 1. The “qm” and “KL” values of the adsorption isotherm obtained by the Langmuir model fitting were 2.0698 (mg g−1) and 61.0809 (L mg−1), respectively. The “KF” and “n” values of the adsorption isotherm obtained by the Freundlich model fitting were 0.3051 (mg g−1) and 1.1467 (g L−1), respectively. And the “n” value was greater than 1, indicating that NH4+–N was suitable for adsorption by MPOFTs. The “R2” values obtained by the Langmuir model and Freundlich model fitting were 0.9155 and 0.9966, respectively. Therefore, the adsorption behavior of MPOFTs on NH4+–N was more in line with the description of the Freundlich model. This adsorption process is dominated by uneven surface adsorption.
Table 1 The data of adsorption isotherm, adsorption kinetics, Weber's intraparticle diffusion model and adsorption enthalpy model
| Isotherms |
Parameters |
R
2
|
| Langmuir model |
q
m (mg g−1) = 2.0698 |
0.9155 |
|
K
L (L mg−1) = 61.0809 |
| Freundlich model |
K
F (mg g−1) = 0.3051 |
0.9966 |
|
n (g L−1) = 1.1467 |
| The quasi-first-order adsorption model |
q
e1 (mg g−1) = 7.3342 |
0.9914 |
|
K
1 (min−1) = 0.0311 |
| The quasi-second-order adsorption model |
q
e2 (mg g−1) = 10.5574 |
0.9440 |
|
K
2 (min−1) = 0.1193 |
| Weber's intraparticle diffusion model |
C
1 (mg g−1) = 5.2507 |
0.9842 |
|
K
i1 (mg g−1 min−1/2) = 0.6420 |
|
C
2 (mg g−1) = 10.3179 |
0.9034 |
|
K
i2 (mg g−1 min−1/2) = 0.1970 |
| Adsorption enthalpy model |
ΔH (kJ mol−1) = 67.754 |
0.9186 |
|
C = −24.1555 |
The adsorption capacity of MPOFTs on the NH4+–N in the EMMW increased first and then tends to be flat (Fig. S2a†). When the reaction time was longer than 150 minutes, the adsorption capacity reaches equilibrium. This is because in the initial stage of adsorption, the adsorption sites in the MPOFTs were not saturated, and at the same time the concentration of the adsorbent and the NH4+–N in the solution was very different, the mass transfer resistance was small, and the adsorbent can quickly adsorb in the EMMW. The adsorption capacity of NH4+–N increased rapidly. With the extension of the adsorption time, the available NH4+–N adsorption sites are occupied, at the same time the concentration gradient difference was reduced, and the mass transfer resistance increased, resulting in the slowdown of the adsorption rate and the adsorption capacity tending to a stable value. As shown in Fig. S2b† and Table 1, the “qe” values of the quasi-first-order adsorption model and the quasi-second-order adsorption model were 7.3342 (mg g−1) and 10.5574 (mg g−1), respectively, and the “R2” values were 0.9914 and 0.9440, respectively. The fitting degree of the quasi-first-order adsorption model is better than that of the quasi-second-order adsorption model. Therefore, the quasi-first-order adsorption model is more suitable for describing the adsorption behavior of MPOFTs on NH4+–N, indicating that the adsorption behavior is the same as physical adsorption and chemical adsorption. As shown in Fig. S2d† and Table 1, the internal diffusion behavior can be divided into two stages. The first stage was the diffusion process of NH4+–N to the surface of the MPOFTs, and the second stage was the internal diffusion process of NH4+–N. The “Ki1” is greater than “Ki2”, indicating that the first stage is a fast process, while the second stage is a gradual process. The “R2” values of the two stages were 0.9842 and 0.9034, respectively, indicating that the Weber's intraparticle diffusion model fitting can describe the adsorption behavior.34
During the adsorption process, the free energy changes are shown in Table S1.† As shown in Fig. S3† and Table 1, ΔG was a negative number in the reaction temperature range of 293 K to 343 K, indicating that this behavior was favorable and spontaneous from the perspective of adsorption thermodynamics. ΔH was 67.754 kJ mol−1, and the adsorption enthalpy became a positive number, indicating that the process was an endothermic reaction. The saturated adsorption capacity increased with the increase of temperature. Increasing the temperature was beneficial to the effect of MPOFTs on the adsorption behavior of NH4+–N in the EMMW.
3.5 Removal mechanism
In Table S2,† the contents of CaO, MgO, P2O5, SO3, SiO2, F and Fe2O3 were 57.26%, 16.89%, 9.78%, 8.16%, 3.53%, 1.70% and 1.06%, respectively, with a total content of 98.38%. The MPOFTs were composed mainly of CaO, MgO, P2O5, SO3, SiO2 and Fe2O3, the contents of these elements were 64.13%, 22.14%, 6.52%, 0.73%, 3.15% and 1.67%, respectively, with a total content of 98.34%. The contents of P, S and F were decreased after modification. The results show that H2C2O4 can reduce the contents of P, S and F in POFTs. Fig. 4 shows that the relative pressure P/P0 was in the range of 0.6 to 0.8. The POFTs before and after modification exhibit obvious hysteresis loops. Therefore, the curve is a type IV curve, which proves that the POFTs before and after modification had a mesoporous structure.35 When the relative pressure P/P0 is in the range of 0.8 to 1.0, the hysteresis loop has an upward trend, indicating that the structure was mesoporous with a larger pore size. The POFTs had an obvious pore size distribution from 2.41 nm to 18.61 nm, indicating that the POFTs had a mesoporous structure, but the pore size was too small, which was not conducive to adsorption (Fig. 4). The MPOFTs had an obvious pore size distribution from 9.21 nm to 33.06 nm, which was beneficial for adsorption. In Table S3,† the BET surface area and BJH desorption pore volume of the MPOFTs were 6.5239 m2 g−1 and 0.038057 cm3 g−1, respectively, which were larger than those of the POFTs before modification. The above results show that the MPOFTs are more suitable for use as an adsorbent.
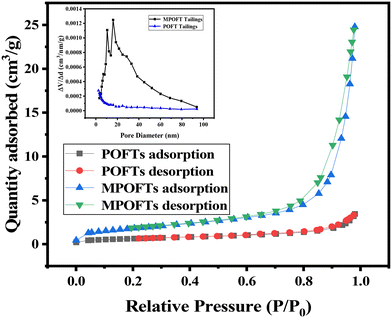 |
| | Fig. 4 BET analysis of the POFTs and MPOFTs. | |
In Fig. 5, XRD results indicated that the main components of the POFTs were magnesite ((Mg,Fe)CO3), dolomite (CaMg0.77Fe0.23(CO3)2, CaMg(CO3)2), gypsum (CaSO4·2H2O), fluorapatite (Ca5F(PO4)3, Ca5.164F0.959P2.892O11.523) and quartz (SiO2). The main components of the MPOFTs were whewellite (CaC2O4·H2O, Ca(COO)2·H2O), calcium phosphate (Ca2P2O7), newberyite (MgHPO4·3H2O), collinsite (MgCa2(PO4)2·2H2O) and sodium magnesium phosphate (MgNaPO4·6H2O). The peaks of CaMg(CO3)2, Ca5(PO4)3F, (Mg, Fe)CO3, Ca5.164F0.959P2.892O11.523 and CaMg0.77Fe0.23(CO3)2 decreased in number and weakened, and the characteristic peaks of CaSO4·2H2O and Ca5F(PO4)3 disappeared. The results show that CaSO4·2H2O, Ca5F(PO4)3, (Mg, Fe)CO3, CaMg(CO3)2, CaMg0.77Fe0.23(CO3)2 and Ca5(PO4)3F in the POFTs were decomposed during the modification process, and then Ca2+, PO43− and Mg2+ were transformed into their free states and reacted with C2O42−, and eventually formed CaC2O4·H2O, Ca2P2O7, MgHPO4·3H2O, MgCa2(PO4)2·2H2O and MgNaPO4·6H2O. The main reaction equation is shown in eqn (3)–(11):
| | | CaMg(CO3)2 + 4H+ → Ca2+ + Mg2+ + 2H2O + 2CO2 | (3) |
| | | Mg2+ + NaOH + PO43− + Ca2+ + 6H2O → MgNaPO4·6H2O + Ca(OH)2 | (4) |
| | | Mg2+ + 2PO43− + 2Ca2+ + 2H2O → MgCa2(PO4)2·2H2O | (5) |
| | | Ca(OH)2 + H2C2O4 → Ca(COO)2·H2O + H2O | (6) |
| | | Mg2+ + PO43− + 4H2O → MgHPO4·3H2O + OH− | (7) |
| | | Ca(OH)2 + H2C2O4 → CaC2O4 + 2H2O | (8) |
| | | H2C2O4 + CaSO4·2H2O + 2NaOH → CaC2O4 + Na2SO4 + 2H2O | (9) |
| | | 2Ca+ + 2PO43− + H2O → Ca2P2O7 + 2OH− | (10) |
| | | Ca5F(PO4)3 + 5H2C2O4 + 10NaOH → NaF + 3Na3PO4 + 5CaC2O4 + 10H2O | (11) |
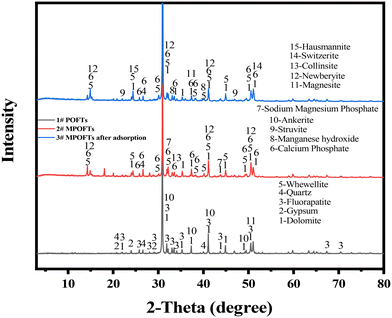 |
| | Fig. 5 XRD analysis of different samples (1#: POFTs; 2#: MPOFTs; 3#: MPOFTs after adsorption). | |
The main substances in MPOFTs after separate adsorption treatment were dolomite (CaMg(CO3)2, CaMg0.77Fe0.23(CO3)2), whewellite (CaC2O4·H2O), calcium phosphate (Ca2P2O7), manganese hydroxide (Mn(OH)2), struvite (Mg(NH4)PO4·6H2O) and quartz (SiO2). By comparing 2# and 3#, the characteristic peaks of MgNaPO4·6H2O disappeared, and the characteristic peaks of Mn(OH)2, switzerite (Mn3(PO4)2·7H2O), hausmannite (Mn3O4), manganite (MnOOH) and Mg(NH4)PO4·6H2O appeared,7 indicating that Mn2+ was removed via precipitation in the form of Mn(OH)2, Mn3(PO4)2·7H2O, Mn3O4 and MnOOH. Combining the results of adsorption kinetics and adsorption thermodynamics, it can be seen that NH4+–N was removed mainly via adsorption and ion-exchange with MgNaPO4·6H2O and MgHPO4·3H2O; and some NH4+–N was removed by struvite.
In Fig. 6a and b, the POFTs formed loose and united flocs, whereas the MPOFTs had a more compact structure, with obvious pore-like structures and flake and block-like substances on the surface, these substances could be CaC2O4·H2O, Ca2P2O7 and a small amount of MgNaPO4·6H2O combined with the XRD results. The EDS diagram shows that the POFT surface mainly contained elements Ca, Mg, O, and small amounts of P, Si, S and F. The types of the main elements did not change significantly, and the contents of P, Si, S and F were reduced in MPOFTs. As shown in the SEM image, compared with the MPOFTs, many spherical particle substances appeared on the surface, and these substances could be Mn(OH)2 and Mg(NH4)PO4·6H2O (Fig. 6c). As shown in the EDS diagram, the contents of Ca and O increased significantly, and the remaining elements did not differ substantially from those of the MPOFTs, but a small amount of Mn appeared, indicating that the Mn2+ in the EMMW was adsorbed into the MPOFTs.
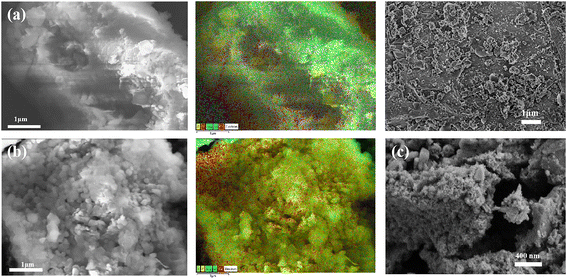 |
| | Fig. 6 SEM and EDS images of analysis (a: POFTs; b: MPOFTs; c: MPOFTs after adsorption). | |
In Fig. 7, the absorption peaks at 2524.36 cm−1 and 1048.11 cm−1 were caused by H2PO4− and PO43− group stretching vibration, respectively, and the double peak in the range of 604.16 cm−1 to 519.24 cm−1 was produced by the PO43− group. The broad peak at 881.41 cm−1 and 1436.90 cm−1 were caused by carbonate stretching vibration, and the absorption characteristic peak at 729.01 cm−1 was produced by the vibration of the SO42− group. Compared with the POFTs, the characteristic peak of carbonate absorption at 1436.90 cm−1 declined after modification, indicating that the carbonate content decreased. The absorption peak of hydroxyl was identified at 1620.81 cm−1, and the characteristic peak of oxalate was produced at 881.42 cm−1, which was the absorption peak of the oxalate group, indicating that after modification by oxalic acid, the metal ions in the POFTs formed new substances. At 781.06 cm−1, a distinct characteristic vibration peak of the H2PO4− group appeared, which indicated that phosphate appeared after modification. The characteristic peak of SO42− group absorption at 729.01 cm−1 was significantly reduced, indicating that the sulfate content in the MPOFTs was reduced. The characteristic peaks of H2PO4− groups in the MPOFTs were weakened, and the characteristic peaks of PO43− groups were enhanced and increased, indicating that more H2PO4− groups were converted to PO43− groups. Sample 3# had a characteristic absorption peak of the hydroxyl group of bound water at 3444.08 cm−1. The absorption peak at 2524.36 cm−1 was caused by the vibration of the H2PO4− group; this peak was roughly the same as that for the MPOFTs. At 1620.81 cm−1, the hydroxyl characteristic peak of the sample shifted and became a broad peak, thereby indicating that the hydroxide content increased, and the characteristic absorption peak of SO42− at 729.01 cm−1 declined, indicating that the ion originally combined with sulfate radicals.
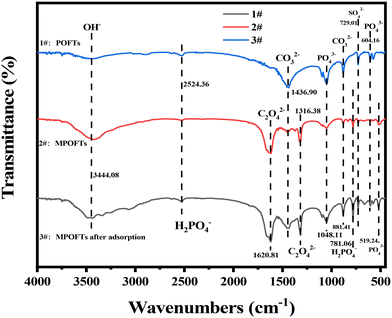 |
| | Fig. 7 FTIR spectra of the samples (1#: POFTs; 2#: MPOFTs; 3#: MPOFTs after adsorption). | |
In Table S4,† the concentrations of Mg2+, Mn2+ and Ca2+ in the leachate of the POFTs were 22.38 mg L−1, 0.03 mg L−1 and 3.03 mg L−1, respectively. The concentration of Mg2+ in the leachate of the MPOFTs sharply increased to 108.32 mg L−1, Mn2+ was not detected, and the concentration of Ca2+ decreased to 0.01 mg L−1. The result shows that Mg2+ was more easily washed out, and Mn2+ and Ca2+ formed a stable compound after modification. Compared with the sample 3# and sample 4#, the concentrations of NH4+–N, Mn2+, and Ca2+ decreased to 1.73 mg L−1, 0.001 mg L−1 and 5.85 mg L−1, respectively, and the concentrations of Zn2+, Sb2+ and Co2+ met the Integrated Wastewater Discharge Standard (GB8978-1996).
According to XRF, BET, XRD, SEM-EDS-mapping, FT-IR and ICP analysis, and combining with the other research results.7,19,36–38 The reaction equations of the Mn2+ and NH4+–N removal process can be obtained as follows:
| | | Mn2+ + 2OH− → Mn(OH)2 | (12) |
| | | 4Mn(OH)2 + 2O2 + 2H+ → MnOOH + Mn3O4 + 5H2O | (13) |
| | (Ca2+,![[thin space (1/6-em)]](https://www.rsc.org/images/entities/char_2009.gif) Mg2+) + 2OH− → (Ca, Mg2+) + 2OH− → (Ca,![[thin space (1/6-em)]](https://www.rsc.org/images/entities/char_2009.gif) Mg)(OH)2 Mg)(OH)2 | (14) |
| | | 3Mn2+ + 2PO43− + 7H2O → Mn3(PO4)2·7H2O | (15) |
| | | Mg2+ + NH4+ + PO43− + 6H2O → Mg(NH4)PO4·6H2O | (16) |
| | | MgNaPO4·6H2O + NH4+ → Mg(NH4)PO4·6H2O + Na+ | (17) |
| | | MgHPO4·3H2O + NH4+ + 3H2O → Mg(NH4)PO4·6H2O + H+ | (18) |
4 Conclusions
In this study, the POFTs were modified to treat low-concentration NH4+–N and Mn2+ from EMMW. During the process of H2C2O4 modification, gypsum, fluorapatite, magnesite and dolomite in the POFTs were transformed into whewellite, calcium phosphate, newberyite, collinsite and sodium magnesium phosphate. The results show that the concentration of Mn2+ and NH4+–N in the EMMW decreased from 165 mg L−1 to 0.001 mg L−1 and from 70 mg L−1 to 1.73 mg L−1, respectively, when the solid–liquid ratio of MPOFTs to EMMW was 1![[thin space (1/6-em)]](https://www.rsc.org/images/entities/char_2009.gif) :
:![[thin space (1/6-em)]](https://www.rsc.org/images/entities/char_2009.gif) 200, the reaction temperature was 323 K, the reaction time was 2.5 h and the initial solution pH was 9.0. NH4+–N was mainly removed via adsorption and ion-exchange with MgNaPO4·6H2O and MgHPO4·3H2O; and some NH4+–N was removed by struvite. Mn2+ was mainly removed by precipitation such as manganese phosphate and Mn(OH)2. The adsorption behavior of NH4+–N is a spontaneous endothermic reaction, and the increase of temperature is beneficial to the occurrence of the adsorption behavior. This study provides a new method and idea for EMMW treatment.
200, the reaction temperature was 323 K, the reaction time was 2.5 h and the initial solution pH was 9.0. NH4+–N was mainly removed via adsorption and ion-exchange with MgNaPO4·6H2O and MgHPO4·3H2O; and some NH4+–N was removed by struvite. Mn2+ was mainly removed by precipitation such as manganese phosphate and Mn(OH)2. The adsorption behavior of NH4+–N is a spontaneous endothermic reaction, and the increase of temperature is beneficial to the occurrence of the adsorption behavior. This study provides a new method and idea for EMMW treatment.
Conflicts of interest
There are no conflicts to declare.
Acknowledgements
This work was supported by the National Natural Science Foundation of China (52174386), the Science and Technology Plan Project of Sichuan Province (2021YFH0058), and the Opening Project of Key Laboratory of Solid Waste Treatment and Resource Recycle (SWUST), Ministry of Education, Southwest University of Science and Technology (21kfgk02).
References
- S. Jiancheng, W. Yuhao, D. Yaling, L. Tianya, H. Jinfeng, H. Yunhui, Z. Xingran, Z. Zhisheng, W. Yifan and C. Mengjun, Enhanced removal of Mn2+ and NH4+-N in electrolytic manganese metal residue using washing and electrolytic oxidation, Sep. Purif. Technol., 2021, 270, 118798 CrossRef.
- Y. Wang, S. Gao, X. Liu, B. Tang, E. Mukiza and N. Zhang, Preparation of non-sintered permeable bricks using electrolytic manganese residue: Environmental and NH 3 -N recovery benefits, J. Hazard. Mater., 2019, 378, 120768 CrossRef CAS PubMed.
- Y. Tian, J. Shu, M. Chen, J. Wang, Y. Wang, Z. Luo, R. Wang, F. Yang, F. Xiu and Z. Sun, Manganese and ammonia nitrogen recovery from electrolytic manganese residue by electric field enhanced leaching, J. Cleaner Prod., 2019, 236, 117708 CrossRef CAS.
- J. Lan, Y. Sun, L. Guo, Z. Li, D. Du and T. C. Zhang, A novel method to recover ammonia, manganese and sulfate from electrolytic manganese residues by bio-leaching, J. Cleaner Prod., 2019, 223, 499–507 CrossRef CAS.
- Y. Lv, J. Li, H. Ye, D. Du, J. Li, P. Sun, M. Ma and J. Wen, Bioleaching behaviors of silicon and metals in electrolytic manganese residue using silicate bacteria, J. Cleaner Prod., 2019, 228, 901–909 CrossRef CAS.
- J. Shu, B. Li, M. Chen, D. Sun and J. Wang, An innovative method for manganese (Mn2+) and ammonia nitrogen (NH4+-N) stabilization/solidification in electrolytic manganese residue by basic burning raw material, Chemosphere, 2020, 253, 126896 CrossRef CAS PubMed.
- Y. Deng, J. Shu, T. Lei, X. Zeng, B. Li and M. Chen, A green method for Mn2+ and NH4+-N removal in electrolytic manganese residue leachate by electric field and phosphorus ore flotation tailings, Sep. Purif. Technol., 2021, 270, 118820 CrossRef CAS.
- Y. Zhang, X. Liu, Y. Xu, B. Tang, Y. Wang and E. Mukiza, Preparation and characterization of cement treated road base material utilizing electrolytic manganese residue, J. Cleaner Prod., 2019, 232, 980–992 CrossRef CAS.
- Q. Cheng, L. Nengzi, L. Bao, Y. Huang, S. Liu, X. Cheng, B. Li and J. Zhang, Distribution and genetic diversity of microbial populations in the pilot-scale biofilter for simultaneous removal of ammonia, iron and manganese from real groundwater, Chemosphere, 2017, 182, 450–457 CrossRef CAS PubMed.
- R. Elkayam, T. Kraitzer, V. S. Popov, S. Sladkevich and O. Lev, High Performance of Fixed-Bed Filtration for Reagentless Oxidative Manganese Removal, J. Environ. Eng., 2017, 143, 04017030 CrossRef.
- H. Abu Hasan, S. R. Sheikh Abdullah, S. K. Kamarudin, N. Tan Kofli and N. Anuar, Kinetic evaluation of simultaneous COD, ammonia and manganese removal from drinking water using a biological aerated filter system, Sep. Purif. Technol., 2014, 130, 56–64 CrossRef CAS.
- Y. Sun, G. Fu, L. Jiang and X. Cai, Extraction of manganese oxide ore by a reduction acidolysis-selective leaching method, Miner. Metall. Process., 2018, 35, 215–220 Search PubMed.
- G. Soysüren, A. G. Yetgin, Ö. Arar and M. Arda, Removal of manganese (II) from aqueous solution by ionic liquid impregnated polymeric sorbent and electrodeionization (EDI) techniques, Process Saf. Environ. Prot., 2022, 158, 189–198 CrossRef.
- Y. Chen, J. Long, S. Chen, Y. Xie, Z. Xu, Z. Ning, G. Zhang, T. Xiao, M. Yu, Y. Ke, L. Peng and H. Li, Multi-step purification of electrolytic manganese residue leachate using hydroxide sedimentation, struvite precipitation, chlorination and coagulation:
Advanced removal of manganese, ammonium, and phosphate, Sci. Total Environ., 2022, 805, 150237 CrossRef CAS PubMed.
- Z. Dai, L. Zhao, S. Peng, Z. Yue, X. Zhan and J. Wang, Removal of oxytetracycline promoted by manganese-doped biochar based on density functional theory calculations: Comprehensive evaluation of the effect of transition metal doping, Sci. Total Environ., 2022, 806, 150268 CrossRef CAS PubMed.
- H. Gai, X. Liu, B. Feng, C. Gai, T. Huang, M. Xiao and H. Song, An alternative scheme of biological removal of ammonia nitrogen from wastewater–highly dispersed Ru cluster @mesoporous TiO2 for the catalytic wet air oxidation of low-concentration ammonia, Chem. Eng. J., 2021, 407, 127082 CrossRef CAS.
- S. B. Jang, C. E. Choong, S. Pichiah, J. y. Choi, Y. Yoon, E. H. Choi and M. Jang, In-situ growth of manganese oxide on self-assembled 3D- magnesium hydroxide coated on polyurethane: Catalytic oxidation mechanism and application for Mn(II) removal, J. Hazard. Mater., 2022, 424, 127267 CrossRef CAS.
- S. Saito, Y. Matsui, Y. Yamamoto, S. Matsushita, S. Mima, N. Shirasaki and T. Matsushita, Oxidative removal of soluble divalent manganese ion by chlorine in the presence of superfine powdered activated carbon, Water Res., 2020, 187, 116412 CrossRef CAS.
- J. Shu, H. Wu, M. Chen, H. Peng, B. Li, R. Liu, Z. Liu, B. Wang, T. Huang and Z. Hu, Fractional removal of manganese and ammonia nitrogen from electrolytic metal manganese residue leachate using carbonate and struvite precipitation, Water Res., 2019, 153, 229–238 CrossRef CAS.
- B. Li, J. Shu, Y. Wu, P. Su, Y. Yang, M. Chen, R. Liu and Z. Liu, Enhanced removal of Mn2+ and NH4+-N in electrolytic manganese residue leachate by electrochemical and modified phosphate ore flotation tailings, Sep. Purif. Technol., 2022, 291, 120959 CrossRef CAS.
- F. Ferrero, Dye removal by low cost adsorbents: hazelnut shells in comparison with wood sawdust, J. Hazard. Mater., 2007, 142, 144–152 CrossRef CAS PubMed.
- G. L. Dotto, J. M. N. Santos, E. H. Tanabe, D. A. Bertuol, E. L. Foletto, E. C. Lima and F. A. Pavan, Chitosan/polyamide nanofibers prepared by Forcespinning® technology: A new adsorbent to remove anionic dyes from aqueous solutions, J. Cleaner Prod., 2017, 144, 120–129 CrossRef CAS.
- B. Abbad and A. Lounis, Removal of methylene blue from colored effluents by adsorption onto ZnAPSO-34 nanoporous material, Desalin. Water Treat., 2013, 52, 7766–7775 CrossRef.
- Y. Dong, B. Lu, S. Zang, J. Zhao, X. Wang and Q. Cai, Removal of methylene blue from coloured effluents by adsorption onto SBA-15, J. Chem. Technol. Biotechnol., 2011, 86, 616–619 CrossRef CAS.
- S. Nayak, C. S. K. Mishra, B. C. Guru and S. Samal, Histological anomalies and alterations in enzyme activities of the earthworm Glyphidrillus tuberosus exposed to high concentrations of phosphogypsum, Environ. Monit. Assess., 2018, 190, 529 CrossRef PubMed.
- B. Li, J. Shu, L. Yang, C. Tao, M. Chen, Z. Liu and R. Liu, An innovative method for simultaneous stabilization/solidification of PO43− and F− from phosphogypsum using phosphorus ore flotation tailings, J. Cleaner Prod., 2019, 235, 308–316 CrossRef CAS.
- M. Wang, H. Luo, Y. Chen and J. Yang, Leaching Characteristics of Calcium and Strontium from Phosphogypsum Under Acid Rain, Bull. Environ. Contam. Toxicol., 2018, 100, 310–315 CrossRef CAS.
- Q. Chen, Q. Zhang, A. Fourie and C. Xin, Utilization of phosphogypsum and phosphate tailings for cemented paste backfill, J. Environ. Manage., 2017, 201, 19–27 CrossRef CAS.
- Y. Yang, Z. Wei, Y.-l. Chen, Y. Li and X. Li, Utilizing phosphate mine tailings to produce ceramisite, Constr. Build. Mater., 2017, 155, 1081–1090 CrossRef CAS.
- H. Liang, P. Zhang, Z. Jin and D. DePaoli, Rare Earth and Phosphorus Leaching from a Flotation Tailings of Florida Phosphate Rock, Minerals, 2018, 8, 416 CrossRef.
- J. Fang, X. Huang, X. Ouyang and X. Wang, Study of the preparation of γ-Al2O3 nano-structured hierarchical hollow microspheres with a simple hydrothermal synthesis using methylene blue as structure directing agent and their adsorption enhancement for the dye, Chem. Eng. J., 2015, 270, 309–319 CrossRef CAS.
- N. Loncar and Z. Vujcic, Tentacle carrier for immobilization of potato phenoloxidase and its application for halogenophenols removal from aqueous solutions, J. Hazard. Mater., 2011, 196, 73–78 CrossRef CAS.
- S. Abdi, M. Nasiri, A. Mesbahi and M. H. Khani, Investigation of uranium (VI) adsorption by polypyrrole, J. Hazard. Mater., 2017, 332, 132–139 CrossRef CAS.
- S. Afroze, T. K. Sen, M. Ang and H. Nishioka, Adsorption of methylene blue dye from aqueous solution by novel biomassEucalyptus sheathianabark: equilibrium, kinetics, thermodynamics and mechanism, Desalin. Water Treat., 2015, 57, 5858–5878 CrossRef.
- L. Zhang, T. Du, H. Qu, B. Chi and Q. Zhong, Synthesis of Fe-ZSM-5@Ce/mesoporous-silica and its enhanced activity by sequential reaction process for NH3-SCR, Chem. Eng. J., 2017, 313, 702–710 CrossRef CAS.
- C. Zhong, W. B. Hu and Y. F. Cheng, Recent advances in electrocatalysts for electro-oxidation of ammonia, J. Mater. Chem. A, 2013, 1, 3216–3238 RSC.
- J. Shu, Y. Wu, Y. Deng, T. Lei, J. Huang, Y. Han, X. Zhang, Z. Zhao, Y. Wei and M. Chen, Enhanced removal of Mn2+ and NH4+-N in electrolytic manganese metal residue using washing and electrolytic oxidation, Sep. Purif. Technol., 2021, 270, 118798 CrossRef CAS.
- Y. Tanabe and Y. Nishibayashi, Comprehensive insights into synthetic nitrogen fixation assisted by molecular catalysts under ambient or mild conditions, Chem. Soc. Rev., 2021, 50, 5201–5242 RSC.
|
| This journal is © The Royal Society of Chemistry 2023 |
Click here to see how this site uses Cookies. View our privacy policy here.  *a,
Wenxing
Cao
a,
Zihan
Li
a,
Bing
Li
b,
Zhonghui
Xu
a,
Hongliang
Chen
ac,
Mengjun
Chen
a and
Zongyu
Deng
d
![[thin space (1/6-em)]](https://www.rsc.org/images/entities/char_2009.gif) :
:![[thin space (1/6-em)]](https://www.rsc.org/images/entities/char_2009.gif) 200, the reaction temperature was 323 K, the reaction time was 2.5 h and the initial solution pH was 9.0. The adsorption process was more consistent with the pseudo-first-order adsorption kinetic model and Weber's intraparticle diffusion model, and the results showed that this adsorption reaction was an endothermic reaction. This study provided a new research idea for EMMW and POFT treatment and disposal.
200, the reaction temperature was 323 K, the reaction time was 2.5 h and the initial solution pH was 9.0. The adsorption process was more consistent with the pseudo-first-order adsorption kinetic model and Weber's intraparticle diffusion model, and the results showed that this adsorption reaction was an endothermic reaction. This study provided a new research idea for EMMW and POFT treatment and disposal.![[thin space (1/6-em)]](https://www.rsc.org/images/entities/char_2009.gif) :
:![[thin space (1/6-em)]](https://www.rsc.org/images/entities/char_2009.gif) 200, the reaction temperature was 323 K, the reaction time was 2.5 h and the initial solution pH was 9.0. The adsorption process was more consistent with the pseudo-first-order adsorption kinetic model and Weber's intraparticle diffusion model, and the results showed that this adsorption reaction was an endothermic reaction. NH4+–N was removed mainly by struvite (MgNH4PO4·6H2O), and Mn2+ was removed mainly by Mn(OH)2, Mn3O4, Mn3(PO4)2·7H2O and Mn(OH)2. This study provided a new research idea for EMMW and POFT treatment and disposal.
200, the reaction temperature was 323 K, the reaction time was 2.5 h and the initial solution pH was 9.0. The adsorption process was more consistent with the pseudo-first-order adsorption kinetic model and Weber's intraparticle diffusion model, and the results showed that this adsorption reaction was an endothermic reaction. NH4+–N was removed mainly by struvite (MgNH4PO4·6H2O), and Mn2+ was removed mainly by Mn(OH)2, Mn3O4, Mn3(PO4)2·7H2O and Mn(OH)2. This study provided a new research idea for EMMW and POFT treatment and disposal.
![[thin space (1/6-em)]](https://www.rsc.org/images/entities/char_2009.gif) :
:![[thin space (1/6-em)]](https://www.rsc.org/images/entities/char_2009.gif) 5, ground POFTs were added to solution #1. Second, the solid–liquid mixture was stirred adequately at a constant temperature of 353 K for 1.5 hours to obtain a slurry (slurry #1). The pH of slurry #1 was maintained at 8 with NaOH, and slurry #3 was obtained after 6 hours of reaction. Finally, H2C2O4-modified POFTs were obtained.
5, ground POFTs were added to solution #1. Second, the solid–liquid mixture was stirred adequately at a constant temperature of 353 K for 1.5 hours to obtain a slurry (slurry #1). The pH of slurry #1 was maintained at 8 with NaOH, and slurry #3 was obtained after 6 hours of reaction. Finally, H2C2O4-modified POFTs were obtained.
![[thin space (1/6-em)]](https://www.rsc.org/images/entities/char_2009.gif) :
:![[thin space (1/6-em)]](https://www.rsc.org/images/entities/char_2009.gif) 5, ground POFTs were added to solution #1. Second, the solid–liquid mixture was stirred adequately at a constant temperature of 353 K for 1.5 hours to obtain a slurry (slurry #2). The pH of slurry #2 was maintained at 8 by NaOH, and slurry #4 was obtained after 6 hours of reaction. Finally, Na2C2O4-modified POFTs were obtained.
5, ground POFTs were added to solution #1. Second, the solid–liquid mixture was stirred adequately at a constant temperature of 353 K for 1.5 hours to obtain a slurry (slurry #2). The pH of slurry #2 was maintained at 8 by NaOH, and slurry #4 was obtained after 6 hours of reaction. Finally, Na2C2O4-modified POFTs were obtained.


![[thin space (1/6-em)]](https://www.rsc.org/images/entities/char_2009.gif) Mg2+) + 2OH− → (Ca,
Mg2+) + 2OH− → (Ca,![[thin space (1/6-em)]](https://www.rsc.org/images/entities/char_2009.gif) Mg)(OH)2
Mg)(OH)2![[thin space (1/6-em)]](https://www.rsc.org/images/entities/char_2009.gif) :
:![[thin space (1/6-em)]](https://www.rsc.org/images/entities/char_2009.gif) 200, the reaction temperature was 323 K, the reaction time was 2.5 h and the initial solution pH was 9.0. NH4+–N was mainly removed via adsorption and ion-exchange with MgNaPO4·6H2O and MgHPO4·3H2O; and some NH4+–N was removed by struvite. Mn2+ was mainly removed by precipitation such as manganese phosphate and Mn(OH)2. The adsorption behavior of NH4+–N is a spontaneous endothermic reaction, and the increase of temperature is beneficial to the occurrence of the adsorption behavior. This study provides a new method and idea for EMMW treatment.
200, the reaction temperature was 323 K, the reaction time was 2.5 h and the initial solution pH was 9.0. NH4+–N was mainly removed via adsorption and ion-exchange with MgNaPO4·6H2O and MgHPO4·3H2O; and some NH4+–N was removed by struvite. Mn2+ was mainly removed by precipitation such as manganese phosphate and Mn(OH)2. The adsorption behavior of NH4+–N is a spontaneous endothermic reaction, and the increase of temperature is beneficial to the occurrence of the adsorption behavior. This study provides a new method and idea for EMMW treatment.


