Ceramic membrane bioreactor for low carbon source wastewater treatment: process design performance and membrane fouling
Kai
Wang
*ab,
Xiaoyu
Xu
 a,
Xujiao
Ma
a,
Xiquan
Cheng
ab,
Yingjie
Zhang
ab and
Jun
Ma
ab
a,
Xujiao
Ma
a,
Xiquan
Cheng
ab,
Yingjie
Zhang
ab and
Jun
Ma
ab
aSchool of Marine Science and Technology, Harbin Institute of Technology, Weihai, China. E-mail: wangkai79@hit.edu.cn
bSino-Europe Membrane Technology Research Institute, China
First published on 25th October 2022
Abstract
In this study, the ceramic flat membrane bioreactor (MBR) process was combined with the anaerobic/aerobic/anoxic (AOA) process, providing a theoretical basis for the combined application of these two processes, as well as for the treatment of typical urban domestic wastewater (low C/N wastewater). The results showed that the AOA–MBR achieved 94.31%, 98.82%, 88.40% and 98.61% removal of chemical oxygen demand (COD), ammonia nitrogen, total nitrogen (TN) and total phosphorus (TP) from the target effluent, respectively, while the control AOA process achieved 93.27%, 96.48%, 79.79% and 89.52% removal of COD, ammonia nitrogen, TN and TP, respectively. The coupled AOA–MBR process was significantly more efficient in utilizing the internal carbon source in the endogenous denitrification stage than the AOA process. Two process parameters, dissolved oxygen in the aerobic zone and the sludge recycle ratio, were optimized for both reactors in terms of optimizing denitrification, phosphorus removal performance and decreasing operating costs, and the optimum operating conditions were determined. The membrane fouling resistance was mainly caused by the filter cake layer, and the changes in the content and composition of the main membrane contaminants, soluble microbial product (SMP) and extracellular polymer substance (EPS), during the process operation were identified. The addition of polymeric aluminium chloride had a certain adsorption effect on the SMP, which increased the average particle size of the activated sludge from 122.1 μm to 161.1 μm. Thus, the cake layer was loosened, which could slow down the rate of membrane fouling and prolong the membrane fouling cycle to 19–20 days.
Water impactPost-endogenous denitrification can be effective for typical municipal wastewater with low C/N ratios, and membrane bioreactors can increase activated sludge concentrations and optimise treatment effectiveness. In this work, two wastewater treatment systems were operated simultaneously, and cleaning strategies in MBR operation were optimised, which guides the application of upgrading and renovation for municipal wastewater treatment plants. |
1. Introduction
The concentration of organic matter in domestic wastewater is generally low, the traditional activated sludge method based on AO1,2 and AAO3,4 is limited to denitrification due to the relative lack of carbon sources, the overall denitrification effect is poor, the actual operation requires the addition of external carbon sources,5,6 and some of the carbon sources such as methanol7 are aerobic and potentially dangerous, which greatly increases the operating costs and the difficulty of operational control. The AOA process using post-endogenous denitrification is simpler in structure and usually does not require an external carbon source, and it includes good denitrification and phosphorus removal for low C/N domestic wastewater,8–11 but is limited by the slow rate of endogenous denitrification, making the post-anaerobic zone require a long hydraulic retention time (HRT);12 otherwise the denitrification intensity is still insufficient. Xu et al.13 found that increasing the sludge concentration in the anaerobic zone could effectively strengthen the anaerobic zone biomass and reduce the sludge load. Gao et al.11 found that increasing the sludge concentration in the anaerobic zone could effectively enhance the biomass in the anaerobic zone, reduce the sludge load and thus increase the intensity of endogenous denitrification. The coupling of the MBR technology with high sludge concentration and the AOA process is therefore theoretically a promising process for low C/N wastewater treatment.Membrane bioreactor (MBR) technology has been used in a large number of applications for urban domestic and industrial wastewater treatments.14–16 Studies have shown that MBR is ideal for replacing the traditional activated sludge wastewater treatment process as it has good removal effects on common pollutants (COD, ammonia nitrogen, total nitrogen and total phosphorus),17 pathogenic bacterias18 and difficult-to-remove micro-pollutants19 in wastewater. However, during the operation of the MBR, some of the dissolved and particulate pollutants will be adsorbed on the membrane surface and inside the membrane pores along with the suction of the membrane, causing membrane fouling, resulting in a decrease in membrane flux and filtration performance.20 The problem of membrane fouling and the relatively high operating costs have constrained the widespread adoption of the MBR technology.21,22 Therefore, during MBR operation, the use of optimised operating conditions,23 modified membrane materials,24 coagulants25 and ozone oxidation26–28 are commonly used to mitigate membrane fouling. For coagulants, the common ones include alum, iron salts, aluminium salts and powdered activated carbon, etc. Ren et al.29 intermittently added ferrous salts to the MBR system to increase the membrane operating cycle to 90 days, and Tang et al.30 used in situ ozone oxidation and iron chloride injection to restore the filtration performance of ceramic ultrafiltration membranes and mitigate membrane fouling.
In this paper, a continuous flow AOA–MBR coupling process is designed by combining the AOA process with the MBR using ceramic membranes and submerging the membrane module into the anaerobic tank at the end of the reactor, using the higher sludge concentration in the MBR reactor to enhance the biomass and compensate for the slow denitrification rate and low intensity of the source within the anaerobic zone in the AOA process and using the good sludge–water separation capability of the MBR to achieve better effluent quality. 3D-EEM fluorescence spectroscopy is used to investigate membrane contaminant information and to apply flocculants to extend the membrane operating cycle.
2. Materials and methods
2.1. Membrane materials, sludge, synthetic sewage and biological fillers
The experimental process used alumina flat membrane material with an average pore size of 0.1 μm and a water flux of 3.80 m3 m−2 d−1 (10 kPa pumping pressure), with an effective filtration area of 0.25 m2 per membrane. Self-formulated simulated wastewater was used for the test. The actual influent COD was 250 ± 20 mg L−1, NH4+-N/total nitrogen (TN) was 40 ± 5 mg L−1, total phosphorus (TP) was 3.5 ± 0.5 mg L−1, and carbon/nitrogen (C/N) was 5 ± 1. The activated sludge was taken from the secondary sedimentation tank of the Weihai City Wastewater Plant, and the activated sludge was collected and incubated in plastic barrels with aeration. The supernatant was removed and added to the experimentally simulated wastewater every two days by standing for 1 h, the sludge was incubated with intermittent aeration in the sequencing batch reactor (SBR) activated sludge process mode, and the pH was adjusted with NaHCO3 to observe the growth of the sludge. Commercially available polypropylene suspension fillers were selected as biological carriers for the aerobic section of the reactor, allowing the aerobic section to increase the ammonia load and ensure nitrification with a short residence time.2.2. System operation in different operation modes and membrane materials
The experimental setup is shown in (Fig. 1a–c) and contains two groups of reactors: the anaerobic/aerobic/anoxic–MBR (AOA–MBR) system, consisting of an inlet bucket, a segmented influent reactor, a membrane module, an effluent and backwash device, and a sludge return device; and the control group AOA reactor, consisting of an inlet bucket, a segmental inlet reactor, a secondary sedimentation tank and a sludge return device.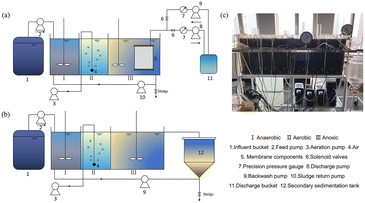 | ||
| Fig. 1 Experimental equipment: schematic of (a) the AOA–MBR system device for the experimental group and (b) the AOA system device for the control group. (c) Bench-scale AOA–MBR reactors. | ||
In this experiment, two groups of reactors were used, each with 22 compartments, a maximum volume of 3.96 L and an effective volume of 3.6 ± 0.2 L. The anaerobic![[thin space (1/6-em)]](https://www.rsc.org/images/entities/char_2009.gif) :
:![[thin space (1/6-em)]](https://www.rsc.org/images/entities/char_2009.gif) aerobic
aerobic![[thin space (1/6-em)]](https://www.rsc.org/images/entities/char_2009.gif) :
:![[thin space (1/6-em)]](https://www.rsc.org/images/entities/char_2009.gif) anaerobic volume ratio of each part of the reactors in both groups was 3
anaerobic volume ratio of each part of the reactors in both groups was 3![[thin space (1/6-em)]](https://www.rsc.org/images/entities/char_2009.gif) :
:![[thin space (1/6-em)]](https://www.rsc.org/images/entities/char_2009.gif) 3
3![[thin space (1/6-em)]](https://www.rsc.org/images/entities/char_2009.gif) :
:![[thin space (1/6-em)]](https://www.rsc.org/images/entities/char_2009.gif) 5. Other operating parameters of the two groups of reactors are shown in Table 1.
5. Other operating parameters of the two groups of reactors are shown in Table 1.
| Items | AOA–MBR system | AOA system |
|---|---|---|
| HRT | 12 h (1–16 d) | |
| 14 h (16–137 d) | 14 h (16–137 d) | |
| SRT | 20 d | 20 d |
| Recycle ratio | 200% | 200% |
| DO | 3–4 mg L−1 | 3–4 mg L−1 |
| MLSS | 6000 ± 500 mg L−1 | 2500 ± 300 mg L−1 |
Raw water was stored in a bucket and pumped into the reactor via a peristaltic pump. The water temperature was kept at 16–18 °C, and no additional carbon source was added. The raw water firstly entered the anaerobic zone, where phosphate-accumulating organisms (PAOs) consumed most of the carbon source for phosphorus release, and the organic matter in the effluent was fully removed in this zone, while the microorganisms fully stored the internal carbon source and then entered the aerobic zone, where nitrification and phosphorus release take place, converting NH4+-N into NO3−-N. While PAOs superabsorb phosphorus under aerobic conditions, the endogenous denitrification takes place in the anaerobic zone, using the internal carbon source stored in the anaerobic zone, and MBR maintains a high sludge concentration in the reactor to allow endogenous denitrification to take place. The final water is filtered through the membrane module into the effluent drum. The effluent, membrane module backflush and sludge return are pumped using a peristaltic pump, and the effluent and backflush are controlled by time relays and solenoid valves. This operates on an intermittent pump-out basis with four minutes of operation and one minute of backwashing. Backwashing is carried out using the effluent water stored in the effluent drum. The aerobic section is aerated with a microporous aeration head via an aeration pump to meet the dissolved oxygen requirements of the micro-organisms in the zone, with a gas valve connected to the front of the aeration head to control the aeration volume.
2.3. Water quality testing and analytical methods
Chemical oxygen demand (COD), NH4+-N, TP, TN, NO3−-N and NO2−-N were analyzed using a quick-analysis apparatus (Lianhua, 5B-3B, 5B-1 and LH-3BN, China). The mixed liquor suspended solids (MLSS) of the activated sludge and sludge volume in 30 min (SV30) were analyzed according to standard methods. pH was monitored using a high-performance benchtop meter for standard laboratory applications (OHAUS, ST3100, America). A multi-parameter portable meter (WTW, Multi 3620 JDS, Germany) was used to monitor dissolved oxygen (DO).2.4. Analysis of the intensity of endogenous denitrification
In this experiment, a comparison was made between the poly-β-hydroxybutyric acid (PHB) content of the internal carbon source per unit mass of the activated sludge (in terms of MLSS) at the inlet of the anaerobic zone and at the end of the anaerobic MBR and the changes in the content of NO3−-N and TN to examine the consumption of the internal carbon source and the intensity of endogenous denitrification. Here ultraviolet and visible spectrophotometry is used to determine the PHB content.2.5. Membrane fouling trend analysis
The membrane fouling trend was reflected by recording the trans-membrane pressure (TMP), which was read directly from a precision pressure gauge set up on the outlet pipe. When the TMP reached around 30 kPa, the membrane was considered to be seriously contaminated, and the membrane was cleaned mechanically. The surface filter cake layer was brushed off, and then the membrane was washed with 7–10 times the amount of water discharged for five minutes.2.6. Membrane filtration resistance analysis
All membrane filtration resistance measurements were made using clean water as the leachate. The TMP and permeate flux of an unused membrane were used to measure the intrinsic membrane resistance Rm. The total resistance Rt was measured by measuring the resistance of a heavily contaminated membrane. Then, the intrinsic resistance Rm and the membrane pore resistance Rf were measured by measuring the filtration resistance after the surface filter cake layer has been removed by mechanical cleaning means with a brush, and the intrinsic membrane resistance Rm and the irreversible membrane pore resistance Rf2 were measured by backwashing the membrane with 7–10 times the effluent flow rate.2.7. Major membrane contaminant analysis
Soluble microbial products (SMP) and extracellular polymeric substances (EPS) were analysed by extracting the mixture in the reactor during the period of membrane fouling.31,32 Protein and polysaccharide contents represent the SMP and EPS contents, respectively. Membrane fouling substances were analysed by 3D-EEM fluorescence spectroscopy (Olympus, BX43, China).2.8. Fouling mitigation strategies in MBR
The membrane fouling was mitigated by the addition of polymeric aluminium chloride (PAC), a flocculant. The optimum amount of flocculant was determined by shaking the flask.33 50 mL of sludge was added to a 100 mL conical flask with different doses of PAC and stirred in a shaker at 120 r min−1 for one minute and then at 50 r min−1 for 20 minutes. The specific resistance to filtration (SRF) and the specific oxygen uptake rate (OUR) were measured to determine the optimum amount of flocculant to be added, taking into account the improvement in the SRF and the change in the activated sludge activity.After determining the optimum dosage, the flocculant was put into the reactor for 2 membrane fouling cycles. The effect of flocculant dosing on the mitigation of membrane fouling was comprehensively evaluated by examining the changes in the effluent quality, the TMP trends, the composition of the filtration resistance of each part of the contaminated membrane, the changes in the average sludge particle size and particle size distribution in the reactor and the changes in the concentration of the main membrane contaminants, SMP and EPS. The average sludge particle size and size distribution were analysed using a laser particle size meter (Bettersize, BT-9300ST, China).
3. Results and discussion
3.1. System setup and operation
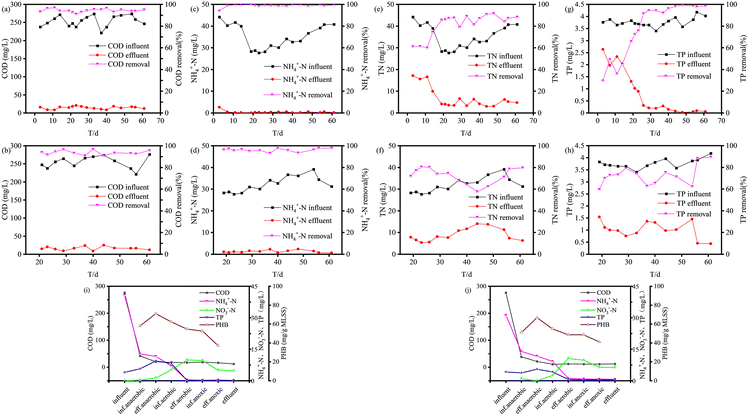
During the start-up period (days 1–62) of the two different systems, sludge and synthetic wastewater were added into the two reactors. The effluent COD of both the AOA–MBR reactor and the AOA reactor was consistently below 30 mg L−1. The average COD removal rate during the start-up period of the AOA reactor was 93.27% (Fig. 2b), which was slightly lower than that of the other one (Fig. 2a). This may be due to the fact that the membranes in the AOA–MBR system have a higher retention capacity for some cellular metabolites and macromolecular organic matter, and therefore have a higher COD removal capacity.In the AOA system, a small proportion of ammonia is taken up by the activated sludge in the first anaerobic section, while the majority of the ammonia is removed by autotrophic nitrification of the nitrifying bacteria in the aerobic section to nitrate nitrogen.34 The average effluent ammonia nitrogen from the AOA–MBR reactor was 0.339 mg L−1 during the start-up period, with an average removal rate of 98.82% (Fig. 2c). The AOA reactor was started on the 17th day of the start-up period, with an average effluent ammonia nitrogen of 1.284 mg L−1 and an average removal rate of 96.48% (Fig. 2d). The effluent ammonia nitrogen from both reactor groups was below 5 mg L−1, and it was clear that the AOA–MBR system was more complete. Because the AOA system has low MLSS, it has a low ammonia nitrogen removal capacity.
After nitrification in the aerobic zone, the nitrogen in the AOA system has been basically converted from ammonia nitrogen to nitrate nitrogen, which needs to enter the anaerobic zone to be converted to nitrogen through endogenous denitrification35,36 driven by carbon sources within the microorganisms to achieve the removal of nitrogen in the AOA system. According to the results of the domestication operation, the effluent total nitrogen concentration of the AOA–MBR reactor decreased and was stabilised as the influent total nitrogen concentration decreased (Fig. 2e). This demonstrates that the AOA–MBR system already has good endogenous denitrification capability. During the start-up period, the AOA reactor also suffered from high effluent total nitrogen concentration, and the high removal rate was only ensured at the beginning and end of the start-up period when the influent total nitrogen concentration was low, while in the middle of the period, as the influent total nitrogen concentration increased, the effluent total nitrogen concentration significantly exceeded 10 mg L−1. The average effluent total nitrogen concentration during the whole start-up period was 8.95 mg L−1, and the average total nitrogen removal rate was only 73.37%. On the 61st day of operation, although the total nitrogen concentration in the effluent of both reactor groups was lower than 15 mg L−1 (Fig. 2f), the total nitrogen load that the AOA system could withstand was significantly lower, indicating that the introduction of the MBR greatly increased the total nitrogen load of the AOA system by raising the sludge concentration. Zhao et al.12 found during the operation of the AOA system that it could withstand a total nitrogen load of no more than 30 mg L−1 when the average MLSS in the system was 2500 ± 300 mg L−1, which is in general agreement with the results of this experiment.
In the AOA system, phosphorus in the influent is mainly removed by PAOs37 and the removal efficiency of total phosphorus can characterise endogenous denitrification. The AOA–MBR reactor had a high concentration of nitrate nitrogen in the return stream and effluent at the beginning of the start-up period, resulting in a low total phosphorus removal rate. As the total nitrogen in the effluent was always kept at a low level in the subsequent operation, it always had a good total phosphorus removal effect, and the effluent total phosphorus concentration was more stable in the middle and late stages (26–61 days) of start-up (Fig. 2g). The total phosphorus removal effect of the AOA reactor was relatively poor due to the large amount of nitrate-nitrogen in the return sludge before and in the middle of the start-up period, with an average total phosphorus removal rate of 72.66% during the whole start-up process. Most of the time the total phosphorus concentration in the effluent was above 0.5 mg L−1, only approaching 90% in the later stages of operation (Fig. 2h). Not only the addition of MBR improved the nitrogen removal efficiency of the AOA system, but also the reduction of nitrate nitrogen in the return sludge mixture improved the phosphorus removal efficiency of the system to a certain extent.
On day 61 of the start-up period, changes in pollutant concentrations and the content of the internal carbon source were measured during the operation of the two groups of reactors to analyse the organic matter removal and nitrogen and phosphorus removal characteristics and to characterise the intensity of endogenous denitrification. The pollutants in the feed water of both reactor groups were firstly reduced by the dilution of the recycle mixture, and the COD was mainly removed in the anaerobic section. Meanwhile the increase in the content of the main internal carbon source, poly-β-hydroxybutyric acid (PHB),38 indicated that the microorganisms converted the COD into an internal carbon source by consuming it, while there was also a significant release of phosphorus in the anaerobic zone. In the aerobic zone, PAOs consume part of the PHB for aerobic phosphorus absorption, which reduces the PHB content and completes the removal of phosphorus, while nitrifying bacteria convert most of the ammonia nitrogen into nitrate nitrogen and complete the removal of ammonia nitrogen. However, aeration is large (DO 3–4 mg L−1), and an obvious simultaneous nitrification denitrification (SND) effect is not observed in the aerobic zone with MBBR fillers. In the anaerobic zone, as the external COD has been depleted, the level of PHB decreases further, while most of the nitrate-nitrogen is removed from the system, suggesting the presence of endogenous denitrification driven by an internal carbon source, mainly PHB. Since a certain concentration of nitrate nitrogen is still maintained at the end of the anaerobic zone, the theoretical possible endogenous release of phosphorus does not occur. In addition, only nitrate nitrogen was detected in the aerobic effluent and in the anaerobic sludge mixture, but not nitrite-nitrogen, indicating that the nitrogen removal pathway in this AOA system is the nitrification–denitrification process. During the start-up period, the anaerobic phosphorus release of the AOA reactor was slightly less intense than that of the AOA–MBR reactor, and the PHB consumption per unit mass of the activated sludge in the anaerobic zone of the former was 7.53 mg g−1 MLSS (Fig. 2i), which was also lower than that of the latter at 15.31 mg g−1 MLSS (Fig. 2j), indicating that the addition of MBR not only enhanced the sludge concentration, but also improved the efficiency of the system for the utilisation of internal carbon sources.
3.2. Operating parameters optimisation
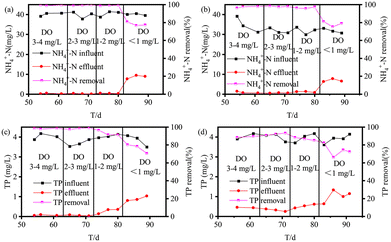
The DO in the aerobic zone and the recycle ratio of the sludge mixture were optimised for both systems in order to optimise the effluent quality and reduce energy consumption.39 The optimal aerobic DO concentration and recycle ratio for the two reactors were identified by investigating the effect of the different aerobic DO concentrations on the removal efficiency of ammonia and total phosphorus and the effect of different recycle ratios on the removal efficiency of ammonia, total nitrogen and total phosphorus.For both AOA–MBR and AOA systems, when the DO concentration in the aerobic zone is too low, the removal efficiency of ammonia nitrogen and total phosphorus of the systems decreased. Both reactors had better ammonia nitrogen removal efficiency when the DO concentration in the aerobic zone was greater than 1 mg L−1, with an average removal rate of 99.20% and 97.25%, respectively (Fig. 3a and b). Both reactors had better total phosphorus removal efficiency when the DO concentration in the aerobic zone was greater than 2 mg L−1, with an average removal rate of 98.41% and 90.41%, respectively (Fig. 3c and d). In terms of nitrogen and phosphorus removal efficiency and energy consumption, the optimum DO concentration in the aerobic zone was determined to be 2–3 mg L−1 for both systems.
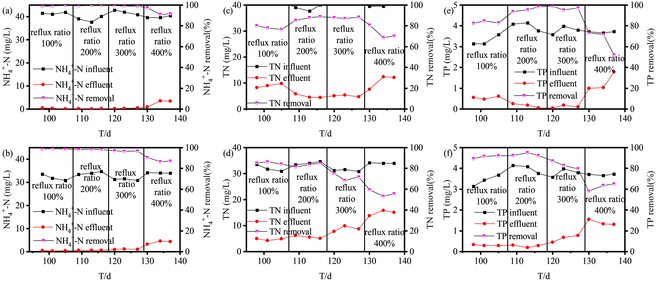
For the AOA–MBR system, due to the high sludge concentration in the system, too small a recycle ratio will lead to excessive consumption of internal carbon sources, too large a recycle ratio will lead to insufficient residence time, and too high a load will lead to nitrogen and phosphorus removal performance being better at a recycle ratio of 200–300%, with an average ammonia removal rate of 99.31% (Fig. 4a), a total nitrogen removal rate of 87.61% (Fig. 4c) and a total phosphorus removal rate of 96.49% (Fig. 4e). The AOA–MBR system was determined to have an optimum sludge mix recycle ratio of 200% in terms of both nitrogen and phosphorus removal efficiencies and operational energy consumption.
For the AOA system, due to the relatively low sludge concentration in the system, a low recycle ratio can make the pollutants fully stay in the system, and its nitrogen and phosphorus removal performance is better at a recycle ratio of 100–200%, with an average removal rate of 97.85% for ammonia nitrogen (Fig. 4b), 84.37% for total nitrogen (Fig. 4d) and 92.21% for total phosphorus (Fig. 4f). The optimum sludge mix recycle ratio for the AOA reactor was determined to be 100%, taking into account both the nitrogen and phosphorus removal efficiencies and operational energy consumption.
3.3. AOA–MBR membrane fouling characteristics and control
The TMP changes during the operation of the membrane module can reflect the fouling of the membrane module in a more intuitive way. Under mode A (4 minutes pumping and 1 minute backwashing), the TMP trends were compared at 12 and 14 h HRT, and the operating mode was changed from mode A to mode B (4 minutes pumping and 1 minute stop) at 14 h HRT to reduce the rate of membrane fouling by decreasing the permeate flux of the membrane effluent (Fig. 5a and b).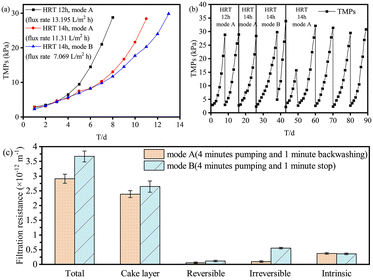 | ||
| Fig. 5 Effect of the membrane flux on the trend of TMP (a), trends in TMP during AOA–MBR operation (b) and the resistance to membrane fouling under different operating conditions (c). | ||
During membrane module operation, membrane fouling resistance is mainly caused by the filter cake layer, and reducing the membrane water flux can effectively slow down the membrane fouling speed, while online backwashing can effectively inhibit the formation of irreversible fouling inside the membrane pores. The total membrane fouling resistance under mode B was 3.667 × 10⁻¹² m−1 (Fig. 5c), which is significantly higher than 2.907 × 10⁻¹² m−1 under mode A. Under optimal operating conditions (mode A), the individual membrane fouling cycle is 10−11 days, and the TMP increases in a “two-stage” trend. From days 5 and 6 onwards, the TMP increased at a faster rate, and the total membrane fouling resistance was 2.907 × 10⁻¹² m−1, of which the cake layer resistance was 2.387 × 10⁻¹² m−1, accounting for 82.11% of the total resistance.
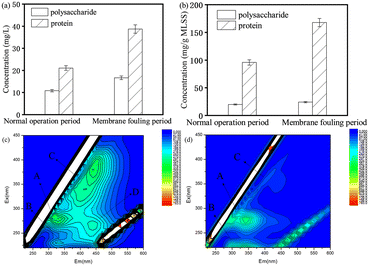
The contents of the main membrane fouling substances, SMP and EPS, were measured, and the results showed that the concentrations of both substances increased at the late stage of the operation when the membrane fouling was serious compared with the early stage of operation, with the concentrations of polysaccharides and proteins in SMP increasing respectively from 10.833 mg L−1 and 21.101 mg L−1 to 16.648 mg L−1 and 38.733 mg L−1 (Fig. 6a). The concentrations of polysaccharides and proteins in EPS increased from 19.904 mg g−1 MLSS and 95.699 mg g−1 MLSS to 24.08 mg g−1 MLSS and 167.71 mg g−1 MLSS (Fig. 6b), respectively. The concentrations of polysaccharides and proteins in EPS increased respectively, and the protein concentration exceeded the polysaccharide concentration during membrane contamination. In the case of SMP, the protein content is higher because the microorganism is in a nutrient-poor environment and consumes some of the polysaccharides for vital activities, while EPS is mainly protein-based. The 3D-EEM fluorescence spectroscopy characterisation shows that SMP contains tryptophan-like proteins, aromatic proteins, humic acid-like substances and fulvic acid-like substances (Fig. 6a), whereas in EPS, the intensity of the characteristic peaks of tryptophan-like proteins and aromatic proteins is high, compared to those in the presence of polysaccharides but not obvious (Fig. 6b).
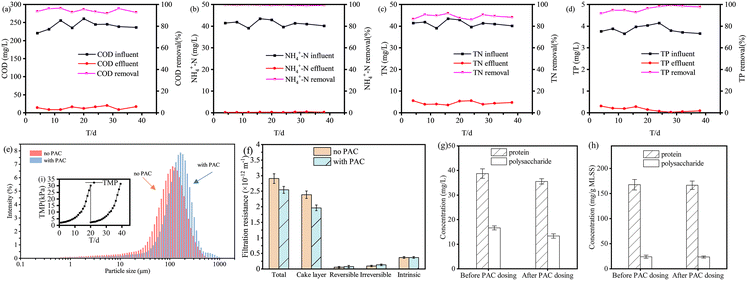
To mitigate membrane fouling during the operation of the AOA–MBR system, flocculant PAC is added to the reactor. The optimum dosage of PAC was determined by the shaking bottle experiment to be 200 mg L−1. The average COD, ammonia, total nitrogen and total phosphorus removal rates after PAC dosing were 94.27%, 99.35%, 90.88% and 95.98% respectively (Fig. 7a–d), which were basically the same as before dosing. The individual membrane fouling cycle is extended to 19–20 days. The analysis of the membrane fouling resistance showed that the resistance of the cake layer was reduced from 2.387 × 10⁻¹² m−1 to 1.965 × 10⁻¹² m−1 without significant irreversible membrane pore resistance (Fig. 7f), and the average sludge particle size increased from 122.1 μm to 161.1 μm (Fig. 7e). The content of polysaccharides and proteins in the main membrane contaminant SMP was reduced by 19.76% and 8.21%, respectively (Fig. 7g), while the two components of EPS remained almost unchanged (Fig. 7h). According to Ding et al.,40 the concentration of SMP was closely related to the rate of membrane fouling. The addition of PAC caused some colloidal, SMP and particulate matter to flocculate into macromolecules, which reduced the amount of membrane contaminants and also acted to loosen the filter cake layer, thus slowing down the rate of membrane fouling.
Conclusions
In this study, a coupled AOA–MBR process was constructed in the form of an anaerobic MBR, which was significantly more effective than the AOA process alone in treating low-C/N wastewater, especially in denitrification, and the MBR resulted in a significant increase in the sludge concentration in the AOA system, which in turn enhanced the carbon storage and endogenous denitrification in the system. After initial start-up and optimisation of some parameters, further treatment of COD, ammonia nitrogen and total phosphorus is carried out without an additional carbon source. Membrane fouling during system operation is mainly caused by the surface filter cake layer, which can be effectively slowed down by online backwashing and the addition of flocculant PAC. Due to its relatively low cost and simple retrofit operation process, the AOA process has great research value and application potential in the field of high-standard treatment processes for low C/N wastewater with MBR as the upgrading direction.Conflicts of interest
There are no conflicts to declare.Acknowledgements
This work was supported by the China Postdoctoral Science Foundation (Grand No. 2015M581456).References
- J. Chen, Y. Xu, Y. Li, J. Liao, J. Ling, J. Li and G. Xie, Effective removal of nitrate by denitrification re-enforced with a two-stage anoxic/oxic (A/O) process from a digested piggery wastewater with a low C/N ratio, J. Environ. Manage., 2019, 240, 19–26 CrossRef CAS.
- Y. Huang, Y. Peng, D. Huang, J. Fan and R. Du, Enhanced Nitrogen Removal from Domestic Wastewater by Partial-Denitrification/Anammox in an Anoxic/Oxic Biofilm Reactor, Processes, 2022, 10(1), 1–15 CrossRef.
- Y. Li, Y. Wu, S. Wang and L. Jia, Effect of organic loading on phosphorus forms transformation and microbial community in continuous-flow A2/O process, Water Sci. Technol., 2021, 83, 2640–2651 CrossRef CAS PubMed.
- W. Zhao, Y. Peng, M. Wang, Y. Huang and X. Li, Nutrient removal and microbial community structure variation in the two-sludge system treating low carbon/nitrogen domestic wastewater, Bioresour. Technol., 2019, 294, 122161 CrossRef CAS.
- A. Mohseni-Bandpi and D. J. Elliott, Groundwater denitrification with alternative carbon sources, Water Sci. Technol., 1998, 38, 237–243 CrossRef CAS.
- S. Warneke, L. A. Schipper, M. G. Matiasek, K. M. Scow, S. Cameron, D. A. Bruesewitz and I. R. McDonald, Nitrate removal, communities of denitrifiers and adverse effects in different carbon substrates for use in denitrification beds, Water Res., 2011, 45, 5463–5475 CrossRef CAS PubMed.
- Z. H. Abu Ghararah, Biological denitrification of high nitrate water: Influence of type of carbon source and nitrate loading, J. Environ. Sci. Health, Part A: Environ. Sci. Eng. Toxic Hazard. Subst. Control, 1996, 31, 1651–1668 CrossRef.
- S. Liu, G. T. Daigger, B. Liu, W. Zhao and J. Liu, Enhanced performance of simultaneous carbon, nitrogen and phosphorus removal from municipal wastewater in an anaerobic-aerobic-anoxic sequencing batch reactor (AOA-SBR) system by alternating the cycle times, Bioresour. Technol., 2020, 301, 122750 CrossRef CAS PubMed.
- Q. He, J. Liu, Y. Peng, X. Li and Q. Zhang, Realization of partial nitrification and in-situ anammox in continuous-flow anaerobic/aerobic/anoxic process with side-stream sludge fermentation for real sewage, Bioresour. Technol., 2022, 346, 126520 CrossRef CAS.
- Q. Dan, Y. Peng, B. Wang, Q. Wang and T. Sun, Side-stream phosphorus famine selectively strengthens glycogen accumulating organisms (GAOs) for advanced nutrient removal in an anaerobic-aerobic-anoxic system, Chem. Eng. J., 2021, 420, 129554 CrossRef CAS.
- X. Gao, T. Zhang, B. Wang, Z. Xu, L. Zhang and Y. Peng, Advanced nitrogen removal of low C/N ratio sewage in an anaerobic/aerobic/anoxic process through enhanced post-endogenous denitrification, Chemosphere, 2020, 252, 126624 CrossRef CAS PubMed.
- W. Zhao, Y. Huang, M. Wang, C. Pan, X. Li, Y. Peng and B. Li, Post-endogenous denitrification and phosphorus removal in an alternating anaerobic/oxic/anoxic (AOA) system treating low carbon/nitrogen (C/N) domestic wastewater, Chem. Eng. J., 2018, 339, 450–458 CrossRef CAS.
- X. Xu, G. Liu and L. Zhu, Enhanced denitrifying phosphorous removal in a novel anaerobic/aerobic/anoxic (AOA) process with the diversion of internal carbon source, Bioresour. Technol., 2011, 102, 10340–10345 CrossRef CAS.
- M. Bagheri and S. A. Mirbagheri, Critical review of fouling mitigation strategies in membrane bioreactors treating water and wastewater, Bioresour. Technol., 2018, 258, 318–334 CrossRef CAS PubMed.
- K. Xiao, S. Liang, X. Wang, C. Chen and X. Huang, Current state and challenges of full-scale membrane bioreactor applications: A critical review, Bioresour. Technol., 2019, 271, 473–481 CrossRef CAS PubMed.
- P. Krzeminski, L. Leverette, S. Malamis and E. Katsou, Membrane bioreactors – A review on recent developments in energy reduction, fouling control, novel configurations, LCA and market prospects, J. Membr. Sci., 2017, 527, 207–227 CrossRef CAS.
- R. Pagotto, Jr., R. Rossetto, R. L. P. Gasperi, J. P. Andrade, J. Trovati, M. V. G. Vallero, A. Okumura and B. Arntsen, SANASA Capivari II – the first full-scale municipal membrane bioreactor in Latin America, Water Sci. Technol., 2014, 70, 272–278 CrossRef.
- M. Harb and P.-Y. Hong, Molecular-based detection of potentially pathogenic bacteria in membrane bioreactor (MBR) systems treating municipal wastewater: a case study, Environ. Sci. Pollut. Res., 2017, 24, 5370–5380 CrossRef CAS PubMed.
- H. Siegrist and A. Joss, Review on the fate of organic micropollutants in wastewater treatment and water reuse with membranes, Water Sci. Technol., 2012, 66, 1369–1376 CrossRef CAS.
- Z. Wang and Z. Wu, A Review of Membrane Fouling in MBRs: Characteristics and Role of Sludge Cake Formed on Membrane Surfaces, Sep. Sci. Technol., 2009, 44, 3571–3596 CrossRef CAS.
- W. Song, H. You, Z. Li, F. Liu, P. Qi, F. Wang and Y. Li, Membrane fouling mitigation in a moving bed membrane bioreactor combined with anoxic biofilter for treatment of saline wastewater from mariculture, Bioresour. Technol., 2017, 243, 1051–1058 CrossRef CAS.
- E. Bouhabila, R. Ben Aim and H. Buisson, Fouling characterization in membrane bioreactors, Sep. Purif. Technol., 2001, 22–23, 123–132 CrossRef.
- F. Meng, S. Zhang, Y. Oh, Z. Zhou, H.-S. Shin and S.-R. Chae, Fouling in membrane bioreactors: An updated review, Water Res., 2017, 114, 151–180 CrossRef CAS.
- H. He, X. Xin, W. Qiu, D. Li, Z. Liu and J. Ma, Role of nano-Fe3O4 particle on improving membrane bioreactor (MBR) performance: Alleviating membrane fouling and microbial mechanism, Water Res., 2022, 209, 117897 CrossRef CAS.
- P. K. Gkotsis, E. L. Batsari, E. N. Peleka, A. K. Tolkou and A. I. Zouboulis, Fouling control in a lab-scale MBR system: Comparison of several commercially applied coagulants, J. Environ. Manage., 2017, 203, 838–846 CrossRef CAS.
- S. Tang, J. Li, Z. Zhang, B. Ren and X. Zhang, Comparison of long-term ceramic membrane bioreactors without and with in-situ ozonation in wastewater treatment: Membrane fouling, effluent quality and microbial community, Sci. Total Environ., 2019, 652, 788–799 CrossRef.
- M. B. Asif, C. Li, B. Ren, T. Maqbool, X. Zhang and Z. Zhang, Elucidating the impacts of intermittent in-situ ozonation in a ceramic membrane bioreactor: Micropollutant removal, microbial community evolution and fouling mechanisms, J. Hazard. Mater., 2021, 402, 123730 CrossRef CAS PubMed.
- Y. Chen, Q. Sheng, J. Wei, Q. Wen, D. Ma, J. Li, Y. Xie, J. Shen and X. Sun, Novel strategy for membrane biofouling control in MBR with nano-MnO2 modified PVDF membrane by in-situ ozonation, Sci. Total Environ., 2022, 808, 151996 CrossRef CAS.
- B. Ren, C. Li, X. Zhang and Z. Zhang, Fe(II)-dosed ceramic membrane bioreactor for wastewater treatment: Nutrient removal, microbial community and membrane fouling analysis, Sci. Total Environ., 2019, 664, 116–126 CrossRef CAS PubMed.
- S. Tang, Z. Zhang and X. Zhang, Coupling in-situ ozonation with ferric chloride addition for ceramic ultrafiltration membrane fouling mitigation in wastewater treatment: Quantitative fouling analysis, J. Membr. Sci., 2018, 555, 307–317 CrossRef CAS.
- W. Chen, P. Westerhoff, J. A. Leenheer and K. Booksh, Fluorescence Excitation−Emission Matrix Regional Integration to Quantify Spectra for Dissolved Organic Matter, Environ. Sci. Technol., 2003, 37, 5701–5710 CrossRef CAS.
- Z. Arshad, T. Maqbool, K. H. Shin, S.-H. Kim and J. Hur, Using stable isotope probing and fluorescence spectroscopy to examine the roles of substrate and soluble microbial products in extracellular polymeric substance formation in activated sludge process, Sci. Total Environ., 2021, 788, 147875 CrossRef CAS PubMed.
- X. Cheng, C. Hou, P. Li, C. Luo, X. Zhu, D. Wu, X. Zhang and H. Liang, The role of PAC adsorption-catalytic oxidation in the ultrafiltration performance for treating natural water: Efficiency improvement, fouling mitigation and mechanisms, Chemosphere, 2021, 284, 131561 CrossRef CAS PubMed.
- Z. Huang, P. B. Gedalanga, P. Asvapathanagul and B. H. Olson, Influence of physicochemical and operational parameters on Nitrobacter and Nitrospira communities in an aerobic activated sludge bioreactor, Water Res., 2010, 44, 4351–4358 CrossRef CAS PubMed.
- J. Ding, X. Gao, Y. Peng, Y. Peng, Q. Zhang, X. Li and S. Wang, Anaerobic duration optimization improves endogenous denitrification efficiency by glycogen accumulating organisms enhancement, Bioresour. Technol., 2022, 348, 126730 CrossRef CAS PubMed.
- J. Li, Y. Wang, J. Liu, Y. Peng, L. Zhang and J. Lin, Intensified nitrogen removal by endogenous denitrification in a full-scale municipal wastewater treatment plant, Environ. Res., 2022, 205, 112564 CrossRef CAS.
- M. Ni, Y. Chen, Y. Pan, Y. Huang, D.-P. Li, L. Li, B. Huang and Z. Song, Study on community structure and metabolic mechanism of dominant polyphosphate-accumulating organisms (PAOs) and glycogen-accumulating organisms (GAOs) in suspended biofilm based on phosphate recovery, Sci. Total Environ., 2022, 815, 152678 CrossRef CAS.
- C. Fernández-Dacosta, J. A. Posada and A. Ramirez, Techno-economic and carbon footprint assessment of methyl crotonate and methyl acrylate production from wastewater-based polyhydroxybutyrate (PHB), J. Cleaner Prod., 2016, 137, 942–952 CrossRef.
- K. Nam, S. Heo, G. Rhee, M. Kim and C. Yoo, Dual-objective optimization for energy-saving and fouling mitigation in MBR plants using AI-based influent prediction and an integrated biological-physical model, J. Membr. Sci., 2021, 626, 119208 CrossRef CAS.
- Y. Ding, Y. Tian, Z. Li, F. Liu and H. You, Characterization of organic membrane foulants in a forward osmosis membrane bioreactor treating anaerobic membrane bioreactor effluent, Bioresour. Technol., 2014, 167, 137–143 CrossRef CAS PubMed.
| This journal is © The Royal Society of Chemistry 2023 |

