
 Open Access Article
 This Open Access Article is licensed under a
 Creative Commons Attribution 3.0 Unported Licence
Monoethanolamine decay mediated by photolysis of nitrate in atmospheric particles: a brown carbon and organic phase formation pathway†
Xiaomeng
Tian
 ab,
Ruifeng
Zhang
ab,
Bo
Wei
ac,
Yalin
Wang
d,
Yongjie
Li
d and
Chak K.
Chan‡
*ab
ab,
Ruifeng
Zhang
ab,
Bo
Wei
ac,
Yalin
Wang
d,
Yongjie
Li
d and
Chak K.
Chan‡
*ab
aSchool of Energy and Environment, City University of Hong Kong, Tat Chee Avenue, Kowloon, Hong Kong, China. E-mail: chak.chan@kaust.edu.sa
bCity University of Hong Kong Shenzhen Research Institute, Shenzhen 518057, China
cEnvironment Research Institute, Shandong University, Qingdao 266237, P. R. China
dDepartment of Civil and Environmental Engineering, Centre for Regional Oceans, Faculty of Science and Technology, University of Macau, Macau 999078, China
First published on 1st September 2023
Abstract
The massive industrial release of monoethanolamine (MEA) into the atmosphere highlights MEA as a potential environmental risk. Nitrate (NO3−) is one of the most abundant inorganic compounds and has been found to co-exist with amines in ambient particles. The photolysis of NO3− can produce oxidants (OH radicals, NO2, O(3P), and N(III)), which lead to particulate MEA decay. Furthermore, MEA degradation products are likely to yield brown carbon (BrC) due to the formation of carbonyl species. Here, we investigated the aging of MEA-containing particles mediated by NO3− photolysis. Particles under different relative humidity (RH) and initial pH conditions were irradiated with 300 nm UV light. After reactions, the more acidic particles (MEA![[thin space (1/6-em)]](https://www.rsc.org/images/entities/char_2009.gif) :H2SO4:NaNO3:HNO3 molar ratio = 4:1:1:3 and 4:0.75:1:3) show an increase in pH, while the 4:0.5:1:3 particles show a decrease in pH. We attributed these contrary pH changes to the combined results of HONO evaporation which increases the pH against MEA reactions which decreases the pH. NO3− and MEA decay rates are more sensitive to the initial pH than RH. Unlike the monotonically slow decay trends at all RH for the 4:0.5:1:3 particles, NO3− and MEA in more acidic 4:1:1:3 and 4:0.75:1:3 particles decay rapidly in the first few hours but followed by a slower decay. MEA reaction mechanisms in the presence of oxidants produced from NO3− photolysis were proposed by combining quantum chemistry computations and speciation of the products. Furthermore, water-soluble BrC and an organic phase were formed as potential secondary organic aerosols (SOAs). This study reveals the particulate sink of MEA and its potential in BrC and SOA formation mediated by NO3− photolysis in the atmosphere, which may give a new insight into the aging of amines in atmospheric aerosols.
:H2SO4:NaNO3:HNO3 molar ratio = 4:1:1:3 and 4:0.75:1:3) show an increase in pH, while the 4:0.5:1:3 particles show a decrease in pH. We attributed these contrary pH changes to the combined results of HONO evaporation which increases the pH against MEA reactions which decreases the pH. NO3− and MEA decay rates are more sensitive to the initial pH than RH. Unlike the monotonically slow decay trends at all RH for the 4:0.5:1:3 particles, NO3− and MEA in more acidic 4:1:1:3 and 4:0.75:1:3 particles decay rapidly in the first few hours but followed by a slower decay. MEA reaction mechanisms in the presence of oxidants produced from NO3− photolysis were proposed by combining quantum chemistry computations and speciation of the products. Furthermore, water-soluble BrC and an organic phase were formed as potential secondary organic aerosols (SOAs). This study reveals the particulate sink of MEA and its potential in BrC and SOA formation mediated by NO3− photolysis in the atmosphere, which may give a new insight into the aging of amines in atmospheric aerosols.
Environmental significanceMonoethanolamine (MEA) is used in various industrial processes including CO2 capture and it is inevitably released into the atmosphere as leaks. Near-source concentrations of MEA can reach the ppm level, highlighting the potential environmental risk of MEA. In this study, we investigated the fate of particulate MEA during nitrate photolysis, and found that particle pH was significantly altered during the process. This study also revealed the potential of particulate MEA to form brown carbon (BrC) and secondary organic aerosols (SOAs) during nitrate photolysis. These findings may provide insights into the understanding of atmospheric sink and aging of amines. |
1 Introduction
The semi-volatile monoethanolamine (MEA) finds wide industrial application as a feedstock chemical,1,2 a corrosion inhibitor,3,4 and an acidic gas scrubber (e.g., for H2S and CO2).5–8 In CO2 sequestration, it has been estimated that about 80 kg of gas-phase MEA is emitted for removing every ton of CO2, resulting in parts per million (ppm) levels of near-source concentration.9–11 Gaseous MEA can effectively contribute to new particle formation and the aging of pre-existing ambient particles,12,13 and it also can undergo gas-phase oxidation to produce hazardous species such as formamide and formaldehyde.14–17 Particulate MEA, on the other hand, is one of the most abundant amine species in ambient aerosols, in the concentration range of 0.26–15.31 ng m−3.18,19 A recent field study,20 however, observed that the particulate concentrations of alkyl amines in marine air along the coastline of eastern China were lower than those predicted from a thermodynamic model. These results suggest potential chemical sinks of amines in atmospheric particles via particle-phase reactions, which has not been accounted for in models.With a pH value of −1 to 7 in ambient aerosol particles,21,22 particulate MEA (pKa = 9.5) is predominantly in the protonated form,21,23,24 instead of the neutral form as in the gas phase. The electrophilic OH radicals react more efficiently with the neutral forms of amines than with the protonated forms in the aqueous phase.25,26 Therefore, the mechanisms and kinetics of particulate MEA oxidation may differ from those in the gas phase. Moreover, the oxidation of aqueous alkyl amine produces carbonyl, and thus further reactions between the amine functional group and carbonyl group can form potentially brown carbon (BrC).27–32
As one of the most abundant inorganic compounds in the atmosphere,33 nitrate (NO3−) can co-exist with amines in ambient particles.34,35 The photochemically active NO3− can be photolyzed to produce a series of oxidants, including OH radicals, NO2, O(3P), and N(III) (NO2−/HNO2).36 These oxidants increase the atmospheric oxidative capacity and promote the transformation of precursors into secondary aerosols.37–39 Our earlier studies reported the formation of secondary aerosols via oxidation of SO2 and glyoxal promoted by particulate NO3− photolysis.38–41 In particular, Zhang et al.38 found an enhanced photodegradation of glyoxal in the presence of nitrate (i.e., NaNO3 + glyoxal) under irradiation compared to its absence (i.e., Na2SO4 + glyoxal). Thus, we hypothesize that NO3− photolysis may also contribute to the decay of particulate MEA in the atmosphere, and MEA may show BrC formation potential due to the possibility of carbonyl formation as the oxidation product. To the best of our knowledge, no study has investigated the fate of particulate amine and its photooxidation products contributing to BrC formation during nitrate photolysis.
The formation of OH radicals from both N(III) photolysis and MEA oxidation by OH radicals is pH dependent.42 Furthermore, several studies found that the aging of secondary organic aerosols (SOAs) are highly dependent on relative humidity (RH).43–46 Herein, we investigate the particle phase reactions of MEA during NO3− photolysis under conditions of different initial pH and RH values. Decays of NO3− and MEA as functions of initial pH and RH values are characterized by Raman spectroscopy. Product characterization is performed by Ion Chromatography, Mass Spectrometry and Ca(OH)2 solution, information from which is used to deduce reaction mechanisms that were further supported by quantum chemistry computation. The formation of BrC as well as an organic phase during the reactions is also inferred from spectroscopic and microscopic measurements. Finally, implications on the chemical fate of particulate MEA, as well as those on atmospheric chemistry and global climate, are discussed.
2 Materials and methods
2.1 Materials
The solutions used in this study were prepared by mixing monoethanolamine (MEA, 99.5%, Sigma-Aldrich), sulfuric acid (H2SO4, 95.0%, Acros Organics), sodium nitrate (NaNO3; 99.5%, Sigma-Aldrich), and nitric acid (HNO3, 69.0–70.0%, AQA) at different molar ratios, i.e., MEA:H2SO4:NaNO3:HNO3 = 4:0.5:1:3, 4:0.75:1:3, and 4:1:1:3. Under all conditions, MEA was predominantly in the protonated form. Hereafter, we abbreviated particles generated from these solutions as a:b:c:d particles. All chemicals were used without further purification.
2.2 Photooxidation of MEA, in situ Raman characterization and offline product characterization
The photooxidation experiments were performed in a custom-made photochemical flow cell. Raman spectroscopy was utilized to in situ characterize the variation of particle composition, as depicted in Fig. S1.† Detailed descriptions of the in situ Raman spectroscopy/flow cell were given in our previous studies.38–41 In brief, the premixed solution was atomized using a particle generator (model 201, Uni-Photon, Inc.), and the resulting particles were collected onto a transparent hydrophobic substrate (model 5793, YSI, Inc.). RH in the flow cell was controlled by adjusting the ratio of dry and wet synthetic air flow rates. Particles were equilibrated at a given RH for 30 min before the light was on. NO3− photolysis was initiated using 300 nm UV irradiation (300 nm light-emitting diode lamp, M300L4, Thorlabs). The photon flux received by particles was ∼2 × 10¹⁵ photons cm−2 s−1.7,8 Raman features at ∼979, ∼1049, and ∼3400 cm−1 are assigned to v(SO42−), v(NO3−), and v(OH) from both water and MEA, respectively. The Raman peak at ∼867 cm−1 is assigned to v(C–C) in MEA48 and was used to characterize the decay of MEA during the reactions quantitively.Photochemical reactions changed the composition and hence the water content of the particles. The absolute Raman peak area measurement was influenced by the concentration of the species as well as the laser intensity. Therefore, we used sulfate (SO42−) as an internal standard to eliminate such effects. NO3− and MEA peak areas (A(NO3−) and A(MEA)) were normalized by the SO42− peak area (A(SO42−)) in determining the molar ratios of NO3− and MEA to SO42− (n(NO3−)/n(SO42−) and n(MEA)/n(SO42−)). However, v(HSO4−) at ∼1050 cm−1 overlaps with v(NO3−) at∼1049 cm−1. Furthermore, since the pKa of bisulfate (HSO4−) is 1.96, HSO4− formed from SO42− at low pH complicates the calculation of the molar ratios of NO3− and MEA to SO42−. To resolve such complications, we obtained the HSO4− to SO42− peak area ratio (A(HSO4−)/A(SO42−)) as a function of pH calculated by E-AIM from a set of NO3−-free solutions. Detailed calculations of MEA, NO3−, HSO4−, and SO42− are presented in the ESI (Text S4†). Ion Chromatography (IC, Dionex ICS-1100) and Mass Spectrometry (Thermo Scientific Dionex Ultimate 3000 UHPLC system with a Thermo Q Exactive Focus Orbitrap-Quadrupole mass spectrometer, UHPLC-MS) were applied for the detection of photooxidation products of MEA. Detailed information for IC and UHPLC-MS measurement is described in Text S1–3.†
3 Results and discussion
3.1 Photodegradation of MEA and NO3− under irradiation
The photolysis of particles at different RH and pH upon 24 h irradiation exposure was investigated. Triplicate experiments were conducted under each set of experimental conditions. Fig. S2† shows an example of the time evolution of the Raman spectra for the photolyzed 4:0.5:1:3 particles normalized by the peak intensity of v(SO42−) at 70% RH. Both the NO3− and MEA peaks decreased over irradiation time. Fig. 2 shows a significant photodegradation of NO3− and MEA in all studied particles under irradiation. Dark control experiments for the 4:0.5:1:3 particles at 40% RH (initial pH = 6.23) and 70% RH (pH = 6.94) showed no observable decrease in NO3− or MEA (Fig. S3†). Hence, we excluded the possibility of MEA evaporation or reaction with NO3− for the MEA decay. The observed MEA consumption under light was attributed to the photochemical reactions of MEA.
We studied the effect of pH on the decay rate of NO3− and MEA first. Although the initial pH of the 4:0.5:1:3 particles was RH-dependent, it varied only from 6.23 to 6.94 in different experiments (Fig. 1). To have a larger range in the initial pH, H2SO4 was added to the solution to generate 4:1:1:3 and 4:0.75:1:3 particles with an initial pH of 0.16 and 0.92, respectively. Fig. 2 shows the amount of NO3− and MEA normalized to their initial values (n(NO3−)t/n(NO3−)0 and n(MEA)t/n(MEA)0) during NO3− photolysis under different RH and pH conditions. Overall, NO3− and MEA decay rates are more sensitive to the initial pH (Fig. 2a and b) than to RH (Fig. 2c and d). Both NO3− and MEA decay of 4:0.5:1:3 particles show a weak dependence on RH as shown in Fig. 2c and d. This is likely the result of competing factors such as higher reactant concentrations and more volatile products such as glyoxal (CHOCHO, one of the MEA oxidation products, which will be discussed in the next section) but lower diffusivity of reactants at low RH.30,40,44 Unlike the monotonically slow decay trends at all RH for the 4:0.5:1:3 particles, NO3− and MEA in more acidic (4:1:1:3 and 4:0.75:1:3) particles decay rapidly in the first few hours but followed by a slower decay with a comparable decay rate to 4:0.5:1:3 particles, as will be discussed in detail next. We focus on the effect of pH on the decay of NO3− and MEA in the later discussion.
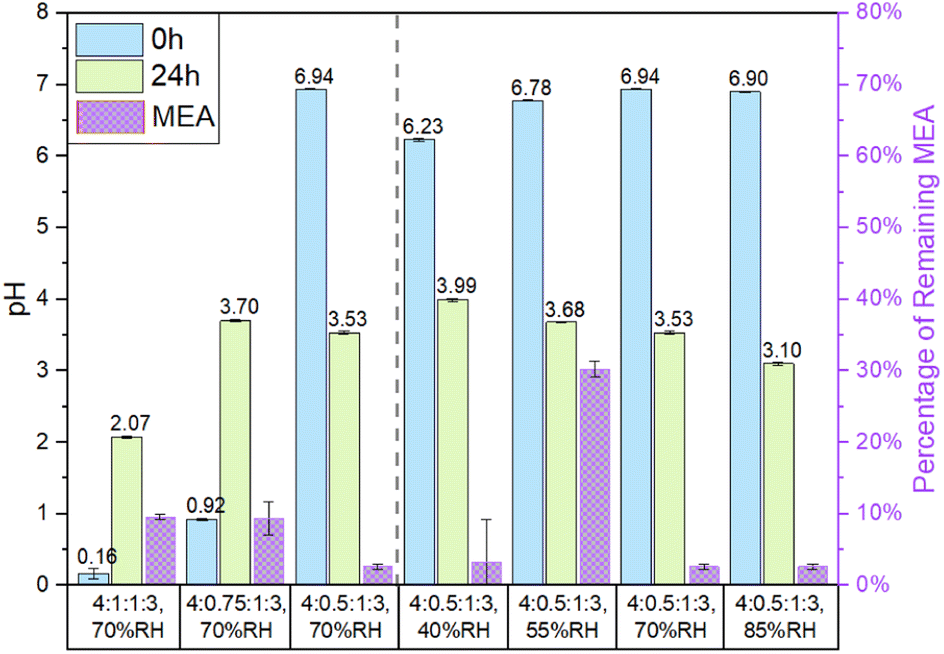 | ||
| Fig. 1 The pH of particles before (0 h) and after (24 h) the experiment and the percentage of MEA remaining after the experiment. The percentage of MEA remaining for the 4:0.5:1:3 particles at 40% RH was calculated by using the fitting equation obtained from data in Fig. 2d. Left of the dashed line shows the ascending pH of the particle at 70% RH. Right of the dashed line shows ascending RH for 4:0.5:1:3 particles. Error bars represent one standard deviation from triple measurements. | ||
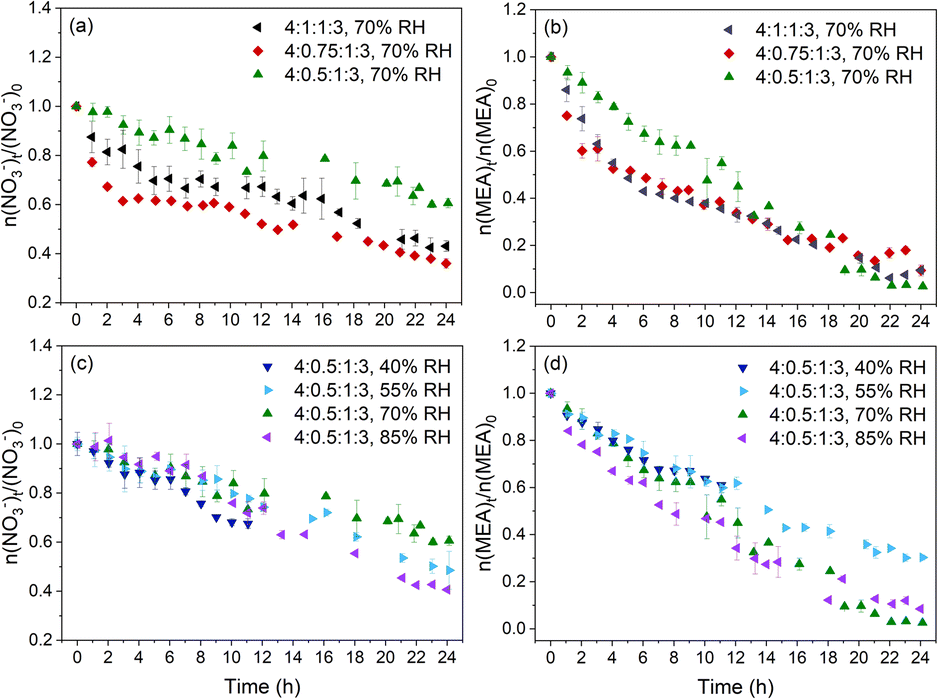 | ||
| Fig. 2 Changes of NO3− and MEA during NO3− photolysis under different RH and pH conditions, and error bars represent standard deviations obtained from triplet experiments. (a and b) Molar ratio of NO3− and MEA, n(NO3−)t/n(NO3−)0 and n(MEA)t/n(MEA)0, as a function of irradiation time under various pH conditions respectively; (c and d) n(NO3−)t/n(NO3−)0 and n(MEA)t/n(MEA)0, as a function of irradiation time under various RH conditions respectively. Phase change occurred during photolysis experiments at 40% RH and hence only the first 11 h data were used for analysis. | ||
:1:1:3 and 4:0.75:1:3 particles show an increase of pH after the reactions from 0.16 and 0.92 to 2.07 and 3.70, respectively, while the 4:0.5:1:3 particles show a decrease of pH from 6.94 to 3.10. It is interesting to note that the particle pH after the experiment did not show a dependence on the amount of remaining MEA in the particles.
Here we attempt to explain the observed trends of pH based on the roles of free H+ in MEA oxidation under NO3− photolysis. The NO3− photolysis pathways at pH < 7 in the presence of an OH scavenger (MEA and its oxidation products, denoted as Org) under 300 nm irradiation is summarized in Scheme 1.36,49–52 On the one hand, free H+ plays a role in the formation of OH radicals during the NO3− photolysis (R1 and R4). Subsequently, OH radicals initiate the oxidation of MEA and its oxidation products in the presence of O2 and yields hydroperoxyl radicals (HO2) via R6-7. When the particle pH is higher than the pKa of HO2 (4.8), HO2 dissociates into O2− and releases H+ back into the solution. When the pH is higher than the pKa of HONO (3.3) but lower than the pKa of HO2 (4.8), the formed HO2 reacts with NO and NO2via R8 and R9, and ultimately yields NO2−, which also releases H+ back to the solution. Under more acidic conditions of pH < 3.3, R8 and R9 yield HONO instead. The evaporation of HONO removes H+ from the particle and thus increases the particle pH. In conclusion, only when pH is less than 3.3, NO3− photolysis increases the particle pH by the evaporation of HONO.
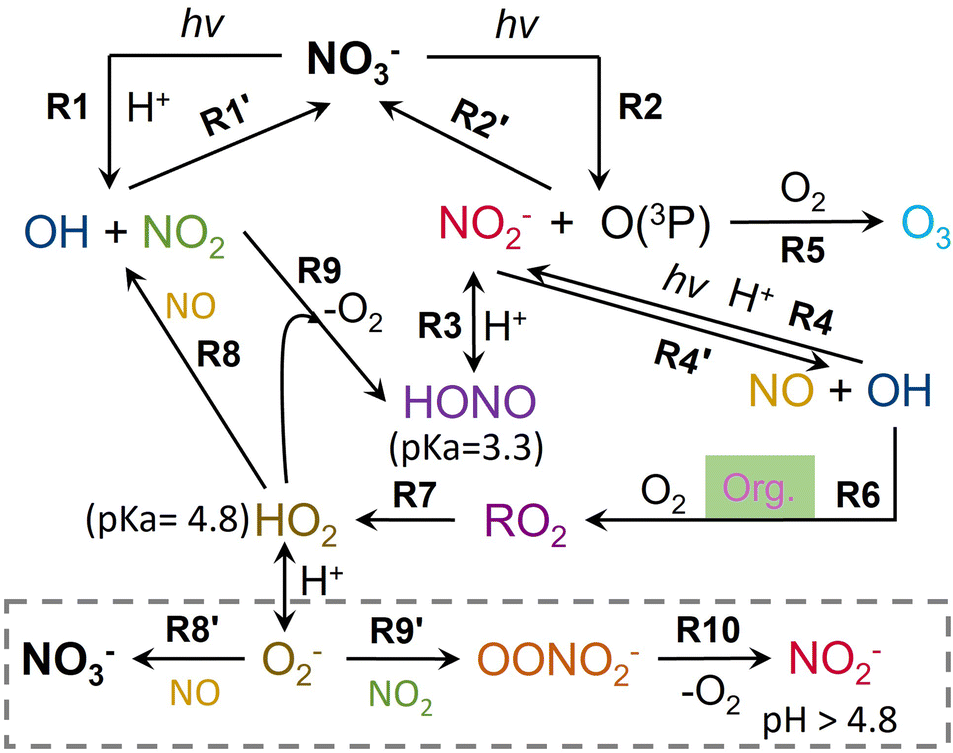 | ||
| Scheme 1 Mechanisms for the NO3− photolysis pathway in the presence of HO2/O2− derived from MEA and its oxidation products in the particles. Org. highlighted in green represents MEA and its oxidation products. The grey dashed box shows the case when the particle pH is higher than the pKa of HO2 (4.8). | ||
On the other hand, some free H+ is also adducted with –NH2 groups in MEA and some of its oxidation products as will be shown in Fig. 3 later. As an ultimate oxidation product of MEA, NH4+ has a lower pKa than alkylamines,13,53 and thus dissociates more H+ back to the solution than alkylamines. Moreover, the reaction of aldehydes with –NH2/NH3, which will be discussed in the following section, leads to the formation of imines (e.g., imidazole). This imine formation promotes the dissociation of –NH3+/NH4+ to –NH2/NH3 and releases H+ back into the solution. Therefore, MEA reactions increase free H+ in the particle and thus decrease the particle pH.
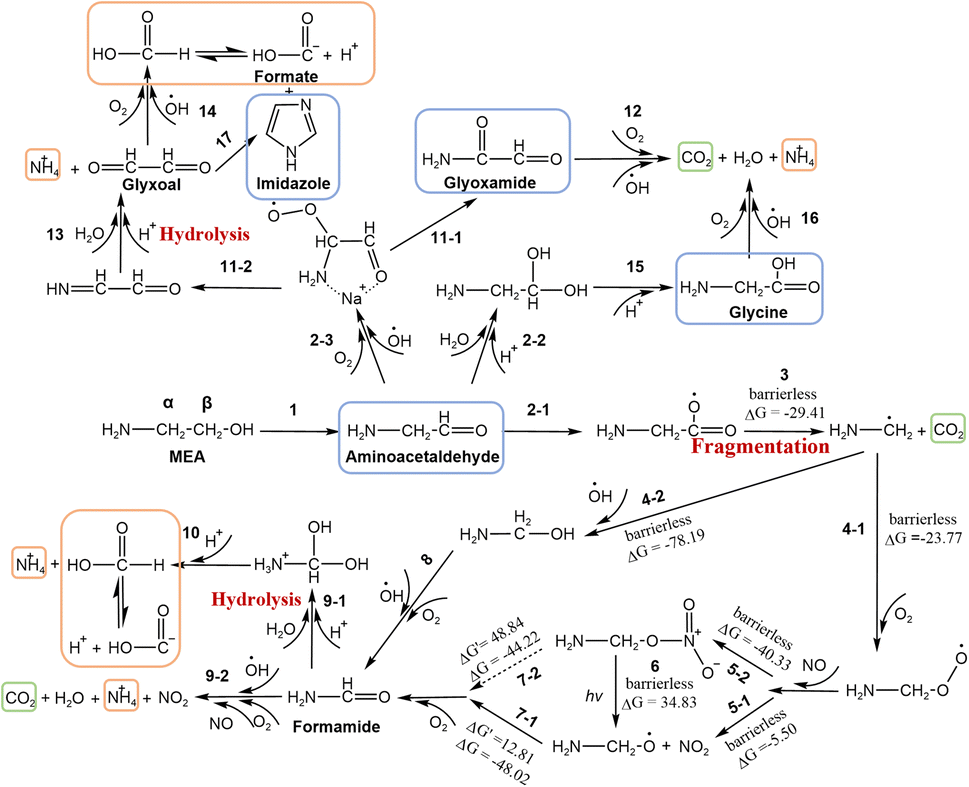 | ||
| Fig. 3 MEA degradation pathways during NO3− photolysis. DFT calculation was applied in the fragmentation process. Products detected by different methods were boxed in orange (IC), blue (UHPLC-MS) and green (Ca(OH)2 solution). The symbols “ΔG′” and “ΔG” denote the energy barrier and Gibbs free energy respectively. The energy unit is kcal mol−1. Noted that due to –NH3+ group dissociation and sodiation effects on amide and amino acid, MEA and its degraded amide and amino acid products in the solution can exist both in the protonated and unprotonated forms. However, the amine group is not involved in most of the MEA degradation reactions. For brevity, we used an unprotonated amine group (–NH2) in the particulate MEA degradation reaction during NO3− photolysis. More detailed pathways for 1, 2-1, 2-2, and 9 are shown in Fig. S6.† α and β on MEA indicate the CH2 position in MEA. | ||
To summarize, the particle pH during the experiment is affected by the HONO evaporation via R3 and MEA reactions. In the more acidic 4:1:1:3 and 4:0.75:1:3 particles, the increase in pH due to enhanced HONO evaporation outweighed the decrease in pH due to MEA reactions, leading to an increase in particle pH after oxidation. In contrast, the pH of the less acidic 4:0.5:1:3 particles decreased in all the photolysis experiments, attributable to the oxidation of MEA and reaction with aldehydes to form BrC since the evaporation of HONO was minimal.
:1:1:3 and 4:0.75:1:3 particles, followed by a slower decay. The 4:0.5:1:3 particles show a monotonically slow decay of NO3−, at a rate much lower than the first stage of decay but comparable to the second stage of decay of the more acidic particles. In the studied pH range, the intrinsic NO3− photolysis rate constants (R1 and R2 in Scheme 1) are independent of pH.51,52 However, N(III) (NO2− and HONO) from NO3− photolysis shows a high pH dependence for further reactions.42,52 At low pH (pH < 3.3), which is likely the case in the first stage for the 4:1:1:3 and 4:0.75:1:3 particles, N(III) evaporates in the form of HONO (R3).51 Besides, the quantum yield of OH radicals by the N(III) photolysis pathway (R4) increases at low pH.42,52 These two reactions inhibited the recombination of photolyzed products to regenerate NO3− (R2′), and thus contributed to the rapid decrease of NO3− in the first few hours. The most acidic 4:1:1:3 particles take a longer time to increase the pH and hence sustain a longer NO3− fast decay period than the 4:0.75:1:3 particles as shown in Fig. S4a and b.† On the other hand, in the 4:1:1:3 and 4:0.75:1:3 particles, the enhanced OH radical formation increased the formation of HO2 (R6-7), which further reacted with NO and NO2 to regenerate the OH radical, NO2 and HONO (R8, R9 and R10). The regeneration of the OH radical and NO2 further promoted the recombination to regenerate NO3− (R1′). Thus, at low pH, the overall NO3− consumption in the presence of HO2 is the combination result of the enhanced NO2− decomposition and HONO evaporation against the enhanced NO3− regeneration. Although there was a higher percentage NO3− loss via NO2− photolysis and HONO evaporation in the 4:1:1:3 particles than in the 4:0.75:1:3 particles, the increased NO3− regeneration outweighed the increased NO3− loss via R3 and R4 in the 4:1:1:3 particles. The combination of NO3− regeneration against NO3− loss resulted in the fastest NO3− decay in the 4:0.75:1:3 particles in the first few hours.
:1:1:3 and 4:0.75:1:3 particles have a two-stage MEA decay and the first-stage decay rates are larger than that of 4:0.5:1:3 particles. The rate of MEA oxidation is affected by both the oxidant concentrations and particle pH. The enhanced formation of OH radicals from NO2− photolysis may cause rapid MEA decay in the first few hours for the 4:1:1:3 and 4:0.75:1:3 particles in Fig. 2b. MEA is considered to be primarily oxidized by OH radicals produced during the NO3− photolysis (as Org. in R6 in Scheme 1). Although the production of OH radicals by NO3− photolysis (R1) is independent of pH as discussed in the previous section, the formation of OH radicals from N(III) (R4) was promoted at low pH in the presence of an OH scavenger.54 Note that the 4:1:1:3 particles have a slightly slower MEA decay than the 4:0.75:1:3 particles. Lee et al.55 reported a decrease in the rate constant of amine oxidation by OH radicals at low pH. Thus, MEA oxidation for the 4:1:1:3 and 4:0.75:1:3 particles involves the enhanced OH quantum yield from the N(III) photolysis pathway (R4) and the impeded MEA oxidation due to the protonation under low pH. The influence of protonation on MEA oxidation was also reflected in the second stage. After the first few hours, the MEA decay rates of the more acidic 4:1:1:3 and 4:0.75:1:3 particles were lower than those of the 4:0.5:1:3 particles under the same RH as shown in Fig. 2b.
It should be noted that O3 was also formed during NO3− photolysis as shown in R5 in Scheme 1. However, O3 mainly reacts with non-protonated amines with electron-donating groups.56 Thus, the contribution of O3 to particulate MEA oxidation in our study is minimal since MEA is fully protonated.
3.2 Photooxidation products and proposed mechanism of MEA reactions during NO3− photolysis
MEA photooxidation is initiated through H abstraction by OH radicals produced from NO3− photolysis. In the gas phase, both C–H bonds of MEA are weakened by –NH2 and OH substituents (electron donation). The OH-initiated oxidation of gas-phase MEA mainly takes place at the two – CH2–, but not at the –NH2 or –OH functional group.15,17,57–59 However, in the aqueous phase, especially at low pH, MEA is predominantly present in the protonated form of MEAH+. The addition of H+ on –NH2 weakens its electron donation ability to the nearby C–H bonds (α position) and hampers the electrophilic attack of OH radicals onto C–H bonds (Fig. S5†). Consequently, OH radicals are more likely to abstract H atoms from the further located C atoms (β-C) of protonated MEA.60 As shown in Fig. S5,† H abstraction by OH radicals from the α-CH2 near –NH2 group (pathway R-1) or the β-CH2 near –OH group (pathway R-2) leads to different reaction pathways and thus different oxidation products.16,17,57 UHPLC-MS analysis of the reacted samples shows that aminoacetaldehyde (NH2CH2CHO), but no glycolamide (NH2COCH2OH), was found, confirming that H abstraction by OH radicals (R-2) is the dominant pathway. This is consistent with the thermodynamic and kinetic considerations of the pathways.17 The detailed formation pathway of these products can be found in Text S6.†In addition, some secondary oxidation products of MEA by OH radicals without C–C cleavage, such as NH2CH2CHO, glyoxamide (NH2COCHO), glycine (NH2CH2COOH) and imidazole (a major product formed from CHOCHO and dissolved NH3,38 step 17), were found in UHPLC-MS analysis. They are shown in blue boxes in Fig. 3 and listed in Table S2.† Among these oxidation products, small aldehydes can form BrC with ammonia and amines, which will be discussed in the BrC formation section. The formation pathways of these oxidation products are proposed here and details can be found in Text S6.†
Besides, small aldehydes, such as NH2CH2CHO formed as the primary oxidation product of MEA, are easily fragmented when reacting with OH radicals.61,62 The characteristic peak of MEA at ∼867 cm−1 decreased during NO3− photolysis (Fig. S2†), also suggesting that the cleavage of C–C bonds in MEA took place in our system. We have confirmed formic acid (HCOOH) and NH4+ as reaction products by IC analysis (boxed in orange in Fig. 3). CO2 (boxed in green in Fig. 3) was also found to be a final product by bubbling the exhaust of the flow cell to a Ca(OH)2 solution. Formate was confirmed as an oxidation product of CHOCHO during NO3− photolysis (step 14) or the byproduct during imidazole formation from CHOCHO with dissolved ammonia (step 17) in our previous work.38,39 Here, we proposed another HCOOH/HCOO− formation pathway through the degradation of NH2CH2CHO to formamide (NH2CHO) (steps 2-1, 3, 4-1/2, 5-1/2, 6, 7-1/2, and 8). HCOOH/HCOO− is formed by the hydrolysis of NH2CHO (steps 9-1 and 10). The Gaussian 16 program based on DFT (Text S5†) was used to fill the remaining reaction pathways from NH2CH2CHO to HCOOH. The calculated thermodynamic (energy barrier, ΔG′) and kinetic (Gibbs free energy, ΔG) values for each step are shown in Fig. 3. Detailed oxidation pathways are described in Text S6.†
3.3 Morphological changes and formation of water-soluble BrC and an organic phase
Fig. S7† shows the particle morphology as a function of irradiation time under various experimental conditions. Particle shrinkage with the decrease of the v(OH) peak was observed under all experimental conditions. It was attributed to the consumption of highly hygroscopic species of NO3− and MEA and the formation of less hygroscopic or volatile photolysis products. These products were analyzed in the following discussion. Also, a phase change of the 4:0.5:1:3 particle at 40% RH occurred after 20 h of irradiation (black dashed box). Phase transition was not observed using particles of other compositions within the RH range studied.
For the data shown in Fig. 2, the selected particles were simultaneously exposed to continuous focused UV and excitation laser irradiation. The excitation laser lasted for ∼1 min for Raman analysis once every hour. There are also neighboring particles that were also irradiated with UV light but were not examined by Raman analysis. It is interesting to note that an organic phase emerged in some of these neighboring particles without Raman analysis under most experimental conditions within 24 h irradiation, while the studied particle under Raman analysis itself did not show such an organic phase (Fig. S8†). The appearance of an organic phase also implied the formation of low-hygroscopicity compounds in the particles. Taking the 4:0.5:1:3 particles at 85% RH as an example, Fig. 4 shows the morphology change of a neighboring particle under 24 h irradiation. An organic phase was formed, and it remained even when the RH was increased to 98% RH, indicating its low solubility. We have also repeated the experiments using 4:0.5:1:3 particles at 85% RH for 24 h UV irradiation and then continually supplied air at the same RH without UV irradiation for another 12 h. Under dark conditions, the organic phase continually emerged and grew in particles, and the particles turned browner and were observable by visual inspection, as shown in Fig. S9.† The results indicate the continued formation of BrC and the organic phase formation in the dark.
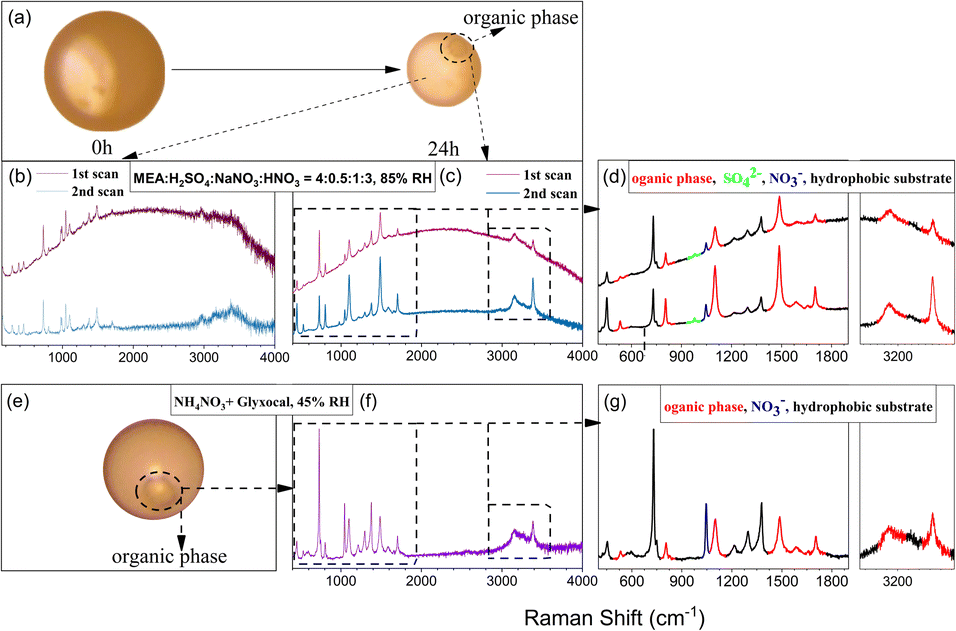 | ||
| Fig. 4 (a) Changes in the particle morphology of 4:0.5:1:3 at 85% RH under 24 h irradiation. (b) Detected Raman signals in the liquid phase at 24 h irradiation of 4:0.5:1:3 particles at 85% RH for the 1st and 2nd scans. (c) Detected Raman signals in the organic phase at 24 h irradiation of particles with 4:0.5:1:3 at 85% RH for the 1st and 2nd scans. (e and f) Morphology and Raman signals of a NH4NO3 + glyoxal particle at 7 h irradiation at 45% RH, respectively. The portion in the dotted frame in (c) and (f) is expanded in (d) and (g) respectively. Raman peaks of the organic phase (red), SO42− (light green), NO3− (blue) and hydrophobic substrate (dark) are marked. | ||
During the irradiation experiment, both Raman spectra from the aqueous and the organic phases in the neighboring particles show the enhancement of a broad Raman background (Fig. 4b and c). We attributed the enhanced background to the 532 nm laser-excited fluorescent emission of light-absorbing brown carbon.31,63,64 This broadband increase of the background was also observed in our previous study of the particulate reaction of glyoxal with ammonium or aminium.27,38 As discussed earlier, carbonyl compounds such as NH2CH2CHO, NH3CHO, and CHOCHO were formed during MEA oxidation. They react readily with amine (Maillard reaction) to form BrC such as imine, imidazole and its derivatives,27,38 and these species were found in our UHPLC-MS analysis and are listed in Table S2.† We also ascertained the BrC formation potential of MEA and its oxidation products (Text S7†). Unlike typical studies on C![[double bond, length as m-dash]](https://www.rsc.org/images/entities/char_e001.gif) N type BrC formation that usually involves two species (carbonyl compounds and amine or ammonia) as precursors,27,64,65 MEA itself shows the BrC formation potential when oxidized.
N type BrC formation that usually involves two species (carbonyl compounds and amine or ammonia) as precursors,27,64,65 MEA itself shows the BrC formation potential when oxidized.
Interestingly, the fluorescence background disappeared in the second Raman scan, which was only ∼30 seconds after the first one, suggesting considerable photobleaching of the formed BrC by the 532 nm Raman laser. To verify whether UV irradiation also contributed to the photobleaching of BrC, we conducted a UV irradiation experiment for 4:0.5:1:3 particles under 85% RH for 24 h without Raman laser exposure during the irradiation. Afterward, Raman scanning was applied to the studied and neighboring particles to check the fluorescence emission under the same Raman laser exposure frequency. As shown in Fig. S10,† although an organic phase is formed, the aqueous phase in the studied particle shows little background enhancement compared with that in the neighboring particle. The results indicate that UV irradiation also contributed to the photobleaching, especially to the water-soluble BrC. However, it should be noted that UV-induced photobleaching was not as significant as that caused by the 532 nm Raman laser. These results explain why the studied particle under regular Raman measurements every 60 minutes with ∼1 min Raman laser exposure each time and focused UV irradiation did not exhibit fluorescence during the NO3− photolysis experiment.
Fig. 4c and d show the Raman characteristic peaks of the organic phase in the particle under UV irradiation for 24 h and then photobleached by the Raman laser by two successive Raman scans within 1 min. The characteristic peaks of the organic phase (marked in red in Fig. 4d) were obvious after the enhanced background was removed, indicating that unlike water-soluble BrC, the so-formed organic phase cannot be removed by the 532 nm laser bleaching. Interestingly, the Raman spectrum of the organic phase in this study is the same as the one obtained from the photolysis of ammonium nitrate (NH4NO3) and glyoxal system in our previous study,38 despite different reactant chemicals and RH used in these two experiments. Zhang et al.38 reported that the formation of the organic phase was attributed to the reactions involving the oxidation of products (i.e., imidazoles), generated from the reaction of CHOCHO with dissolved NH3, mediated by NH4NO3 photolysis. As discussed before, aldehydes and NH4+/NH3+ were found in the oxidation products of MEA. Thus, the organic phase observed in this study might have a similar formation pathway to that in Zhang et al., i.e., the oxidation of BrC leading to the formation of the organic phase. To further confirm this, NO3−-induced, OH radical mediated degradation of BrC was investigated. NaNO3 was added to the brown solution produced by mixing MEA, NH2CHO, CHOCHO, NH2CH2COOH, Na2SO4, (NH4)2SO4 and H2SO4 shown in Fig. S11b† in NO3− photolysis experiments. After 24 h UV irradiation, an organic phase appeared in particles (Fig. S13b†) with the same Raman features (Fig. S14†) as shown in Fig. 4c and f. Therefore, we attributed the organic phase to the oxidation products from the water-soluble BrC. The Raman peaks of the organic phase at ∼450, ∼530, ∼800, ∼1096, ∼1483, ∼1588, and ∼1700, and particularly a distinct sharp peak at ∼3385 cm−1 show the same Raman feature as oxamides (NH2COCONH2) as shown in Fig. S15.† Detailed formation mechanisms from BrC to NH2COCONH2 warrant further investigation.
4 Conclusions
In this study, we investigated particulate MEA decay mediated by NO3− photolysis under different pH and RH conditions and found that the decay of both NO3− and MEA was enhanced in more acidic particles. This result is contrary to the previous kinetic study of amine oxidation by OH radicals from H2O2 in bulk aqueous phase experiments, where a faster amine decay was found in the solution with a higher pH.21,24 Besides the different initial experimental pH and concentration ranges used, NO3− instead of H2O2 was used to produce OH radicals in our study. Different OH radical precursors are primarily attributed to the different amine decay trends. In the above bulk aqueous phase experiments, a large excess of H2O2 was used to ensure a stable OH radical yield during the experiment, and the amine decay rate thus was mainly influenced by the protonation degree of amine. However, in the current particulate MEA oxidation study, the enhanced formation of OH radicals from NO2− photolysis led to enhanced MEA decay under more acidic conditions. As one of the most abundant inorganic compounds in the atmosphere,33 NO3− has been found in the amine-containing ambient particles.34,35 Thus, the contribution of NO3− photolysis in the aging of amine-containing ambient particles should be examined further.This paper reveals that the particle pH was significantly changed during the MEA decay mediated by NO3− photolysis. NO3− photolysis led to an increase in particle pH due to the evaporation of HONO when the particle pH was below the pKa of HONO (pKa = 3.3). Conversely, in neutralized particles, the reaction of MEA caused a decrease in particle pH. In a previous MEA uptake study, we found that ppm-level MEA could effectively partition into acidic particles to form particulate MEA and completely neutralize acidic particles within 1 h.13 Combined with the present study, it is suggested that near power plants with sufficiently high MEA and particulate NO3− concentrations,9–11,66–68 the reactions of MEA in the presence of NO3− photolysis can potentially promote the reactive uptake of gaseous MEA into the particle phase, and thus enhance the atmospheric sink of MEA.
Previous studies of atmospheric MEA mainly focused on the gas-phase reactions, such as gaseous MEA oxidation,15,17,69,70 the contribution of gaseous MEA in enhancing H2SO4-based new particle formation and aging of pre-existing ambient particles.12,13 However, limited study was focused on the fate of particulate MEA. MEA is predominantly present in the protonated form in ambient aerosols, and the protonation of MEA weakens the electron donation ability of –NH3+ to the nearby C–H bonds (α position) and hampers the electrophilic attack of OH radicals onto α C–H bonds. Thus particulate MEA follows degradation pathways different from gaseous MEA. Our results indicate that the OH-initiated oxidation of particulate MEA mainly takes place at the β-C position, which gives oxidation products different from the gas-phase MEA oxidation. Additionally, the degraded of particulate MEA forms water-soluble BrC and an organic phase through the reaction of amine with a carbonyl groups formed during MEA oxidation. This was not observed in previous bulk aqueous amine oxidation studies due to the more diluted reactants and the slowed Millard reactions in the bulk phase.21,24,65 To the best of our knowledge, this is the first study to reveal the formation of water-soluble BrC and the organic phase from the degraded amine.
To better understand the water-soluble BrC and organic phase formation potential of particulate MEA, we considered particulate MEA degradation mediated by NO3− photolysis under typical meteorological conditions in spring and autumn in China.71 As discussed earlier, near source ppm-level MEA could effectively partition into H2SO4 particles and completely neutralize the H2SO4 particles within 1 h13 Thus, we used fully neutralized 4:0.5:1:3 particles as model particles. As shown in Fig. S16,† after a 36 h cycle of 12 h day (UV)-12 h night (dark)-12 h day (UV) (Fig. S16a, b and c†), only shrinkage of particles without organic phase formation was observed. Later at 44 h of the following night (dark), an organic phase was first observed in the peripheral particles (e.g., particle B in Fig. S16d†). After three day–night cycles of 72 h, an organic phase was formed even in other particles that did not have an organic phase earlier at 44 h (e.g., particle A in Fig. S16e†). The typical lifetime of ambient organic particles is ∼6 days based on model simulation,72 which is sufficient for the water-soluble BrC and organic phase formation according to our studies. The present study suggests that MEA oxidation products formed during NO3− photolysis in particles can form SOA even in the nighttime.
The formation of BrC in the particles enhanced light absorption by the particle within the UV and visible wavelength range, and thus may promote the in-particle photochemistry.63,73 This study highlights the potential formation of brown carbon (BrC) from MEA when oxidized in particles. Unlike typical studies on BrC formation involving two species (carbonyl compounds and amines or ammonia) as precursors in CN type reactions,27,64,65 our study shows that BrC can also form solely from MEA after oxidation. More importantly, our study indicates that the in-particle reaction of MEA may cause phase separation by forming an organic phase within the particles. One important atmospheric significance of particle phase separation is that it can affect the chemical composition of the atmosphere by altering the partitioning of reactive gases between the gas and particle phases.74–76 For example, particle phase separation can cause certain reactive gases, such as NOx and amine, to be preferentially taken up by the aqueous phase over the organic phase,75,76 which can affect their reactions in the particle and in the surrounding air. The formation mechanisms from BrC to the organic phase warrant further investigation, and the results may give new insight into the SOA formation mechanism.
Conflicts of interest
There are no conflicts to declare.Acknowledgements
We gratefully acknowledge support from the National Natural Science Foundation of China (42275104, 22206115 and 42075100), Hong Kong Research Grants Council (11314222), and Shandong Provincial Natural Science Foundation Project (ZR2022QB226).Notes and references
- D. Devaraja and A. A. Kiss, Novel Intensified Process for Ethanolamines Production Using Reactive Distillation and Dividing-Wall Column Technologies, Chem. Eng. Process.: Process Intensif., 2022, 179, 109073, DOI:10.1016/j.cep.2022.109073.
- C.-C. Ma, D. Butler, V. Milligan, B. A. Hammann, H. Luo, J. F. Brazdil, D. Liu, R. V. Chaudhari and B. Subramaniam, Continuous Process for the Production of Taurine from Monoethanolamine, Ind. Eng. Chem. Res., 2020, 59(29), 13007–13015, DOI:10.1021/acs.iecr.0c02277.
- Y. Tong, J. Ye, Q. Wang, H. Zhang, H. Yu and A.-O. Seibou, Ethanolamines Corrosion Inhibition Effect on Steel Rebar in Simulated Realkalized Concrete Environments, J. Asian Archit. Build. Eng., 2023, 22(2), 415–424, DOI:10.1080/13467581.2022.2046004.
- H.-D. Chang, B.-E. Wu, M. Chandra Sil, Z.-H. Yang and C.-M. Chen, Study of Synergy of Monoethanolamine and Urea on Copper Corrosion Inhibition in Alkaline Solution, J. Mol. Liq., 2022, 359, 119344, DOI:10.1016/j.molliq.2022.119344.
- A. M. Teixeira, L. de O. Arinelli, J. L. de Medeiros and O. de Q. F. Araújo, Economic Leverage Affords Post-Combustion Capture of 43% of Carbon Emissions: Supersonic Separators for Methanol Hydrate Inhibitor Recovery from Raw Natural Gas and CO2 Drying, J. Environ. Manage., 2019, 236, 534–550, DOI:10.1016/j.jenvman.2019.02.008.
- H. Zhao, X. Luo, H. Zhang, N. Sun, W. Wei and Y. Sun, Carbon-Based Adsorbents for Post-Combustion Capture: A Review, Greenhouse Gases: Sci. Technol., 2018, 8(1), 11–36, DOI:10.1002/ghg.1758.
- D. Ravikumar, D. Zhang, G. Keoleian, S. Miller, V. Sick and V. Li, Carbon Dioxide Utilization in Concrete Curing or Mixing Might Not Produce a Net Climate Benefit, Nat. Commun., 2021, 12(1), 855, DOI:10.1038/s41467-021-21148-w.
- H. C. Mantripragada, H. Zhai and E. S. Rubin, Boundary Dam or Petra Nova – Which Is a Better Model for CCS Energy Supply?, Int. J. Greenhouse Gas Control, 2019, 82, 59–68, DOI:10.1016/j.ijggc.2019.01.004.
- S. D. Sharma and M. Azzi, A Critical Review of Existing Strategies for Emission Control in the Monoethanolamine-Based Carbon Capture Process and Some Recommendations for Improved Strategies, Fuel, 2014, 121, 178–188, DOI:10.1016/j.fuel.2013.12.023.
- K. Veltman, B. Singh and E. G. Hertwich, Human and Environmental Impact Assessment of Postcombustion CO2 Capture Focusing on Emissions from Amine-Based Scrubbing Solvents to Air, Environ. Sci. Technol., 2010, 44(4), 1496–1502, DOI:10.1021/es902116r.
- A. B. Rao and E. S. Rubin, A Technical, Economic, and Environmental Assessment of Amine-Based CO2 Capture Technology for Power Plant Greenhouse Gas Control, Environ. Sci. Technol., 2002, 36(20), 4467–4475, DOI:10.1021/es0158861.
- H.-B. Xie, J. Elm, R. Halonen, N. Myllys, T. Kurtén, M. Kulmala and H. Vehkamäki, Atmospheric Fate of Monoethanolamine: Enhancing New Particle Formation of Sulfuric Acid as an Important Removal Process, Environ. Sci. Technol., 2017, 51(15), 8422–8431, DOI:10.1021/acs.est.7b02294.
- X. Tian, Y. Chu and C. K. Chan, Reactive Uptake of Monoethanolamine by Sulfuric Acid Particles and Hygroscopicity of Monoethanolaminium Salts, Environ. Sci. Technol. Lett., 2022, 9(1), 16–21, DOI:10.1021/acs.estlett.1c00880.
- S. Chi and G. T. Rochelle, Oxidative Degradation of Monoethanolamine, Ind. Eng. Chem. Res., 2002, 41(17), 4178–4186, DOI:10.1021/ie010697c.
- N. Borduas, J. P. D. Abbatt and J. G. Murphy, Gas Phase Oxidation of Monoethanolamine (MEA) with OH Radical and Ozone: Kinetics, Products, and Particles, Environ. Sci. Technol., 2013, 47(12), 6377–6383, DOI:10.1021/es401282j.
- G. da Silva, Atmospheric Chemistry of 2-Aminoethanol (MEA): Reaction of the NH 2• CHCH 2 OH Radical with O2, J. Phys. Chem. A, 2012, 116(45), 10980–10986, DOI:10.1021/jp307726w.
- H.-B. Xie, C. Li, N. He, C. Wang, S. Zhang and J. Chen, Atmospheric Chemical Reactions of Monoethanolamine Initiated by OH Radical: Mechanistic and Kinetic Study, Environ. Sci. Technol., 2014, 48(3), 1700–1706, DOI:10.1021/es405110t.
- X. Huang, C. Deng, G. Zhuang, J. Lin and M. Xiao, Quantitative Analysis of Aliphatic Amines in Urban Aerosols Based on Online Derivatization and High Performance Liquid Chromatography, Environ. Sci.: Processes Impacts, 2016, 18(7), 796–801, 10.1039/C6EM00197A.
- Q. Zhang and C. Anastasio, Free and Combined Amino Compounds in Atmospheric Fine Particles (PM2.5) and Fog Waters from Northern California, Atmos. Environ., 2003, 37(16), 2247–2258, DOI:10.1016/S1352-2310(03)00127-4.
- D. Chen, X. Yao, C. K. Chan, X. Tian, Y. Chu, S. L. Clegg, Y. Shen, Y. Gao and H. Gao, Competitive Uptake of Dimethylamine and Trimethylamine against Ammonia on Acidic Particles in Marine Atmospheres, Environ. Sci. Technol., 2022, 56(9), 5430–5439, DOI:10.1021/acs.est.1c08713.
- X. Yang, Y. Tao and J. G. Murphy, Kinetics of the Oxidation of Ammonia and Amines with Hydroxyl Radicals in the Aqueous Phase, Environ. Sci.: Processes Impacts, 2021, 23(12), 1906–1913, 10.1039/D1EM00317H.
- H. O. T. Pye, A. Nenes, B. Alexander, A. P. Ault, M. C. Barth, S. L. Clegg, J. L. Collett Jr., K. M. Fahey, C. J. Hennigan, H. Herrmann, M. Kanakidou, J. T. Kelly, I.-T. Ku, V. F. McNeill, N. Riemer, T. Schaefer, G. Shi, A. Tilgner, J. T. Walker, T. Wang, R. Weber, J. Xing, R. A. Zaveri and A. Zuend, The Acidity of Atmospheric Particles and Clouds, Atmos. Chem. Phys., 2020, 20(8), 4809–4888, DOI:10.5194/acp-20-4809-2020.
- Q. Zhang and C. Anastasio, Free and Combined Amino Compounds in Atmospheric Fine Particles (PM2.5) and Fog Waters from Northern California, Atmos, Environ, 2003, 37, 2247–2258 CAS.
- Y. Tao, T. Liu, X. Yang and J. G. Murphy, Kinetics and Products of the Aqueous Phase Oxidation of Triethylamine by OH, ACS Earth Space Chem., 2021, 5(8), 1889–1895, DOI:10.1021/acsearthspacechem.1c00162.
- K. Kishore, G. R. Dey and T. Mukherjee, OH Radical Reactions with Ethanolamines: Formation of Reducing as Well as Oxidizing Radicals, Res. Chem. Intermed., 2004, 30(9), 837–845, DOI:10.1163/1568567042420758.
- A. Kumar, Kinetics of Complexation and Oxidation of Ethanolamine and Diols by Silver(II), J. Phys. Chem., 1982, 86(9), 1674–1678, DOI:10.1021/j100206a037.
- B. R. G. Mabato, M. Gen, Y. Chu and C. K. Chan, Reactive Uptake of Glyoxal by Methylaminium-Containing Salts as a Function of Relative Humidity, ACS Earth Space Chem., 2019, 3(2), 150–157, DOI:10.1021/acsearthspacechem.8b00154.
- W. Marrero-Ortiz, M. Hu, Z. Du, Y. Ji, Y. Wang, S. Guo, Y. Lin, M. Gomez-Hermandez, J. Peng, Y. Li, J. Secrest, M. L. Zamora, Y. Wang, T. An and R. Zhang, Formation and Optical Properties of Brown Carbon from Small α-Dicarbonyls and Amines, Environ. Sci. Technol., 2019, 53(1), 117–126, DOI:10.1021/acs.est.8b03995.
- C. J. Kampf, A. Filippi, C. Zuth, T. Hoffmann and T. Opatz, Secondary Brown Carbon Formation via the Dicarbonyl Imine Pathway: Nitrogen Heterocycle Formation and Synergistic Effects, Phys. Chem. Chem. Phys., 2016, 18(27), 18353–18364, 10.1039/C6CP03029G.
- M. M. Galloway, M. H. Powelson, N. Sedehi, S. E. Wood, K. D. Millage, J. A. Kononenko, A. D. Rynaski and D. O. De Haan, Secondary Organic Aerosol Formation during Evaporation of Droplets Containing Atmospheric Aldehydes, Amines, and Ammonium Sulfate, Environ. Sci. Technol., 2014, 48(24), 14417–14425, DOI:10.1021/es5044479.
- M. H. Powelson, B. M. Espelien, L. N. Hawkins, M. M. Galloway and D. O. De Haan, Brown Carbon Formation by Aqueous-Phase Carbonyl Compound Reactions with Amines and Ammonium Sulfate, Environ. Sci. Technol., 2014, 48(2), 985–993, DOI:10.1021/es4038325.
- N. Sedehi, H. Takano, V. A. Blasic, K. A. Sullivan and D. O. De Haan, Temperature- and PH-Dependent Aqueous-Phase Kinetics of the Reactions of Glyoxal and Methylglyoxal with Atmospheric Amines and Ammonium Sulfate, Atmos. Environ., 2013, 77, 656–663, DOI:10.1016/j.atmosenv.2013.05.070.
- C. K. Chan and X. Yao, Air Pollution in Mega Cities in China, Atmos. Environ., 2008, 42(1), 1–42, DOI:10.1016/j.atmosenv.2007.09.003.
- W. Shen, L. Ren, Y. Zhao, L. Zhou, L. Dai, X. Ge, S. Kong, Q. Yan, H. Xu, Y. Jiang, J. He, M. Chen and H. Yu, C1-C2 Alkyl Aminiums in Urban Aerosols: Insights from Ambient and Fuel Combustion Emission Measurements in the Yangtze River Delta Region of China, Environ. Pollut., 2017, 230, 12–21, DOI:10.1016/j.envpol.2017.06.034.
- P. J. G. Rehbein, C.-H. Jeong, M. L. McGuire, X. Yao, J. C. Corbin and G. J. Evans, Cloud and Fog Processing Enhanced Gas-to-Particle Partitioning of Trimethylamine, Environ. Sci. Technol., 2011, 45(10), 4346–4352, DOI:10.1021/es1042113.
- K. B. Benedict, A. S. McFall and C. Anastasio, Quantum Yield of Nitrite from the Photolysis of Aqueous Nitrate above 300 Nm, Environ. Sci. Technol., 2017, 51(8), 4387–4395, DOI:10.1021/acs.est.6b06370.
- D. D. Huang, Q. Zhang, H. H. Y. Cheung, L. Yu, S. Zhou, C. Anastasio, J. D. Smith and C. K. Chan, Formation and Evolution of AqSOA from Aqueous-Phase Reactions of Phenolic Carbonyls: Comparison between Ammonium Sulfate and Ammonium Nitrate Solutions, Environ. Sci. Technol., 2018, 52(16), 9215–9224, DOI:10.1021/acs.est.8b03441.
- R. Zhang, M. Gen, Z. Liang, Y. J. Li and C. K. Chan, Photochemical Reactions of Glyoxal during Particulate Ammonium Nitrate Photolysis: Brown Carbon Formation, Enhanced Glyoxal Decay, and Organic Phase Formation, Environ. Sci. Technol., 2022, 56(3), 1605–1614, DOI:10.1021/acs.est.1c07211.
- R. Zhang, M. Gen, T.-M. Fu and C. K. Chan, Production of Formate via Oxidation of Glyoxal Promoted by Particulate Nitrate Photolysis, Environ. Sci. Technol., 2021, 55(9), 5711–5720, DOI:10.1021/acs.est.0c08199.
- M. Gen, R. Zhang, D. D. Huang, Y. Li and C. K. Chan, Heterogeneous Oxidation of SO2 in Sulfate Production during Nitrate Photolysis at 300 Nm: Effect of PH, Relative Humidity, Irradiation Intensity, and the Presence of Organic Compounds, Environ. Sci. Technol., 2019, 53(15), 8757–8766, DOI:10.1021/acs.est.9b01623.
- R. Zhang, M. Gen, D. Huang, Y. Li and C. K. Chan, Enhanced Sulfate Production by Nitrate Photolysis in the Presence of Halide Ions in Atmospheric Particles, Environ. Sci. Technol., 2020, 54(7), 3831–3839 CrossRef CAS PubMed.
- T. Arakaki, T. Miyake, T. Hirakawa and H. Sakugawa, PH Dependent Photoformation of Hydroxyl Radical and Absorbance of Aqueous-Phase N(III) (HNO2 and NO2-), Environ. Sci. Technol., 1999, 33(15), 2561–2565, DOI:10.1021/es980762i.
- K. R. Kolesar, G. Buffaloe, K. R. Wilson and C. D. Cappa, OH-Initiated Heterogeneous Oxidation of Internally-Mixed Squalane and Secondary Organic Aerosol, Environ. Sci. Technol., 2014, 48(6), 3196–3202, DOI:10.1021/es405177d.
- J. P. S. Wong, S. Zhou and J. P. D. Abbatt, Changes in Secondary Organic Aerosol Composition and Mass Due to Photolysis: Relative Humidity Dependence, J. Phys. Chem. A, 2015, 119(19), 4309–4316, DOI:10.1021/jp506898c.
- T. B. Nguyen, M. M. Coggon, R. C. Flagan and J. H. Seinfeld, Reactive Uptake and Photo-Fenton Oxidation of Glycolaldehyde in Aerosol Liquid Water, Environ. Sci. Technol., 2013, 47(9), 4307–4316, DOI:10.1021/es400538j.
- M. Song, P. F. Liu, S. J. Hanna, R. A. Zaveri, K. Potter, Y. You, S. T. Martin and A. K. Bertram, Relative Humidity-Dependent Viscosity of Secondary Organic Material from Toluene Photo-Oxidation and Possible Implications for Organic Particulate Matter over Megacities, Atmos. Chem. Phys., 2016, 16(14), 8817–8830, DOI:10.5194/acp-16-8817-2016.
- R. L. Craig, P. K. Peterson, L. Nandy, Z. Lei, M. A. Hossain, S. Camarena, R. A. Dodson, R. D. Cook, C. S. Dutcher and A. P. Ault, Direct Determination of Aerosol PH: Size-Resolved Measurements of Submicrometer and Supermicrometer Aqueous Particles, Anal. Chem., 2018, 90(19), 11232–11239, DOI:10.1021/acs.analchem.8b00586.
- Z. Liang, R. Zhang, M. Gen, Y. Chu and C. K. Chan, Nitrate Photolysis in Mixed Sucrose–Nitrate–Sulfate Particles at Different Relative Humidities, J. Phys. Chem. A, 2021, 125(17), 3739–3747, DOI:10.1021/acs.jpca.1c00669.
- S. Jin, L. Kong, K. Yang, C. Wang, L. Xia, Y. Wang, J. Tan and L. Wang, Combined Effects of High Relative Humidity and Ultraviolet Irradiation: Enhancing the Production of Gaseous NO2 from the Photolysis of NH4NO3, Sci. Total Environ., 2022, 838, 156480, DOI:10.1016/j.scitotenv.2022.156480.
- J. Mack and J. R. Bolton, Photochemistry of Nitrite and Nitrate in Aqueous Solution: A Review, J. Photochem. Photobiol. Chem., 1999, 128(1), 1–13, DOI:10.1016/S1010-6030(99)00155-0.
- N. K. Scharko, A. E. Berke and J. D. Raff, Release of Nitrous Acid and Nitrogen Dioxide from Nitrate Photolysis in Acidic Aqueous Solutions, Environ. Sci. Technol., 2014, 48(20), 11991–12001, DOI:10.1021/es503088x.
- R. Zellner, M. Exner and H. Herrmann, Absolute OH Quantum Yields in the Laser Photolysis of Nitrate, Nitrite and Dissolved H2O2 at 308 and 351 Nm in the Temperature Range 278–353 K, J. Atmos. Chem., 1990, 10(4), 411–425, DOI:10.1007/BF00115783.
- A. W. Sakti, Y. Nishimura and H. Nakai, Rigorous pKa Estimation of Amine Species Using Density-Functional Tight-Binding-Based Metadynamics Simulations, J. Chem. Theory Comput., 2018, 14(1), 351–356, DOI:10.1021/acs.jctc.7b00855.
- H. Pang, Q. Zhang, X. Lu, K. Li, H. Chen, J. Chen, X. Yang, Y. Ma, J. Ma and C. Huang, Nitrite-Mediated Photooxidation of Vanillin in the Atmospheric Aqueous Phase, Environ. Sci. Technol., 2019, 53(24), 14253–14263, DOI:10.1021/acs.est.9b03649.
- C. Lee, C. Schmidt, J. Yoon and U. von Gunten, Oxidation of N-Nitrosodimethylamine (NDMA) Precursors with Ozone and Chlorine Dioxide: Kinetics and Effect on NDMA Formation Potential, Environ. Sci. Technol., 2007, 41(6), 2056–2063, DOI:10.1021/es062484q.
- U. von Gunten, Ozonation of Drinking Water: Part I. Oxidation Kinetics and Product Formation, Water Res., 2003, 37(7), 1443–1467, DOI:10.1016/S0043-1354(02)00457-8.
- C. J. Nielsen, B. D'Anna, C. Dye, M. Graus, M. Karl, S. King, M. M. Maguto, M. Müller, N. Schmidbauer, Y. Stenstrøm, A. Wisthaler and S. Pedersen, Atmospheric Chemistry of 2-Aminoethanol (MEA), Energy Procedia, 2011, 4, 2245–2252, DOI:10.1016/j.egypro.2011.02.113.
- M. Karl, C. Dye, N. Schmidbauer, A. Wisthaler, T. Mikoviny, B. D'Anna, M. Müller, E. Borrás, E. Clemente, A. Muñoz, R. Porras, M. Ródenas, M. Vázquez and T. Brauers, Study of OH-Initiated Degradation of 2-Aminoethanol, Atmos. Chem. Phys., 2012, 12(4), 1881–1901, DOI:10.5194/acp-12-1881-2012.
- L. Onel, M. A. Blitz and P. W. Seakins, Direct Determination of the Rate Coefficient for the Reaction of OH Radicals with Monoethanol Amine (MEA) from 296 to 510 K, J. Phys. Chem. Lett., 2012, 3(7), 853–856, DOI:10.1021/jz300200c.
- L. Sjöberg, A pulse radiolytic study of some radiosensitizing and radioprotective substances, Kungliga Tekniska Hoegskolan, 1981 Search PubMed.
- H. J. Chacon-Madrid, A. A. Presto and N. M. Donahue, N. Functionalization vs. Fragmentation: N-Aldehyde Oxidation Mechanisms and Secondary Organic Aerosol Formation, Phys. Chem. Chem. Phys., 2010, 12(42), 13975–13982, 10.1039/C0CP00200C.
- R. Atkinson and J. Arey, Atmospheric Degradation of Volatile Organic Compounds, Chem. Rev., 2003, 103(12), 4605–4638, DOI:10.1021/cr0206420.
- R. F. Hems, E. G. Schnitzler, C. Liu-Kang, C. D. Cappa and J. P. D. Abbatt, Aging of Atmospheric Brown Carbon Aerosol, ACS Earth Space Chem., 2021, 5(4), 722–748, DOI:10.1021/acsearthspacechem.0c00346.
- L. N. Hawkins, A. N. Lemire, M. M. Galloway, A. L. Corrigan, J. J. Turley, B. M. Espelien and D. O. De Haan, Maillard Chemistry in Clouds and Aqueous Aerosol As a Source of Atmospheric Humic-Like Substances, Environ. Sci. Technol., 2016, 50(14), 7443–7452, DOI:10.1021/acs.est.6b00909.
- D. O. De Haan, L. N. Hawkins, H. G. Welsh, R. Pednekar, J. R. Casar, E. A. Pennington, A. de Loera, N. G. Jimenez, M. A. Symons, M. Zauscher, A. Pajunoja, L. Caponi, M. Cazaunau, P. Formenti, A. Gratien, E. Pangui and J.-F. Doussin, Brown Carbon Production in Ammonium- or Amine-Containing Aerosol Particles by Reactive Uptake of Methylglyoxal and Photolytic Cloud Cycling, Environ. Sci. Technol., 2017, 51(13), 7458–7466, DOI:10.1021/acs.est.7b00159.
- S. K. Guttikunda and P. Jawahar, Atmospheric Emissions and Pollution from the Coal-Fired Thermal Power Plants in India, Atmos. Environ., 2014, 92, 449–460, DOI:10.1016/j.atmosenv.2014.04.057.
- F. Beyn, V. Matthias and K. Dähnke, Changes in Atmospheric Nitrate Deposition in Germany – An Isotopic Perspective, Environ. Pollut., 2014, 194, 1–10, DOI:10.1016/j.envpol.2014.06.043.
- X. Lu and J. C. H. Fung, Source Apportionment of Sulfate and Nitrate over the Pearl River Delta Region in China, Atmosphere, 2016, 7(8), 98, DOI:10.3390/atmos7080098.
- H.-B. Xie, F. Ma, Y. Wang, N. He, Q. Yu and J. Chen, Quantum Chemical Study on .Cl-Initiated Atmospheric Degradation of Monoethanolamine, Environ. Sci. Technol., 2015, 49(22), 13246–13255, DOI:10.1021/acs.est.5b03324.
- L. Onel, M. A. Blitz, J. Breen, A. R. Rickard and P. W. Seakins, Branching Ratios for the Reactions of OH with Ethanol Amines Used in Carbon Capture and the Potential Impact on Carcinogen Formation in the Emission Plume from a Carbon Capture Plant, Phys. Chem. Chem. Phys., 2015, 17(38), 25342–25353, 10.1039/C5CP04083C.
- J.-L. Chen, L. He, H. Yang, M. Ma, Q. Chen, S.-J. Wu and Z. Xiao, Empirical Models for Estimating Monthly Global Solar Radiation: A Most Comprehensive Review and Comparative Case Study in China, Renewable Sustainable Energy Rev., 2019, 108, 91–111, DOI:10.1016/j.rser.2019.03.033.
- C. Y. Gao, C. L. Heald, J. M. Katich, G. Luo and F. Yu, Remote Aerosol Simulated During the Atmospheric Tomography (ATom) Campaign and Implications for Aerosol Lifetime, J. Geophys. Res.: Atmos., 2022, 127(22), e2022JD036524, DOI:10.1029/2022JD036524.
- G.-M. Wu, Z.-Y. Cong, S.-C. Kang, K. Kawamura, P.-Q. Fu, Y.-L. Zhang, X. Wan, S.-P. Gao and B. Liu, Brown Carbon in the Cryosphere: Current Knowledge and Perspective, Adv. Clim. Chang. Res., 2016, 7(1), 82–89, DOI:10.1016/j.accre.2016.06.002.
- M. Arak Freedman, Phase Separation in Organic Aerosol, Chem. Soc. Rev., 2017, 46(24), 7694–7705, 10.1039/C6CS00783J.
- W.-S. W. DeRieux, P. S. J. Lakey, Y. Chu, C. K. Chan, H. S. Glicker, J. N. Smith, A. Zuend and M. Shiraiwa, Effects of Phase State and Phase Separation on Dimethylamine Uptake of Ammonium Sulfate and Ammonium Sulfate–Sucrose Mixed Particles, ACS Earth Space Chem., 2019, 3(7), 1268–1278, DOI:10.1021/acsearthspacechem.9b00142.
- C. J. Gaston, J. A. Thornton and N. L. Ng, Reactive Uptake of N2O5 to Internally Mixed Inorganic and Organic Particles: The Role of Organic Carbon Oxidation State and Inferred Organic Phase Separations, Atmos. Chem. Phys., 2014, 14(11), 5693–5707, DOI:10.5194/acp-14-5693-2014.
Footnotes |
| † Electronic supplementary information (ESI) available. See DOI: https://doi.org/10.1039/d3ea00072a |
| ‡ Current address: Division of Physical Science and Engineering, King Abdullah University of Science and Technology, Thuwal, 23955-6900, Saudi Arabia. |
| This journal is © The Royal Society of Chemistry 2023 |