
 Open Access Article
 This Open Access Article is licensed under a Creative Commons Attribution-Non Commercial 3.0 Unported Licence
Molecular and physical composition of tar balls in wildfire smoke: an investigation with complementary ionisation methods and 15-Tesla FT-ICR mass spectrometry†
Amna
Ijaz‡
 *a,
William
Kew
b,
Zezhen
Cheng
b,
Susan
Mathai
cd,
Nurun Nahar
Lata
b,
Libor
Kovarik
b,
Simeon
Schum
a,
Swarup
China
b and
Lynn R.
Mazzoleni
*ad
*a,
William
Kew
b,
Zezhen
Cheng
b,
Susan
Mathai
cd,
Nurun Nahar
Lata
b,
Libor
Kovarik
b,
Simeon
Schum
a,
Swarup
China
b and
Lynn R.
Mazzoleni
*ad
aDepartment of Chemistry, Michigan Technological University, Houghton, Michigan 49931, USA. E-mail: aijaz@mtu.edu; lrmazzol@mtu.edu
bEnvironmental Molecular Sciences Laboratory, Pacific Northwest National Laboratory, Richland 99354, WA, USA
cDepartment of Physics, Michigan Technological University, Houghton, Michigan 49931, USA
dAtmospheric Sciences Program, Michigan Technological University, Houghton, Michigan 49931, USA
First published on 20th September 2023
Abstract
Tar balls (TBs) are a major carbonaceous product of wildfires and other biomass-burning events that often exceed soot or other elemental forms of carbon in number and mass. Being a recalcitrant fraction of organic carbon, TBs are capable of long-range atmospheric transport, and thus, exert influence not only in the vicinity of wildfires but also in remote regions. Here, we characterised ambient atmospheric aerosol samples with varying TB number fractions collected downwind of Pacific Northwest wildfires using a 15-Tesla Fourier transform-ion cyclotron resonance mass spectrometer (15-T FT-ICR MS). Relative to non-TB aerosol, we found 2006 and 851 molecular formulae exclusively in TB-rich aerosol using laser desorption ionisation (LDI) of samples directly from an aerosol-loaded substrate and electrospray ionisation (ESI) of ACN-extracted aerosol, respectively. Elemental composition from LDI/15-T FT-ICR MS revealed TBs to be abundant in molecular species of low volatility and high viscosity, providing molecular detail that was consistent with key climate and air quality-related properties of TBs. Our findings demonstrate that the TB-specific molecular composition obtained from (−)LDI/15-T FT-ICR MS not only complements (−)ESI analyses, but provides a more apt reflection of the physical properties of TBs as well. We provide proof-of-concept evidence for the potential value of using LDI/15-T FT-ICR MS in routine OA analyses, specifically smoke samples rich in refractory OA, and improve the representation of OA in atmospheric and climate modelling studies that aim to fully understand its impact and occurrence.
Environmental significanceTar balls (TBs) are a carbon-rich fraction of aged biomass-burning smoke that persists in the atmosphere for long periods and over great distances. Due to their recalcitrance and light-absorbing nature, TBs have important effects on climate and air quality. We demonstrate the usefulness of laser desorption ionisation as a valuable partner for ultrahigh-resolution mass spectrometry to analyse refractory ambient organic aerosol, such as TBs in wildfire smoke. Additionally, we elucidate individual molecular species in TBs, which impart their key physicochemical properties; these species may potentially be an asset to inventories on refractory OA, and thus, can help improve OA representation in atmospheric and climate models. |
Introduction
Wildfires have immense destructive power that not only threatens animal and human lives but also substantially deteriorates air quality. Extreme wildfire events across the globe occasionally generate pyrocumulonimbus (pyroCb) clouds that inject smoke into the stratosphere.1,2 For instance, smoke from the Pacific Northwest wildfires in August 2017 led to an unusually strong pyroCb occurrence. Smoke from this event persisted in the stratosphere for ∼8 months and was observed as far off as 7000 km away in the North-Eastern Atlantic.3 This smoke was reported to be 98% organic aerosol (OA),4 emphasising the need to better understand persistent OA likely to reach far-off communities and ecosystems that are ill-prepared to manage environmental and health challenges associated with it. Experimental knowledge of the physicochemical properties of OA, such as molecular composition, viscosity, volatility, etc., in wildfire smoke is indispensable to assess the full magnitude of its influence and mitigate its impact.Tar balls (TBs) are a refractory product of atmospheric ageing of biomass-burning smoke plumes. They were first reported to form within minutes to hours of emission from Southern African wildfires,5,6 and their incidence increased as the plume aged.7,8 TBs are carbonaceous, highly viscous, spherical entities with diameters of <500 nm (100–300 nm, on average), which are not damaged under high-power electron beams and persist through the warm, humid conditions of the boundary layer.5,6,9 Not only can TBs constitute a large portion of the particulate mass in the close vicinity of large-scale biomass burning events,8,10 but they have been detected in remote areas, such as the Himalayas, after long-range transport.11 They exert a direct influence over air quality, radiation budget, and climate due to their highly variable optical characteristics, while their hygroscopic nature has been associated with indirect effects on climate, such as via their function as cloud condensation nuclei.12
Mass spectrometric analyses have revealed TBs to comprise thousands of distinct molecular species.13,14 However, studies available till now assume that the chemical complexity observed in TB-rich aerosol is attributable solely to TBs, despite them being present in complex non-TB organic material. Identification of molecular species specific to TBs in ambient aerosol can create opportunities to estimate key climate and air quality-related physicochemical properties, such as oxygenation levels, volatility,15 and phase states16–18 of TBs. As experimental measurements of these properties are usually not feasible for complex mixtures, their estimations from elemental compositions16–19 are a powerful approach to improving the representation of OA in modelling studies that aim to understand the formation, lifetime, and impact of OA. However, a TB-specific molecular signature, i.e., molecular species more likely to exist as (or in) refractory TBs as compared to non-TB OA, has yet to be established. We addressed this knowledge gap by conducting a comparative investigation of the molecular compositions of four wildfire smoke samples with varying percent fractions of TBs using laser desorption ionisation (LDI) and electrospray ionisation (ESI) coupled with a 15-Tesla Fourier transform-ion cyclotron resonance mass spectrometer (15-T FT-ICR MS).
ESI has long been a method of choice to characterise OA because it is a ‘soft’ ionisation technique that ionises many polar compounds over a wide size range with little to no fragmentation (e.g.,20–23). It has been adapted into (nano-) desorption ESI to minimise sample preparation, where it remains selective for polar, medium to high-molecular-weight species.24–26 Atmospheric pressure chemical and photoionisation can help analyse smaller and less polar or non-polar species.13,27 LDI is another soft ionisation technique that is sensitive to less polar, unsaturated molecules. It features the remarkable advantage of requiring no sample preparation, solvent or matrix selection, or solution preparation.28 Samples are simply pasted onto a suitable surface, such as copper tape (Fig. S1†), and ‘shot upon’ with a laser. The complexity of natural complex mixtures, such as OA, allows them to function as the matrix: i.e., heteroatom-containing compounds and polyaromatic hydrocarbons consisting of pi-conjugated structures can absorb ultraviolet radiation, and thus, undergo self-assisted ionisation.29
Although LDI has been employed for OA analysis by coupling a variety of lasers (e.g., near-infrared30 and UV-vis29,31,32) with different mass spectrometers (e.g., aerosol mass spectrometers,30 Q-Exactive HF,31 and 9.4-T FT-ICR29,32), its usefulness for routine direct analysis of ambient aerosol samples on filters has not been explored. Therefore, we seek to provide proof-of-concept evidence for the potential of using (−)LDI/15-T FT-ICR MS in OA analyses, specifically smoke samples rich in refractory OA. We demonstrate that the TB-specific molecular composition obtained from (−)LDI/15-T FT-ICR MS not only complements (−)ESI analyses, but provides a more apt reflection of the physical properties of TBs, highlighting this ionisation technique to be a valuable but under-utilised approach to study atmospheric aerosol. This study presents a convenient means of obtaining crucial information on TB composition and properties via offline sample collection and analyses, thereby representing an important asset that can aid in improving the physicochemical representation of OA in atmospheric and climate models.
Experimental
Sample collection and preparation
Particulate matter was collected on 0.1 μm (pore size) 90 mm (diameter) PTFE filters (Sterlitech Corporation, WA, USA) by pulling 80 L min−1 of air on four different days in August of 2018 for varying lengths of time (Table 1). Sampling was conducted at the Pacific Northwest National Laboratory in Richland, WA, USA. Intense smoky conditions were recorded on all days owing to wildfires in the northwest of the site of sample collection. Backward trajectories extending 72 hours from the time that sample collection was concluded were modelled using Hybrid Single-Particle Lagrangian Integrated Trajectory (HYSPLIT) (Fig. 1 and S2†). Smoke plumes sampled on August 09 and 10 travelled <12 hours from wildfires before reaching the sampling site (Fig. 1A–C and S1†). The fourth sample, BBAug1314, was influenced by smoke that had reached the sampling site after travelling >12 hours from wildfires that were farther away. A quarter of each filter was immersed in 30 mL of LC-MS-grade acetonitrile (ACN; 100%) and shaken at 60 rpm for 15 minutes. The liquid ACN-aerosol mixture thus obtained was passed through a 0.2 μm PTFE syringe to remove suspended solid material. The filtrate was maintained at 4 °C during storage and shipment until analysis. All samples were diluted as required in 50![[thin space (1/6-em)]](https://www.rsc.org/images/entities/char_2009.gif) :50 H2O:ACN immediately before analysis until a stable and optimised signal could be obtained.
:50 H2O:ACN immediately before analysis until a stable and optimised signal could be obtained.
| Sample ID | Start (PST hours) | End (PST hours) | Duration of collection | Average ambient relative humidity (%) | Average ambient temperature (K) | Classification |
|---|---|---|---|---|---|---|
| a BB, biomass burning; DT, daytime; NT, night-time; PST, Pacific standard time; TB, tar balls. | ||||||
| BBAug09 (DT) | Aug 09 (09:00) | Aug 09 (17:00) | 8 hours | 21.9 | 304.26 | Tar ball-poor (non-TB) |
| BBAug0910 (NT) | Aug 09 (18:00) | Aug 10 (07:00) | 13 hours | 24.4 | 305.10 | |
| BBAug1011 | Aug 10 (11:00) | Aug 11 (14:00) | 28 hours | 29.8 | 302.32 | |
| BBAug1314 | Aug 13 (10:00) | Aug 14 (11:00) | 25 hours | 32.0 | 296.76 | Tar ball-rich |
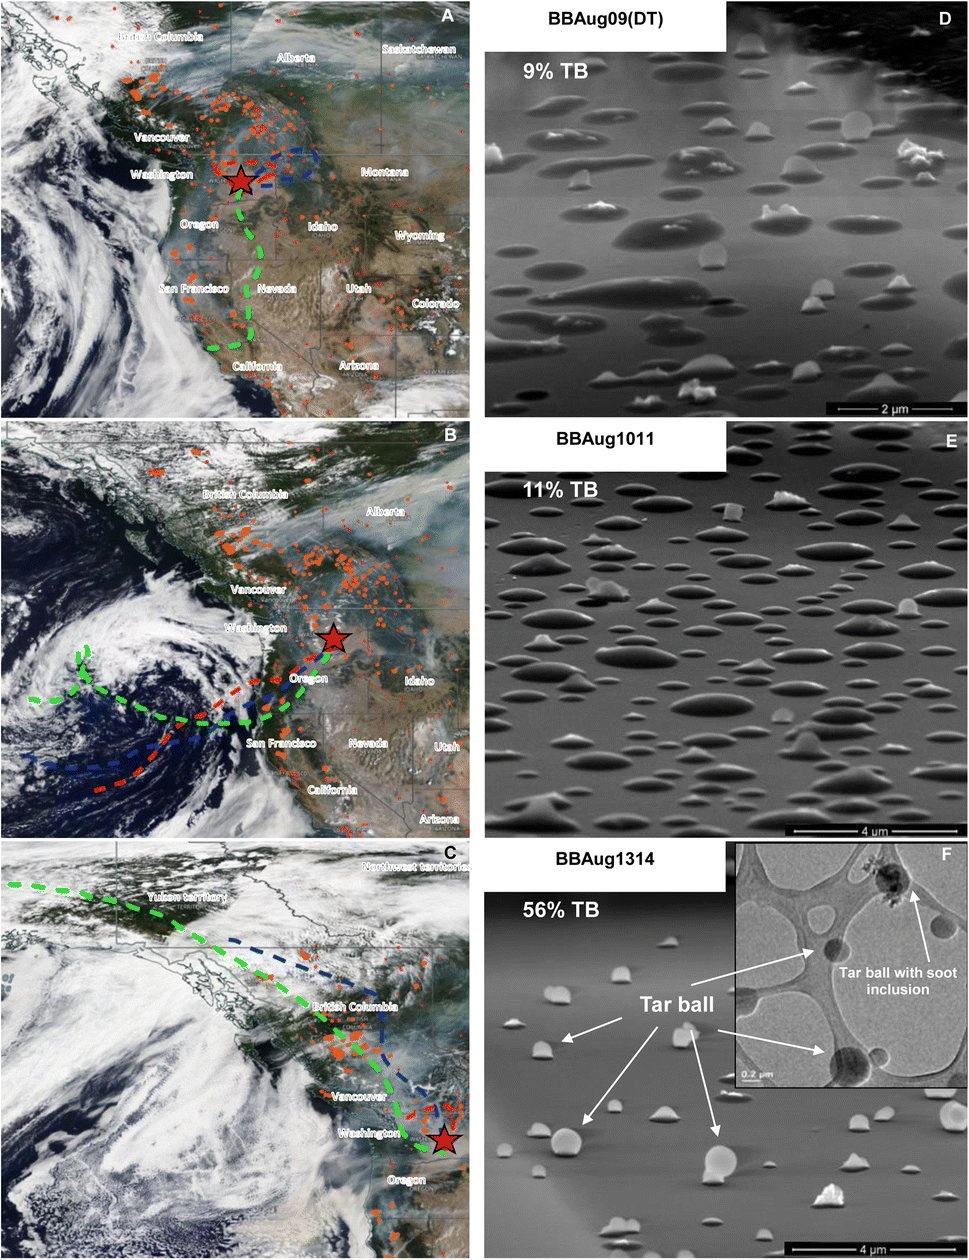 | ||
| Fig. 1 Backward trajectories of air plumes from the site of sample collection (red star at 46.28° N and −119.28° W) and percent occurrence of tar balls (TB) in aerosol samples. BBAug0910 (NT) is not shown due to its similarity with BBAug09 (DT) in terms of air plume trajectory and TB fraction. (A–C) Trajectories extend 72 hours into the past from the time that sample collection was concluded and were modelled at heights of 350 (red), 1000 (blue), and 3000 (green) meters above ground level. Trajectories are overlaid on satellite images (courtesy of the NASA Worldview application (https://worldview.earthdata.nasa.gov)) from Terra/MODIS showing smoky conditions at the sampling site. Orange dots indicate fires and thermal anomalies during day and night at 375 m captured by Aqua/MODIS, Terra/MODIS, and Suomi NPP/VIIRS, (D–F) Tilted (75°) images from scanning electron microscopy of the aerosol samples showing varying percent fractions of TB. Inset in (D) is a transmission electron microscopy image of BBAug1314 showing the mixing state of TB to be either pure organic carbon or organic carbon mixed with elemental carbon, such as soot. | ||
Ultrahigh-resolution mass spectrometry
000 at m/z 400. Spectra were peak picked in DataAnalysis 5.0 (Bruker Daltonics, Billerica MA) with an S/N threshold of 4.0 and an absolute intensity threshold of 1000000.
000 at m/z 400. Post-processing of the spectra was performed using custom Python routines (detailed in ESI). Briefly, the total ion current (TIC) values for each region of interest (ROI) and pixel were collated, and a narrow subset (n = 48 transients) of similar TICs – per ROI – were selected for transient co-addition. These were then zero-filled and Fourier transformed before frequency-to-mass calibration and peak picking.33,34 This selective co-addition of transients was necessary for optimum spectra quality.
Laser desorption ionisation was also applied to aerosol samples prepared for ESI analyses in LC-MS-grade ACN, after drying and reconstituting them in 50:50 H2O:ACN. Two microliters of samples were deposited on a polished steel MALDI target plate. Spectra were acquired by co-adding 64 transients recorded from m/z 92.14–1400. Two hundred laser shots were fired at random locations on the substrate with 400 Hz per pixel and a laser power of 28%. Settings for time domain, transient length, Q1 mass, and ToF were the same as for LDI in imaging. The measured resolving power was ∼490000 at m/z 400. This approach is referred to as LDIextract.
Microscopic analysis and chemical imaging of single particles
A computer-controlled scanning electron microscope coupled to an energy-dispersive X-ray spectrometer (CCSEM/EDX) was used to study the chemical composition of individual particles on stages C and D (50% cut-off sizes of 0.50 and 0.25 μm, respectively). The samples were analysed for C, N, O, Na, Mg, Al, Si, P, S, Cl, K, Ca, Mn, Fe, and Zn atomic percentages in individual particles using EDX. Individual particles were classified as carbonaceous, Na-rich, sea salt/sulphates, dust, or others based on their relevant proportion of elements over a spectrum of sizes from 0.05 to 2.65 μm as detailed previously.39 To obtain the phase state of individual particles, we used the method of Cheng et al.40 Briefly, we obtained SEM images tilted by 75° for at least 100 randomly chosen particles in each sample using environmental scanning electron microscopy (ESEM). Aspect ratios (width of particle/height of particle) of individual particles were used to classify them as solids (aspect ratio ≤ 1.3), semi-solids (1.3 < aspect ratio ≤ 1.85), or liquids (aspect ratio ≥ 1.85). Analysis of carbon functionalities and mixing state of particles was investigated using scanning transmission X-ray microscopy coupled with near-edge X-ray absorption fine structure (STXM/NEXAFS) for particles on stage D (50% cut-off size of 0.25 μm). Samples were differentiated based on mixing states as follows: OC, EC, IC only, OC + EC + IC, OC + EC, OC + IC, or EC + IC, where OC, EC, and IC denote organic, elemental, and inorganics-infused carbon.41 Total carbon absorbance (TCA) was calculated from STXM/NEXAFS data using the optical density.42 TCA is proportional to the particle thickness, and thus, when modelled as a function of particle size, i.e., the area equivalent diameter (AED), it can indicate phase state as described previously.42–44 In addition, chemical bonding speciation of carbon and oxygen was performed using electron energy-loss spectroscopy (EELS) coupled with an aberration-corrected STEM (FEI Titan 80-300 STEM).Results and discussion
Single-particle micro-spectroscopic analysis of wildfire smoke
Tilted-view SEM images showed a prevalence of flattened dome-like single particles in BBAug09 (DT) and BBAug1011, while spherical particles were predominant in BBAug1314 (Fig. 1D–F). As per the aspect ratios,40 9, 11, and 56% of single particles analysed in BBAug09 (DT), BBAug1011, and BBAug1314, respectively, were classified as TBs based on solidity and shape. Typically, the number fraction of TBs increases with plume age.7,8 TBs are morphologically distinguished from other OM as extremely low-volatility, high-viscosity spheroids with a range of diameters from 30–1500 nm and an average size of <500 nm. They contain pure OC with little to no inorganic inclusions.6,8,45,46 Size-resolved CCSEM/EDX analysis showed all three samples to be rich in carbonaceous particles (50–75% by number fraction; Fig. S3†). Only BBAug1011 had a prevalence of dust, sea salt/sulphates, and Na-rich larger particles (>0.95 μm in diameter), which is likely because of its path from over the Pacific Ocean before intercepting wildfires (or wildfire smoke) in Washington State, US (Fig. 1 and S2†). In line with the carbonaceous nature of these samples, STXM/NEXAFS showed single particles in all aerosol samples to have OC or OC + EC mixing states (Fig. S4†). However, BBAug1314 featured a greater frequency of particles with higher TCA values but the same AED as in other samples indicating >90% of its single particles exist in a solid or semi-solid state, while the majority of single particles in the remaining samples were liquid or semi-solids. Based on all these observations, BBAug1314 was classified as ‘TB-rich’, while all other samples were classified as ‘non-TB’ aerosol. This notation is used going forward in the manuscript.Overview of the molecular composition of wildfire smoke
With (−)ESI analysis, 3663, 3686, 3922, and 4841 monoisotopic formulae were assigned to BBAug09 (DT), BBAug0910 (NT), BBAug1011, and BBAug1314, respectively. With (−)LDI, 1516, 2383, and 4299 distinct monoisotopic formulae were assigned to BBAug0910 (NT), BBAug1011, and BBAug1314, respectively. Further details are summarised in Tables S2 and S3.† Negative-mode ionisation was chosen in this study as it is sensitive to molecules with polar acidic functional groups, rendering it ideal for the analysis of processed organic aerosol, which is generally acidic in nature.20,47 It also offers simplicity of interpretation as deprotonation is the primary ionisation mechanism, rather than the more variable adduct formation.48 A stable signal could not be obtained for BBAug09 (DT) with (−)LDI. Mass spectra for the TB-rich sample and a non-TB aerosol are shown in Fig. 2 at three levels of expansion (m/z 100–750, 300–310, and 304.99–305.15); spectra for the remaining samples are presented in Fig. S5.† Although (−)ESI detected a greater number of species overall, (−)LDI featured more peaks at individual nominal masses (305 shown as an example), where N and S-containing formulae with lower mass defects formed a majority of the additional formulae.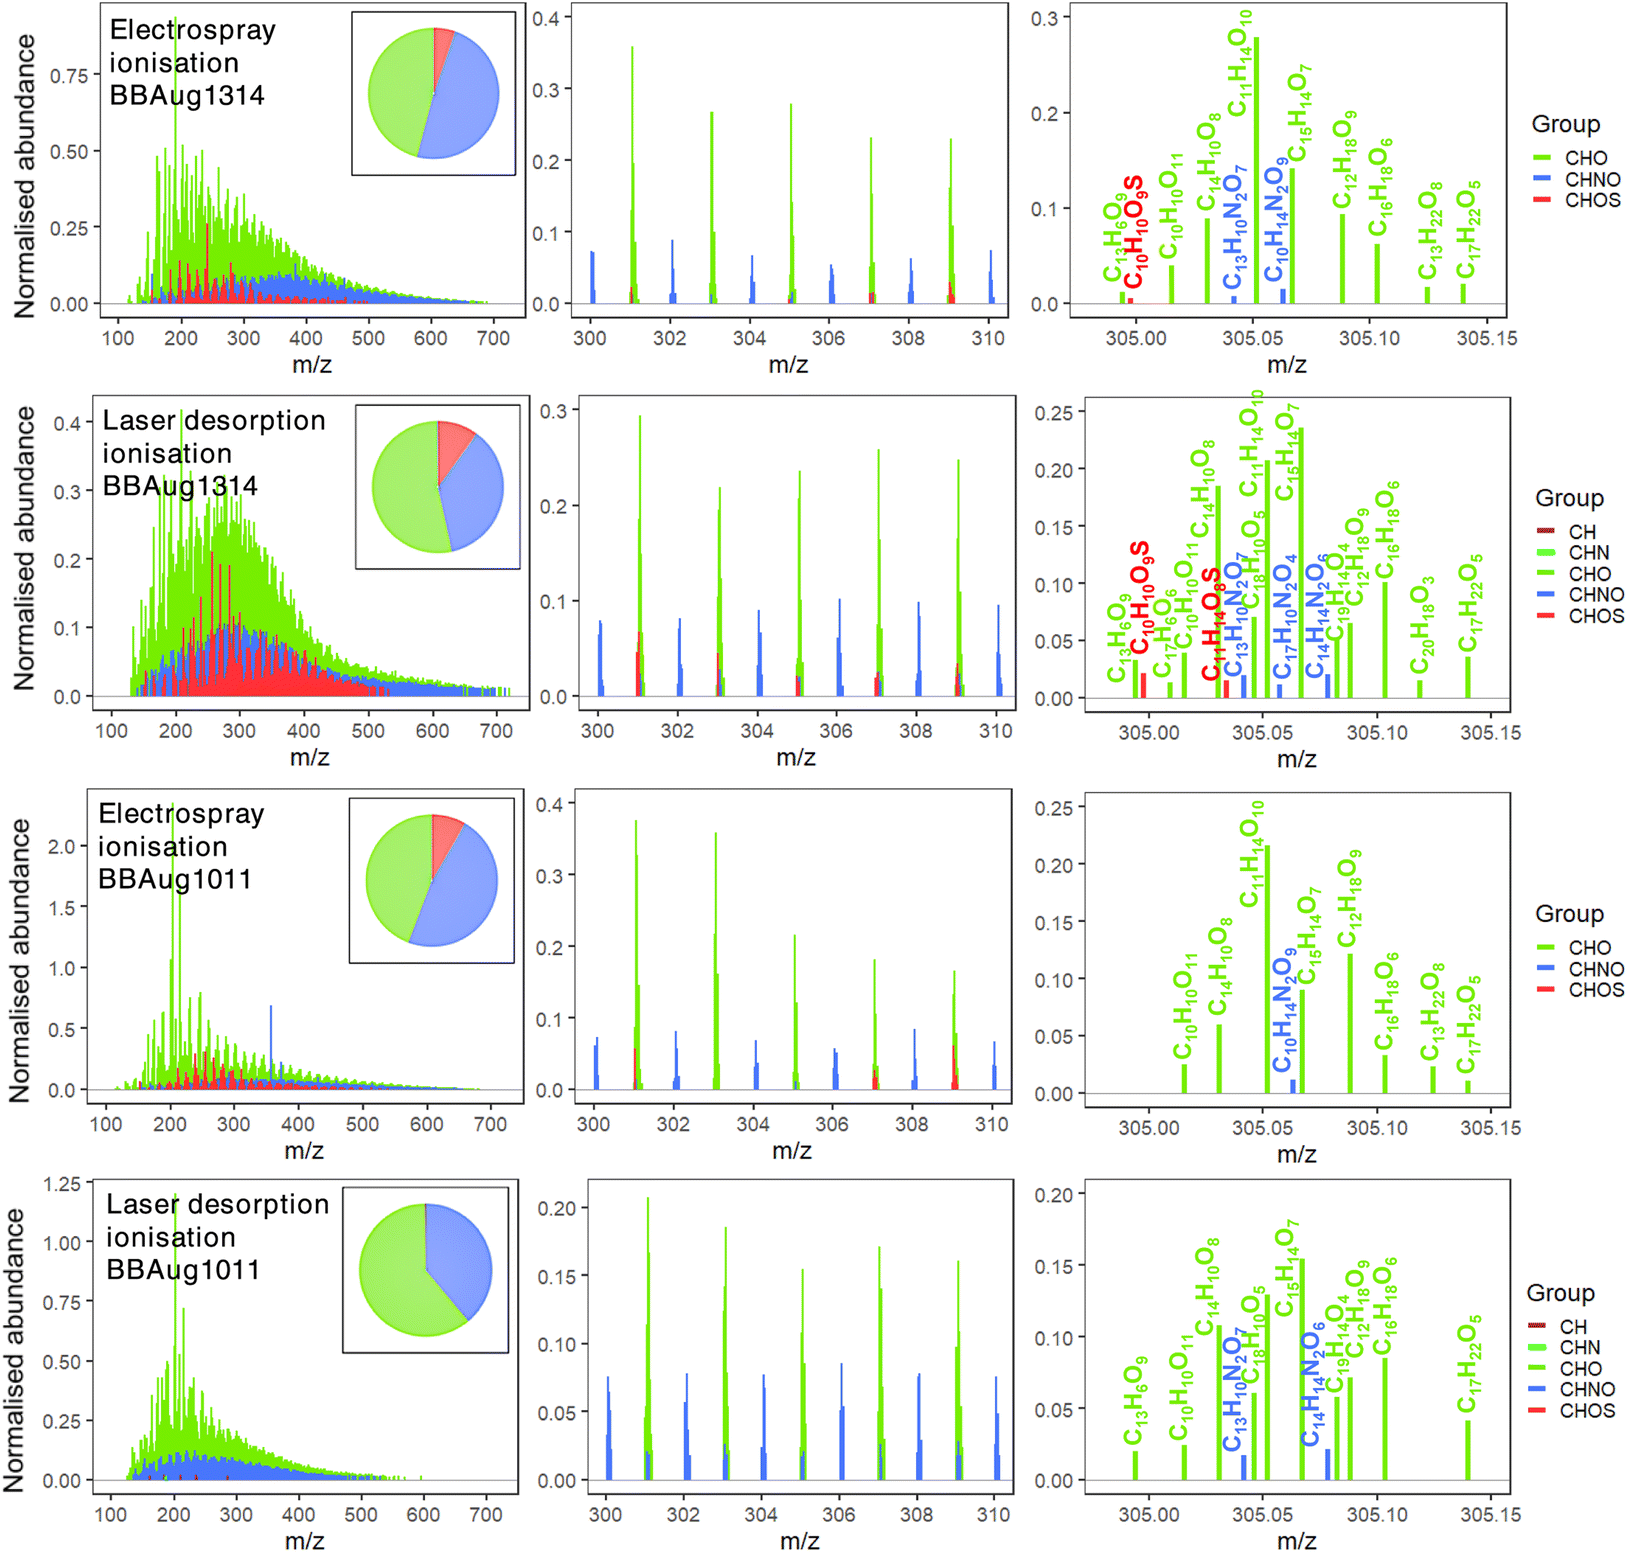 | ||
| Fig. 2 Reconstructed mass spectra for two full-day aerosol samples: TB-rich (BBAug1314) and non-TB aerosol acquired with (−)ESI or (−)LDI with 15-T FT-ICR mass spectrometry. Only monoisotopic, even-electron ion peaks are shown. Peak abundances are normalised to the sum of the abundance of CHO species that were common among ≥(n − 1) samples, where n is the total number of samples under consideration. Pie charts show the fraction of molecular formulae belonging to CHO (green), CHNO (blue), and CHOS (red) groups. Corresponding numerical data is presented in Tables S2 and S3.† | ||
With both ionisation methods, in all samples, the majority of signal originated from species containing C3–32, O2–19, N1–2O3–18, and O5–16S with CHO and CHNO being the largest groups (Fig. 2 and S6, S7†). These are typical molecular compositions reported from ultrahigh-resolution mass spectrometric analyses of BBOA.13,20,21,23 Most importantly, molecular species with AImod ≥ 0.67, C > 17 and O ≥ 1 atoms were detected, which are likely oxygenated polycyclic aromatic hydrocarbons (O-PAHs); these O-PAHs could be strong chromophores emitted as primary brown carbon from biomass burning.49
Formulae belonging to additional classes, CH and CHN, were exclusively detected with (−)LDI in all aerosol samples (n = 6–13 CH and 2–13 CHN). These species contained C > 14 atoms, DBE > 12, and AImod > 0.84. Such high-C aromatic CHN compounds (e.g., C21H13N; C21H11N, and C23H13N) can be N-heterocyclic PAHs.49 Being embedded in the aerosol of glassy/solid states, such as TBs, causes low diffusivity and mixing, shielding PAHs from common oxidants (e.g., O3, NO3, and OH˙), which increases their atmospheric half-lives and the ability for long-range transport. Like O-PAHs, these N-PAHs are also strong chromophores, which may absorb more radiation in the visible range relative to their corresponding PAHs. Furthermore, PAHs have extensively been associated with causing health disorders upon inhalation,50 which makes their exclusive detection by (−)LDI noteworthy.
The molecular composition of TB-rich aerosol relative to non-TB aerosol
A large overlap existed in the molecular formulae assigned to ions detected by (−)ESI and (−)LDI for all samples (Fig. 3). This overlap increased from 20.64 to 45.47% (of the total formulae assigned) from the samples with the least TBs to the most TB-rich sample. On the one hand, molecular species that are commonly identified by (−)ESI – which is an established method of choice for aerosol analyses – and (−)LDI are of importance as they are indicative of the credibility of the latter to explore and compare the compositions of ambient aerosol. In the context of this study, both ionisation methods have been used to derive TB-specific compounds that may potentially be used to generate inventories of refractory OA in atmospheric and climate models (the focus of the present section). On the other hand, molecular species uniquely identified by either ionisation method provide an opportunity to compare the efficacy of (−)ESI and (−)LDI in representing the essence of the aerosol samples. A substantial fraction of formulae unique to either ionisation method is consistent with previous research that applied a combination of (−/+)ESI and (−/+)APPI on BBOA to detect a greater number of species relative to a single ionisation method.13 In this study, when assessed in the context of known physicochemical properties of TBs, molecular species highlight (−)LDI as a simpler, yet valuable, tool for aerosol analyses (detailed discussion in the next section).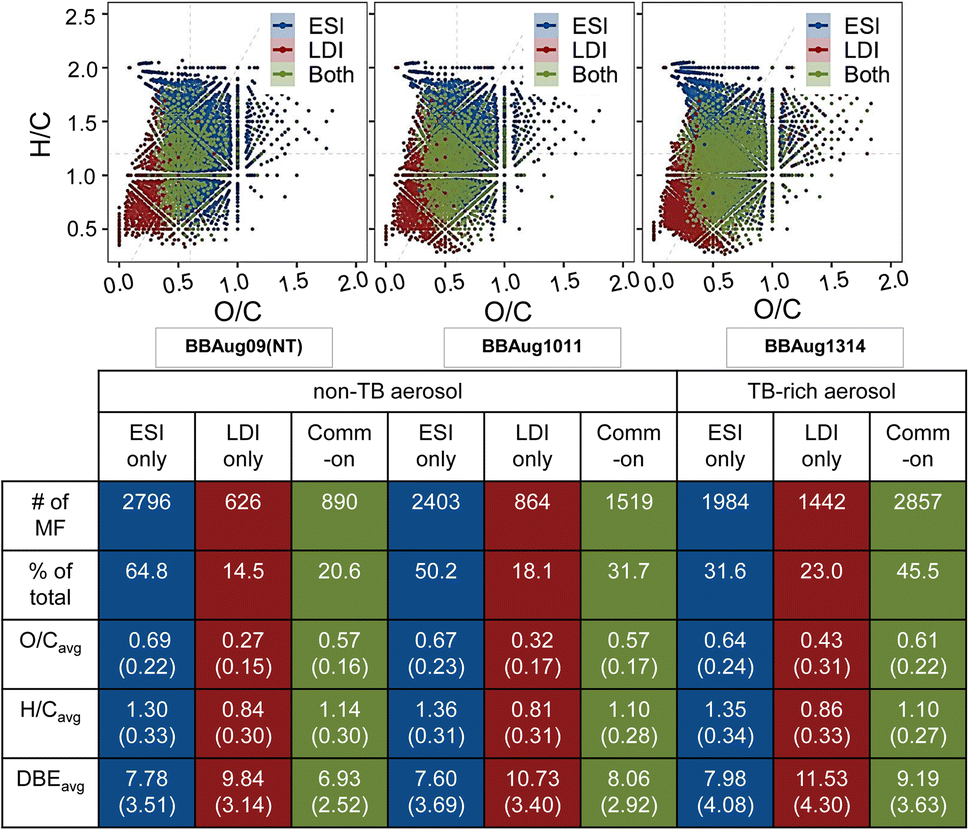 | ||
| Fig. 3 Van Krevelen diagrams depicting the ionisation selectivity of laser desorption and electrospray ionisations (LDI and ESI). Species ionised by both methods are shown in green and are overlaid on peaks that were exclusively ionised by either method (blue, ESI only; maroon, LDI only). The table below summarises averages (standard deviations in brackets) of key metrics for each category. | ||
With both (−)ESI and (−)LDI, TB-rich aerosol featured species with higher C, O, and DBE as compared to the non-TB aerosol (Fig. S6†). Specifically, molecules with C ≥ 12, O ≥ 7, and DBE ≥ 7 were dominant in TB-rich relative to the non-TB aerosol. These molecules presented high average H/C of >1.0 with both ionisation methods, which remained in a narrow range (1.16–1.25 with (−)ESI and 1.01–1.06 with (−)LDI) for all samples as summarised in Tables 2, 3 and S2, S3;† these values are consistent with H/C reported for long-range transported or aged BBOA.13,20,21 To elucidate molecular-level differences between TB-rich and non-TB samples, we aligned all formulae and eliminated those that were identified in two or more samples, leaving us with species found exclusively in each sample. Tables 2 and 3 summarise these sample-specific formula assignments and related metrics. For the sake of simplicity, species identified exclusively in the TB-rich sample are referred to as ‘TB-specific species’. Species uniquely identified in each of the non-TB aerosol (and commonly in them) are collectively termed as ‘non-TB’ species'.
| Aerosol mixture | Status | Molecular group | ESI | |||||
|---|---|---|---|---|---|---|---|---|
| MF | O/Cwa | H/Cwa | DBEwa | AImod | T g,RH (K) | |||
| BBAug09 (DT) | Non-TB species | All | 98 | 0.73 (0.19) | 1.00 (0.34) | 11.07 (3.22) | 0.31 (0.26) | 351.13 (296.70) |
| CHO | 57 | 0.72 (0.17) | 1.02 (0.33) | 11.38 (2.81) | 0.29 (0.24) | |||
| CHNO | 36 | 0.70 (0.17) | 0.90 (0.32) | 11.41 (3.25) | 0.40 (0.27) | — | ||
| CHOS | 5 | 0.96 (0.35) | 1.43 (0.12) | 5.16 (1.44) | 0.00 (0.00) | — | ||
| BBAug0910 (NT) | All | 105 | 0.84 (0.33) | 1.65 (0.24) | 4.16 (1.80) | 0.17 (0.78) | 317.87 (278.38) | |
| CHO | 3 | 0.47 (0.02) | 1.78 (0.06) | 2.95 (0.80) | 0.00 (0.00) | |||
| CHNO | 96 | 0.86 (0.34) | 1.65 (0.24) | 4.21 (1.78) | 0.18 (0.81) | — | ||
| CHOS | 6 | 0.81 (0.07) | 1.64 (0.22) | 3.86 (2.01) | 0.00 (0.00) | — | ||
| BBAug1011 | All | 137 | 0.86 (0.43) | 1.64 (0.31) | 4.65 (2.70) | 0.62 (2.3) | 321.29 (280.17) | |
| CHO | 25 | 0.33 (0.14) | 1.48 (0.29) | 7.43 (3.64) | 0.17 (0.18) | |||
| CHNO | 65 | 1.18 (0.38) | 1.77 (0.34) | 3.82 (2.49) | 1.23 (3.22) | — | ||
| CHOS | 47 | 0.67 (0.15) | 1.54 (0.20) | 4.58 (1.45) | 0.00 (0.04) | — | ||
| BBAug1314 | TB-specific species | All | 851 | 0.54 (0.27) | 1.21 (0.34) | 10.07 (4.70) | 0.26 (0.21) | 326.08 (282.65) |
| CHO | 349 | 0.46 (0.19) | 1.08 (0.29) | 12.03 (4.24) | 0.37 (0.18) | |||
| CHNO | 444 | 0.59 (0.31) | 1.29 (0.31) | 9.19 (4.18) | 0.20 (0.20) | — | ||
| CHOS | 58 | 0.66 (0.29) | 1.56 (0.42) | 3.30 (2.29) | 0.04 (0.08) | — | ||
| Aerosol mixture | Status | Molecular group | LDIa | |||||
|---|---|---|---|---|---|---|---|---|
| MF | O/Cwa | H/Cwa | DBEwa | AImod | T g,RH (K) | |||
| a Two additional molecular groups: CH and CHN were detected here with formulae forming only <1% of all assignments, and hence, have been omitted from this summary. | ||||||||
| BBAug0910 (NT) | Non-TB species | All | 53 | 0.16 (0.15) | 0.88 (0.43) | 8.83 (3.82) | 0.61 (0.29) | 234.70 (232.02) |
| CHO | 20 | 0.21 (0.16) | 1.20 (0.53) | 7.72 (4.45) | 0.45 (0.34) | |||
| CHNO | 22 | 0.21 (0.11) | 0.89 (0.30) | 8.12 (2.40) | 0.62 (0.21) | — | ||
| CHOS | Not detected | |||||||
| BBAug1011 | All | 66 | 0.36 (0.17) | 1.13 (0.46) | 7.11 (3.69) | 0.42 (0.31) | 263.75 (244.60) | |
| CHO | 29 | 0.27 (0.12) | 1.29 (0.51) | 6.47 (4.61) | 0.33 (0.31) | |||
| CHNO | 37 | 0.43 (0.18) | 1.00 (0.34) | 7.64 (2.57) | 0.49 (0.30) | — | ||
| CHOS | Not detected | |||||||
| BBAug1314 | TB-specific species | All | 2006 | 0.72 (0.35) | 1.11 (0.32) | 9.81 (4.88) | 0.34 (0.81) | 348.89 (189.93) |
| CHO | 879 | 0.57 (0.24) | 1.00 (0.27) | 12.32 (3.86) | 0.36 (0.23) | |||
| CHNO | 698 | 0.54 (0.19) | 0.98 (0.25) | 12.02 (3.37) | 0.38 (0.23) | — | ||
| CHOS | 423 | 1.09 (0.30) | 1.40 (0.26) | 4.38 (2.05) | 0.28 (1.42) | — | ||
To further validate the TB-specific species, we compared all samples from this study with a TB-rich aerosol sample, BBSep05.13 This sample was reported to have >95% TBs and was collected a year earlier at the same sampling site. As drawn in Fig. 4, BBAug1314 had the largest overlap of formulae with BBSep05, instead of samples collected at the same site a day before and after. This comparison is based on (−)ESI measurements only because Brege et al.13 did not perform ultrahigh-resolution LDI analyses on TB-rich aerosol. The formulae that overlapped between the two TB-rich samples (n = 671) collected a year apart are drawn in VK plots in the insets of Fig. 4. Here, CHNO and CHO groups comprised 49.9% and 44.5% of the common species with O/C ≤ 0.5 (average O/C = 0.45). The species unique to BBSep05 (n = 1630), which had a much greater fraction of TBs as compared to BBAug1314, comprised largely of CHNO (52.7%) and CHO (40.4%) formulae with average O/C of 0.44. The dominance of N-containing compounds in these TB-rich samples is consistent with previous reports on the uniform distribution of C, O, and N in TBs in <1–2 hour-old wildfire plumes,8,45 where non-volatile organic N could originate from nitroaromatics.8
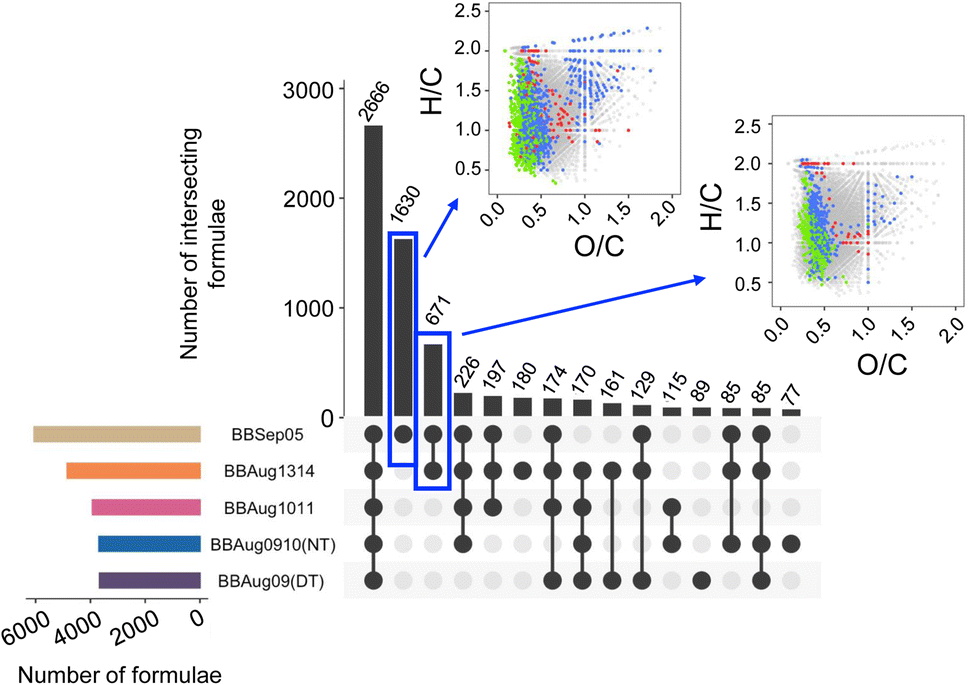 | ||
| Fig. 4 An UpSet plot depicting the number of common formulae between the different aerosol samples of this study and BBSep05 from Brege et al.13 in negative electrospray/ultrahigh-resolution analyses. | ||
Amongst the aerosol samples of this study, the average O/C of TB-specific and non-TB species from (−)ESI analysis was 0.54 and 0.81, respectively (Table 2). In this case, the low oxygenation of the TB-specific species may imply that TBs were somehow prevented from oxidative atmospheric ageing. This could be explained by the loss of SVOCs from young TBs, leaving behind E/LVOCs of high-viscosity on the surface that may slow further diffusion of oxidants into the interior as proposed by previous studies for high-viscosity aerosol.8,13,51,52 In contrast, average O/C of 0.72 and 0.27 were observed for TB-specific and non-TB species with (−)LDI (Table 3), where the very high oxygenation of TB is indicative of their aged nature as compared to non-TB aerosol. It is critical to understand whether these contrasting observations from (−)ESI and (−)LDI originate from their ionisation selectivity or are an artefact of the unique morphology and physicochemical traits of TBs. Most importantly, it must be assessed which ionisation method could obtain a more representative composition of TB.
Due to the differences in the observations for the inter-sample comparisons (Fig. S8†), the “interface” between the two ionisation methods, i.e., the commonly identified species, warrants further exploration to reduce the ionisation-selectivity bias in comparing the TB-rich and non-TB aerosol. As shown in Fig. 3, the species detected by both ionisation methods in each sample become increasingly oxygenated and unsaturated (which was also noted with (−)LDI analyses) with enhancement in TB content. To further test the credibility of (−)LDI, a third ionisation method, LDIextract was performed; >80% of formulae from (−)LDI were shared with either (−)LDIextract or (−)ESI (Fig. S9†). Samples were prepared for (−)LDIextract in the same way as for ESI, but it revealed trends in TB versus non-TB differences that were similar to those seen with (−)LDI; this may be indicative of sample preparation (for instance, extraction/solubilisation in ACN or any other suitable solvent) for (−)ESI analysis being a minor factor in determining outcome observed here. Rather, it is more likely the unique morphology and physicochemical nature of TBs renders (−)LDI to be better suited to measure their composition. For instance, it must be noted here that EELS revealed C to be uniformly distributed in TBs of BBAug1314 (Fig. S10†), while O was localised toward the outer edge of TBs, which is in line with previous studies on TB morphology.10,12,46 We speculate that although neither ionisation method might be fully representative of the molecular composition of TBs, the distribution of ion abundances of molecular species shown in Fig. S6 and S7† suggest that (−)LDI may cover a comparatively broader spectrum of high (e.g., #O > 7) to low-oxygenation species (e.g., CH and CHN species with #O = 0), especially those with extremely low volatilities, as compared to (−)ESI, making it a more suitable choice for refractory particles, such as TBs that may have a unique spatial fractionation of aged and non-aged molecular species.10,46
Translating the molecular composition of TBs to their physicochemical properties
We estimated the Tg, phase states, and volatilities of aerosol samples from their elemental compositions. We anticipated the extremely low volatility and high viscosity of TBs to be reflected in the physical properties estimated from their elemental compositions. Oxygenation is positively correlated with the photochemical age of atmospheric OA, which is, in turn, inversely correlated to volatility.53 Extremely low or low volatility organic compounds (E/LVOCs) were dominant in all samples. In (−)LDI analysis, 83.4% of the species in the TB-rich sample and 52.3–68.9% of the species in non-TB aerosol samples were classified as E/LVOCs. Fig. 5E depicts TB-specific and non-TB species as a function of the C number in their molecules. For every given number of C atoms, the estimated C0 (presented as log10C0) for TB-specific molecules was lower than that for non-TB molecules. Contrarily, non-TB aerosols were classified as LVOC, SVOCs, or IVOCs, implying a greater likelihood of their partitioning to the gas phase.54 It must be noted that the oxygenation levels in TBs could not be corroborated here by direct measurements. However, phase states and mixing states were measured using micro-spectroscopic approaches as detailed above. These measurements were consulted to assess the accuracy of our estimations.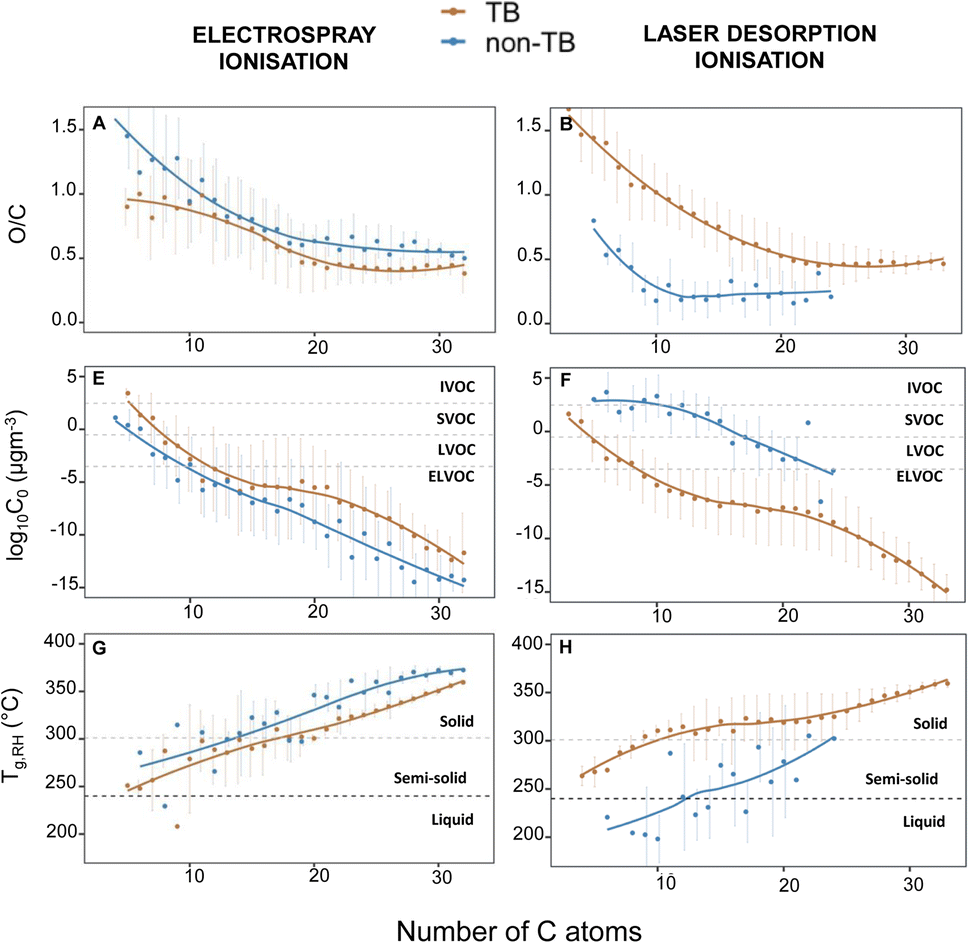 | ||
| Fig. 5 Average values of O/C, log10 of estimated saturation mass concentration (log10C0), and relative-humidity dependent glass transition temperature (Tg,RH) against the number of C atoms in the formulae assigned. Components exclusively identified in BBAug1318 (TB-rich) are plotted relative to non-TB components (identified in BBAug1011, BBAug0910 (NT), and/or BBAug09 (DT)). In (−)ESI, all three non-TB aerosol samples were considered, while for (−)LDI, non-TB refers to BBAug0910 (NT) and BBAug1011 only. | ||
T g,dry and Tg,RH, as well as corresponding phase states, can be derived for CHO species only.17,18 Here, these estimates were assumed to be representative of the phase states of overall OA. Under this assumption, an average Tg,RH of ∼300 K and average Tg,dry of ∼305 K was calculated for the TB-rich sample using both (−)ESI and (−)LDI. These average values were higher than the ambient temperature recorded on the sampling day (296 K), indicating that the TB-rich sample exists largely in a solid state.18,20Fig. 5G and H show the distribution trends of Tg,RH for species exclusively detected in TB-rich and non-TB aerosol from (−)LDI analysis. TB-specific molecules were either semi-solid or solid at ambient conditions on the sampling day, while the non-TB samples were projected to be semi-solids or liquids. Therefore, overall, the molecular composition measured by (−)LDI/15-T FT-ICR MS analysis correlated well with the known physicochemical properties of TBs.
Functional group analysis
Functional groups are key determinants of the physical properties of OA. According to STXM/NEXAFS analysis, carboxylate (COO) was more prevalent in TBs (46%) as compared to non-TB aerosol (<25%) (Fig. 6). An increase in the oxidation state of carbon by enhancement of –COO– functionality is a common path toward atmospheric ageing,55,56 which has been reported for TBs as well.8 To gain insight into the distribution of COO and other functional units from high-resolution mass spectrometric data, the frequency of all possible differences in measured masses of ions (Δm) were calculated in the mass spectra of both full-day aerosol samples, BBAug1011 (i.e., non-TB aerosol) and BBAug1314 (the TB-rich aerosol). Considering that molecular species are related to one another with commonly repeating units, such as CH2, H2, or O, in complex mixtures35 like the aerosol samples studied here, predominant Δm values help delineate other such repeating units, which in turn, provide insight into the possible functional groups, albeit not decisively. With both (−)ESI and (−)LDI analyses, ≥70% of ions were present at one of the following Δm from another ion (s): 14.01565 (CH2), 12.00000 (C), 27.99491(CO), 30.01056 (CH2O), 42.01056 (C2H2O), 15.99491 (O), 2.01565 (H2), 26.01565 (C2H2), 44.02621 (C2H4O), 18.01056 (H2O). These observations were supported by STXM/NEXAFS analysis, where absorption peaks were recorded at 285.2, 286.7, and 288.5 eV that correspond to sp2, ketonic, and carboxylic carbon for TB and non-TB aerosol (Fig. 6). Previously, aromatic, ketonic, phenolic, or carboxylic carbon has been reported in TBs.8,46,57 Aromatic moieties, particularly, nitroaromatics, are important in imparting the variable light-absorbing properties of TBs.8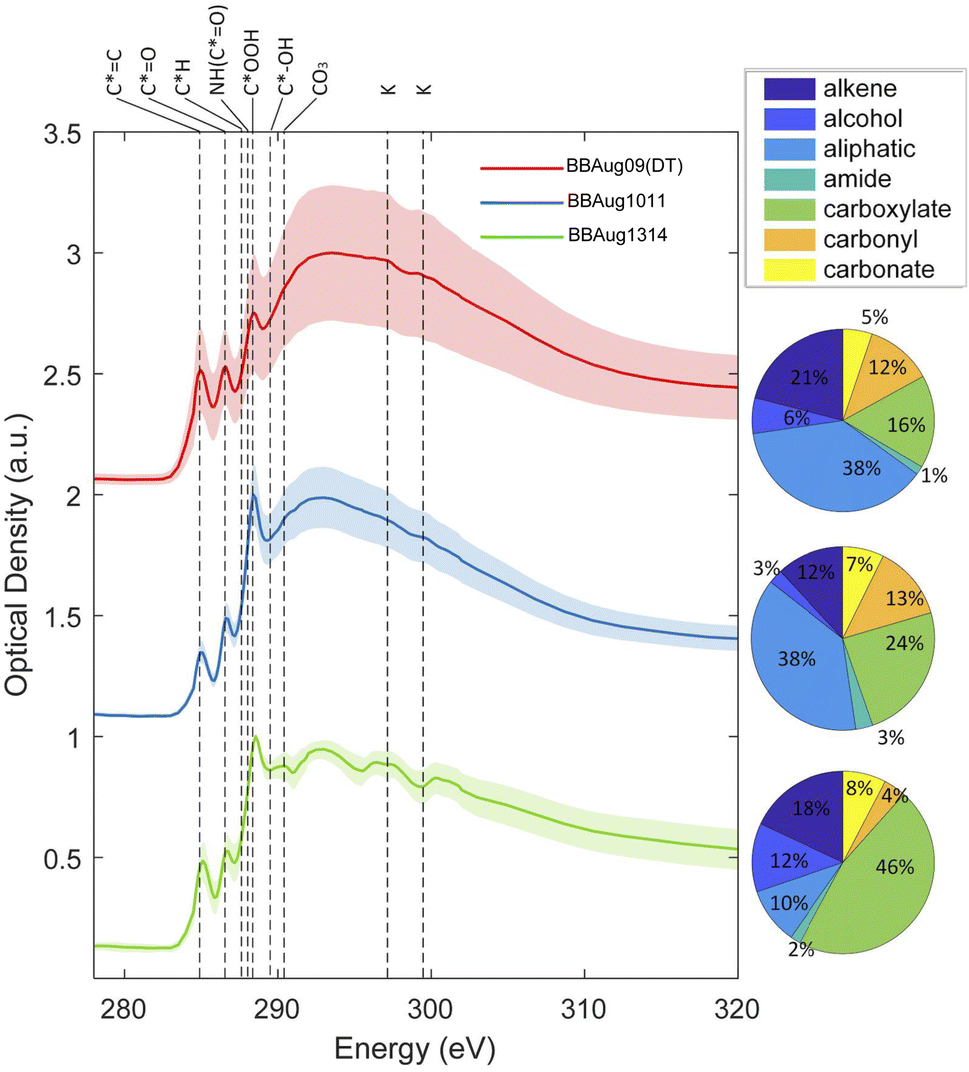 | ||
| Fig. 6 Carbon K-edge absorption spectra from scanning transmission electron microscopy and near-edge X-ray absorption fine structure spectroscopy (STXM/NEXAFS) analysis of two non-TB aerosol samples, BBAug09 (DT) and BBAug1011, and the TB-rich aerosol, BBAug1314. Each spectrum shows the average absorption for particles analysed for the respective sample, and the ribbon around covers the standard deviation. Major absorption peaks correspond to sp2, ketonic, and carboxylic functionalities. | ||
Δm > 78 Da in HRMS datasets could be indicative of aromatic rings but were very sparse as compared to the highly prevalent Δm stated earlier. We focused on them by Kendrick mass defect (KMD) analysis with C6H5O, C7H6O, and C6H5NO3 as base units; this approach makes it possible to recognise a series of compounds belonging to the class or type with the corresponding base unit, but different extents of base unit addition.58 In this analysis, individual peak abundances were normalised in each dataset to the sum of the abundance of species that were identified to be a part of the KMD series with C (12.00000) as the base unit. As per this analysis, CH2, CO2, OCH2, and H2O were evenly present throughout all samples (Fig. S11†). The cumulative normalised abundance of ions that potentially had ≥1 aromatic moiety, specifically phenol (C6H5O) and nitroaromatic (C6H5NO3) functionalities, was substantially higher in the TB-rich aerosol (BBAug1314 and BBSep05) as compared to the non-TB aerosol (BBAug1011).
Conclusions
We have characterised a TB-rich aerosol sample using 15-T FT-ICR MS analysis in conjunction with (−)ESI and (−)LDI. TBs are a highly viscous form of atmospheric particulate matter that persist for long time periods, potentially facilitating cloud or ice formation in the upper atmosphere and even carrying toxic components within them. Owing to the capability of TBs to undergo long-range transport, their threat to remote ecosystems and communities is magnified. Here, TB-specific molecular signatures were derived that comprised species exclusively detected in a TB-rich aerosol (relative to 2–3 non-TB aerosol samples). Estimations of physical properties using the elemental compositions of TB-specific species from (−)LDI strongly corroborated the physicochemical measurements from micro-spectroscopic analyses conducted here or reported previously. Due to the chemical diversity and complexity of atmospheric OA, neither of the ionisation methods may provide complete coverage of molecular composition. However, in this instance, where a refractory fraction of OA is of concern, (−)LDI provided a more “relevant” perspective by elucidating molecular species that are more likely to have high viscosity and low volatilities in the TB-rich aerosol. Nevertheless, the observation of low-oxygenation species in TB-rich samples from (−)ESI cannot be ignored, as it may be an indication of the presence of relatively less processed OA in these particles. Our findings suggest that the OA in wildfire smoke likely undergoes non-reactive volatilisation of SVOCs and IVOCs after emission, leaving behind refractory, solidification-prone, and low-volatility species yielding TBs. In addition, the chemical reactivity of TBs after formation with lowered diffusivity of oxidants toward the centre could be an explanation for less oxygenated species observed by (−)ESI. Overall, as (−)LDI eliminated the need for extraction and sample preparation and also covered molecules with a wider range of O atoms with extremely low volatilities, it was able to present a more representative composition of TBs as compared to (−)ESI. Considering the excellent performance of (−)LDI in delineating the composition of TBs compared to non-TB aerosol in this study, its potential to examine other aerosol, such as fresh emissions or size-resolved fractions of SOA, merits evaluation in the future.Author contributions
The manuscript was written through the contributions of all authors. The samples were collected and prepared by S. C. and L. R. M. Mass spectrometric data were collected and pre-processed by W. K. Mass spectrometric data were post-processed and analysed by A. I. and S. K. S. Single-particle analyses were carried out by Z. C., S. M., L. K., and N. N. L. The project was awarded to and supervised by L. R. M.Conflicts of interest
There are no conflicts to declare.Acknowledgements
This research was performed on a project award (https://doi.org/10.46936/lser.proj.2019.50795/60000103) from the Environmental Molecular Sciences Laboratory, a DOE Office of Science User Facility sponsored by the Biological and Environmental Research Programme under contract no. DE-AC05-76RL01830. The authors also acknowledge support from the US Department of Energy (DE-SC0021168). STXM/NEXAFS analysis at Beamline 5.3.2 of the Advanced Light Source at Lawrence Berkeley National Laboratory was supported by the Office of Science and Office of Basic Energy Sciences of the U.S. Department of Energy. We thank Matthew Markus for his guidance in this regard. We would also like to thank Dr Claudio Mazzoleni for his suggestions that made the manuscript more palatable for a non-chemist. AI was supported with a Fulbright Foreign Student Exchange Program by the US Department of State. AI also extends thanks to Subuktageen Qitta for his intellectual input that greatly helped improve the process of compiling this report.Notes and references
- A. Ansmann, H. Baars, A. Chudnovsky, I. Mattis, I. Veselovskii, M. Haarig, P. Seifert, R. Engelmann and U. Wandinger, Atmos. Chem. Phys., 2018, 18, 11831–11845 CrossRef CAS.
- M. N. Ndalila, G. J. Williamson, P. Fox-Hughes, J. Sharples and D. M. Bowman, Nat. Hazards Earth Syst. Sci., 2020, 20, 1497–1511 CrossRef.
- G. Zheng, A. J. Sedlacek, A. C. Aiken, Y. Feng, T. B. Watson, S. Raveh-Rubin, J. Uin, E. R. Lewis and J. Wang, Environ. Int., 2020, 139, 105680 CrossRef CAS PubMed.
- P. Yu, O. B. Toon, C. G. Bardeen, Y. Zhu, K. H. Rosenlof, R. W. Portmann, T. D. Thornberry, R.-S. Gao, S. M. Davis and E. T. Wolf, Science, 2019, 365, 587–590 CrossRef CAS PubMed.
- M. Pósfai, R. Simonics, J. Li, P. V. Hobbs and P. R. Buseck, J. Geophys. Res.: Atmos., 2003, 108, D13 CrossRef.
- M. Pósfai, A. Gelencsér, R. Simonics, K. Arató, J. Li, P. V. Hobbs and P. R. Buseck, J. Geophys. Res.: Atmos., 2004, 109, D06213 CrossRef.
- A. J. Sedlacek III, P. R. Buseck, K. Adachi, T. B. Onasch, S. R. Springston and L. Kleinman, Atmos. Chem. Phys., 2018, 18, 11289–11301 CrossRef.
- K. Adachi, A. J. Sedlacek, L. Kleinman, S. R. Springston, J. Wang, D. Chand, J. M. Hubbe, J. E. Shilling, T. B. Onasch and T. Kinase, Proc. Natl. Acad. Sci., 2019, 116, 19336–19341 CrossRef CAS PubMed.
- L. Kleinman, K. Adachi, D. Chand, A. J. Sedlacek III and P. R. Buseck, Transmission Electron Microscopy Analysis of Tarball Formation and Volatility from Biomass-burning Aerosol Particles during the 2013 BBOP Campaign, Abstract A52A-03 presented at 2014 Fall Meeting, AGU, San Francisco, California, 15–19 Dec, 2014, https://www.youtube.com/watch?v=Gb6t4D3oDvo Search PubMed.
- S. China, C. Mazzoleni, K. Gorkowski, A. C. Aiken and M. K. Dubey, Nat. Commun., 2013, 4, 1–7 Search PubMed.
- Q. Yuan, J. Xu, L. Liu, A. Zhang, Y. Liu, J. Zhang, X. Wan, M. Li, K. Qin and Z. Cong, Environ. Sci. Technol. Lett., 2020, 8, 16–23 CrossRef.
- J. L. Hand, W. Malm, A. Laskin, D. Day, T.-b. Lee, C. Wang, C. Carrico, J. Carrillo, J. P. Cowin and J. Collett Jr., J. Geophys. Res.: Atmos., 2005, 110, D21 CrossRef.
- M. A. Brege, S. China, S. Schum, A. Zelenyuk and L. R. Mazzoleni, ACS Earth Space Chem., 2021, 5, 2729–2739 CrossRef CAS.
- A. P. S. Hettiyadura, V. Garcia, C. Li, C. P. West, J. Tomlin, Q. He, Y. Rudich and A. Laskin, Environ. Sci. Technol., 2021, 55, 2511–2521 CrossRef CAS PubMed.
- Y. Li, U. Pöschl and M. Shiraiwa, Atmos. Chem. Phys., 2016, 16, 3327–3344 CrossRef CAS.
- T. Koop, J. Bookhold, M. Shiraiwa and U. Pöschl, Phys. Chem. Chem. Phys., 2011, 13, 19238–19255 RSC.
- W.-S. W. DeRieux, Y. Li, P. Lin, J. Laskin, A. Laskin, A. K. Bertram, S. A. Nizkorodov and M. Shiraiwa, Atmos. Chem. Phys., 2018, 18, 6331–6351 CrossRef.
- M. Shiraiwa, Y. Li, A. P. Tsimpidi, V. A. Karydis, T. Berkemeier, S. N. Pandis, J. Lelieveld, T. Koop and U. Pöschl, Nat. Commun., 2017, 8, 1–7 CrossRef PubMed.
- Y. Li, D. A. Day, H. Stark, J. L. Jimenez and M. Shiraiwa, Atmos. Chem. Phys., 2020, 20, 8103–8122 CrossRef CAS.
- S. K. Schum, B. Zhang, K. Džepina, P. Fialho, C. Mazzoleni and L. R. Mazzoleni, J. Atmos. Chem. Phys., 2018, 18, 14017–14036 CrossRef CAS.
- M. Brege, M. Paglione, S. Gilardoni, S. Decesari, M. C. Facchini and L. R. Mazzoleni, J. Atmos. Chem. Phys., 2018, 18, 13197–13214 CrossRef CAS.
- A. Wozniak, J. Bauer, R. Sleighter, R. Dickhut and P. Hatcher, Atmos. Chem. Phys., 2008, 8, 5099–5111 CrossRef CAS.
- A. Ijaz, W. Kew, S. China, S. K. Schum and L. R. Mazzoleni, Anal. Chem., 2022, 94, 14537–14545 CrossRef CAS PubMed.
- J. Laskin, A. Laskin, P. J. Roach, G. W. Slysz, G. A. Anderson, S. A. Nizkorodov, D. L. Bones and L. Q. Nguyen, Anal. Chem., 2010, 82, 2048–2058 CrossRef CAS PubMed.
- R. E. O'Brien, T. B. Nguyen, A. Laskin, J. Laskin, P. L. Hayes, S. Liu, J. L. Jimenez, L. M. Russell, S. A. Nizkorodov and A. H. Goldstein, J. Geophys. Res.: Atmos., 2013, 118, 1042–1051 CrossRef.
- P. J. Roach, J. Laskin and A. Laskin, Anal. Chem., 2010, 82, 7979–7986 CrossRef CAS PubMed.
- C. Giorio, C. Bortolini, I. Kourtchev, A. Tapparo, S. Bogialli and M. Kalberer, Chemosphere, 2019, 224, 786–795 CrossRef CAS PubMed.
- J. W. Blackburn, W. Kew, M. C. Graham and D. a. Uhrín, Anal. Chem., 2017, 89, 4382–4386 CrossRef CAS PubMed.
- J. Xue, Y. Li, X. Xie, C. Xiong, H. Liu, S. Chen, Z. Nie, C. Chen and J. Zhao, Atmos. Environ., 2017, 159, 55–65 CrossRef CAS.
- S. Geddes, B. Nichols, S. Flemer Jr., J. Eisenhauer, J. Zahardis and G. A. Petrucci, Anal. Chem., 2010, 82, 7915–7923 CrossRef CAS PubMed.
- C. Barth, K.-P. Hinz and B. Spengler, Anal. Bioanal. Chem., 2022, 414, 7223–7241 CrossRef CAS PubMed.
- A. Kamissoko, V. Carré, S. Schramm and F. Aubriet, Rapid Commun. Mass Spectrom., 2019, 33, 95–108 CrossRef CAS PubMed.
- M. Fahad, PhD thesis, Michigan Technological University, 2021.
- M. Fahad and D. R. Fuhrmann, arXiv, 2022, preprint, arXiv:2201.07915, DOI:10.5121/sipij.2021.12601.
- S. K. Schum, L. E. Brown and L. R. Mazzoleni, Environ. Res., 2020, 191, 110114 CrossRef CAS PubMed.
- B. Koch and T. Dittmar, Rapid Commun. Mass Spectrom., 2006, 20, 926–932 CrossRef CAS.
- B. P. Koch and T. Dittmar, Rapid Commun. Mass Spectrom., 2016, 30, 250 CrossRef CAS.
- N. M. Donahue, S. A. Epstein, S. N. Pandis and A. L. Robinson, Atmos. Chem. Phys., 2011, 11(7), 3303–3318 CrossRef CAS.
- N. N. Lata, B. Zhang, S. Schum, L. Mazzoleni, R. Brimberry, M. A. Marcus, W. H. Cantrell, P. Fialho, C. Mazzoleni and S. China, ACS Earth Space Chem., 2021, 5, 3499–3510 CrossRef CAS.
- Z. Cheng, N. Sharma, K.-P. Tseng, L. Kovarik and S. China, RSC Adv., 2021, 11, 15264–15272 RSC.
- R. C. Moffet, A. V. Tivanski and M. K. Gilles, Scanning Transmission X-Ray Microscopy: Applications in Atmospheric Aerosol Research, Lawrence Berkeley National Lab. (LBNL), Berkeley, CA (United States), 2011 Search PubMed.
- R. E. O'Brien, A. Neu, S. A. Epstein, A. C. MacMillan, B. Wang, S. T. Kelly, S. A. Nizkorodov, A. Laskin, R. C. Moffet and M. K. Gilles, Geophys. Res. Lett., 2014, 41, 4347–4353 CrossRef.
- J. M. Tomlin, K. A. Jankowski, F. A. Rivera-Adorno, M. Fraund, S. China, B. H. Stirm, R. Kaeser, G. S. Eakins, R. C. Moffet and P. B. Shepson, ACS Earth Space Chem., 2020, 4, 2171–2184 CrossRef CAS.
- Z. Cheng, M. Morgenstern, B. Zhang, M. Fraund, N. N. Lata, R. Brimberry, M. A. Marcus, L. Mazzoleni, P. Fialho and S. Henning, Atmos. Chem. Phys., 2022, 22, 9033–9057 CrossRef CAS.
- K. Adachi and P. R. Buseck, J. Geophys. Res.: Atmos., 2011, 116, D5 CrossRef.
- A. V. Tivanski, R. J. Hopkins, T. Tyliszczak and M. K. Gilles, J. Phys. Chem. A, 2007, 111, 5448–5458 CrossRef CAS PubMed.
- A. Bougiatioti, P. Nikolaou, I. Stavroulas, G. Kouvarakis, R. Weber, A. Nenes, M. Kanakidou and N. Mihalopoulos, Atmos. Chem. Phys., 2016, 16, 4579–4591 CrossRef CAS.
- J. H. Gross, Mass Spectrometry: A Textbook, Springer Science & Business Media, 2006 Search PubMed.
- P. Lin, P. K. Aiona, Y. Li, M. Shiraiwa, J. Laskin, S. A. Nizkorodov and A. Laskin, Environ. Sci. Technol., 2016, 50, 11815–11824 CrossRef CAS PubMed.
- M. Shrivastava, S. Lou, A. Zelenyuk, R. C. Easter, R. A. Corley, B. D. Thrall, P. J. Rasch, J. D. Fast, S. L. Massey Simonich and H. Shen, Proc. Natl. Acad. Sci., 2017, 114, 1246–1251 CrossRef CAS PubMed.
- J. P. Reid, A. K. Bertram, D. O. Topping, A. Laskin, S. T. Martin, M. D. Petters, F. D. Pope and G. Rovelli, Nat. Commun., 2018, 9, 956 CrossRef PubMed.
- M. L. Hinks, M. V. Brady, H. Lignell, M. Song, J. W. Grayson, A. K. Bertram, P. Lin, A. Laskin, J. Laskin and S. A. Nizkorodov, Phys. Chem. Chem. Phys., 2016, 18, 8785–8793 RSC.
- J. L. Jimenez, M. Canagaratna, N. Donahue, A. Prevot, Q. Zhang, J. H. Kroll, P. F. DeCarlo, J. D. Allan, H. Coe and N. Ng, Science, 2009, 326, 1525–1529 CrossRef CAS PubMed.
- J. H. Seinfeld and S. N. Pandis, in Atmospheric Chemistry and Physics: From Air Pollution to Climate Change, John Wiley & Sons, 3rd edn, 2016 Search PubMed.
- M. Shrivastava, C. D. Cappa, J. Fan, A. H. Goldstein, A. B. Guenther, J. L. Jimenez, C. Kuang, A. Laskin, S. T. Martin and N. L. Ng, Rev. Geophys., 2017, 55, 509–559 CrossRef.
- N. E. Rothfuss and M. D. Petters, Environ. Sci. Technol., 2017, 51, 271–279 CrossRef CAS PubMed.
- Á. Tóth, A. Hoffer, M. Pósfai, T. Ajtai, Z. Kónya, M. Blazsó, Z. Czégény, G. Kiss, Z. Bozóki and A. Gelencsér, Atmos. Chem. Phys., 2018, 18, 10407–10418 CrossRef.
- C. A. Hughey, C. L. Hendrickson, R. P. Rodgers, A. G. Marshall and K. Qian, Anal. Chem., 2001, 73, 4676–4681 CrossRef CAS PubMed.
Footnotes |
| † Electronic supplementary information (ESI) available: The ESI includes ESI Fig. S1–S11, Tables S1 and S2, as well as the R or python codes used to process data (.PDF). Datasets S1–S3 (.xlxs) contain a full list of masses and formulae assigned by (−)LDI, (−)ESI, and (−)LDIextract. See DOI: https://doi.org/10.1039/d3ea00085k |
| ‡ Present address: Laboratoire Chimie Environnement, Aix-Marseille Université, Marseille 13005, France. |
| This journal is © The Royal Society of Chemistry 2023 |