Copper(II) complex enhanced chemodynamic therapy through GSH depletion and autophagy flow blockade†
Wen-Ying
Shen‡
ab,
Chun-Peng
Jia‡
a,
Li-Yi
Liao
a,
Liu-Lin
Chen
a,
Cheng-Cheng
Yuan
a,
Yun-Qiong
Gu
a,
Yang-Han
Liu
a,
Hong
Liang
*a and
Zhen-Feng
Chen
 *a
*a
aState Key Laboratory for Chemistry and Molecular Engineering of Medicinal Resources, Collaborative Innovation Center for Guangxi Ethnic Medicine, School of Chemistry and Pharmaceutical Sciences, Guangxi Normal University, Guilin 541004, P. R. China. E-mail: hliang@gxnu.edu.cn; chenzf@gxnu.edu.cn
bScientific Research Center, Guilin Medical University, Guilin, 541199, P. R China
First published on 10th January 2023
Abstract
Three copper(II) complexes C1–C3 were synthesized and fully characterized as chemodynamic therapy (CDT) anticancer agents. C1–C3 showed greater cytotoxicity than their ligands toward SK-OV-3 and T24 cells. Particularly, C2 showed high cytotoxicity toward T24 cells and low cytotoxicity toward normal human HL-7702 and WI-38 cells. Mechanistic studies demonstrated that C2 oxidized GSH to GSSG and produced ˙OH, which induced mitochondrial dysfunction and ER stress, finally leading to apoptosis of T24 cells. In addition, C2 inhibited autophagy by blocking autophagy flow, thereby closing the self-protection pathway of oxidative stress to enhance CDT. Importantly, C2 significantly inhibited T24 tumor growth with 57.1% inhibition in a mouse xenograft model. C2 is a promising lead as a potential CDT anticancer agent.
Introduction
Although platinum anticancer drugs are commonly used for the treatment of various solid tumors, they lack specificity and selectivity to cancer cells which result in serious side effects.1–5 Therefore, how to reduce the toxicity and side effects of metal complex drugs, improve their efficacy and overcome drug resistance have been the focus of medicinal chemists.Compared with normal cells, the concentration of reactive oxygen species (ROS) in cancer cells is higher, and cancer cells are more sensitive to the increase in ROS levels.6,7 Modulation of ROS levels in tumor cells could enhance efficacy and reduce side effects. Bu et al. took advantage of the tumor microenvironment (TME) of weak acidity, hypoxia, and higher levels of H2O2 and glutathione (GSH) and proposed a new treatment strategy called chemodynamic therapy (CDT) by utilizing the Fenton/Fenton-like reaction. CDT uses the Fenton/Fenton-like reaction catalyzed by metal ions (e.g. Fe2+, Mn2+, Co2+, Ti3+ and Cu+) to convert excess H2O2 in tumor tissues into highly cytotoxic ˙OH to induce oxidative stress, which subsequently induces cancer cell apoptosis.8–12 Due to the TME, CDT exhibits higher specificity of ROS generation in tumor tissues and lower side effects on normal tissues.13,14 However, overexpression of intracellular glutathione (GSH) in tumor cells, which has a strong scavenging effect on ROS, is an obstacle for CDT.15–17 Thus, reducing the level of intracellular GSH is desirable to avoid tumor resistance and improve the efficacy of CDT.18–20 Tai et al. reported a novel bimetallic Cu(II) complex enhancing CDT by oxidizing GSH into glutathione (GSSG).21 Copper(II) complexes are expected to reduce GSH concentration and have been used to enhance CDT for cancer treatment. Cancer cells could initiate protective autophagy to remove impaired organelles and toxic proteins involved in ROS generation for detoxification and maintaining homeostasis. Therefore, inhibiting the autophagy of cancer cells to enhance the effect of CDT and induce apoptosis is another effective anticancer strategy.22–24
The coordination of transition metal ions with bioactive ligands to form complexes is an effective strategy to improve the activity of metal-based anticancer drugs.25,26 Quinoline is the key core structure of many antitumor agents, and its derivatives are often chosen as ligands to coordinate with metal ions to form anticancer metal complexes.27–31 Our group has reported many metal complexes with quinoline as the ligand including Cu(II) quinoline complexes that can be used as CDT agents, with remarkable antitumor activity.32–34 As a continuation of our previous work, we synthesized dichloro-substituted quinoline derivative Cu(II) complexes (C1–C3) as CDT agents. Cu(II) could deplete GSH to produce Cu(I), which further catalyzes the conversion of H2O2 into highly cytotoxic ˙OH. At the same time, C2 enhances CDT by inhibiting autophagy flow.
Experimental
Materials
All chemicals were obtained commercially and used without further purification unless otherwise specified. All compounds were initially dissolved in DMF with an initial concentration of 2 mM.Syntheses of L1–L3
2-(2-Fluorophenyl)-3-aminoquinoline was obtained according to the steps reported in the references.34–37 Then 2-(2-fluorophenyl)-3-aminoquinoline and 2-hydroxybenzaladehyde derivatives were dissolved in CH3OH by continuously stirring at 80 °C for 5–12 h. The product quinolone ligand was obtained by cooling, filtering, and further recrystallizing with CH3OH.L1 (yield: 90%): HRMS: m/z 409.0321 [M − H]−. 1H NMR (400 MHz, DMSO-d6): δ 12.41 (s, 1H), 9.10 (s, 1H), 8.45 (s, 1H), 8.11 (d, J = 2.0 Hz, 2H), 8.09 (t, J = 1.5 Hz, 2H), 7.90 (s, 1H), 7.83 (ddd, J = 8.4, 6.9, 1.5 Hz, 1H), 7.71 (ddd, J = 8.2, 6.9, 1.2 Hz, 1H), 7.66–7.58 (m, 2H), 7.57 (ddd, J = 9.9, 4.9, 2.1 Hz, 2H), 7.41–7.29 (m, 2H), 7.24 (d, J = 2.8 Hz, 1H). 13C NMR (100 MHz, DMSO-d6): δ 165.52, 159.80 (d, JC–F = 245.3 Hz), 158.00, 151.90, 146.81, 140.85, 136.91, 132.44, 132.08 (d, JC–F = 3.3 Hz), 131.81 (d, JC–F = 8.4 Hz), 130.49, 129.36, 128.62, 128.34, 128.24, 126.92 (d, JC–F = 15.8 Hz), 125.15 (d, JC–F = 3.0 Hz), 124.78, 121.05, 119.63, 119.09, 116.07 (d, JC–F = 21.7 Hz). 19F NMR (376 MHz, DMSO-d6): δ −115.04.
L2 (yield: 92%): HRMS: m/z 409.0324 [M − H]−. 1H NMR (400 MHz, DMSO-d6): δ 13.15 (s, 1H), 9.17 (s, 1H), 8.51 (s, 1H), 8.11 (t, J = 7.8 Hz, 2H), 7.84 (ddd, J = 8.4, 6.8, 1.5 Hz, 1H), 7.79–7.68 (m, 3H), 7.69–7.55 (m, 2H), 7.44–7.33 (m, 2H). 13C NMR (100 MHz, DMSO-d6): δ 165.09, 159.77 (d, JC–F = 245.3 Hz), 155.31, 151.88, 146.86, 141.02, 133.15, 132.07 (d, JC–F = 3.3 Hz), 131.80 (d, JC–F = 8.3 Hz), 131.32, 130.55, 129.35, 128.63, 128.27, 128.26, 126.88 (d, JC–F = 15.7 Hz), 125.14 (d, JC–F = 3.2 Hz), 124.71, 123.10, 121.89, 121.21, 116.04 (d, JC–F = 21.7 Hz). 19F NMR (376 MHz, DMSO-d6): δ −115.25.
L3 (yield: 87%): HRMS: m/z 409.0323 [M − H]−. 1H NMR (400 MHz, DMSO-d6): δ 12.41 (s, 1H), 9.10 (s, 1H), 8.46–8.42 (m, 1H), 8.10 (ddd, J = 8.0, 4.5, 1.3 Hz, 2H), 7.89 (s, 1H), 7.82 (ddd, J = 8.4, 6.9, 1.4 Hz, 1H), 7.71 (ddd, J = 8.2, 6.9, 1.2 Hz, 1H), 7.66–7.52 (m, 2H), 7.42–7.29 (m, 2H), 7.22 (s, 1H). 13C NMR (100 MHz, DMSO-d6): δ 163.25, 159.81 (d, JC–F = 245.3 Hz), 159.48, 152.06, 146.72, 141.85, 136.10, 133.05, 132.07 (d, JC–F = 3.5 Hz), 131.64 (d, JC–F = 8.2 Hz), 130.31, 129.33, 128.60, 128.40, 128.14, 127.10 (d, JC–F = 15.8 Hz), 125.00 (d, JC–F = 3.3 Hz), 124.11, 121.64, 120.47, 119.13, 115.93 (d, JC–F = 21.8 Hz). 19F NMR (376 MHz, DMSO-d6): δ −115.01.
Syntheses of C1–C3
Cu(OH)2, ligands, methanol and trichloromethane were mixed in a sample bottle and placed at 65 °C for 72 h. The products C1–C3 were harvested.C1 (yield: 80%): Anal. Calc. for C44H24CuF2Cl4N4O2: C 59.78; H 2.74; N 6.34; O 3.62%, found: C 59.81; H 2.77; N 6.30; O 3.59%. HRMS: m/z 919.9566 [M + K]+.
C2 (yield: 81%): Anal. Calc. for C44H24CuF2Cl4N4O2: C 59.78; H 2.74; N 6.34; O 3.62%, found: C 59.76; H 2.71; N 6.32; O 3.66%. HRMS: m/z 881.9975 [M + H]+, 903.9767 [M + Na]+.
C3 (yield: 82%): Anal. Calc. for C44H24CuF2Cl4N4O2: C 59.78; H 2.74; N 6.34; O 3.62%, found: C 59.80; H 2.71; N 6.31; O 3.65%. HRMS: m/z 919.9573[M + K]+.
1H NMR analysis of C1–C3 and GSH reaction
Equimolar amounts of copper(II) complexes and GSH were dissolved in deuterated DMSO and D2O at the volume ratios of 1![[thin space (1/6-em)]](https://www.rsc.org/images/entities/char_2009.gif) :
:![[thin space (1/6-em)]](https://www.rsc.org/images/entities/char_2009.gif) 5 and 60
5 and 60![[thin space (1/6-em)]](https://www.rsc.org/images/entities/char_2009.gif) :
:![[thin space (1/6-em)]](https://www.rsc.org/images/entities/char_2009.gif) 1, and sonicated for 2 h at r.t. to detect the ligand and GSSG on an NMR spectrometer, respectively.
1, and sonicated for 2 h at r.t. to detect the ligand and GSSG on an NMR spectrometer, respectively.
Intracellular ROS detection
T24 cells were treated with L2 (12 μM) and C2 (12 μM), respectively. After 8 hours, the cells were stained with DCFH-DA. Finally, the cells were imaged under a fluorescence microscope.Intracellular ˙OH determination
T24 cells were treated with C2 (12 μM). After 8 hours, the cells were stained with ˙OH detection dye (MitoROS OH580 working solution). The cells were washed with PBS and immediately imaged.Intracellular ATP determination
T24 cells were treated with C2 (12, 15, and 18 μM) for 48 hours, respectively. The cells were collected and washed and ATP detection was performed following manufacturer's instructions. An ATP kit was purchased from Solarbio (China).ΔΨm detection
T24 cells were treated with C2 (12, 15, and 18 μM), respectively. After 24 hours, the cells were stained with ΔΨm detection dye (JC-1 probe). Subsequently, the treated cells were further washed with PBS and the changes of ΔΨm were immediately detected.Apoptosis and cell cycle assay
T24 cells were treated with C2 (12, 15, and 18 μM), respectively. After 24 hours, the cells were stained with Annexin V for 15 min, followed by staining with PI. After incubation, apoptosis was evaluated by flow cytometry.T24 cells were treated with C2 (12, 15, and 18 μM), respectively. After 24 hours, the treated cells were collected and incubated with ice ethanol at minus 20 °C at least overnight. The cells were then treated with a cell cycle detection dye (PI/RNase staining solution) for half an hour. Finally, the cell cycle distribution was detected.
Protein expression analysis
T24 cells were incubated with C2 (12, 15, and 18 μM) for 48 hours, respectively. The cells were collected by centrifugation and lysed on ice for half an hour with the lysis buffer. The protein was collected by centrifugation and denatured at high temperature. Proteins with different molecular weights were separated, transformed, blocked, and incubated with primary and secondary antibodies, and finally developed.Cellular autophagosome detection
T24 cells were incubated in a six-well plate overnight, transfected with adenovirus carrying AdPlus-mCherry-GFP-LC3B. Then, the cells were treated with C2 (18 μM) for 48 h. Yellow fluorescent spots were observed under a fluorescence inverted microscope.Antitumor activity in vivo
Eighteen BALB/c nude mice were assigned to the vehicle group, C2 group and cisplatin group. The administration method was intraperitoneal injection. The C2 group was intraperitoneally (IP) treated with C2 at 20 mg kg−1 (vehicle was 5% DMF and 1% Tween 80 in saline, v/v) daily, the vehicle group was treated with vehicle daily and the cisplatin group was treated with cisplatin at 2 mg kg−1 (saline) every 2 days. Body weight of mice and length (l) and width (w) of T24 tumors were recorded every 2 days. The tumor volume was calculated using the formula: v = lw2/2.Results and discussion
Synthesis and structural characterization
Three dichloro-substituted quinoline derivatives L1–L3 were synthesized (Scheme 1). Their structures were determined by NMR spectroscopy and HRMS. As shown in Scheme 2, L1–L3's corresponding copper(II) complexes C1–C3 were synthesized by reacting L1–L3 with Cu(OH)2 in the presence of methanol and trichloromethane. The structures of C1–C3 were characterized by HRMS, FT-IR spectroscopy and elemental analysis. The crystal structures of C1–C3 were determined by single-crystal X-ray diffraction analysis. Their structures are mononuclear. The Cu(II) center was tetra-coordinated by two nitrogen atoms and two oxygen atoms from the two ligands, respectively (Fig. 1). Further details including the bond lengths and bond angles of C1–C3 are summarized in Tables S1 and S2.† | ||
| Fig. 1 The crystal structures of C1–C3. Hydrogen atoms and solvent molecules have been omitted for clarity. | ||
Stability of copper(II) complexes under physiological conditions
The stability of C1–C3 in PBS solution (pH = 7.4) containing 1% DMF was determined by UV-Vis spectroscopy. As shown in Fig. S22,† there were no obvious blue-shift and red-shift in the absorption characteristic peaks of C1–C3 with an increase in time (0, 24, and 48 h), indicating that the copper(II) complexes were stable under physiological conditions for 48 hours at room temperature.Reaction of C1–C3, GSH and H2O2
First, the reaction of C1–C3 with GSH was monitored by 1H NMR spectroscopy. Because the water solubility of C1–C3 was not high, 60![[thin space (1/6-em)]](https://www.rsc.org/images/entities/char_2009.gif) :
:![[thin space (1/6-em)]](https://www.rsc.org/images/entities/char_2009.gif) 1 and 1
1 and 1![[thin space (1/6-em)]](https://www.rsc.org/images/entities/char_2009.gif) :
:![[thin space (1/6-em)]](https://www.rsc.org/images/entities/char_2009.gif) 5 ratios of DMSO-d6 and D2O were used to detect the ligands and GSSG, respectively. When the ratio of DMSO-d6 to D2O was 60
5 ratios of DMSO-d6 and D2O were used to detect the ligands and GSSG, respectively. When the ratio of DMSO-d6 to D2O was 60![[thin space (1/6-em)]](https://www.rsc.org/images/entities/char_2009.gif) :
:![[thin space (1/6-em)]](https://www.rsc.org/images/entities/char_2009.gif) 1, the proton signal of the corresponding ligand was observed in the 1HNMR spectrum. When the ratio of DMSO-d6 to D2O was 1
1, the proton signal of the corresponding ligand was observed in the 1HNMR spectrum. When the ratio of DMSO-d6 to D2O was 1![[thin space (1/6-em)]](https://www.rsc.org/images/entities/char_2009.gif) :
:![[thin space (1/6-em)]](https://www.rsc.org/images/entities/char_2009.gif) 5, compared with the 1HNMR spectrum of GSH, an obvious signal appeared around 3.15 ppm, belonging to the β-CH2 group of Cys of GSSG, indicating that GSH was oxidized to GSSG by C1–C3 (Fig. S24–S29†).
5, compared with the 1HNMR spectrum of GSH, an obvious signal appeared around 3.15 ppm, belonging to the β-CH2 group of Cys of GSSG, indicating that GSH was oxidized to GSSG by C1–C3 (Fig. S24–S29†).
The EPR signals of ˙OH in the solution mixture of C1–C3, GSH and H2O2 are displayed in Fig. 2. A stronger 1![[thin space (1/6-em)]](https://www.rsc.org/images/entities/char_2009.gif) :
:![[thin space (1/6-em)]](https://www.rsc.org/images/entities/char_2009.gif) 2
2![[thin space (1/6-em)]](https://www.rsc.org/images/entities/char_2009.gif) :
:![[thin space (1/6-em)]](https://www.rsc.org/images/entities/char_2009.gif) 2
2![[thin space (1/6-em)]](https://www.rsc.org/images/entities/char_2009.gif) :
:![[thin space (1/6-em)]](https://www.rsc.org/images/entities/char_2009.gif) 1 signal of typical ˙OH could be detected after addition of the ˙OH trapping agent 5,5-dimethyl-1-pyrroline N-oxide (DMPO). However, there is no 1
1 signal of typical ˙OH could be detected after addition of the ˙OH trapping agent 5,5-dimethyl-1-pyrroline N-oxide (DMPO). However, there is no 1![[thin space (1/6-em)]](https://www.rsc.org/images/entities/char_2009.gif) :
:![[thin space (1/6-em)]](https://www.rsc.org/images/entities/char_2009.gif) 2
2![[thin space (1/6-em)]](https://www.rsc.org/images/entities/char_2009.gif) :
:![[thin space (1/6-em)]](https://www.rsc.org/images/entities/char_2009.gif) 2
2![[thin space (1/6-em)]](https://www.rsc.org/images/entities/char_2009.gif) :
:![[thin space (1/6-em)]](https://www.rsc.org/images/entities/char_2009.gif) 1 signal in the solution mixture without copper(II) complexes. Therefore, these three copper(II) complexes could be excellent CDT reagents after GSH depletion.
1 signal in the solution mixture without copper(II) complexes. Therefore, these three copper(II) complexes could be excellent CDT reagents after GSH depletion.
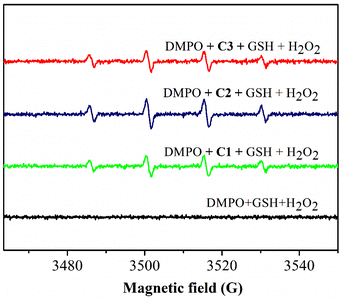 | ||
| Fig. 2 EPR spectra for detection of the ˙OH signal. [Cu(II) complex] = 50 μM; [GSH] = 50 μM; [H2O2] = 8 mM; and [DMPO] = 100 mM. | ||
In vitro cytotoxicity
The antiproliferative activities of L1, L2, L3, C1, C2 and C3 against human cancer cells Hep-G2, MGC80-3, T24, and SK-OV-3 and human normal cells WI-38 and HL-7702 were investigated by MTT assay. The antiproliferative activities of copper(II) complexes C1–C3 towards T24 and Hep-G2 cells were stronger than those of their ligands, which indicated that ligand coordination with copper(II) enhanced the cytotoxicity in T24 and Hep-G2 cells. The overall in vitro antiproliferative activities of C1–C3 towards T24 cells were higher than those of Hep-G2 cells. C2 showed the strongest cytotoxicity towards T24 cells among the three copper(II) complexes, and the IC50 of C2 was 11.6 ± 1.5 μM. In addition, the cytotoxicity of C2 towards normal cell lines HL-7702 and WI-38 was significantly lower than that for T24 cells. Thus, C2 was selected for further mechanism study (Table 1).| Hep-G2 | MGC80-3 | T24 | SK-OV-3 | WI-38 | HL-7702 | |
|---|---|---|---|---|---|---|
| L1 | >20 | >20 | >20 | >20 | >20 | >20 |
| L2 | >20 | 18.5 ± 1.2 | >20 | >20 | >20 | >20 |
| L3 | >20 | 17.3 ± 2.8 | >20 | >20 | >20 | >20 |
| C1 | 15.6 ± 2.5 | 19.0 ± 3.9 | 15.2 ± 1.3 | 13.7 ± 0.7 | >20 | >20 |
| C2 | 16.9 ± 2.5 | 16.0 ± 1.9 | 11.6 ± 1.5 | 15.3 ± 1.6 | >20 | 19.6 ± 1.7 |
| C3 | 17.6 ± 3.3 | >20 | 12.2 ± 1.6 | 13.2 ± 0.9 | >20 | >20 |
Cellular GSH/GSSG ratio and ROS production
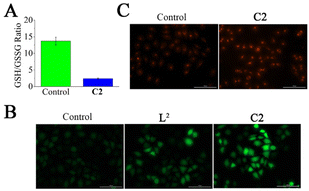
To confirm whether C2 oxidized GSH to GSSG in T24 cells, the cellular GSH/GSSG ratio was detected. The GSH/GSSG ratio in C2 (18 μM)-treated T24 cells decreased from 13.7 ± 1.2 to 2.4 ± 0.2 (Fig. 3A). Furthermore, the intracellular ROS production triggered by L2 and C2 was investigated with the classic ROS probe DCFH-DA. As shown in Fig. 3B, the green fluorescence intensity of T24 cells treated with C2 was much higher than that of L2, indicating that ligands coordination with copper ions increased the production of ROS. Furthermore, the intracellular ˙OH generation triggered by C2 was investigated. The red fluorescence intensity in T24 cells was enhanced after the addition of C2 (Fig. 3C), which indicated that C2 could increase ˙OH generation in T24 cells.Mitochondrial membrane potential detection
The increase in the ROS level can inhibit the electron transfer chain function, resulting in the change of mitochondrial membrane potential (ΔΨm) and apoptosis.38,39 Therefore, the effect of C2 on ΔΨm in T24 cells was measured using a JC-1 kit. As shown in Fig. 4A, with the increase in the concentration of C2, ΔΨm decreased in a concentration dependent manner. The ΔΨm decrease increased from 8.07% (control) to 18.4% (12 μM), 22.5% (15 μM), and 37.5% (18 μM), indicating that C2 induced mitochondrial dysfunction.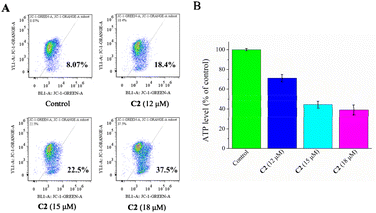 | ||
| Fig. 4 (A) ΔΨm decreased in T24 cells by C2 (12, 15 and 18 μM) treatment. (B) Cellular ATP level decreased in T24 cells by C2 (12, 15 and 18 μM) treatment. | ||
Mitochondria are key organelles of ATP generation in cells.40 Cancer cells tend to produce more ATP than normal cells, so mitochondria tend to be targeted by anticancer drugs.41 A dose-dependent decline in cellular ATP levels was observed in T24 cells treated with C2. The ATP level decreased to 71.2 ± 3.7% (12 μM), 44.4 ± 3.5% (15 μM) and 39.1 ± 4.9% (18 μM) of that of control cells (Fig. 4B). These results indicated that C2 induced mitochondrial dysfunction.
ER stress induced by C2
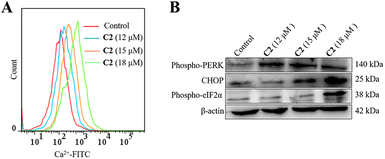
ROS and Ca2+ signaling pathways overlap and interact with each other.42 ROS affect Ca2+ influx and intracellular Ca2+ storage, and subsequently Ca2+ can increase the production of ROS.43 It has been reported that many drugs induced apoptosis and attenuated the development of tumors through intracellular Ca2+ overload.44 The effects of C2 on the Ca2+ concentration in T24 cells were detected by flow cytometry. Fig. 5A shows that the level of cellular Ca2+ increased with the increase of C2 concentration. To further investigate whether the Ca2+ concentration was the initiator of ER stress, the expression levels of Phospho-PERK, CHOP and Phospho-eIF2α were detected. After incubation with C2 for 24 h, the levels of Phospho-PERK, CHOP and Phospho-eIF2α in T24 cells were all increased in a dose dependent manner (Fig. 5B). Up-regulation of Phospho-PERK, CHOP and Phospho-eIF2α occurred, which is a typical sign of ER stress. Together, these results indicated that C2 increased Ca2+ concentration and induced ER stress.45–47T24 cell apoptosis induced by C2
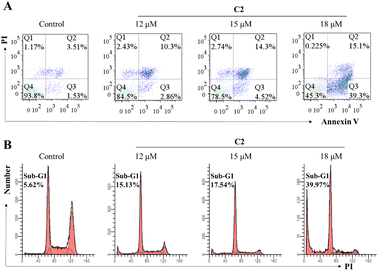
When mitochondrial dysfunction and ER stress occur, apoptosis might be initiated. With the increase of C2 concentration, the percentage of apoptotic cells (Q2 + Q3) increased gradually, which was enhanced from 13.16% (12 μM), 18.82% (15 μM) to 54.4% (18 μM) (Fig. 6A).Subsequently, we investigated the proportion of sub-G1 induced by C2 through PI staining to confirm whether C2 could induce T24 cell apoptosis. Compared to that of vehicle-treated cells (5.62%), the proportion of sub-G1 induced by C2 was 15.13% (12 μM), 17.54% (15 μM), and 39.97% (18 μM), respectively (Fig. 6B). The sub-G1 ratio proportion confirmed that C2 could induce T24 cell apoptosis.
C2 induced mitochondria-mediated apoptosis
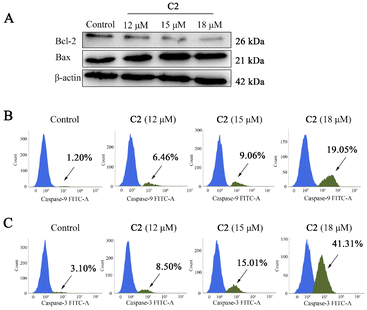
A mitochondria-mediated apoptosis pathway is critical for the regulation of apoptosis under various stimuli. To study the apoptotic pathway activated by C2, the expression of proteins involved in the mitochondria-mediated apoptosis pathway was detected. As shown in Fig. 7, C2 could up-regulate Bax protein and down-regulate Bcl-2 protein expression. In addition, with the increase in the concentration of C2, the activation percentage of caspase-9 increased from 1.20% (control) to 6.46% (12 μM), 9.06% (15 μM), and 19.05% (18 μM), and the activation percentage of caspase-3 increased from 3.10% (control) to 8.50% (12 μM), 15.01% (15 μM), and 41.31% (18 μM). Such observations indicated that C2 induced apoptosis in T24 cells via the mitochondria-mediated intrinsic apoptotic pathway.C2 induced autophagy inhibition enhanced CDT
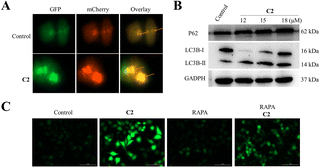
The increase of ROS triggers autophagy to protect cancer cells. Under the action of oxidative stress, cancer cells can degrade macromolecules and organelles in damaged cells by activating their own protective autophagy pathway, leading to effective removal of waste in vivo and reduction of the toxicity of reactive oxygen species such as ˙OH towards cancer cells.23,48 Therefore, inhibiting the autophagy of cancer cells is an effective means to enhance CDT, so that cancer cells cannot “self-detoxify” under oxidative stress and can eventually undergo apoptosis.22 A virus vector expressing the mCherry-GFP-LC3B autophagy double label was used to investigate autophagy flow. As shown in Fig. 8A, the number of yellow fluorescent spots in cells increased after incubation with C2, indicating the increase of autophagosomes in cells. The increase of autophagosomes was further confirmed by western blot analysis. Fig. 8B shows that the expression of p62 and LC3B-II increased after C2 treatment, indicating the increase of autophagosomes in cells. The result indicated that autophagy flow was inhibited by C2. Rapamycin (Rapa) was used to further detect whether autophagy inhibited the production of intracellular ˙OH. As shown in Fig. 8C, Rapa (200 nm) decreased the ROS level induced by C2. Therefore, inhibiting autophagy of cancer cells by C2 enhanced CDT.C2 showed potential anticancer activity in T24 xenograft mice
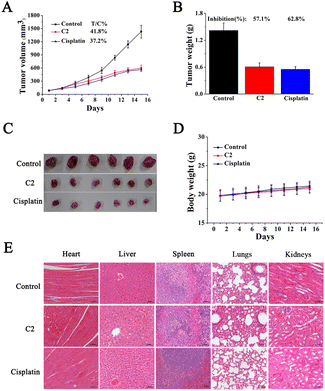
BALB/c nude mice bearing T24 xenograft tumors were used to investigate the in vivo anticancer activity of C2. Eighteen mice were randomly assigned to the C2 group, cisplatin group, and vehicle control group, with six mice in each group, and they were intraperitoneally injected. Body weight and tumor volume were recorded. As shown in Fig. 9A, the tumor volume in the control group increased to 1430.8 mm3 on the 15th day. In comparison, the tumor volume increased to 598.5 mm3 in the C2 group and 564.7 mm3 in the cisplatin group. It can be seen that C2 and cisplatin inhibited tumor growth, and the tumor growth rates (T/C%) were 41.8% and 37.2%, respectively. After the mice were sacrificed on the 15th day, the tumors were excised (Fig. 9B), weighed and recorded to assess the tumor inhibition rate. Fig. 9C shows that the tumor inhibition rate of C2 (57.1%) was similar to that of cisplatin (62.8%). In addition, C2 showed no obvious effect on the body weight and organs including the spleen, lungs, heart, liver, and kidneys of mice (Fig. 9D and E).Conclusion
Three quinoline copper(II) complexes have been synthesized as CDT agents. C2 exhibited cytotoxicity against human bladder cancer T24 cells but much lower cytotoxicity against human normal liver HL-7702 cells and lung fibroblast WI-38 cells. C2 decreased the GSH/GSSG ratio and produced ˙OH in T24 cells to induce mitochondrial dysfunction and ER stress, which led to apoptosis and sub-G1 phase arrest. Moreover, C2 blocked autophagy flow to enhance the CDT effect. C2 exhibited a high anticancer effect with a tumor inhibition of 57.1% in the T24 xenograft mouse model. C2 is a promising lead to act as a potential CDT anticancer agent.Conflicts of interest
The authors declare no competing financial interest.Acknowledgements
This work was supported by the National Natural Science Foundation of China (Grant 22077022) and Natural Science Foundation of Guangxi Province of China (Grants: AD17129007 and GUIKEZY22096015).References
- S. Dasari and P. B. Tchounwou, Cisplatin in cancer therapy: molecular mechanisms of action, Eur. J. Pharmacol., 2014, 740, 364–378 CrossRef CAS PubMed.
- L. Galluzzi, L. Senovilla, I. Vitale, J. Michels, I. Martins, O. Kepp, M. Castedo and G. Kroemer, Molecular mechanisms of cisplatin resistance, Oncogene, 2012, 31, 1869–1883 CrossRef CAS PubMed.
- G. Gasser, I. Ott and N. Metzler-Nolte, Organometallic anticancer compounds, J. Med. Chem., 2011, 54, 3–25 CrossRef CAS PubMed.
- L. Kelland, The resurgence of platinum-based cancer chemotherapy, Nat. Rev. Cancer, 2007, 7, 573–584 CrossRef CAS PubMed.
- H. Zhu, H. Luo, W. Zhang, Z. Shen, X. Hu and X. Zhu, Molecular mechanisms of cisplatin resistance in cervical cancer, Drug Des., Dev. Ther., 2016, 10, 1885–1895 CrossRef CAS PubMed.
- R. A. Cairns, I. S. Harris and T. W. Mak, Regulation of cancer cell metabolism, Nat. Rev. Cancer, 2011, 11, 85–95 CrossRef CAS PubMed.
- D. Trachootham, J. Alexandre and P. Huang, Targeting cancer cells by ROS-mediated mechanisms: a radical therapeutic approach?, Nat. Rev. Drug Discovery, 2009, 8, 579–591 CrossRef CAS PubMed.
- B. Luo, L. Chen, Z. Hong, X. You, F. P. Huang, H. D. Bian, L. Zhang and S. Zhao, A simple and feasible atom-precise biotinylated Cu(I) complex for tumor-targeted chemodynamic therapy, Chem. Commun., 2021, 57, 6046–6049 RSC.
- J. Tan, X. Duan, F. Zhang, X. Ban, J. Mao, M. Cao, S. Han, X. Shuai and J. Shen, Theranostic nanomedicine for synergistic chemodynamic therapy and chemotherapy of orthotopic glioma, Adv. Sci., 2020, 7, 2003036 CrossRef CAS PubMed.
- Z. Tang, Y. Liu, M. He and W. Bu, Chemodynamic therapy: tumour microenvironment-mediated Fenton and Fenton-like reactions, Angew. Chem., Int. Ed., 2019, 58, 946–956 CrossRef CAS PubMed.
- X. Xu, Z. Zeng, J. Chen, B. Huang, Z. Guan, Y. Huang, Z. Huang and C. Zhao, Tumor-targeted supramolecular catalytic nanoreactor for synergistic chemo/chemodynamic therapy via oxidative stress amplification and cascaded Fenton reaction, Chem. Eng. J., 2020, 390, 124628 CrossRef CAS.
- C. Zhang, W. Bu, D. Ni, S. Zhang, Q. Li, Z. Yao, J. Zhang, H. Yao, Z. Wang and J. Shi, Synthesis of iron nanometallic glasses and their application in cancer therapy by a localized Fenton reaction, Angew. Chem., 2016, 128, 2141–2146 CrossRef.
- Y. Zhou, S. Fan, L. Feng, X. Huang and X. Chen, Manipulating intratumoral Fenton chemistry for enhanced chemodynamic and chemodynamic-synergized multimodal therapy, Adv. Mater., 2021, 33, 2104223 CrossRef CAS PubMed.
- X. Meng, K. Zhou, Y. Qian, H. Liu, X. Wang, Y. Lin, X. Shi, Y. Tian, Y. Lu, Q. Chen, J. Qian and H. Wang, Hollow cuprous oxide@nitrogen-doped carbon nanocapsules for cascade chemodynamic therapy, Small, 2022, 18, 2107422 CrossRef CAS PubMed.
- J. Duan, T. Liao, X. Xu, Y. Liu, Y. Kuang and C. Li, Metal-polyphenol nanodots loaded hollow MnO2 nanoparticles with a “dynamic protection” property for enhanced cancer chemodynamic therapy, J. Colloid Interface Sci., 2023, 634, 836–851 CrossRef CAS PubMed.
- E. Ju, K. Dong, Z. Chen, Z. Liu, C. Liu, Y. Huang, Z. Wang, F. Pu, J. Ren and X. Qu, Copper(II)-graphitic carbon nitride triggered synergy: improved ROS generation and reduced glutathione levels for enhanced photodynamic therapy, Angew. Chem., Int. Ed., 2016, 55, 11467–11471 CrossRef CAS PubMed.
- Z. Wang, B. Liu, Q. Sun, S. Dong, Y. Kuang, Y. Dong, F. He, S. Gai and P. Yang, Fusiform-like copper(II)-based metal-organic framework through relief hypoxia and GSH-depletion co-enhanced starvation and chemodynamic synergetic cancer therapy, Appl. Mater. Interfaces, 2020, 12, 17254–17267 CrossRef CAS PubMed.
- G. Liu, J. Zhu, H. Guo, A. Sun, P. Chen, L. Xi, W. Huang, X. Song and X. Dong, Mo2C-derived polyoxometalate for NIR-II photoacoustic imaging-guided chemodynamic/photothermal synergistic therapy, Angew. Chem., Int. Ed., 2019, 58, 18641–18646 CrossRef CAS PubMed.
- P. Sun, Q. Deng, L. Kang, Y. Sun, J. Ren and X. Qu, A smart nanoparticle-laden and remote-controlled self-destructive macrophage for enhanced chemo/chemodynamic synergistic therapy, ACS Nano, 2020, 14, 13894–13904 CrossRef CAS PubMed.
- X. Zhong, X. Wang, L. Cheng, Y. Tang, G. Zhan, F. Gong, R. Zhang, J. Hu, Z. Liu and X. Yang, GSH-depleted PtCu3 nanocages for chemodynamic-enhanced sonodynamic cancer therapy, Adv. Funct. Mater., 2020, 30, 1907954 CrossRef CAS.
- S. Cao, X. Li, Y. Gao, F. Li, K. Li, X. Cao, Y. Dai, L. Mao, S. Wang and X. Tai, A simultaneously GSH-depleted bimetallic Cu(II) complex for enhanced chemodynamic cancer therapy, Dalton Trans., 2020, 49, 11851–11858 RSC.
- B. Yang, L. Ding, H. Yao, Y. Chen and J. Shi, A metal-organic framework (MOF) Fenton nanoagent-enabled nanocatalytic cancer therapy in synergy with autophagy inhibition, Adv. Mater., 2020, 32, 1907152 CrossRef CAS PubMed.
- H. Wu, F. Wu, T. Zhou, Z. Hu, W. Wang, X. Liang, J. Wang, C. You, B. Sun and F. Lin, Activatable autophagy inhibition-primed chemodynamic therapy via targeted sandwich-like two-dimensional nanosheets, Chem. Eng. J., 2022, 431, 133470 CrossRef CAS.
- J. Lu, Y. Yang, Q. Xu, Y. Lin, S. Feng, Y. Mao, D. Wang, S. Wang and Q. Zhao, Recent advances in multi-configurable nanomaterials for improved chemodynamic therapy, Coord. Chem. Rev., 2023, 474, 214861 CrossRef CAS.
- C. G. Hartinger and P. J. Dyson, Bioorganometallic chemistry–from teaching paradigms to medicinal applications, Chem. Soc. Rev., 2009, 38, 391–401 RSC.
- D. Pucci, A. Crispini, B. S. Mendiguchia, S. Pirillo, M. Ghedini, S. Morelli and L. D. Bartolo, Improving the bioactivity of Zn(II)-curcumin based complexes, Dalton Trans., 2013, 42, 9679–9687 RSC.
- S. Adsule, V. Barve, D. Chen, F. Ahmed, Q. P. Dou, S. Padhye and F. H. Sarkar, Novel schiff base copper complexes of quinoline-2 carboxaldehyde as proteasome inhibitors in human prostate cancer cells, J. Med. Chem., 2006, 49, 7242–7246 CrossRef CAS PubMed.
- L. C. Chou, M. T. Tsai, M. H. Hsu, S. H. Wang, T. D. Way, C. H. Huang, H. Y. Lin, K. Qian, Y. Dong, K. H. Lee, L. J. Huang and S. C. Kuo, Design, synthesis, and preclinical evaluation of new 5,6- (or 6,7-) disubstituted-2-(fluorophenyl)quinolin-4-one derivatives as potent antitumor agents, J. Med. Chem., 2010, 53, 8047–8058 CrossRef CAS PubMed.
- A. Lauria, G. L. Monica, A. Bono and A. Martorana, Quinoline anticancer agents active on DNA and DNA-interacting proteins: From classical to emerging therapeutic targets, Eur. J. Med. Chem., 2021, 220, 113555 CrossRef CAS PubMed.
- D. Senthil Raja, N. S. P. Bhuvanesh and K. Natarajan, Synthesis, crystal structure and pharmacological evaluation of two new Cu(II) complexes of 2-oxo-1,2-dihydroquinoline-3-carbaldehyde (benzoyl) hydrazone: a comparative investigation, Eur. J. Med. Chem., 2012, 47, 73–85 CrossRef CAS PubMed.
- D. Senthil Raja, E. Ramachandran, N. S. P. Bhuvanesh and K. Natarajan, Synthesis, structure and in vitro pharmacological evaluation of a novel 2-oxo-1,2-dihydroquinoline-3-carbaldehyde (2′-methylbenzoyl) hydrazone bridged copper(II) coordination polymer, Eur. J. Med. Chem., 2013, 64, 148–159 CrossRef CAS PubMed.
- F. Y. Wang, X. M. Tang, X. Wang, K. B. Huang, H. W. Feng, Z. F. Chen, Y. N. Liu and H. Liang, Mitochondria-targeted platinum(II) complexes induce apoptosis-dependent autophagic cell death mediated by ER-stress in A549 cancer cells, Eur. J. Med. Chem., 2018, 1555, 639–650 CrossRef PubMed.
- W. Y. Shen, C. P. Jia, L. Y. Liao, L. L. Chen, C. Hou, Y. H. Liu, H. Liang and Z. F. Chen, Copper(II) complexes of halogenated quinoline Schiff base derivatives enabled cancer therapy through glutathione-assisted chemodynamic therapy and inhibition of autophagy flux, J. Med. Chem., 2022, 65, 5134–5148 CrossRef CAS PubMed.
- W. Y. Shen, C. P. Jia, A. N. Mo, H. Liang and Z. F. Chen, Chemodynamic therapy agents Cu(II) complexes of quinoline derivatives induced ER stress and mitochondria-mediated apoptosis in SK-OV-3 cells, Eur. J. Med. Chem., 2021, 223, 113636 CrossRef CAS PubMed.
- X. F. Cai, R. N. Guo, G. S. Feng, B. Wu and Y. G. Zhou, Chiral phosphoric acid-catalyzed asymmetric transfer hydrogenation of quinolin-3-amines, Org. Lett., 2014, 16, 2680–2683 CrossRef CAS PubMed.
- X. F. Chen, C. Ren, X. Y. Xu, X. S. Shao and Z. Li, Direct one-pot synthesis of 3-nitroquinolin-2(1H)-one via H2O/AcOH system: an improvement to classical Friedlander reaction, Tetrahedron Lett., 2017, 58, 1433–1436 CrossRef CAS.
- H. Neelakantan, H. Y. Wang, V. Vance, J. D. Hommel, S. F. McHardy and S. J. Watowich, Structure-activity relationship for small molecule inhibitors of nicotinamide N-methyltransferase, J. Med. Chem., 2017, 60, 5015–5028 CrossRef CAS PubMed.
- C. Hu, G. Li, Y. Mu, W. Wu, B. Cao, Z. Wang, H. Yu, P. Guan, L. Han, L. Li and X. Huang, Discovery of anti-TNBC agents targeting PTP1B: total synthesis, structure-activity relationship, in vitro and in vivo investigations of jamunones, J. Med. Chem., 2021, 64, 6008–6020 CrossRef CAS PubMed.
- M. Zhao, T. Guo, M. Wang, Q. Zhao, Y. Liu, X. Sun, H. Wang and Y. Hou, The course of uncarinic acid E-induced apoptosis of HepG2 cells from damage to DNA and p53 activation to mitochondrial release of cytochrome c, Biol. Pharm. Bull., 2006, 29, 1639–1644 CrossRef CAS PubMed.
- D. D. Newmeyer and S. Ferguson-Miller, Mitochondria: releasing power for life and unleashing the machineries of death, Cell, 2003, 112, 481–490 CrossRef CAS PubMed.
- Y. Qian, X. Wang, Y. Liu, Y. Li, R. A. Colvin, L. Tong, S. Wu and X. Chen, Extracellular ATP is internalized by macropinocytosis and induces intracellular ATP increase and drug resistance in cancer cells, Cancer Lett., 2014, 351, 242–251 CrossRef CAS PubMed.
- C. T. Madreiter-Sokolowski, C. Thomas and M. Ristow, Interrelation between ROS and Ca2+ in aging and age-related diseases, Redox Biol., 2020, 36, 101678 CrossRef CAS PubMed.
- A. Görlach, K. Bertram, S. Hudecova and O. Krizanova, Calcium and ROS: A mutual interplay, Redox Biol., 2015, 6, 260–271 CrossRef PubMed.
- C. Wang, F. Yu, X. Liu, S. Chen, R. Wu, R. Zhao, F. Hu and H. Yuan, Cancer-specific therapy by artificial modulation of intracellular calcium concentration, Adv. Healthcare Mater., 2019, 8, 1900501 CrossRef PubMed.
- Y. Fu, Y. Liu, J. Wang, C. Li, S. Zhou, Y. Yang, P. Zhou, C. Lu and C. Li, Calcium release induced by 2-pyridinecarboxaldehyde thiosemicarbazone and its copper complex contributes to tumor cell death, Oncol. Rep., 2017, 37, 1662–1670 CrossRef CAS PubMed.
- S. Kacar, H. Unver and V. Sahinturk, A mononuclear copper(II) complex containing benzimidazole and pyridyl ligands: synthesis, characterization, and antiproliferative activity against human cancer cells, Arabian J. Chem., 2020, 13, 4310–4323 CrossRef CAS.
- K. Ohui, E. Afanasenko, F. Bacher, R. L. X. Ting, A. Zafar, N. Blanco-Cabra, E. Torrents, O. Dömötör, N. V. May, D. Darvasiova, É. A. Enyedy, A. Popović-Bijelić, J. Reynisson, P. Rapta, M. V. Babak, G. Pastorin and V. B. Arion, New water-soluble copper(II) complexes with morpholine−thiosemicarbazone hybrids: insights into the anticancer and antibacterial mode of action, J. Med. Chem., 2019, 62, 512–530 CrossRef CAS PubMed.
- Y. Li, T. Gong, H. Gao, Y. Chen, H. Li, P. Zhao, Y. Jiang, K. Wang, Y. Wu, X. Zheng and W. Bu, ZIF-based nanoparticles combine X-ray-induced nitrosative stress with autophagy management for hypoxic prostate cancer therapy, Angew. Chem., Int. Ed., 2021, 60, 15472–15481 CrossRef CAS PubMed.
Footnotes |
| † Electronic supplementary information (ESI) available. CCDC 2115672–2115674 for complexes C1–C3. For ESI and crystallographic data in CIF or other electronic format see DOI: https://doi.org/10.1039/d2dt04108a |
| ‡ These authors contributed equally to this work. |
| This journal is © The Royal Society of Chemistry 2023 |


