
 Open Access Article
 This Open Access Article is licensed under a Creative Commons Attribution-Non Commercial 3.0 Unported Licence
Neural network potentials for reactive chemistry: CASPT2 quality potential energy surfaces for bond breaking†
Quin H.
Hu
 a,
Andrew M.
Johannesen
a,
Daniel S.
Graham
ab and
Jason D.
Goodpaster
*a
a,
Andrew M.
Johannesen
a,
Daniel S.
Graham
ab and
Jason D.
Goodpaster
*a
aDepartment of Chemistry, University of Minnesota, 207 Pleasant St. SE, Minneapolis MN 55455, USA. E-mail: jason@jdgoodpaster.com
bDepartment of Chemistry and Physics, Birmingham-Southern College, 900 Arkadelphia Rd., Birmingham, AL 35254, USA
First published on 22nd June 2023
Abstract
Neural Network potentials are developed which accurately make and break bonds for use in molecular simulations. We report a neural network potential that can describe the potential energy surface for carbon–carbon bond dissociation with less than 1 kcal mol−1 error compared to complete active space second-order perturbation theory (CASPT2), and maintains this accuracy for both the minimum energy path and molecular dynamic calculations up to 2000 K. We utilize a transfer learning algorithm to develop neural network potentials to generate potential energy surfaces; this method aims to use the minimum amount of CASPT2 data on small systems to train neural network potentials while maintaining excellent transferability to larger systems. First, we generate homolytic carbon–carbon bond dissociation data of small size alkanes with density functional theory (DFT) energies to train the potentials to accurately predict bond dissociation at the DFT level. Then, using transfer learning, we retrained the neural network potential to the CASPT2 level of accuracy. We demonstrate that the neural network potential only requires bond dissociation data of a few small alkanes to accurately predict bond dissociation energy in larger alkanes. We then perform additional training on molecular dynamic simulations to refine our neural network potentials to obtain high accuracy for general use in molecular simulation. This training algorithm is generally applicable to any type of bond or any level of theory and will be useful for the generation of new reactive neural network potentials.
1 Introduction
Neural network potentials (NNPs) have been shown to be a promising compromise between accuracy and computational cost.1–16 NNPs have been shown to be accurate for intramolecular interactions,17,18 intermolecular interactions,19,20 in both gas21,22 and condense phases,23,24 and for large systems.25,26 However, there are fewer examples of NNPs being accurate for chemical reactions and for bond making and bond breaking processes. While there are several examples of system-specific NNPs being highly accurate,21,22,27–29 and several well developed interatomic NNP models such as ANI,19,30,31 TensorMol,32 SchNet,33 NequIP,34 TorchMD-NET,35,36 and e3nn37 to name a few. However, the transferability of training on small systems and applying them to large systems for bond breaking processes remains a greater challenge.38–42 Here, we performed an in-depth study of using NNPs for bond making and breaking.A challenge in the development of machine learning potential energy surfaces is the development of quality features to describe the molecular structures of chemical compounds.43–49 In the development of feed-forward NNs, the 3-dimentional structures of any given system must be converted into an NN input of a consistant size. This means finding the correct representation of molecular structures is the key to transferability of the potential between smaller and larger systems, which would allow the method to be applied to larger unseen systems. To this end, Behler and Parrinello50 developed their high-dimensional NN model to represent potential energy surfaces based on symmetry features, which are rotationally and translationally invariant. This choice of molecular features was later utilized and developed into the Accurate NeurAl networK engINe for Molecular Energies (ANAKIN-ME) model (ANI for short).19 The ANI model utilizes symmetry functions to probe radial and angular environments of atoms within a molecule, to accurately and efficiently represents features of molecular structures that would influence the molecular energy of the system. The ANI model has shown great success in the modeling of intramolecular interactions for a variety of different systems,30 and highlights the potential for utilizing NNs to study larger chemical systems by training on smaller-size systems that are computationally affordable for high level quantum methods.
The construction of a transferable NN potential requires large quantities (106 to 107) of training data.51 However, to target the chemical problem of bond dissociation energy, the generation of large quantities of multi-reference calculations at the CASPT2 (ref. 52 and 53) level is still impractical with the current level of computational power. Transfer learning is a potentially useful technique in this regard. Transfer learning54,55 can be used to retain learned relationships between the features and target by freezing certain parameters; the NNP with frozen parameters can then be retrained on data obtained from a different but related task to yield highly accurate predictions even when new data is sparse.56–58 In computational chemistry, DFT level data that relates geometries to energies can be cheap to generate, while the more accurate CASPT2 level data are more computationally expensive, but the general trend of the bond dissociation potential energy surface could be similar enough for a simple correction.59 The ANI group developed a coupled cluster level potential – ANI-1ccx, which was trained using transfer learning where its starting potential, ANI-1x, was a DFT level potential then retrained using five hundred thousand coupled cluster datapoints.31 The ANI-1ccx potential is constructed as a general purpose coupled cluster level NN potential, thus its training still requires a large amount (105) of data points. With the combination of transfer learning and effective sampling, a previously trained NN at the DFT level may need far less than 105 data points to be retrained in order to study a particular chemical system well with sufficient accuracy at the best level of theory for that system.
The research presented here demonstrates one possible way to train NNPs to study carbon–carbon bond dissociation in long chain alkanes approaching the CASPT2 level of accuracy through the utilization of NNPs in combination with transfer learning. We first obtain transferable NNPs with DFT level of accuracy for carbon–carbon bond dissociations. Next, we use transfer learning to obtain transferable NNPs with a CASPT2 level of accuracy. Finally, we explore utilizing these NNPs for molecular dynamics trajectories and demonstrate the high accuracy achived by these NNPs.
2 Method
2.1 The ANI atomic neural networks model
The choice of machine learning model is influenced by: (1) the choice of features, sometimes called descriptors, used as the input into the model, (2) the amount of available training data, and (3) the desired accuracy of the model. As discussed above, there are a plethora of different options when it comes to molecular features and machine learning models for atomic potential energy surfaces. What is less available are large data sets used in the training of these models. One of the largest available data sets to date is the ANI-1 data set60 that contains over 20 million geometries and energies. The resulting model19 trained on the ANI-1 data set and the ANI-1x data subset61 were found to be very accurate. We choose to utilize the existing ANI-1 data set and model to only have to supplement additional bond breaking data.The ANI model19 depicted in Fig. 1, uses atomic environment vectors (AEVs) GXm as the features. AEVs are similar to those proposed from Behler and Parrinello's NN model, which was designed to represent and capture potential energy surfaces.50 This model accurately and efficiently enforces translational and rotational invariance while describing the distance and angles of individual atoms with respect to other atoms within the system, and has shown great accuracy and transferability with the prediction of electronic energies.19,30,31
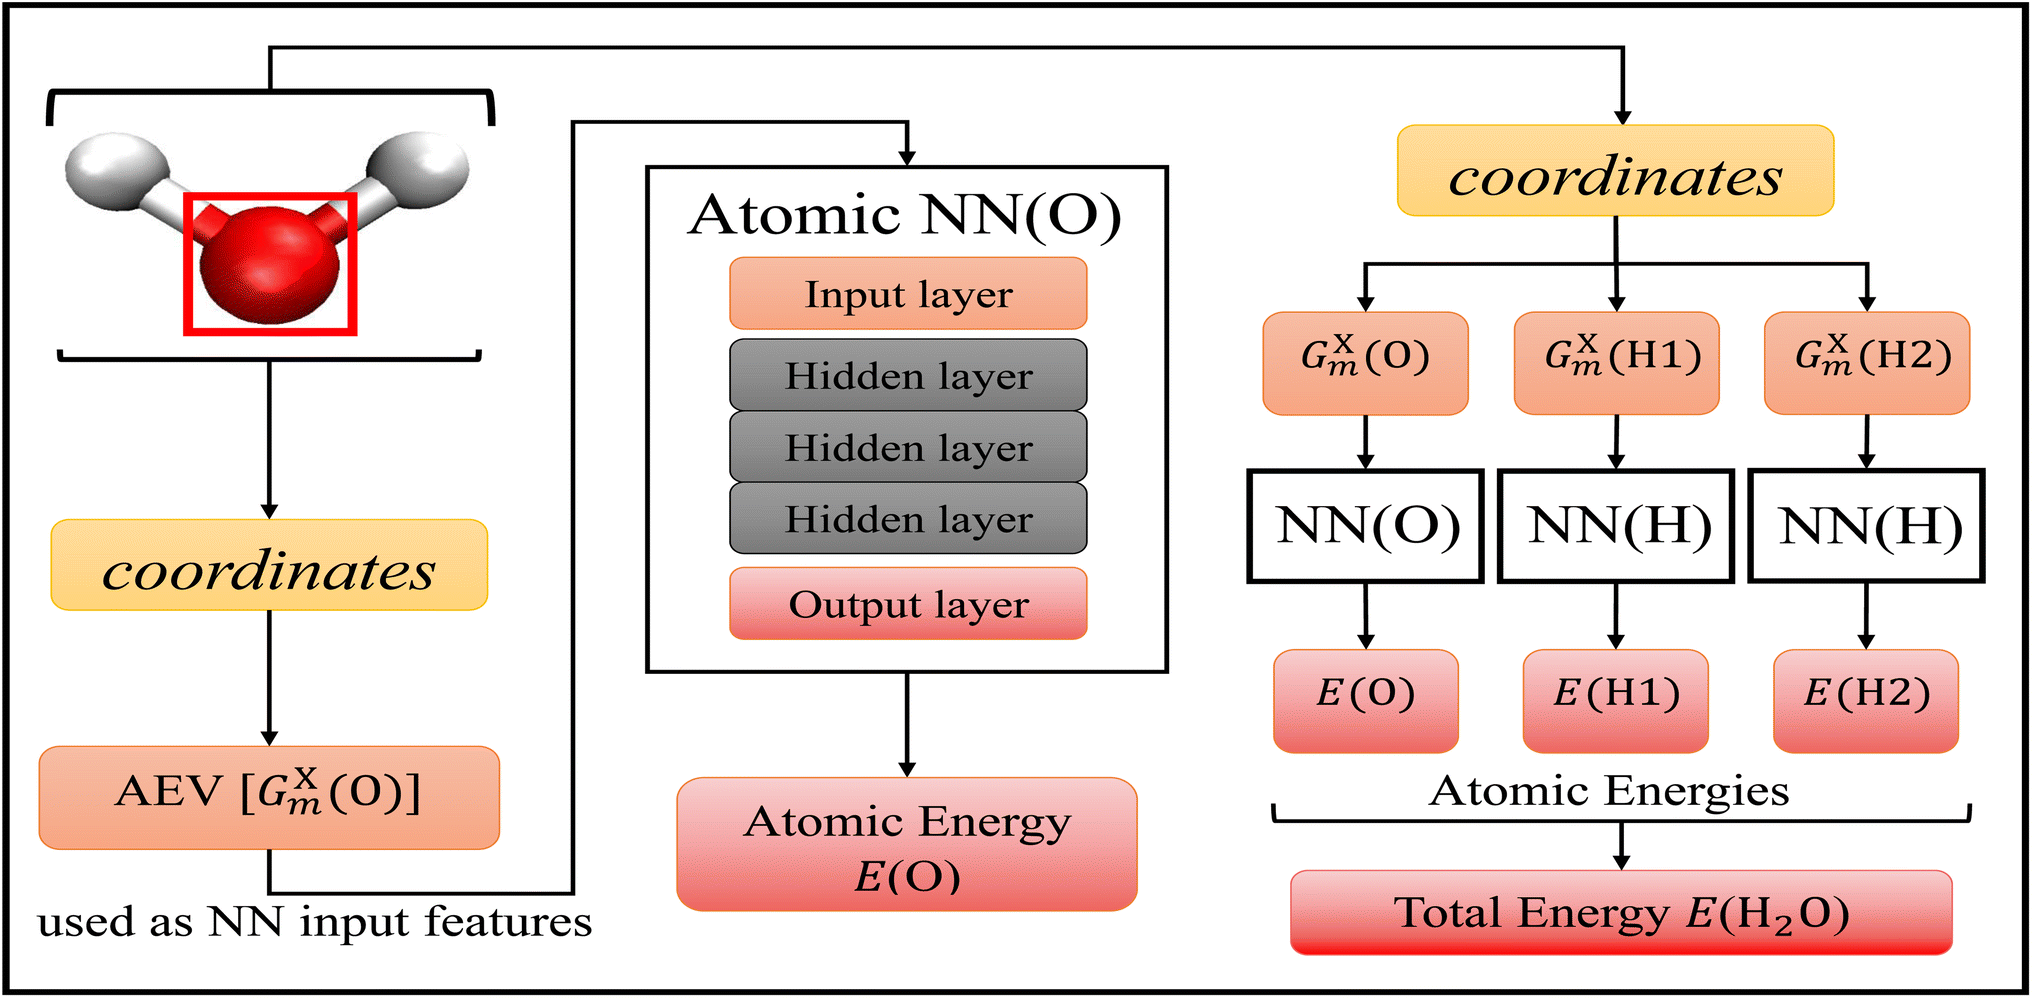 | ||
| Fig. 1 Accurate NeurAl networK engINe for Molecular Energies (ANAKIN-ME) high dimensional neural network model.19 The general algorithm of the model is shown with the geometric data of a single water molecule as the input. This model is built with atomic neural networks of different atom types. The left-half of the figure shows the algorithm of atomic energy determination of the oxygen atom. The molecular coordinates of the full molecule are used to calculate the features, the atomic environment vectors GXm of a particular atom, and this is used as the input to the atomic NN. Each atomic NN is built with three hidden layers of nodes to process the input and determine atomic energy contribution to the overall system. The right-half of the figure shows the algorithm of total energy determination. Each atomic NN returns atomic energies of a specific atom, and the sum of all atomic energies is the total energy of the molecule. | ||
Within the ANI model, the 3-dimensional coordinates of the molecule are converted into the AEVs (features). These AEVs then enter the atomic NN model, and after three hidden layers, the atomic NN model returns atomic energy Ei, which is the atomic contributions of a particular atom to the overall system. The total energy of the molecule ET of N atoms is the sum of all atomic energies,
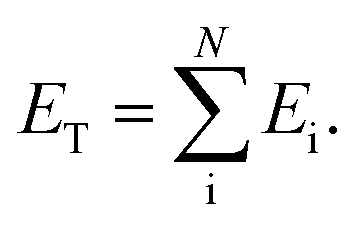 | (1) |
The features in this model make use of two types of symmetry functions where the 3D geometry is transformed into a set of GXm vectors, which give numerical descriptions of both radial (X = R) and angular (X = A) features of the local environment of a given atom i. The radial symmetry functions,
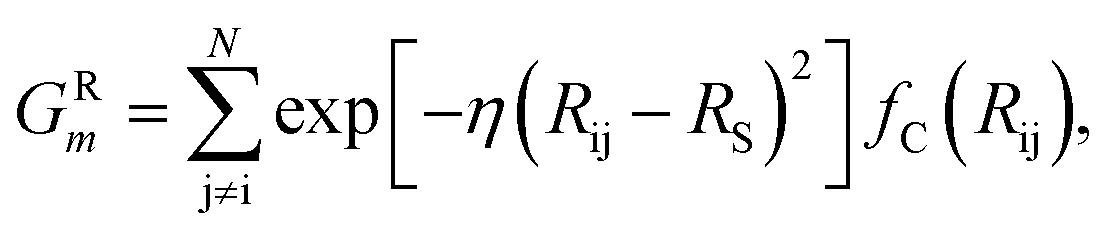 | (2) |
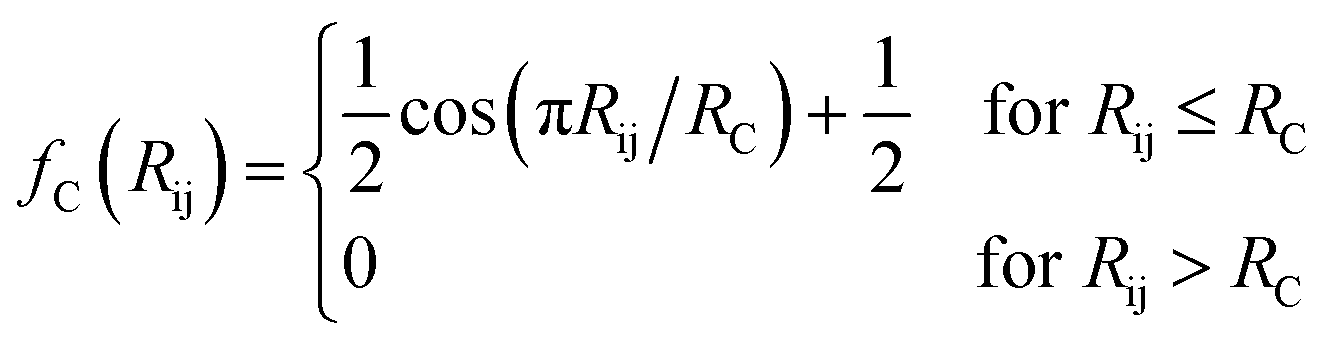 | (3) |
The angular symmetry functions GAm describe the angular environment of an atom i by summing all possible interactions it has with atom pairs within the angular cutoff radius,
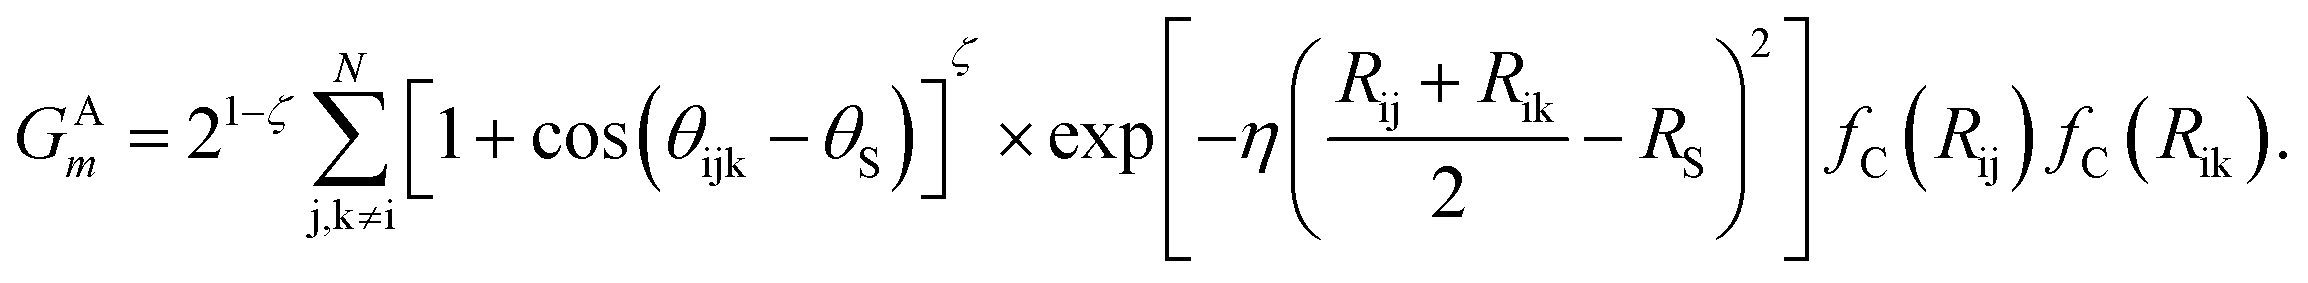 | (4) |
Each interaction within the sum describes the angular environment of atom i with respect to atom j and k, where θijk is the angle of atoms i, j, k centered on atom i. Similar to the radial symmetry functions, index m of GAm is associated with tunable parameters ζ, θS, η, and RS.
In this project, a ζ value of 32 is used to limit the width of the peaks in the angular environment. Here, η and RS are similar to that of eqn (2), with η set to 8 to control the width of the Gaussians and a total of 4 RS values are used to shift the Gaussians from 0 Å to the angular radial cutoff RC of 3.5 Å. The angular symmetry functions also utilize a total of 8 angular shifts θS from 0 to π to cover all regions of the angular environment. In summary, the radial and angular AEVs are calculated using these definitions and used as the input into the atomic NNs.
The ANI model is an ensemble of atomic NNs, specifically H, C, N, O atom types. In other words, each atom type has its own multi-layer feed-forward NN, and the AEVs discussed above are calculated per atom type. Therefore, there are 4 radial sets of AEVs (one for each atom type) and 10 angular sets of AEVs (one for each atom type pair). The usefulness of these definitions of the AEVs are that the AEVs have a constant size yet can differentiate molecular geometries of any molecules with any number of atoms. All tuneable parameters ζ, θS, η, and RS of the symmetry functions as well as the number of functions (for instance, the number of RS) could be changed to optimized the NN depending on the specific system. The current choice of these parameters is selected to minimize the size of the AEVs while maximizing the resolution. While optimization of these parameters for bond breaking is left to future work, here we simply used the same parameters as those used in the universal ANI potential ANI-1x and ANI-1ccx.30,31 All parameters are provided in the ESI.†
In this project, neurons or nodes within each hidden layer described in the ANI model uses a Continuously-differentiable Exponential Linear Unit62 (CELU) as their activation function, while the final transformation at the output node uses a linear activation function for simple determination of the final singular output. The backpropagation algorithm employed in this project is Adam,63 a computationally efficient algorithm developed specifically for gradient-based optimization in machine learning with large data sets. This algorithm was further improved and tested on NNs, as well as being used for the previous development of the universal ANI potentials.19,30,31,64 All NN calculations in this paper were performed using the ANI model implemented in the open source package TorchANI,65 which is an implementation of the original model in PyTorch.66
2.2 Training methods and automated CASPT2 calculations
The idea of transfer learning is to retain information learned from previous training (such as the general relationship between the AEVs and electronic energies), and to directly apply or optimize on new data that is different but overall related to what has been learned. This use of transfer learning allows fast convergence, and requires significantly less data for the training of the partially frozen networks. Because both DFT and wavefunction methods utilize the same general process of assigning energies to given geometries, previously trained DFT NNPs can be “corrected” with wavefunction data by using transfer learning.
In practice, a previously trained ensemble of DFT NNPs was used as the starting potentials for transfer learning. A large portion (about 80%) of optimized parameters in each NNP were frozen. Specifically, the parameters associated with the transformation of AEV input to the first hidden layer, and the parameters associated with the transformation of the second hidden layer to the third hidden layer were set as constants, meaning these frozen parameters would not be further optimized when this NNP is being trained again with new data. The parameters associated with the first hidden layer to the second, and the third hidden layer to the output were allowed to be further optimized to obtain the final transfer learned NNP. This choice of which layer of parameters to freeze is consistant with ANI-1ccx.31 An example training trajectory is provided in Fig. S2.† We see that after only 100 epoch the RMSE drops to a low value, and further epochs lead to over fitting. Therefore, we employ early stopping and take the best model based on RMSE for our transfer learned NNP.
To do this, we developed the following protocol. First, after the initial Hartree-Fock calculation is performed using the ANO-VT-TZ basis set,68 the orbitals are localized with Atomic Valence Active Spaces69 (AVAS), where all 10 orbitals of the two dissociating carbon atoms were selected, specifically the 1s, 2s, and 2p from each dissociating carbon. We found this lead to better localized orbitals than just using the 2s and 2p orbitals. However, since the 1s carbon orbitals shouldn't significantly contribute to the bond-breaking energies, in a second step from this set of 10 orbitals, we choose 4 occupied and 4 virtual orbitals to perform CASSCF (8, 8) calculations. Incidentally, we found that the CASSCF (8,8) calculations did not always give smooth potential energy surfaces, due to different orbitals selected at equilibrium versus dissociated geometries. However, we observed that the 6 most correlated orbitals did stay consistant. Therefore, after the (8, 8) calculation, we used the new natural orbitals to perform another CASSCF calculation with active space (6, 6), and finally the perturbation correction is calculated on the CASSCF(6,6) wavefunction. We determined that this protocol gives the most consistent results across all alkanes tested in this study and always lead to smooth potential energy surfaces. A sample script for this calculation is included in our github repository.70
2.3 Training and validation data
The ANI-1 database is a large data set containing the DFT total energies and coordinates from equilibrium and off-equilibrium geometries of organic molecules. This data set contains roughly 22 million molecular conformations of 57![[thin space (1/6-em)]](https://www.rsc.org/images/entities/char_2009.gif) 462 molecules consisting elements H, C, N, and O.72
462 molecules consisting elements H, C, N, and O.72
All electronic structure calculations in ANI-1 database were performed with the ωB97X73 density functional and the 6-31G(d)74 basis set using Gaussian.75 Here, we trained ensembles of 10 NNPs at a time. To prepare a starting ensemble, 10 NNPs were initialized randomly, and each network was trained on 10% of the ANI-1 database. Specifically, the ANI-1 database was evenly divided into 10 training sets, where each training sets contains 10% of the original ANI-1 data. Each NNP of the ensemble was given 1 of the 10 divided ANI-1 database, where no two potentials of the ensemble were trained with any amount of shared data. This created the initial ensemble of NNPs used for this project. The use of an ensemble of NNPs instead of a single potential is a common tactic to avoid random noise that might be present in a single individual potential. Each NNP discussed in the remainder of the paper is an ensemble of 10 NNPs; therefore, we will use the notation NNP (ANI-1CH) to refer to an ensemble of 10 NNPs trained on the ANI-1CH data set.
For any training that came after the initialization, data within the ANI-1 database containing molecules consisting only of carbons and hydrogens were extracted and used as part of the training data for each potential. This was to ensure each potential would always accurately predict minimum energy geometries of long chain alkanes, so that the performance of NNPs after training with various amount of dissociated geometries can be compared. For the remainder of the paper, we will refer to this subset of the ANI-1 database as the ANI-1CH data set and it contains a total of 1221012 geometries.
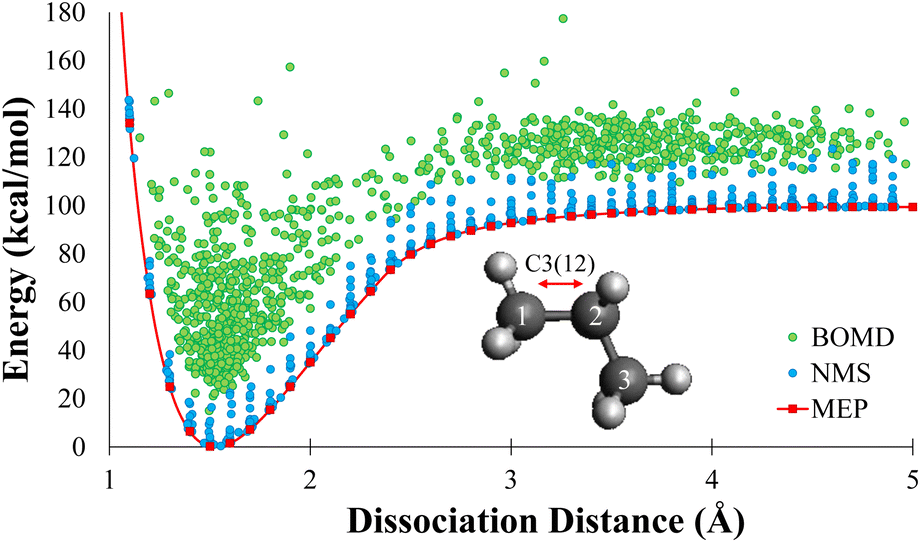 | ||
| Fig. 2 The DFT energies of the minimum energy path, normal mode sampling, and DFT molecular dynamics geometries as a function of bond length relative to the equilibrium geometry. The notation C3(12) indicates the dissociation pattern is propane carbon 1 and 2. The minimum energy path data set is shown in red, the normal mode sampled data set is shown in blue, and the DFT molecular dynamics data set is shown in green. The combination of these data sets show that these geometries cover a significant amount of phase space associated with bond dissociation. | ||
| Ri = ±ci3NakbT/Ki5 |
In this work, each geometry from the MEP data sets were used as starting point for NMS. A minimum of 10000 new geometries were generated using NMS for each dissociation of 2–8 carbons alkanes. Single point calculations were performed at the DFT level for each geometry to create the NMS training sets. The blue dots in Fig. 2 shows the distribution of NMS for propane in terms of energy with respect to dissociation distance. For the remainder of the paper, we will refer to database as the NMS data set and it contains a total of 159840 geometries.
000 new geometries were generated for each dissociation of 2–8 carbons alkanes using various starting positions along the dissociation path directly from MEP data set. The BOMD trajectories were initialized at 300 K, and were ran in the NVE ensemble; therefore, some trajectories produced temperatures as high as 1000 K, which allowed for efficient sampling of the high energy phase space. Visual distribution of DFTMD data generated for propane is shown as the green dots in Fig. 2. DFTMD geometries span a region across the dissociation path on top of the NMS data. For the remainder of the paper, we will refer to database as the DFTMD data set and it contains a total of 158720 geometries.
Using this protocol, we generated a total of 20000 geometries per dissociation where the bond length was fixed from 1.0 to 5.0 Å in 0.1 Å increments. We then took 1950 geometries from each bond dissociation studied (20 total) for a total of 39000 geometries. We randomly selected 10% of these geometries to make the NNMD validation data set. Additionally, for propane, we ran MD trajectories with initial momenta set to 1000 K, 1500 K, and 2000 K, and extracted another 5850 geometries. For the remainder of the paper, we will refer to database as the NNMD data set containing a total of 44850 geometries.
3 Results and discussion
3.1 DFT potentials for bond breaking
To generate NNPs for bond breaking, we initially trained a NNP with the ANI-1 database as discussed in Section 2.3.1. We then re-trained all of these NNPs on the ANI-1CH data set. The ANI-1CH data set was always included as part of the training set for any future training at the DFT level of theory within this paper. This means that a NNP further trained on ethane dissociation data was still trained with the ANI-1CH database including equilibrium and near-equilibrium geometries of other alkanes. The ANI-1CH database only contains DFT energies, force data were not available prior to this work. Therefore, all NNPs discussed in this work were only trained with energies.This initial NNP was then trained with increasing amounts of NMS dissociation data. Specifically, an NNP was trained on the ANI-1CH data set and then further trained by adding the ethane dissociation part of the NMS data set to the ANI-1CH data set. A different NNP was trained utilizing the same initial NNP, but now with both the ethane and propane dissociation from the NMS data set (in addition to the ANI-1CH data set), so on and so forth. The last NNP was trained with all C–C bond dissociaitons up to 8 carbon alkanes. This yielded 7 unique NNPs for which performances could be evaluated and compared.
Table 1 and Fig. 3(a) show the RMSE of the NNP performance with respect to DFT on the MEP data set for these NNPs trained with increasing amount of alkanes dissociations. When only including bond dissociation data of ethane, the trained NNP can only accurately predict ethane. A similar result is observed with inclusion of propane dissociation data. The prediction of all other bond dissociations improved in accuracy drastically after the inclusion of butane dissociation data. In fact, after the inclusion of butane dissociations, all energy predictions for all possible C–C bond dissociation paths in alkanes containing 2–8 carbons returned RMSEs lower than 1 kcal mol−1. The reason the accuracy improves dramatically once butane is included is that the training data now contains C–C bond breaking data between two secondary carbons, which is required to predict the longer alkanes dissociations. Minor improvements and fluctuations in performance were observed with the inclusion of more bond dissociation data of longer alkanes, which is associated with slightly different convergence behavior of the NNP training due to differently sized training sets and is not physically significant.
| C–C bond dissociation | Largest alkane included in training data | ||||||
|---|---|---|---|---|---|---|---|
| Ethane | Propane | Butane | Pentane | Hexane | Heptane | Octane | |
| C2(12) | 0.53 | 0.10 | 0.54 | 0.10 | 0.09 | 0.17 | 0.10 |
| C3(12) | 13.05 | 0.08 | 0.45 | 0.09 | 0.07 | 0.18 | 0.10 |
| C4(12) | 12.02 | 6.06 | 0.39 | 0.11 | 0.06 | 0.22 | 0.10 |
| C4(23) | 25.33 | 1.59 | 0.33 | 0.17 | 0.10 | 0.18 | 0.10 |
| C5(12) | 12.11 | 5.79 | 0.40 | 0.16 | 0.07 | 0.29 | 0.09 |
| C5(23) | 24.29 | 6.42 | 0.54 | 0.11 | 0.06 | 0.22 | 0.10 |
| C6(12) | 12.12 | 5.78 | 0.38 | 0.23 | 0.07 | 0.35 | 0.10 |
| C6(23) | 24.36 | 6.15 | 0.53 | 0.14 | 0.08 | 0.29 | 0.09 |
| C6(34) | 23.23 | 13.35 | 0.84 | 0.19 | 0.07 | 0.29 | 0.12 |
| C7(12) | 12.08 | 5.71 | 0.39 | 0.30 | 0.07 | 0.43 | 0.10 |
| C7(23) | 24.37 | 6.14 | 0.51 | 0.19 | 0.08 | 0.35 | 0.09 |
| C7(34) | 23.32 | 13.09 | 0.84 | 0.21 | 0.10 | 0.35 | 0.10 |
| C8(12) | 12.11 | 5.72 | 0.41 | 0.36 | 0.09 | 0.50 | 0.11 |
| C8(23) | 24.35 | 6.10 | 0.51 | 0.25 | 0.08 | 0.42 | 0.10 |
| C8(34) | 23.34 | 12.09 | 0.82 | 0.27 | 0.10 | 0.42 | 0.11 |
| C8(45) | 23.40 | 11.82 | 0.87 | 0.26 | 0.12 | 0.41 | 0.14 |
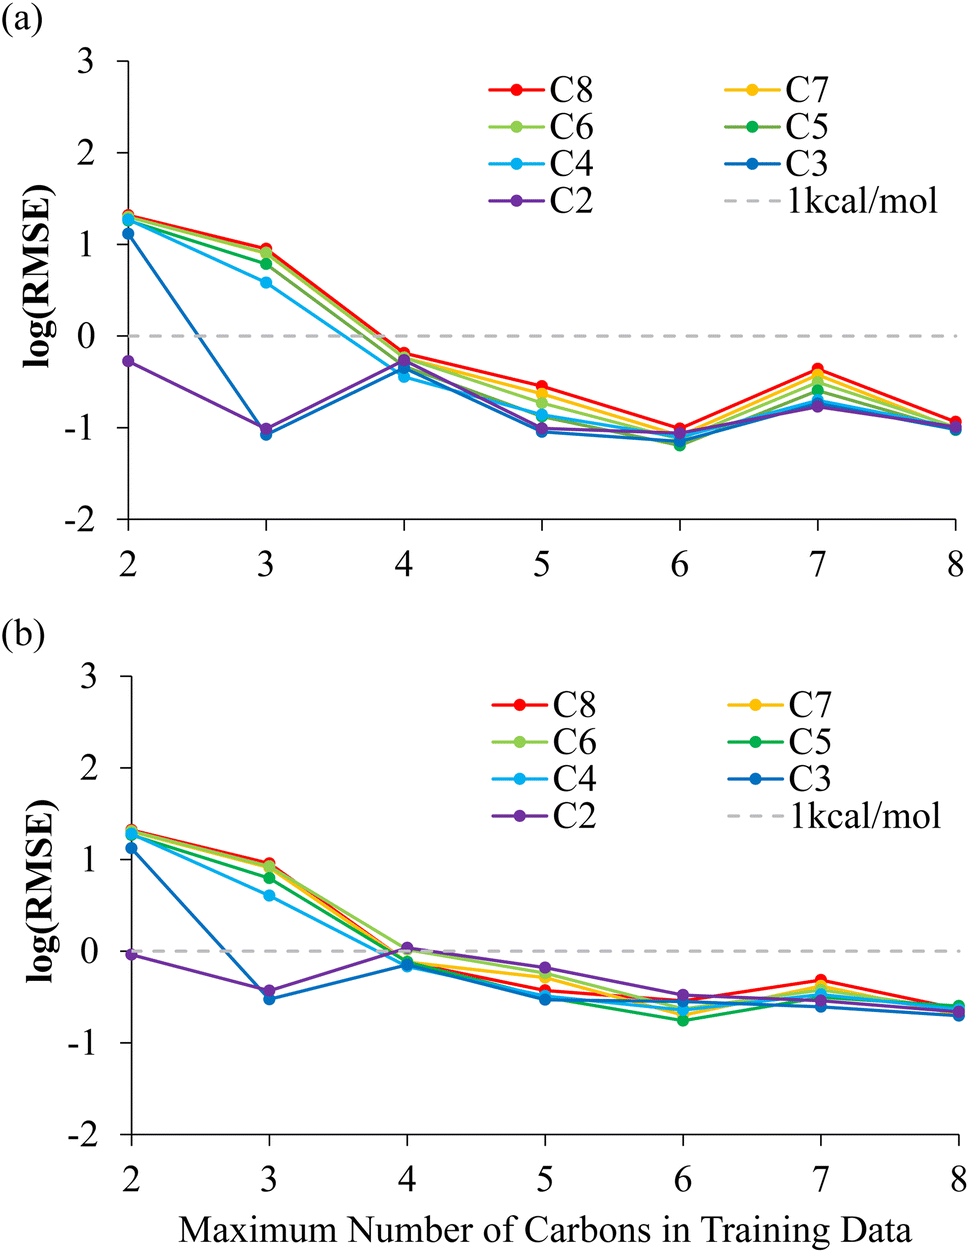 | ||
| Fig. 3 Evaluation of neural network potentials for the prediction of the potential energy surface of alkane dissociations. The NNPs were trained using the NMS and ANI-1CH data sets and used to predict (a) the MEP data set and (b) the NMS data set. The results are averaged over all bond dissociations for a given alkanes. | ||
The NNPs are further evaluated on NMS data generated for each possible dissociations. The RMSE of the NNPs with respect to DFT energies of the training data generated from NMS is shown in Fig. 3(b) and Table S2.† Evaluations of NNPs over NMS training data is meant to justify the effectiveness of the training, as well as supporting that the NNPs are not over trained. The convergence of the NNPs trained using C–C bond dissociation up to butanes performed especially well over geometries that were never included in the training data as shown by RMSE evaluations over the 10000 NMS data per dissociation for pentanes-octanes being lower than 1 kcal mol−1.
3.2 CASPT2 potentials for bond breaking
In this work, what was desired was a CASPT2 level NNP for C–C bond breaking in alkanes. CASPT2 calculations were performed on all MEP geometries using the automated CASPT2 scheme described in Section 2.2.2 to create initial training data sets mentioned in Section 2.3.6 and performance evaluation data sets. CASPT2 level MEP data of dissociating alkanes with 2–4 carbons, combined with 10% (randomly selected) NMS data of 2–4 carbons were used as the training data to retrain the DFT potentials to CASPT2 level. We used transfer learning described in Section 2.2.1 to retain the information learned during the DFT training to the CASPT2 training.As shown in Table 2, by combining transfer learning and active learning, the NNP was able to reach CASPT2 level of accuracy for C–C bond dissociation in alkanes with training data of small alkanes, specifically ethane, propane, and butane. The RMSE of the NNP evaluating on all dissociation patterns of 2–8 carbons were below 1 kcal mol−1, even though the NNP had never seen CASPT2 data of alkanes longer than 4 carbons during training. The NN predicted dissociation path are graphically indistinguishable with the reference CASPT2 energies as shown in Fig. 4.
| C–C bond dissociation | RMSE | E D(CASPT2) | E D(NNP) |
|---|---|---|---|
| C2(12) | 0.11 | 93.93 | 93.56 |
| C3(12) | 0.23 | 92.42 | 91.85 |
| C4(12) | 0.13 | 93.00 | 92.62 |
| C4(23) | 0.21 | 91.25 | 90.66 |
| C5(12) | 0.22 | 92.80 | 92.34 |
| C5(23) | 0.33 | 91.80 | 91.25 |
| C6(12) | 0.40 | 92.81 | 92.28 |
| C6(23) | 0.50 | 91.61 | 90.94 |
| C6(34) | 0.61 | 92.33 | 91.82 |
| C7(12) | 0.65 | 92.81 | 92.27 |
| C7(23) | 0.70 | 91.63 | 90.87 |
| C7(34) | 0.73 | 92.15 | 91.49 |
| C8(12) | 0.92 | 92.80 | 92.27 |
| C8(23) | 0.97 | 91.61 | 90.86 |
| C8(34) | 0.97 | 92.16 | 91.41 |
| C8(45) | 0.99 | 91.97 | 91.16 |
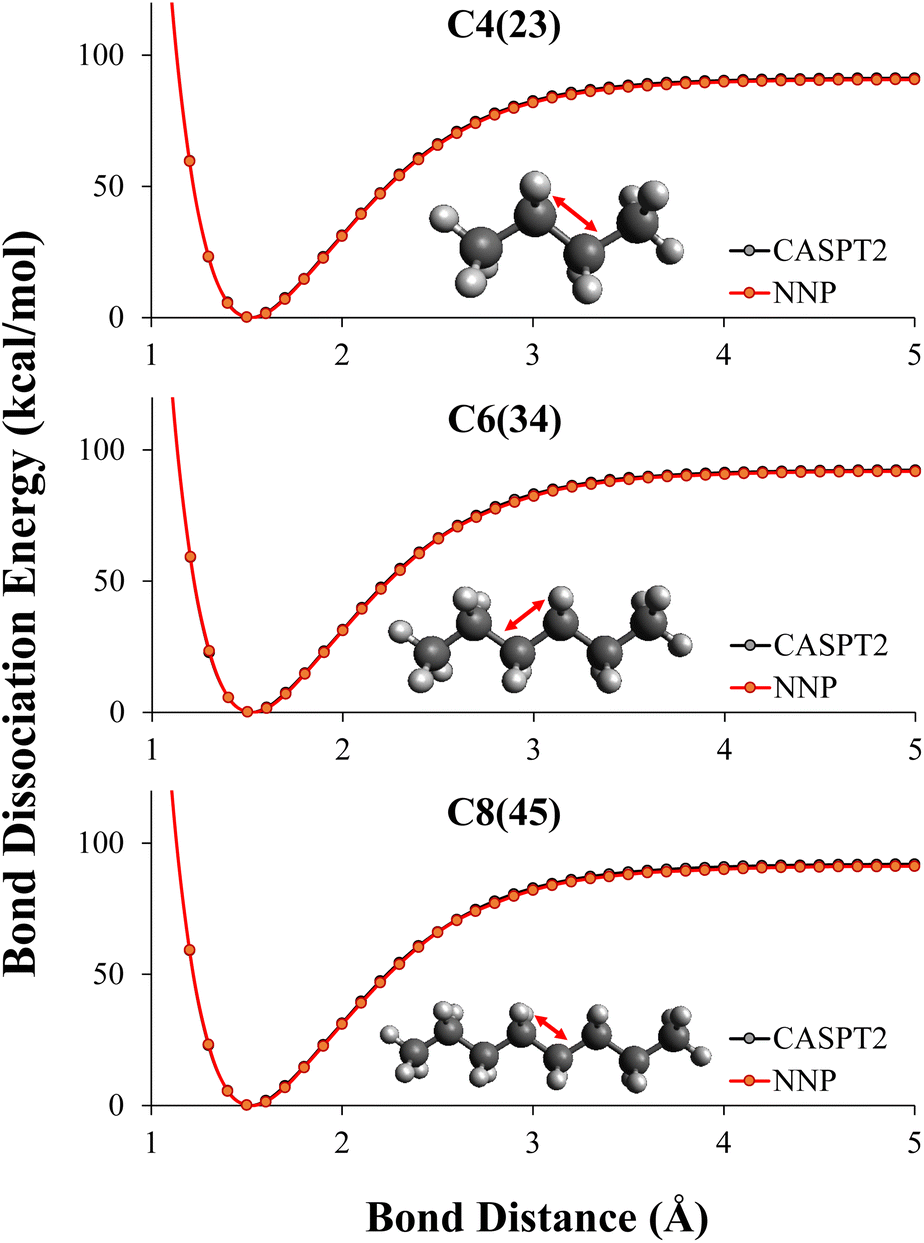 | ||
| Fig. 4 Evaluation of the transfer learned neural network potentials for the prediction of the potential energy surface of alkane dissociations. The NNPs were trained using the NMS and ANI-1CH data sets and transfer learning was used to describe the CASPT2 potential energy surface. The dissociation of hexane and octane were unseen by the NNP. The energies from the neural network potential and the energies from CASPT2 are graphically indistinguishable. | ||
As shown in Table 2, the NNP prediction ED(NNP) has a less than 1 kcal mol−1 error for any of the dissociations. The dissociation energy in these alkanes, ED(CASPT2), is between 91–94 kcal mol−1, with the largest gap between the dissociation curves being about 3 kcal mol−1. The highest and lowest bond dissociation energies are C2 and C4(23), which suggests that one reason high accuracy is seen from training on C2–C4 and predicting up to C8 is due to the NNP only having to interpolate to energies within the CASPT2 data set.
The NNP predictions have even greater accuracy for relative energies. For example, between C8(34) and C8(45), the CASPT2 reference shows a gap of 0.19 kcal mol−1 with C8(34) being slightly higher, the NNP prediction shows a gap of 0.25 kcal mol−1 with C8(34) being slightly higher. By looking at the relative energies, one can still see that knowledge was transferred from the DFT trained NNP to the CASPT2 trained NNP. The only carbon–carbon bond dissociation between two secondary carbons in the CASPT2 training set is C4(23). The reference CASPT2 data shows a relative energy difference between the dissociation energies C4(23) and C6(34) of 1.08 kcal mol−1 compared to 1.16 kcal mol−1 for the CASPT2 trained NNP. Thus, despite the C6(34) bond dissociation only being included in the DFT data, the CASPT2 trained network correctly predicts this energy due to the transfer learning. Therefore, while here we are only demonstrating a modest transferability, performing a larger study on transferability of this network to non-alkanes is the subject of our future work.
We can conclude that once a NNP is sufficiently trained with DFT data for a specific system, you only need a very small amount of CASPT2 data to achieve a high level energy correction. What is demonstrated here shows that if only targeting a specific system, one would only need a few thousands of geometries at the higher level of theory to utilize transfer learning to retrain a DFT level NNP to the CASPT2 level of theory.
3.3 Performing MD using neural network potentials
We now test the performance of our NNPs for their ability to accurately perform molecular dynamics simulations. Due to the relatively large amount of training data required, if the end goal is to simply calculate the bond dissociation energy or the minimum energy path, one would simply perform the DFT or CASPT2 calculations. The real advantage of the NNPs is: (1) their transferability to larger systems (as demonstrated above for minimum energy paths) and (2) their ability to accurately interpolate between geometries in the training data. Here, we seek to test the accuracy of both, as molecular dynamic simulations will sample many geometries not in the training data. By performing molecular dynamics on larger systems than in the training data, we can test the NNPs transferability to larger systems. With sufficient accuracy, NNPs will be a powerful tool in performing molecular dynamics simulations (such as WHAM82) due to the large number of energy and force evaluations required.We performed a series of molecular dynamics simulations where each simulation constrained the bond length of the first and second carbon to be at a fixed distance between 1.0 to 5.0 Å in increments of 0.1 Å forming the NNMD data set as mentioned in Section 2.3.5. As shown in Fig. 5, the NNP (NMS + DFTMD) performed incredibly well with RMSE under 0.5 kcal mol−1 for the test set. Surprisingly, NNP (NMS), which was trained with no MD data, also performed quite well in terms of RMSE on these MD geometries generated with NNP (NMS + DFTMD) with an RMSE of around 1 kcal mol−1. The improvement in the performance of the NNPs with the inclusion of the DFTMD geometries is due to the NMS data including only displacements of single normal modes, whereas the DFTMD geometries contains the coupling of multiple normal modes. Both the NNP (NMS + DFTMD) and NNP (NMS) were only trained with data up to octane; therefore, the high accuracy for nonane dissociation demonstrates good transferability to larger systems.
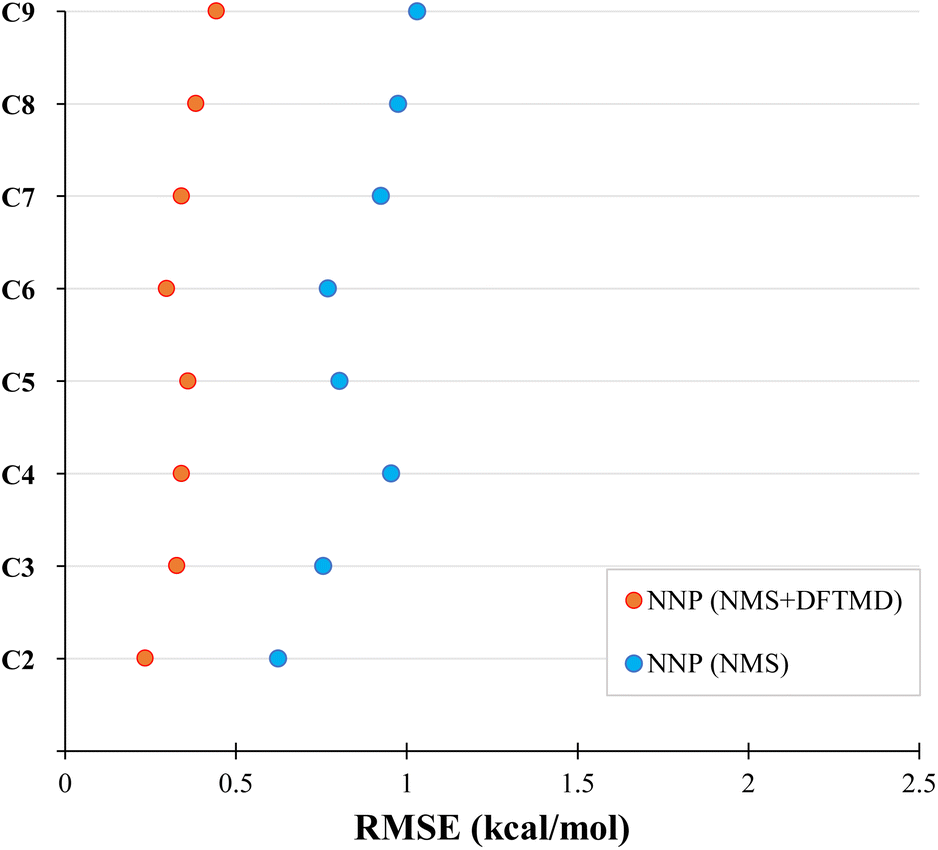 | ||
| Fig. 5 Evaluation of neural network potentials on the test set of molecular dynamics bond-constrained dissociating geometries. The neural network potentials were trained on the NMS data set (blue) or both the NMS and DFTMD data sets (red). | ||
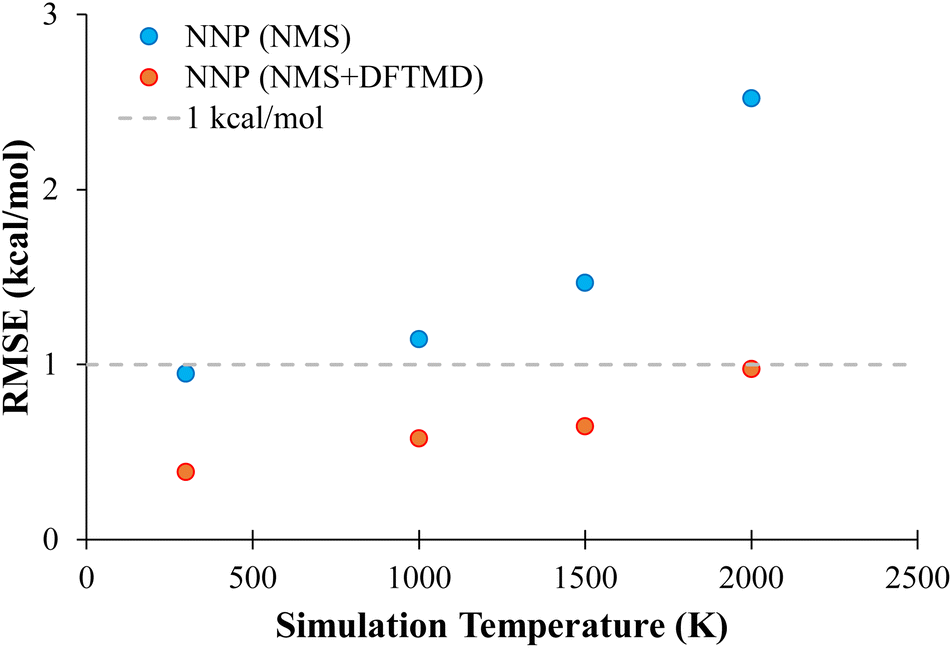
In order to probe the performance of NNPs on MD geometries at different temperatures, additional MD trajectories were generated for propane with initial momenta of 1000 K, 1500 K, and 2000 K as described in Section 2.3.4. The performance of NNP (NMS) and NNP (NMS + DFTMD) evaluating these geometries is shown in Fig. 6. The NNPs trained with DFTMD data performed well at all temperatures. The NNP (NMS) performed well for low temperatures, but based on Fig. 6, the RMSE appears to increase exponentially as the temperature increased. These findings suggest that the NNP (NMS) could be used to potentially run MD simulations if the system is kept at low temperatures. However, if the goal is to observe bond dissociation during MD trajectories where higher temperatures are required, an NNP need to be trained on geometries that span the higher energy regions.
 | ||
| Fig. 6 Evaluation of neural network potentials on the test set of molecular dynamics bond-constrained dissociating geometries as a function of temperature. The neural network potentials were trained on the NMS data set (blue) or both the NMS and DFTMD data sets (red). | ||
The performance of CASPT2 level NNPs on MD geometries at 300 K is also evaluated. Starting with two different previously trained DFT NNPs, one trained with NMS data (NNP NMS), the other trained with NMS and DFTMD data (NNP NMS + DFTMD), we explore transfer learning using the procedure described in Section 2.2.1 using the CASPT2 data set mentioned in Section 2.3.6 to generate the transfer-learned NNPs, referred to as NNP (CASPT2/NMS) and NNP (CASPT2/NMS + DFTMD). The CASPT2 data set is the same for both networks, the only difference between the networks is which DFT data the NNP was trained on before transfer learning. The RMSE performance of the two CASPT2 level NNPs evaluating the CASPT2 validation set of MD geometries are shown in Fig. 7.
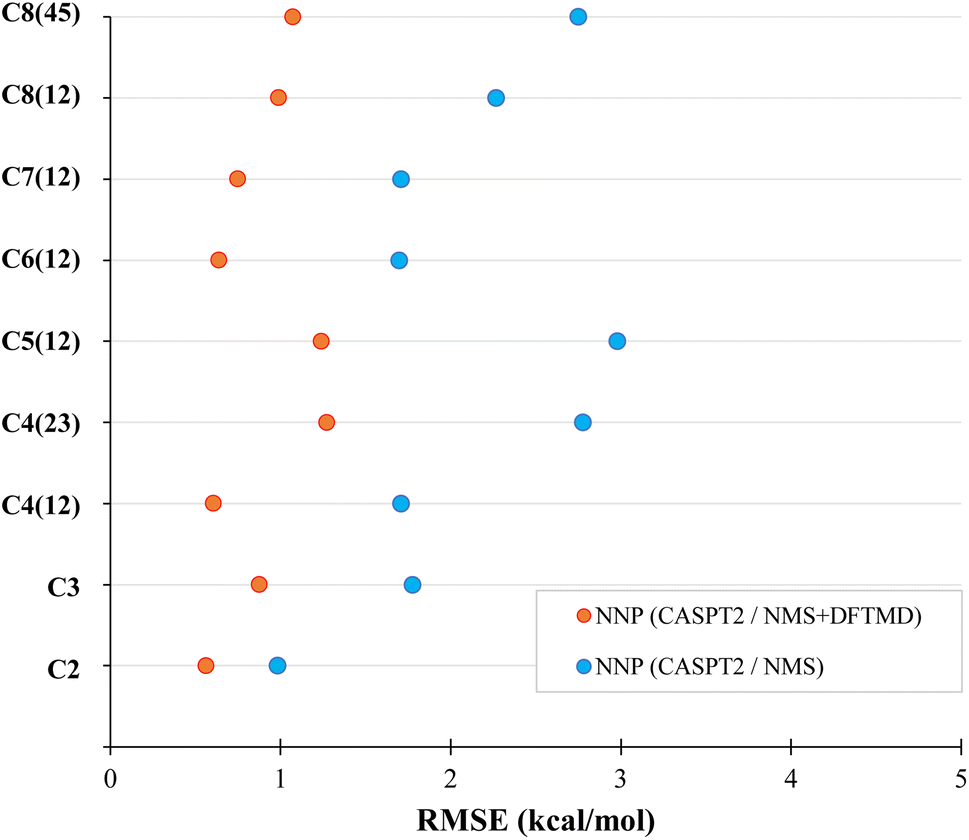 | ||
| Fig. 7 Evaluation of transfer learned neural network potentials on the test set of molecular dynamics bond-constrained dissociating geometries at 300 K. The neural network potentials were initially trained on the NMS data set (blue) or both the NMS and DFTMD data sets (red). Then both neural network potential were retrained using the same CASPT2 data set. | ||
The NNP (CASPT2/NMS) has an RMSE of around 2 kcal mol−1 for most carbon one and two dissociations in alkanes, while the NNP (CASPT2/NMS + DFTMD) gave about 1 kcal mol−1 for most of these dissociations. This shows that even when CASPT2 training data contains only geometries obtained from the NMS data set, if DFT MD geometries are used in the transfer learning, the accuracy of the NNP for molecular dynamics is significantly improved. Due to the computational time for CASPT2 calculations, we limited our study to mostly carbon one and two dissociations. However, in order to test the performance of the CASPT2 level NNP on other dissociation variations, C4(23) and C8(45) dissociation data were also generated in the CASPT2 test set. The RMSE of the CASPT2 NNP perviously trained with both NMS and DFTMD data gave 1.27 kcal mol−1 for butane carbon two and three dissociation, and 1.07 kcal mol−1 for octane carbon four and five dissociation. Therefore, the accuracy of NNP (CASPT2/NMS + DFTMD) is retained regardless of which alkane bond is being dissociated in MD.
In summary, the transfer learning from DFT to CASPT2 provided a great amount of transferability for both MEP geometries and in MD geometries. This suggests that a relatively small amount of CASPT2 is all that is required to obtain general and transferable NNPs for chemical reactions.
4 Conclusions
We have demonstrated the capability of our NNPs to retain high accuracy relative to the methods used to generate the training data. For MEPs, we have shown that NNPs trained up to 4 carbon alkanes with DFT or transfer learned CASPT2 can accurately calculate bond dissociation energies of alkanes up to 8 carbons. For MD simulations, we showed that NNPs trained on NMS data sets can be valid to use at low temperatures, but additional geometries sampled from higher energy configurations are required to be included in the training data to maintain accuracy at higher temperatures. Finally, we showed that transfer learning, with a surprisingly small amount of CASPT2 data, is all that is required to perform MD trajectories with accuracy comparable to CASPT2.While we have shown good transferability between small alkanes to large alkanes, we have not shown transferability between alkanes to other compounds, which is the subject of our future research. However, this work showcases that NNPs have the ability to describe bond making and breaking processes, and what remains is to generate appropriate training data. We believe this work further shows the applicability of NNPs to the study of chemical systems and we expect further adoption of NNPs by the larger community as larger data sets are generated and further advancements in NNPs are developed.
Conflicts of interest
There are no conflicts to declare.Acknowledgements
This material is based upon work supported by the National Science Foundation under Grant No. CHE-1945525 and Camille and Henry Dreyfus Foundation (Award ML-20-146). The authors acknowledge the Minnesota Supercomputing Institute (MSI) at the University of Minnesota and the National Energy Research Scientific Computing Center (NERSC), a DOE Office of Science User Facility supported by the Office of Science of the U.S. Department of Energy under Contract No. DE-AC02-05CH11231, for providing resources that contributed to the results reported within this paper.Notes and references
- E. Kocer, T. W. Ko and J. Behler, Annu. Rev. Phys. Chem., 2022, 73, 163–186 CrossRef PubMed.
- J. Behler, Phys. Chem. Chem. Phys., 2011, 13, 17930–17955 RSC.
- J. Behler, J. Chem. Phys., 2016, 145, 170901 CrossRef PubMed.
- C. M. Handley and P. L. A. Popelier, J. Phys. Chem., 2010, 114, 3371–3383 CrossRef CAS PubMed.
- P. O. Dral, J. Phys. Chem. Lett., 2020, 11, 2336–2347 CrossRef CAS PubMed.
- V. L. Deringer, M. A. Caro and G. Csányi, Adv. Mater., 2019, 31, 1902765 CrossRef CAS PubMed.
- F. Noé, A. Tkatchenko, K.-R. Müller and C. Clementi, Annu. Rev. Phys. Chem., 2020, 71, 361–390 CrossRef PubMed.
- T. Zubatiuk and O. Isayev, Acc. Chem. Res., 2021, 54, 1575–1585 CrossRef CAS PubMed.
- J. Zhang, Y.-K. Lei, Z. Zhang, J. Chang, M. Li, X. Han, L. Yang, Y. I. Yang and Y. Q. Gao, J. Phys. Chem., 2020, 124, 6745–6763 CrossRef CAS PubMed.
- O. T. Unke, S. Chmiela, H. E. Sauceda, M. Gastegger, I. Poltavsky, K. T. Schütt, A. Tkatchenko and K.-R. Müller, Chem. Rev., 2021, 121, 10142–10186 CrossRef CAS PubMed.
- P. Friederich, F. Häse, J. Proppe and A. Aspuru-Guzik, Nat. Mater., 2021, 20, 750–761 CrossRef CAS PubMed.
- A. Grisafi, J. Nigam and M. Ceriotti, Chem. Sci., 2021, 12, 2078–2090 RSC.
- F. Lu, L. Cheng, R. J. DiRisio, J. M. Finney, M. A. Boyer, P. Moonkaen, J. Sun, S. J. R. Lee, J. E. Deustua, T. F. I. Miller and A. B. McCoy, J. Phys. Chem., 2022, 126, 4013–4024 CrossRef CAS PubMed.
- N. Fedik, R. Zubatyuk, M. Kulichenko, N. Lubbers, J. S. Smith, B. Nebgen, R. Messerly, Y. W. Li, A. I. Boldyrev, K. Barros, O. Isayev and S. Tretiak, Nat. Rev. Chem., 2022, 6, 653–672 CrossRef CAS PubMed.
- H. Gokcan and O. Isayev, Wiley Interdiscip. Rev. Comput. Mol. Sci., 2022, 12, e1564 Search PubMed.
- M. Ceriotti, C. Clementi and O. Anatole von Lilienfeld, Chem. Rev., 2021, 121, 9719–9721 CrossRef CAS PubMed.
- J. B. Schriber, D. R. Nascimento, A. Koutsoukas, S. A. Spronk, D. L. Cheney and C. D. Sherrill, J. Chem. Phys., 2021, 154, 184110 CrossRef CAS PubMed.
- Z. Qiao, M. Welborn, A. Anandkumar, F. R. Manby and T. F. Miller, J. Chem. Phys., 2020, 153, 124111 CrossRef CAS PubMed.
- J. S. Smith, O. Isayev and A. E. Roitberg, Chem. Sci., 2017, 8, 3192–3203 RSC.
- D. M. Anstine and O. Isayev, J. Phys. Chem., 2023, 127, 2417–2431 CrossRef CAS PubMed.
- J. Li and H. Guo, J. Chem. Phys., 2015, 143, 221103 CrossRef PubMed.
- B. Jiang, J. Li and H. Guo, J. Phys. Chem. Lett., 2020, 11, 5120–5131 CrossRef CAS PubMed.
- E. Palos, S. Dasgupta, E. Lambros and F. Paesani, Chem. Phys. Rev., 2023, 4, 011301 CrossRef CAS.
- M. S. Chen, J. Lee, H.-Z. Ye, T. C. Berkelbach, D. R. Reichman and T. E. Markland, J. Chem. Theory Comput., 2023 DOI:10.1021/acs.jctc.2c01203.
- C. Devereux, J. S. Smith, K. K. Huddleston, K. Barros, R. Zubatyuk, O. Isayev and A. E. Roitberg, J. Chem. Theory Comput., 2020, 16, 4192–4202 CrossRef CAS PubMed.
- A. S. Christensen, S. K. Sirumalla, Z. Qiao, M. B. O'Connor, D. G. A. Smith, F. Ding, P. J. Bygrave, A. Anandkumar, M. Welborn, F. R. Manby and T. F. Miller, J. Chem. Phys., 2021, 155, 204103 CrossRef CAS PubMed.
- T. A. Young, T. Johnston-Wood, H. Zhang and F. Duarte, Phys. Chem. Chem. Phys., 2022, 24, 20820–20827 RSC.
- A. M. Cooper, P. P. Hallmen and J. Kästner, J. Chem. Phys., 2018, 148, 094106 CrossRef.
- J. Li, K. Song and J. Behler, Phys. Chem. Chem. Phys., 2019, 21, 9672–9682 RSC.
- J. S. Smith, B. Nebgen, N. Lubbers, O. Isayev and A. E. Roitberg, J. Chem. Phys., 2018, 148, 241733 CrossRef PubMed.
- J. S. Smith, B. T. Nebgen, R. Zubatyuk, N. Lubbers, C. Devereux, K. Barros, S. Tretiak, O. Isayev and A. E. Roitberg, Nat. Commun., 2019, 10, 2903 CrossRef PubMed.
- K. Yao, J. E. Herr, D. Toth, R. Mckintyre and J. Parkhill, Chem. Sci., 2018, 9, 2261–2269 RSC.
- K. T. Schütt, H. E. Sauceda, P.-J. Kindermans, A. Tkatchenko and K.-R. Müller, J. Chem. Phys., 2018, 148, 241722 CrossRef PubMed.
- S. Batzner, A. Musaelian, L. Sun, M. Geiger, J. P. Mailoa, M. Kornbluth, N. Molinari, T. E. Smidt and B. Kozinsky, Nat. Commun., 2022, 13, 2453 CrossRef CAS PubMed.
- S. Doerr, M. Majewski, A. Pérez, A. Krämer, C. Clementi, F. Noe, T. Giorgino and G. De Fabritiis, J. Chem. Theory Comput., 2021, 17, 2355–2363 CrossRef CAS PubMed.
- P. Thölke and G. D. Fabritiis, TorchMD-NET: Equivariant Transformers for Neural Network based Molecular Potentials, 2022 Search PubMed.
- M. Geiger and T. Smidt, e3nn: Euclidean Neural Networks, 2022, https://arxiv.org/abs/2207.09453 Search PubMed.
- S. ZHANG, M. Makoś, R. Jadrich, E. Kraka, K. Barros, B. Nebgen, S. Tretiak, O. Isayev, N. Lubbers, R. Messerly, ChemRxiv, preprint, 2023, DOI:10.26434/chemrxiv-2022-15ct6-v3.
- R. Chen, K. Shao, B. Fu and D. H. Zhang, J. Chem. Phys., 2020, 152, 204307 CrossRef CAS PubMed.
- S. Heinen, G. F. von Rudorff and O. A. von Lilienfeld, J. Chem. Phys., 2022, 157, 221102 CrossRef CAS PubMed.
- S. Heinen, G. F. von Rudorff and O. A. von Lilienfeld, J. Chem. Phys., 2021, 155, 064105 CrossRef CAS PubMed.
- D. Lemm, G. F. von Rudorff and O. A. von Lilienfeld, Nat. Commun., 2021, 12, 4468 CrossRef CAS PubMed.
- R. M. Balabin and E. I. Lomakina, J. Chem. Phys., 2009, 131, 074104 CrossRef PubMed.
- G. Montavon, K. Hansen, S. Fazli, M. Rupp, F. Biegler, A. Ziehe, A. Tkatchenko, O. A. von Lilienfeld and K.-R. Müller, Proceedings of the 25th International Conference on Neural Information Processing Systems - Volume 1, USA, 2012, pp. 440–448 Search PubMed.
- X.-M. Duan, Z.-H. Li, G.-L. Song, W.-N. Wang, G.-H. Chen and K.-N. Fan, Chem. Phys. Lett., 2005, 410, 125–130 CrossRef CAS.
- L. Cheng, J. Sun, J. E. Deustua, V. C. Bhethanabotla and T. F. Miller, J. Chem. Phys., 2022, 157, 154105 CrossRef CAS PubMed.
- L. Cheng, J. Sun and T. F. I. Miller, J. Chem. Theory Comput., 2022, 18, 4826–4835 CrossRef CAS PubMed.
- M. Welborn, L. Cheng and T. F. I. Miller, J. Chem. Theory Comput., 2018, 14, 4772–4779 CrossRef CAS PubMed.
- K. Karandashev and O. A. von Lilienfeld, J. Chem. Phys., 2022, 156, 114101 CrossRef CAS PubMed.
- J. Behler and M. Parrinello, Phys. Rev. Lett., 2007, 98, 146401 CrossRef PubMed.
- Y. LeCun, Y. Bengio and G. Hinton, Nature, 2015, 521, 436 CrossRef CAS PubMed.
- K. Andersson, P. A. Malmqvist, B. O. Roos, A. J. Sadlej and K. Wolinski, J. Phys. Chem., 1990, 94, 5483–5488 CrossRef CAS.
- K. Andersson, P. Malmqvist and B. O. Roos, J. Chem. Phys., 1992, 96, 1218–1226 CrossRef CAS.
- S. J. Pan and Q. Yang, IEEE Trans. Knowl. Data Eng., 2010, 22, 1345–1359 Search PubMed.
- M. E. Taylor and P. Stone, J. Mach. Learn. Res., 2009, 10, 1633–1685 Search PubMed.
- T. Turki, Z. Wei and J. T. L. Wang, IEEE Access, 2017, 5, 7381–7393 Search PubMed.
- L. Rosenbaum, A. Dörr, M. R. Bauer, F. M. Boeckler and A. Zell, J. Cheminf., 2013, 5, 33 CAS.
- W. Dai, Q. Yang, G.-R. Xue and Y. Yu, Proceedings of the 24th international conference on Machine learning - ICML'07, New York, New York, USA, 2007, pp. 193–200 Search PubMed.
- M. Capdevila-Cortada, J. Ribas-Arino and J. J. Novoa, J. Chem. Theory Comput., 2014, 10, 650–658 CrossRef CAS PubMed.
- J. S. Smith, O. Isayev and A. E. Roitberg, Sci. Data, 2017, 4, 170193 CrossRef CAS PubMed.
- J. S. Smith, R. Zubatyuk, B. Nebgen, N. Lubbers, K. Barros, A. E. Roitberg, O. Isayev and S. Tretiak, Sci. Data, 2020, 7, 134 CrossRef CAS PubMed.
- J. T. Barron, Continuously Differentiable Exponential Linear Units, 2017 Search PubMed.
- D. P. Kingma and J. Ba, Adam: A Method for Stochastic Optimization, 2014 Search PubMed.
- S. J. Reddi, S. Kale and S. Kumar, Proceedings of the 6th ICLR International Conference on Learning Representations, 2018 Search PubMed.
- X. Gao, F. Ramezanghorbani, O. Isayev, J. S. Smith and A. E. Roitberg, J. Chem. Inf. Model., 2020, 60(7), 3415–3415 CrossRef PubMed.
- A. Paszke, S. Gross, F. Massa, A. Lerer, J. Bradbury, G. Chanan, T. Killeen, Z. Lin, N. Gimelshein, L. Antiga, A. Desmaison, A. Kopf, E. Yang, Z. DeVito, M. Raison, A. Tejani, S. Chilamkurthy, B. Steiner, L. Fang, J. Bai and S. Chintala, Advances in Neural Information Processing Systems 32, Curran Associates, Inc., 2019, pp. 8024–8035 Search PubMed.
- H.-J. Werner, P. J. Knowles, G. Knizia, F. R. Manby, M. Schütz, P. Celani, W. Györffy, D. Kats, T. Korona, R. Lindh, A. Mitrushenkov, G. Rauhut, K. R. Shamasundar, T. B. Adler, R. D. Amos, S. J. Bennie, A. Bernhardsson, A. Berning, D. L. Cooper, M. J. O. Deegan, A. J. Dobbyn, F. Eckert, E. Goll, C. Hampel, A. Hesselmann, G. Hetzer, T. Hrenar, G. Jansen, C. Köppl, S. J. R. Lee, Y. Liu, A. W. Lloyd, Q. Ma, R. A. Mata, A. J. May, S. J. McNicholas, W. Meyer, T. F. Miller III, M. E. Mura, A. Nicklass, D. P. O'Neill, P. Palmieri, D. Peng, K. Pflüger, R. Pitzer, M. Reiher, T. Shiozaki, H. Stoll, A. J. Stone, R. Tarroni, T. Thorsteinsson, M. Wang and M. Welborn, MOLPRO, version 2019.2, a package of ab initio programs, 2019, https://www.molpro.net Search PubMed.
- D. Claudino and R. J. Bartlett, J. Chem. Phys., 2018, 149, 064105 CrossRef PubMed.
- E. R. Sayfutyarova, Q. Sun, G. K. L. Chan and G. Knizia, J. Chem. Theory Comput., 2017, 13, 4063–4078 CrossRef CAS PubMed.
- Q. H. Hu and J. Goodpaster, Alkane-Dataset, 2023, https://github.com/GoodpasterGroup/Alkane-Dataset Search PubMed.
- Q. Hu and J. Goodpaster, Alkane dataset for reactive chemistry neural network potentials at DFT and CASPT2 level, 2023, DOI:10.5281/zenodo.7983019.
- T. Fink and J.-L. Reymond, J. Chem. Inf. Model., 2007, 47, 342–353 CrossRef CAS PubMed.
- J.-D. Chai and M. Head-Gordon, J. Chem. Phys., 2008, 128, 084106 CrossRef PubMed.
- W. J. Hehre, R. Ditchfield and J. A. Pople, J. Chem. Phys., 1972, 56, 2257–2261 CrossRef CAS.
- M. J. Frisch, G. W. Trucks, H. B. Schlegel, G. E. Scuseria, M. A. Robb, J. R. Cheeseman, G. Scalmani, V. Barone, G. A. Petersson, H. Nakatsuji, X. Li, M. Caricato, A. V. Marenich, J. Bloino, B. G. Janesko, R. Gomperts, B. Mennucci, H. P. Hratchian, J. V. Ortiz, A. F. Izmaylov, J. L. Sonnenberg, D. Williams-Young, F. Ding, F. Lipparini, F. Egidi, J. Goings, B. Peng, A. Petrone, T. Henderson, D. Ranasinghe, V. G. Zakrzewski, J. Gao, N. Rega, G. Zheng, W. Liang, M. Hada, M. Ehara, K. Toyota, R. Fukuda, J. Hasegawa, M. Ishida, T. Nakajima, Y. Honda, O. Kitao, H. Nakai, T. Vreven, K. Throssell, J. A. Montgomery, Jr., J. E. Peralta, F. Ogliaro, M. J. Bearpark, J. J. Heyd, E. N. Brothers, K. N. Kudin, V. N. Staroverov, T. A. Keith, R. Kobayashi, J. Normand, K. Raghavachari, A. P. Rendell, J. C. Burant, S. S. Iyengar, J. Tomasi, M. Cossi, J. M. Millam, M. Klene, C. Adamo, R. Cammi, J. W. Ochterski, R. L. Martin, K. Morokuma, O. Farkas, J. B. Foresman and D. J. Fox, Gaussian ∼16 Revision C.01, Gaussian Inc, Wallingford CT, 2016 Search PubMed.
- L. M. Raff, M. Malshe, M. Hagan, D. I. Doughan, M. G. Rockley and R. Komanduri, J. Chem. Phys., 2005, 122, 084104 CrossRef CAS PubMed.
- T. Helgaker, E. Uggerud and H. J. A. Jensen, Chem. Phys. Lett., 1990, 173, 145–150 CrossRef CAS.
- E. Uggerud and T. Helgaker, J. Am. Chem. Soc., 1992, 114, 4265–4268 CrossRef CAS.
- A. H. Larsen, J. J. Mortensen, J. Blomqvist, I. E. Castelli, R. Christensen, M. Dułak, J. Friis, M. N. Groves, B. Hammer, C. Hargus, E. D. Hermes, P. C. Jennings, P. B. Jensen, J. Kermode, J. R. Kitchin, E. L. Kolsbjerg, J. Kubal, K. Kaasbjerg, S. Lysgaard, J. B. Maronsson, T. Maxson, T. Olsen, L. Pastewka, A. Peterson, C. Rostgaard, J. Schiøtz, O. Schütt, M. Strange, K. S. Thygesen, T. Vegge, L. Vilhelmsen, M. Walter, Z. Zeng and K. W. Jacobsen, J. Phys.: Condens. Matter, 2017, 29, 273002 CrossRef PubMed.
- L. Verlet, Phys. Rev., 1967, 159, 98–103 CrossRef CAS.
- H.-J. Werner, P. J. Knowles, G. Knizia, F. R. Manby and M. Schütz, Wiley Interdiscip. Rev. Comput. Mol. Sci., 2012, 2, 242–253 CrossRef CAS.
- S. Kumar, J. M. Rosenberg, D. Bouzida, R. H. Swendsen and P. A. Kollman, J. Comput. Chem., 1992, 13, 1011–1021 CrossRef CAS.
Footnote |
| † Electronic supplementary information (ESI) available. See DOI: https://doi.org/10.1039/d3dd00051f |
| This journal is © The Royal Society of Chemistry 2023 |