
 Open Access Article
 This Open Access Article is licensed under a Creative Commons Attribution-Non Commercial 3.0 Unported Licence
Deep learning metal complex properties with natural quantum graphs†
Hannes
Kneiding
 a,
Ruslan
Lukin
a,
Lucas
Lang
a,
Simen
Reine
a,
Thomas Bondo
Pedersen
a,
Riccardo
De Bin
b and
David
Balcells
*a
a,
Ruslan
Lukin
a,
Lucas
Lang
a,
Simen
Reine
a,
Thomas Bondo
Pedersen
a,
Riccardo
De Bin
b and
David
Balcells
*a
aDepartment of Chemistry, Hylleraas Centre for Quantum Molecular Sciences, University of Oslo, P.O. Box 1033, Blindern, 0315 Oslo, Norway. E-mail: david.balcells@kjemi.uio.no
bDepartment of Mathematics, University of Oslo, P. O. Box 1053, Blindern, Oslo, Norway
First published on 23rd March 2023
Abstract
Machine learning can make a strong contribution to accelerating the discovery of transition metal complexes (TMC). These compounds will play a key role in the development of new technologies for which there is an urgent need, including the production of green hydrogen from renewable sources. Despite the recent developments in machine learning for drug discovery and organic chemistry in general, the application of these methods to TMCs remains challenged by their higher complexity and the limited availability of large datasets. In this work, we report a representation for deep graph learning on TMCs – the natural quantum graph (NatQG), which leverages the electronic structure data available from natural bond orbital (NBO) analysis. This data was used to define both the topology and the information expressed by the NatQG graphs. At the topology level, two different NatQG flavors were developed: u-NatQG, with undirected edges, and d-NatQG, with edges directed along donor → acceptor orbital interactions. At the information level, the node and edge attribute vectors of both graphs contain NBO data, including natural charges and bond orders. The NatQG graphs were used to develop graph neural networks (GNNs) for the prediction of the quantum properties underlying the structure and reactivity of TMCs (e.g. HOMO–LUMO gap and polarizability). These models surpassed baselines based on traditional descriptors and performed at a level similar to, or higher than, state-of-the-art GNNs based on radial cutoffs. The results showed that the electronic structure information encoded by the models has a stronger impact on its accuracy than the geometric information. With the aim of benchmarking the GNNs, we also developed the transition metal quantum mechanics graph dataset (tmQMg), which provides the geometries, properties, and NatQG graphs of 60k TMCs.
Introduction
Machine learning (ML) is revolutionizing chemistry in all its diversity – from drug discovery1–4 to materials science5–15 through related areas including computational chemistry,16–33 organic synthesis,34–38 biochemistry,39,40 catalysis,41–50 and clean energy.51,52 In this context, the deep learning of graph representations53 is gaining momentum. Molecular graphs are highly expressive, encoding not only the local environments represented by the atomic nodes but also their relationships, which are represented by the bond edges.A key advantage of molecular graphs is their direct connection to skeletal formulae (Fig. 1), which can be regarded as the most universal language used by chemists. When combined with graph neural networks (GNNs),54 the resulting models have achieved state-of-the-art accuracy in the prediction of various properties.55 Further, in the context of explainable AI,56–59 the interpretation of the GNNs60–62 can refer to a skeletal formula, providing interpretations that are immediately intuitive. GNNs and related graph-based methods have also succeeded in other challenging tasks, including the generation and inverse design of molecular systems.63–65
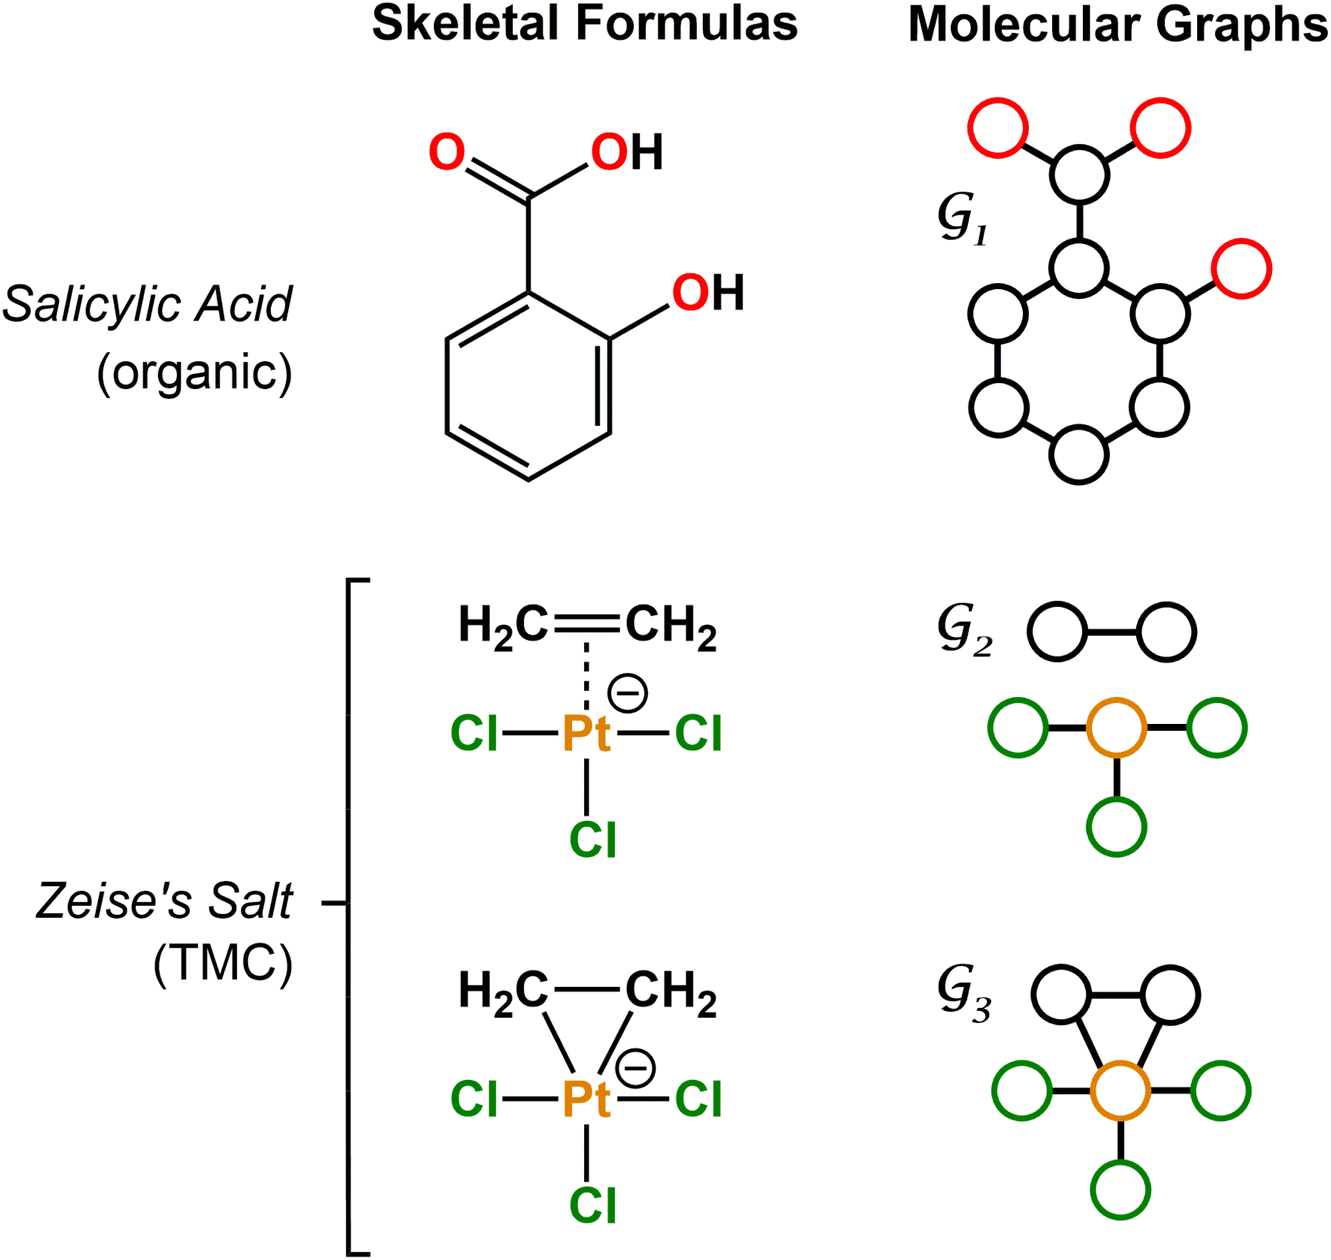 | ||
Fig. 1 Examples of skeletal formulae and molecular graphs for organic (salicylic acid) and TMC (Zeise's salt) compounds. Graphs 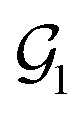 and and 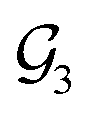 are connected, whereas are connected, whereas  is disconnected. For the sake of clarity, H atoms were not included in the graphs. is disconnected. For the sake of clarity, H atoms were not included in the graphs. | ||
Transition metal complexes (TMCs) are a diverse family of compounds, including bioinorganic, Werner, and organometallic complexes, with key applications in multiple fields including catalysis66 (e.g. synthesis of fine chemicals), nanomaterials67 (e.g. electronic devices), medicinal chemistry68 (e.g. anticancer drugs), and renewable energies69 (e.g. photosensitizers). The development of accurate GNN models for the discovery and design of new TMCs with optimal properties is motivated by the strong societal impact of these applications. In line with this, there is a growing interest in the development of data-driven approaches to the study of TMCs and their applications.70–79
For organic compounds, the derivation of molecular graphs is straightforward (Fig. 1) and can be done from different inputs, including geometries and line notations (e.g. SMILES80 and SELFIES81). In line with this, most GNN models have been developed for, and tested on, organic molecules, often in the field of drug discovery.3 In contrast, TMCs are more difficult to express as graphs due to the metal d orbitals, which yield larger valences and multi-center bonds. In this context, the representation of a TMC can become ambiguous, with multiple possible graphs of different topology. This may include disconnected graphs limiting the applicability of GNNs. Fig. 1 illustrates this problem for the Zeise's salt, the first historical example of a metal–olefin complex.82 Graph generation from either line notations or geometries does not fully solve this problem – the former either don't support or are not robust for TMCs, and, from the latter, it is difficult to define the atomic connectivity. Nonetheless, geometric information is highly valuable and it has been used successfully to inform several graph representations with the aim of increasing the accuracy of GNN models.83 In contrast, the use of electronic structure information for the same purpose remains largely unexplored,84,85 despite its availability from geometry optimization calculations and its low computational cost.
In this article, we introduce the natural quantum graph representation (NatQG) for TMCs and its implementation into GNN models based on message-passing algorithms.86 These models leverage the inductive bias provided by natural bond orbital (NBO) theory,87 which transforms the quantum wave function into a set of localized molecular orbitals (i.e. the NBOs) corresponding to the electron pairs of a Lewis structure. In the context of this theory, second-order perturbation analysis87 (SOPA) yields the nature and strength of the interactions between pairs of NBO orbitals based on their energy difference and overlap. The NBO and SOPA data were used to define the topology and inform the nodes and edges of undirected (u-NatQG) and directed (d-NatQG) molecular graphs for TMCs (Fig. 2 and 3, respectively), which were used in the prediction of their quantum properties with GNNs.
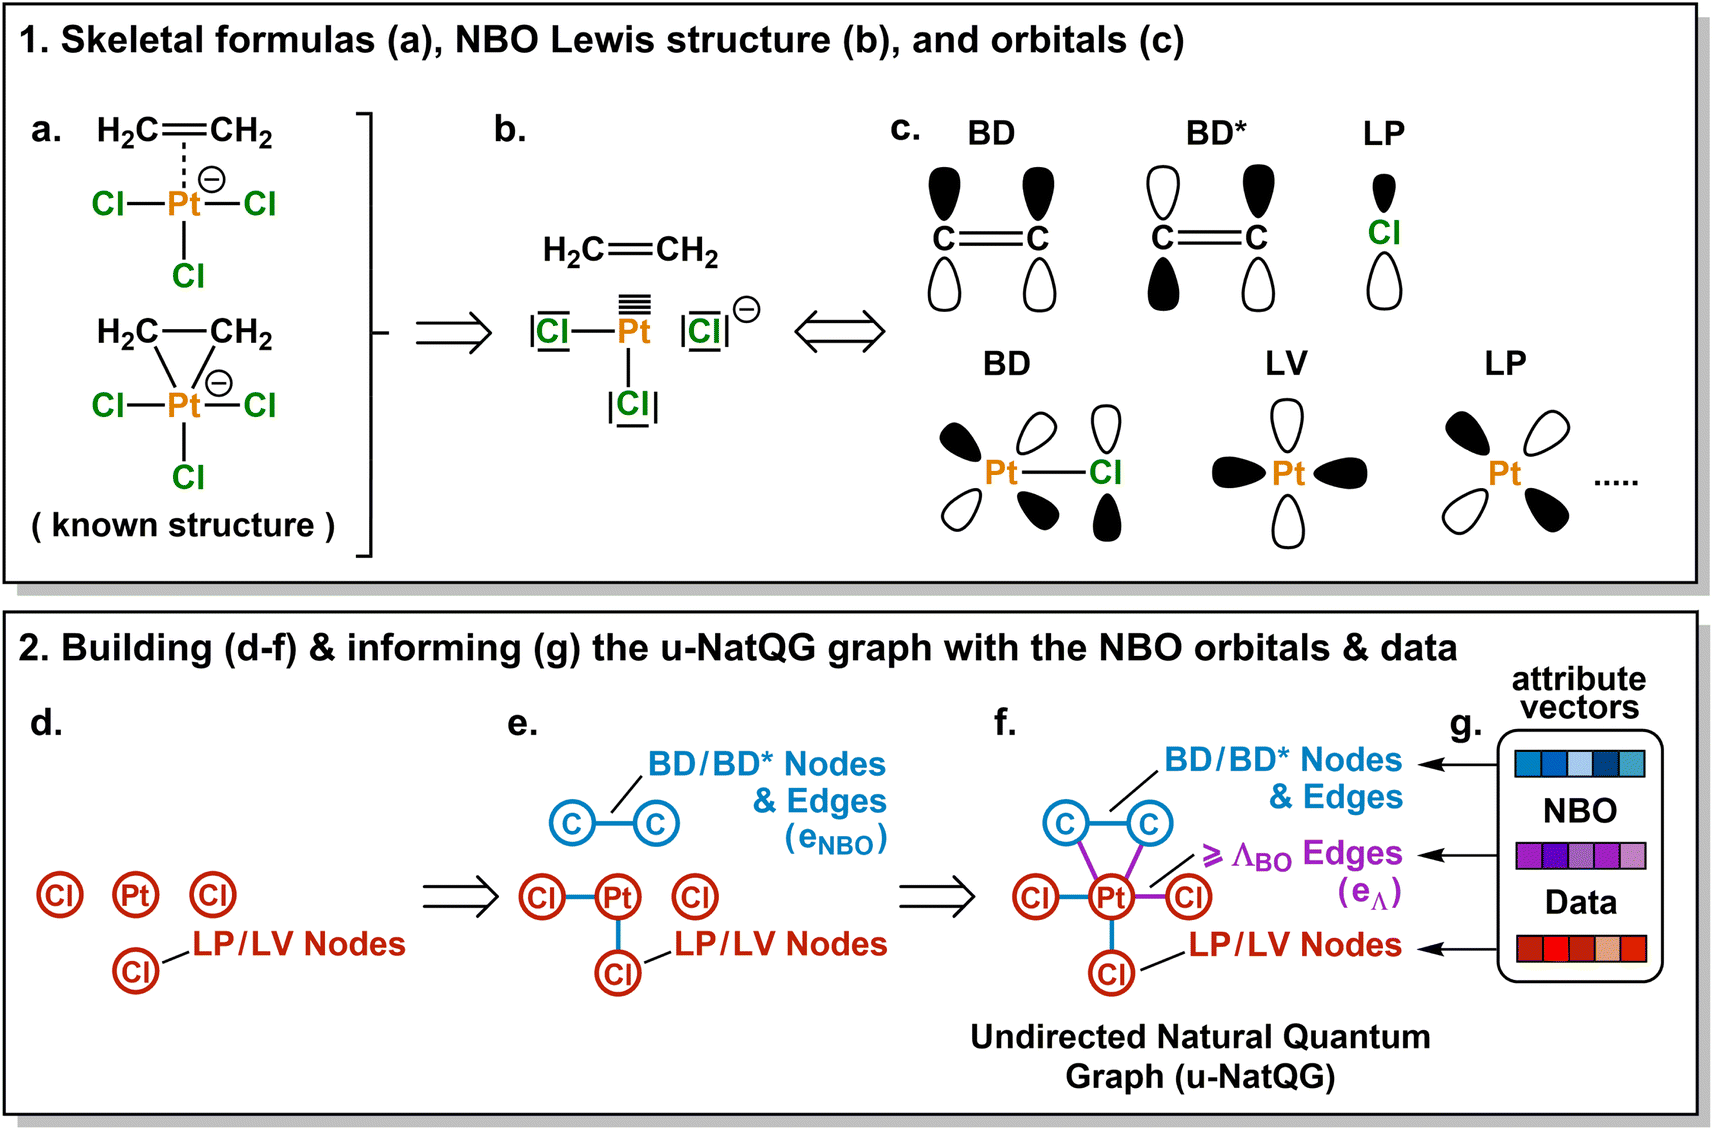 | ||
| Fig. 2 Derivation of the Zeise's salt u-NatQG graph. Abbreviations used for the NBO orbitals: LP = lone pair, LV = lone vacancy, BD = bonding, BD* = antibonding. ΛBO = natural bond order threshold. | ||
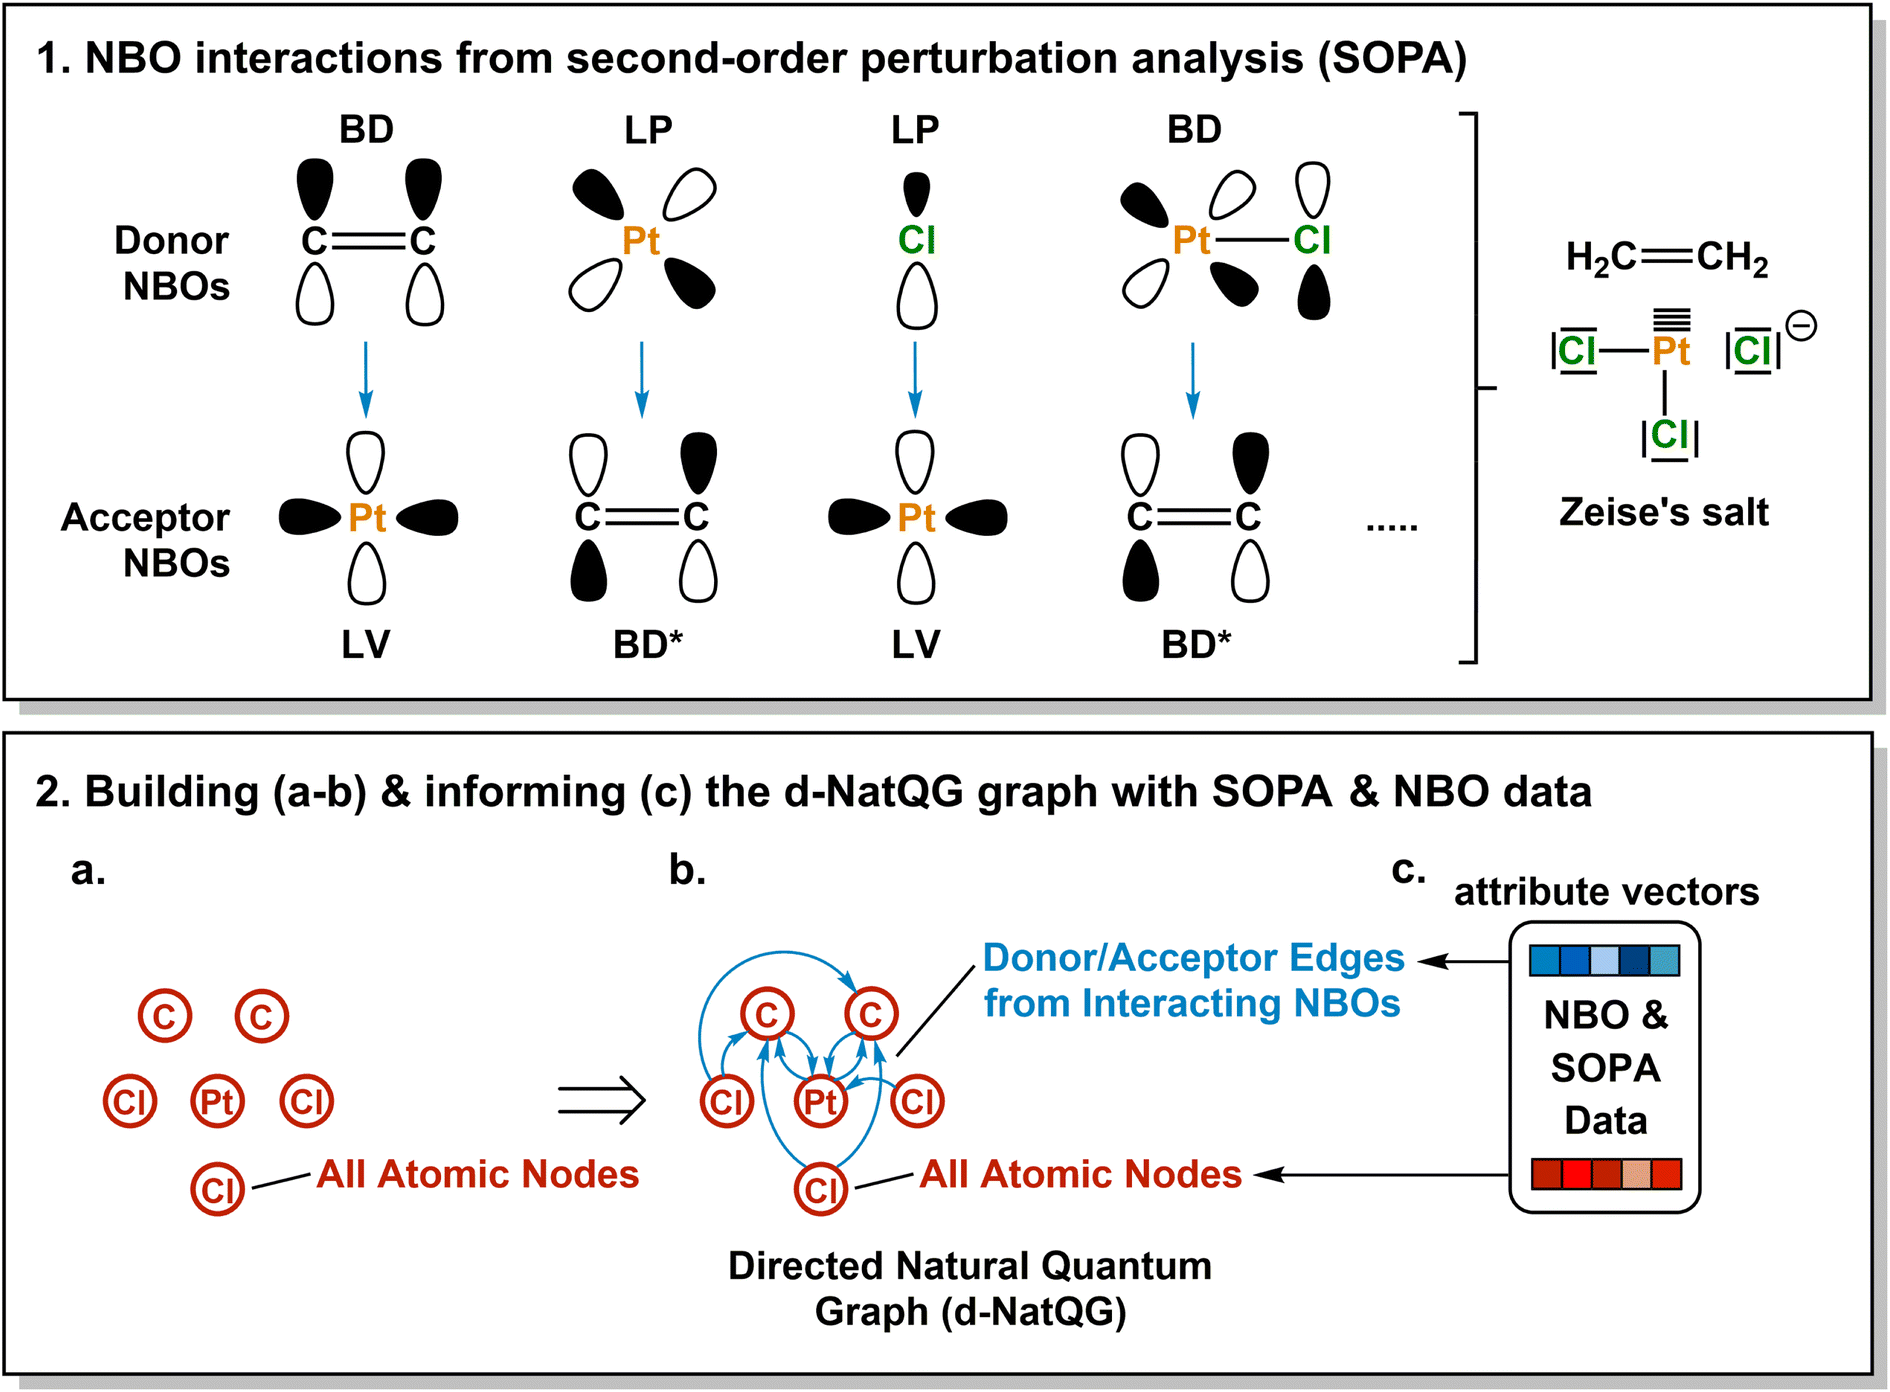 | ||
| Fig. 3 Derivation of the Zeise's salt d-NatQG graph. Abbreviations used for the NBO orbitals: LP = lone pair, LV = lone vacancy, BD = bonding, BD* = antibonding. | ||
With the aim of benchmarking the GNNs, we developed the transition metal quantum mechanics graph (tmQMg) dataset, which provides the NatQG graphs of 60k TMCs together with their DFT geometries and properties. For most properties, the accuracy of the NatQG GNNs surpassed that of other models, including graphs that were either informed with classical descriptors or built from cutoff radius. This includes the HOMO–LUMO gap of the TMCs, which underlies several TMC properties of high interest, including conductivity, photochemistry, and thermal stability. The present work also showed how the electronic structure data from a single-point calculation of the energy can be leveraged in machine learning models to predict expensive quantum properties requiring the calculation of energy derivatives, including the polarizability and the thermodynamic corrections.
Natural quantum graphs
The Zeise's salt structure is known and yet its skeletal formula can be drawn in two different ways differing on how the haptic Pt–ethylene bond is represented (Fig. 2a); whereas one formula may mostly represent the Pt ← ethylene donation, with both C atoms bound to Pt, the other would account for Pt → ethylene backdonation, with the metal interacting with the π-bond of ethylene. These two formulae can be regarded as resonance forms yielding graphs of different topology. This issue can be solved by means of a natural bond orbital (NBO) calculation,87 which yields a Lewis structure (Fig. 2b) maximizing the electron occupancies of the NBO orbitals (Fig. 2c). With the NBO data, a single graph can be defined for the Zeise's salt, including its topology and the attribution of its nodes and edges with rich electronic structure information. The NBOs can be computed with several quantum chemistry programs and they have a low computational cost, requiring only a single-point calculation of the energy. E.g., at the DFT level, the NBOs of the Zeise's salt can be computed on a laptop in a few seconds.In this work, we used NBOs and their donor–acceptor interactions to derive two types of natural quantum graphs (NatQG) differing in the nature of their edges, which are either undirected (u-NatQG) or directed (d-NatQG). There is no node redundancy in either graph (i.e. each node represents a single atom of a TMC), and both contain geometric information (i.e. bond distances). For generating the graphs, we developed the Hylleraas deep graph learning (HyDGL) program, with code openly available at https://github.com/hkneiding/HyDGL.
In this study, both the geometries and the NBOs were computed with DFT methods. However, these properties can also be obtained at lower levels of theory; e.g. NBOs can be calculated with DFTB methods,88 reducing the computational cost by two orders of magnitude. It should be noted that changing the level of theory at which these properties are obtained may affect the accuracy of the ML models in which the u-NatQG and d-NatQG representations are leveraged.
Undirected graphs
Fig. 2 illustrates the derivation of u-NatQG for the Zeise's salt. First, the NBO orbitals are used to define the topology of the graph. The one-center lone electron pairs (LP) and vacancies (LV) NBOs are both expressed as atom nodes of the graph (Fig. 2d). Next, the two-center bonding (BD) NBOs are added to the graph as bond edges, and their atoms are also added as nodes if they do not have LP and LV NBOs (e.g., in the Zeise's salt, the C atoms of the ethylene ligand; Fig. 2e).The graph topology resulting from the NBOs has a major drawback – it can be disconnected (Fig. 2e) and, therefore, in a GNN, message passing cannot span the whole graph regardless of the model depth. The disconnectedness arises from the Lewis structure generated in the NBO calculation, which can exclude some of the metal–ligand bonds yielding isolated fragments (e.g. ethylene in the Zeise's salt). This problem was solved by defining a natural bond order threshold (ΛBO). After applying the ΛBO ≥ 0.05 bonding condition to all possible metal–atom pairs, the Zeise's salt u-NatQG graph became fully connected (Fig. 2f). This ΛBO value was set after inspecting graph connectedness over the 60k TMCs included in the tmQMg dataset (vide infra).
After defining the topology, the u-NatQG graphs are informed with attribute vectors expressing the NBO electronic structure (Fig. 2g). At the node level, these attributes include the natural atomic charge, valence index, and electron configuration, whereas the edges are attributed with the natural bond order. In addition, both the nodes and the edges encode features of the LP/LV and BD/BD* NBO orbitals, respectively, including orbital type, number, energy, electron occupancy, and symmetry (i.e. spd hybridization). Table 1 provides a systematic list and further details of the u-NatQG attributes.
| Attribute | Description |
|---|---|
| a Atomic charges and valences from NBO analysis. b Wiberg-based. c In the natural electron configuration. d This and all other LP and LV attributes are set to zero when the node is not associated to these NBO types, and the same approach is applied to the energy gap when there is a single LP or LV. e Percentage of orbital character in NAO basis (hybridization). f Either BD or three-center (3C) NBOs. g This and all other BN and BN* attributes are set to the graph-average values for the edges build with the ΛBO ≥ 0.05 condition. h Restricted to NBOs of the same type. i Counting BD*, 3Cn, and 3C* orbitals. | |
| Nodes | |
| Z | Atomic number |
| N H | Number of H atoms attached to the node |
| q Nat | Natural atomic chargea |
| V Nat | Natural valence indexa,b |
| N VEl | Number of s, p, and d valence electrons; NVEl = (Ns, Np, Nd)c |
| N LP | Number of lone pair (LP) NBOsd |
| E LP | Energy of the highest-lying LP |
| O LP | Electron occupancy of the highest-lying LP |
| S LP | s, p, and d orbital symmetries of the highest-lying LP; SLP = (sLP, pLP, dLP)e |
| ΔELP | Energy gap between highest- and lowest-lying LP |
| N LV | Number of lone vacancy (LV) NBOs |
| E LV | Energy of the lowest-lying LV |
| O LV | Electron occupancy of the lowest-lying LV |
| S LV | s, p, and d orbital symmetries of the lowest-lying LV; SLV = (sLV, pLV, dLV)e |
| ΔELV | Energy gap between lowest- and highest-lying LV |
![[thin space (1/6-em)]](https://www.rsc.org/images/entities/char_2009.gif) |
|
| Edges | |
| BO | Natural bond orderb |
| d | Bond distance |
| T BN | Bonding NBO (BN) type; i.e. 2-center or 3-center (one-hot encoded) |
| N BN | Number of bonding NBOsf |
| BNE | Energy of the highest-lying BNg |
| O BN | Electron occupancy of the highest-lying BN |
| S BN | s, p, and d orbital symmetries of the highest-lying BN; SBN = (sBN, pBN, dBN)e,g |
| ΔEBN | Energy gap between lowest- and highest-lying BNh |
| N BN* | Number of non- and anti-bonding NBOs (BN*)i |
| E BN* | Energy of the lowest-lying BN*g |
| O BN* | Electron occupancy of the lowest-lying BN* |
| S BN* | s, p, and d orbital symmetries of the lowest-lying BN*; SBN* = (sBN*, pBN*, dBN*)e,g |
| ΔEBN* | Energy gap between lowest- and highest-lying BN*h |
In principle, the combination of NBO- and ΛBO-based edges (eNBO and eΛ, respectively) for enforcing the connectedness of u-NatQG (Fig. 2f) would yield heterogeneous graphs with attribute vectors of different dimensionality, challenging their exploitation in GNN models. This issue is caused by the different amount of data available in each case – whereas all orbital parameters are available to inform the eNBO edges, yielding a total of eighteen dimensions (Table 1), for the eΛ edges only two dimensions can be defined (the bond order and distance). This problem was solved by informing eΛ with the same eighteen dimensions of eNBO, using the graph-averaged values to assign the unknown orbital parameters. It should be noted that, in practice, the amount of eNBO edges is ca. ten times larger than that of eΛ edges (vide infra).
Directed graphs
An alternative way of expressing the NBO data as a molecular graph is by using the SOPA analysis.87 This part of the NBO calculation yields the interactions between the donor (e.g. LP) and acceptor (e.g. BD*) NBOs and, in addition to identifying the interacting orbitals, it provides the stabilization energy, E(2), which measures the strength of the interactions. The E(2) value is proportional to the square of the perturbation (orbital mixing, F) of the interacting NBOs and inversely proportional to the energy difference between them (ΔE); i.e.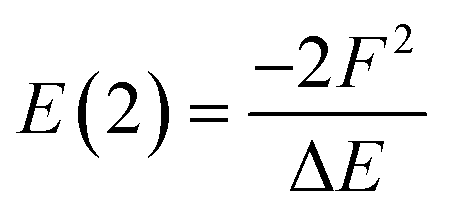
The SOPA data was used to build the directed d-NatQG graphs, in which the interacting node pairs (ni, nj) are connected with directed ni → nj edges accounting for ni-to-nj donor–acceptor interactions.
Fig. 3 shows the derivation of the d-NatQG graph of the Zeise's salt. For the bonding between platinum and ethylene, the SOPA yields a BDC![[double bond, length as m-dash]](https://www.rsc.org/images/entities/char_e001.gif) C → LVPt interaction for the π → d donation from the ligand to the metal center, and an LPPt → BD*CC interaction for the d → π* backdonation from the metal center to the ligand. In d-NatQG, these interactions are expressed with a directed graph topology including Pt ⇄ C edges, in which the relationship expressed in one direction, Pt ← C (BD-to-LV donation), is different from that expressed in the opposite direction, Pt → C (LP-to-BD* backdonation). When an atom pair is involved in multiple donor–acceptor interactions in either one direction or in both, d-NatQG accounts only for the strongest (i.e. the one yielding the largest E(2) value). In order to avoid a redundant excess of edges, the latter are only added to the graph if they represent an interaction with E(2) > 1 kcal mol−1.
C → LVPt interaction for the π → d donation from the ligand to the metal center, and an LPPt → BD*CC interaction for the d → π* backdonation from the metal center to the ligand. In d-NatQG, these interactions are expressed with a directed graph topology including Pt ⇄ C edges, in which the relationship expressed in one direction, Pt ← C (BD-to-LV donation), is different from that expressed in the opposite direction, Pt → C (LP-to-BD* backdonation). When an atom pair is involved in multiple donor–acceptor interactions in either one direction or in both, d-NatQG accounts only for the strongest (i.e. the one yielding the largest E(2) value). In order to avoid a redundant excess of edges, the latter are only added to the graph if they represent an interaction with E(2) > 1 kcal mol−1.
Once the d-NatQG graph is built, it is informed with electronic structure information. The node attribute vectors contain the same NBO data used in the u-NatQG graphs. In contrast, the edge attributes are mostly extracted from the SOPA, including the orbital type, energy, occupancy, and symmetry of the donor and acceptor NBOs. Further, the bond order and the maximum and average values of E(2) are included. Table 2 provides a systematic list and further details of the d-NatQG attributes.
| Attribute | Description |
|---|---|
| a E(2)MAX when there is a single interaction. b This and all other properties are for the NBOs yielding the strongest donor–acceptor interaction for the node pair connected by the edge (i.e. largest E(2) value in the SOPA). c Restricted to NBOs of the same type. | |
| Nodes | |
| Z, NH, qNat, VNat, NVEl | As described for u-NatQG in Table 1 |
|
|
| Edges | |
| BO | Natural bond order |
| d | Bond distance |
| E(2)MAX | SOPA stabilization energy for the strongest donor–acceptor interaction |
| E(2)Avg | Average of the SOPA stabilization energiesa |
| T D | Donor NBO type;bi.e. LP, BD, or 3C (one-hot encoded) |
| E D | Energy of the donor NBO |
| O D | Electron occupation of the donor NBO |
| S D | s, p, and d orbital symmetry of the donor NBO; DSym = (Ds, Dp, Dd) |
| ΔED | Energy gap between lowest- and highest-lying donor NBOc |
| T A | Acceptor NBO type;bi.e. LV, BD*, 3Cn, or 3C* (one-hot encoded) |
| E A | Energy of the acceptor NBO |
| O A | Electron occupation of the acceptor NBO |
| S A | s, p, and d orbital symmetry of the acceptor NBO; ASym = (As, Ap, Ad) |
| ΔEA | Energy gap between lowest- and highest-lying acceptor NBOc |
In contrast with u-NatQG, the connectedness of the d-NatQG is guaranteed by the SOPA analysis, without requiring the definition of a threshold. However, from a skeletal formula perspective, d-NatQG is more exotic, with missing edges in positions where there are covalent bonds (e.g., in the Zeise's salt, between the two carbon atoms of the ethylene ligand). In terms of explainability, this may make the d-NatQG graphs less intuitive though it should be also noted that they express, with directionality, the fundamental interactions commonly used by chemists to conceptualize the structure and bonding of TMCs, including π-backdonation.
In addition to the electronic structure attributes of Tables 1 and 2, both the u-NatQG and d-NatQG graphs include information on chemical composition and geometry, as well as whole-graph attributes. Chemical composition is encoded by including the atomic number in the node attribute vectors. The graphs also include hydrogen atoms explicitly, as nodes, which allows for including features that are relevant in the chemistry of TMCs; e.g. hydride complexes and agostic interactions. For implicit representations, the number of hydrogen atoms attached to each node is also available. At the geometric level, the edges were informed with the interatomic bond distance. Further, a whole-graph attribute vector provides the charge of the TMC, its molecular mass, and the total number of atoms and electrons. In TMCs containing three-center bonding (3C), non-bonding (3Cn), and antibonding (3C*) NBOs, the data of these orbitals was also used to define the topology and attributes of the graphs. When BD and 3C orbitals overlapped at a given edge, the data of the latter was used to build the graph. Neither of the two graph representations contain information about the core and Rydberg NBOs.
In both u-NatQG and d-NatQG, the definition of the NBOs from a localized Lewis structure can partially break the symmetry of the system (e.g. trans-Cl bonds become non-equivalent in Fig. 2b), which may have an impact on the predictions made by the GNN models (vide infra). Further, the NatQG graphs encode the NBO orbitals implicitly, embedding their defining parameters into the node and edge attribute vectors of a molecular graph that, especially in the case of u-NatQG, can be directly related to the skeletal formula of the represented TMC. An alternative approach, recently explored by Gomes et al.,89 consists in representing LP and BD orbitals with additional explicit nodes. The NatQG graphs may also be used to develop a string representation with rich electronic structure information, similar to the representation developed by Dietz.90 Further, these graphs could also be useful in the context of the zero-order bond approach developed by Clark.91
Transition metal quantum mechanics graph dataset
In order to train and validate the deep learning models of this work, we computed the transition metal quantum mechanics graph dataset (tmQMg). Fig. 4 gives an overview on the derivation and contents of this dataset. tmQMg provides the quantum geometries and properties of 60799 transition metal complexes (TMCs), including all thirty elements from the 3d, 4d, and 5d series. In addition to this data, tmQMg provides the u- and d-NatQG graphs (Fig. 2 and 3) of all complexes, including the topology and attribute vectors derived from the NBO and SOPA data (Tables 1 and 2). A baseline graph informed with generic atomic and bond properties (vide infra) is also provided for each TMC.
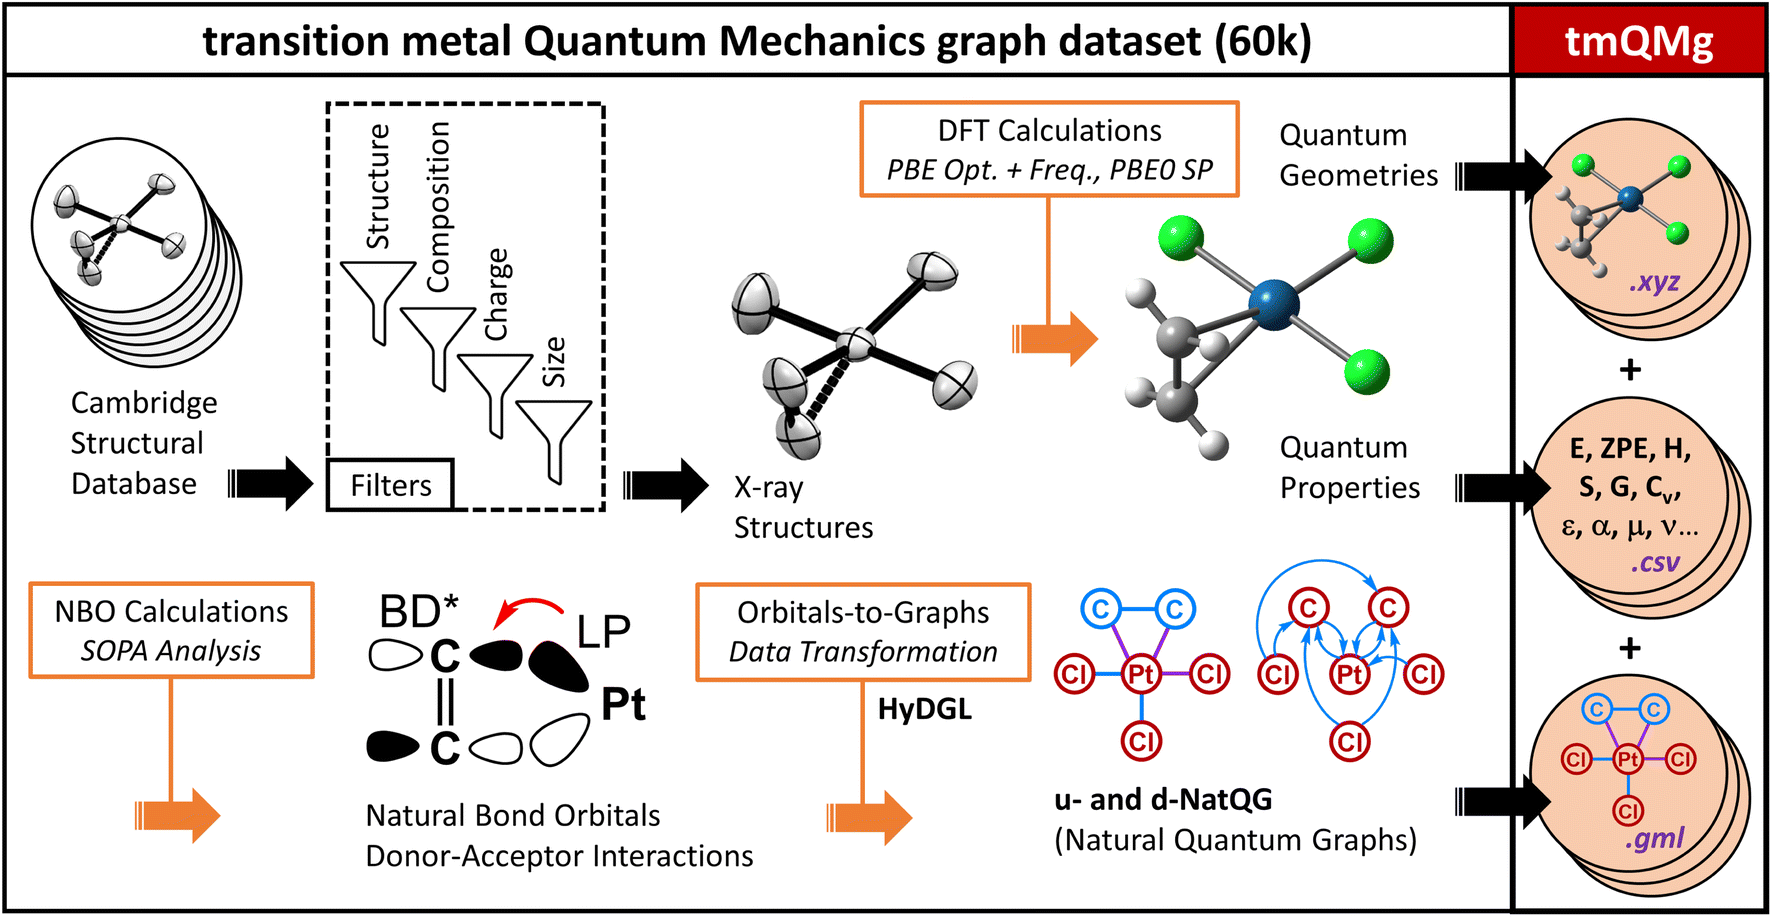 | ||
| Fig. 4 Derivation and content of the tmQMg dataset. | ||
The TMCs of the tmQMg dataset were extracted from the Cambridge Structural Database (CSD; 2020.0 release) by applying a series of filters on structure and composition, which yielded 3D-resolved non-polymeric and non-disordered structures with a single metal center, containing C and H, and also allowing for B, Si, N, P, As, O, S, Se, F, Cl, Br, and I. Co-crystallizing molecules (e.g. solvent) were excluded, and filters on charge (q) and the number of electrons (Ne) and atoms (Natoms) were also applied. The TMCs included in tmQMg have q ∈ {+1, 0, −1}, even Ne, and Natoms ≤ 85.
Fig. 5 shows a random selection of ten different TMCs, one for each transition metal group. From a composition perspective, and in addition to the metals, these complexes contain nine different elements (C, H, O, S, N, P, F, Cl, and Br), whereas, from a structural perspective, they contain nineteen different ligands, including both monodentate and chelating ligands, binding to the metal center in eight coordination modes (monodentate, (κ, η2), η5, κ5, (κ2, η2), κ2, η6, and κ3) and three coordination numbers (4, 6, and 8). The diversity of this small selection, which represents only 0.016% of the overall dataset, reflects the complexity of the chemical space within tmQMg.
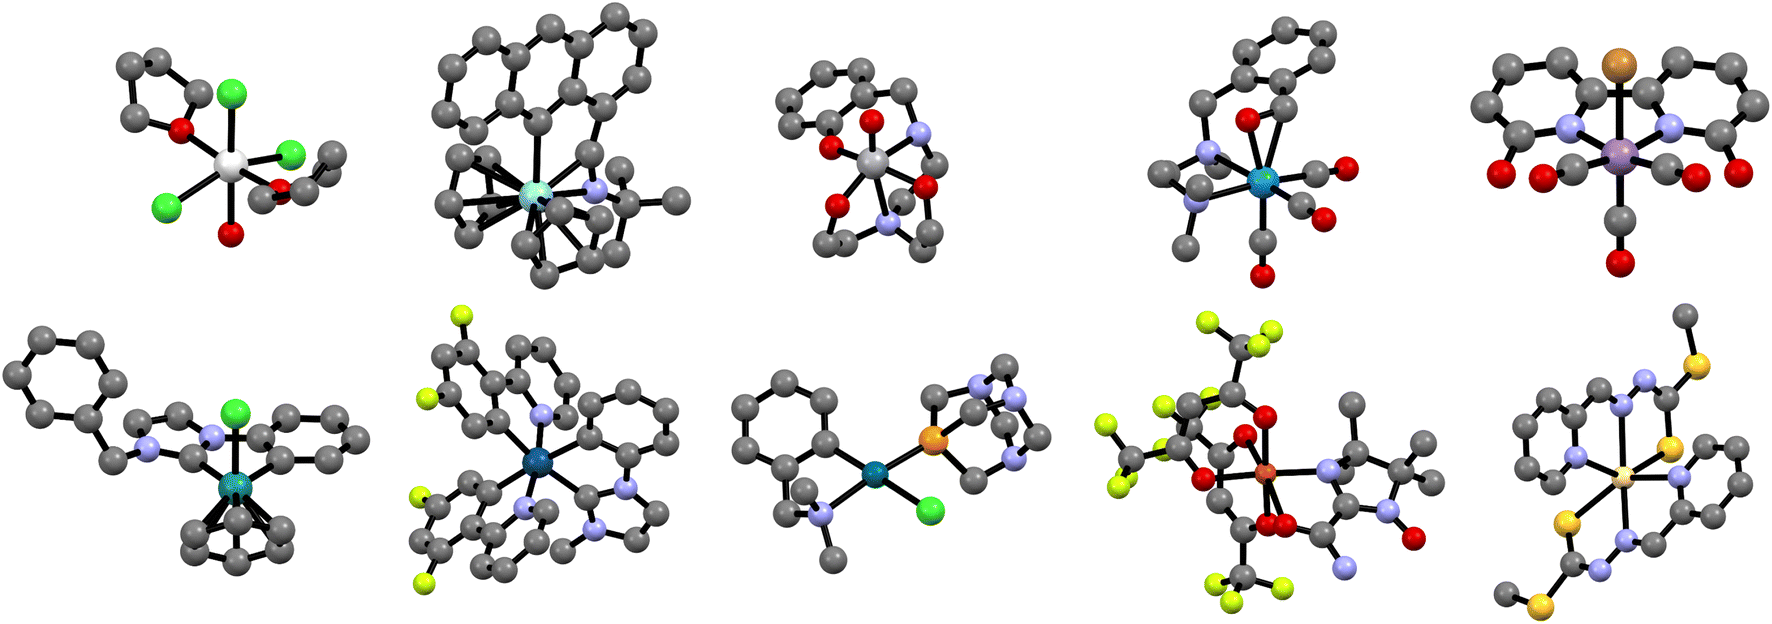 | ||
| Fig. 5 Randomly selected geometries from groups 3 to 7 (top, left-to-right) and 8 to 12 (bottom, left-to-right). Following the same order, the metal centers of the complexes are Sc, Zr, V, W, Mn, Ru, Ir, Pd, Cu, and Cd. The color code of the non-metal atoms is: grey (C), red (O), gold (S), blue (N), orange (P), light green (F), dark green (Cl), brown (Br). Hydrogen atoms were removed for clarity. | ||
For all TMCs in tmQMg, the quantum data was obtained from three different DFT calculations carried out for the closed-shell singlet state in this order:
(1) Full geometry optimization at the PBE-D3BJ/def2-SVP level.92–94
(2) Calculation of frequencies and thermochemistry at the PBE-D3BJ/def2-SVP level.92–94
(3) Single-point energy and NBO calculation at the PBE0-D3BJ/def2-TZVP level.93–95
When any of these three calculations failed, the system was excluded from the dataset. The overall success rate of the calculations was 88.7%. Calculation 1 yielded fully optimized energy minima. Complexes with the same stoichiometry and energy (e.g. duplicates and enantiomers) were excluded. In calculation 2, only geometries giving all-real frequencies were included in the dataset. In addition to the geometries, the following quantum properties were extracted from the output of these two calculations: the double-ζ potential, zero-point, internal, entropy, enthalpy, and free energies, heat capacity at constant volume, isotropic polarizability, and lowest and highest harmonic vibrational frequencies. Calculation 3 yielded the NBO parameters used to build and attribute the u- and d-NatQG representations (Fig. 2 and 3, and Tables 1 and 2), as well as the dipole moment, the triple-ζ potential and dispersion energies, the HOMO and LUMO energies, the HOMO–LUMO gap, and the natural charge of the metal center. All these quantum properties are included in the tmQMg dataset. The ESI† provides statistics on tmQMg, including molecular charge, size, and composition, as well as pair plots showing the degree of correlation between the different quantum properties (Fig. S1–S3†).
Besides the optimization of the GNN models reported in this study (vide infra), the NBO data available from tmQMg was also used to develop the NatQG representations. Whereas the connectedness of the d-NatQG representation (Fig. 3) was guaranteed by the SOPA-based definition of its topology, u-NatQG (Fig. 2) required a natural bond order threshold (ΛBO) to define a connected topology around the metal center. Fig. 6 shows how the number of disconnected graphs decreases with the ΛBO threshold for the whole tmQMg dataset. The Wiberg ΛBO reduced disconnectedness more rapidly than the NLMO; e.g. at ΛBO = 0.20, there were either 11034 (Wiberg) or 19493 (NLMO) disconnected graphs. For this work, we used a Wiberg ΛBO ≥ 0.05 threshold to define the u-NatQG topology, with which only 3.9% of the graphs (2370 TMCs) remained disconnected. Many of these disconnected graphs represent group 11 and 12 TMCs with weakly bound molecular fragments that, from a covalent bond perspective, may not be considered metal ligands. ΛBO can thus be used as a parameter modulating the connectedness of the u-NatQG graphs depending on the strength of the metal–ligand bonds. In the disconnected graphs, the metal-free fragments can be easily identified as isolated subgraphs and be further processed as needed (by e.g. connecting or excluding them). With ΛBO ≥ 0.05, the average ratio over the entire dataset between NBO-based (eNBO) and ΛBO-based (eΛ) edges in the u-NatQG graphs was eNBO/eΛ = 10.4.
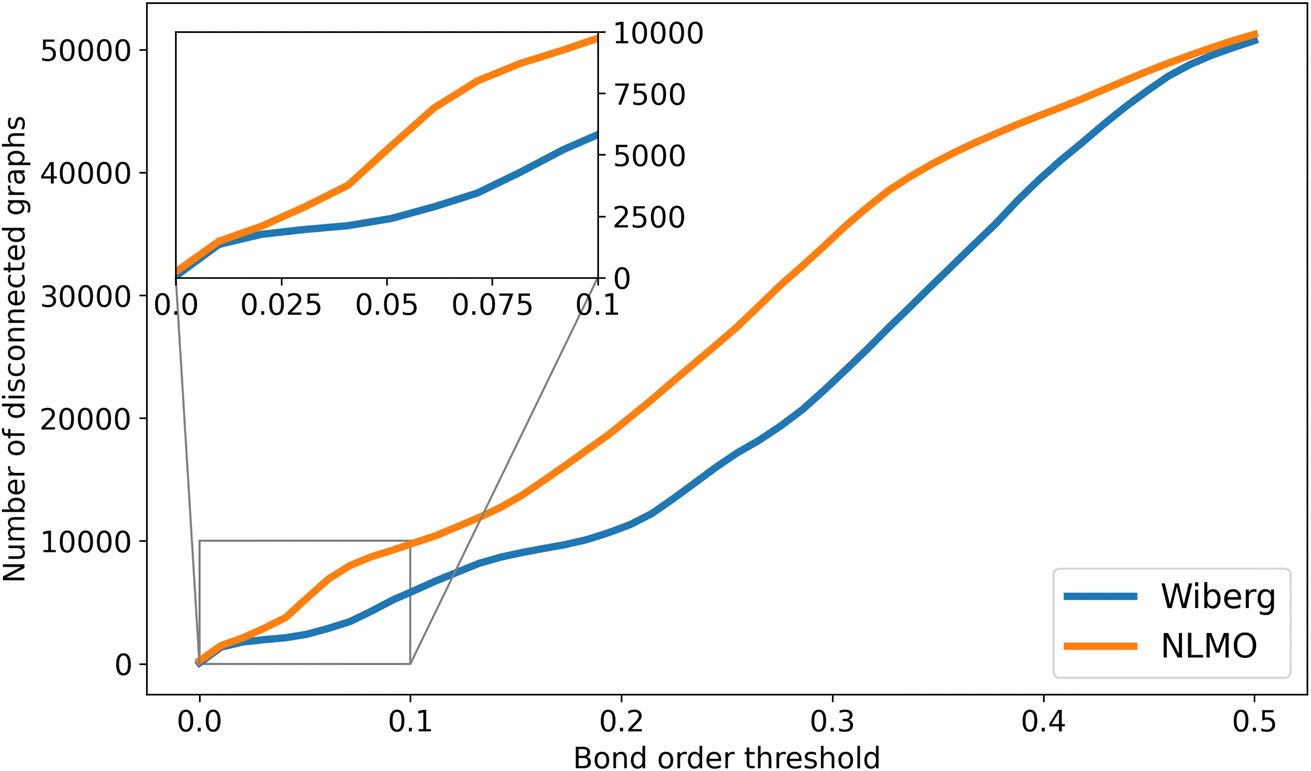 | ||
| Fig. 6 Number of disconnected u-NatQG graphs vs. the Wiberg (orange) and NLMO (blue) natural bond order thresholds (ΛBO). | ||
The metal complexes included in tmQMg exist in the CSD and, therefore, they are accessible through synthetic routes described in the literature. This feature may enhance the reliability of generative models trained with tmQMg, though it may also introduce biases (e.g. TMC tendency to form crystals of the quality required for structure determination by diffraction techniques). Further, the tmQMg dataset can be used to benchmark deep graph learning models for TMCs, including convolutional embedding.96 Another potential application of tmQMg is the transformation of the NatQG graphs into vector and string representations; e.g. autocorrelations97 and SELFIES,81 respectively.
The previous version of the dataset, tmQMg,71 did not provide the graphs and most of its quantum properties, including the geometry, were calculated with the semiempirical GFN2-xTB method. The update provided by tmQMg adds the quantum geometries and properties computed at the DFT PBE-D3BJ/def2-SVP//PBE0-D3BJ/def2-TZVP level. The two datasets can thus be combined to train Δ-ML98 models predicting xTB-to-DFT corrections. The tmQMg data is openly available at https://github.com/hkneiding/tmqmg.
Natural quantum graph neural networks
The u- and d-NatQG representations (Fig. 2 and 3) were used to predict quantum properties, including the HOMO–LUMO gap, polarizability, and dipole moment, by adapting the architectures of two different GNN models, both originally developed for applications to chemistry: (1) the message passing neural network (MPNN) of Gilmer and co-workers,86 and (2) the multiplex molecular graph neural network (MXMNet) of Xie and co-workers.99 A random 80:10:10 split of the tmQMg dataset was used for training, validation, and testing, respectively, including only connected graphs. The model hyperparameters, including the number of message passing iterations and the dimensionality of the embeddings, were optimized by combining a number of possible values. After considering parametric and non-parametric methods on a per-metal basis for six different quantum properties (i.e. HOMO–LUMO gap, polarizability, dipole moment, metal charge, HOMO energy, and LUMO energy), 2390 TMCs (3.9% of tmQMg) were excluded as outliers using the isolation forest algorithm.100 The ESI† provides further details on both the hyperparameters and the outlier detection methods.
For the MPNN models, we used the gated graph flavor, which includes a gated recurrent unit (GRU) to mitigate over-smoothing in message passing.86Fig. 7 shows the MPNN architecture used in this study, which, after embedding the node and edge attributes of the NatQG graphs, applies the GRU, and, in the readout layer, uses the set2set attention mechanism for pooling. We also experimented with the addition of a concatenation operation augmenting the set2set output with the whole-graph attribute vector before passing the final embedding to the prediction layer (MPNN⊕G model).
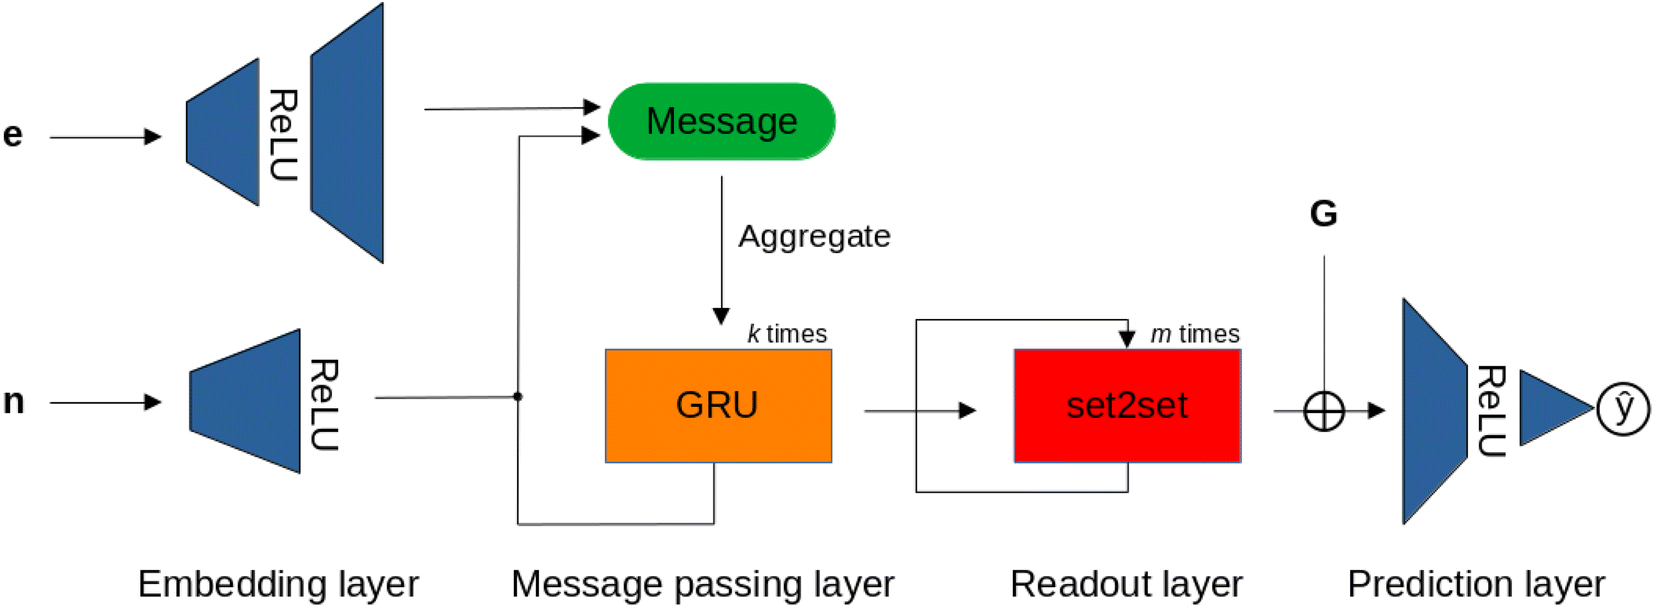 | ||
| Fig. 7 The MPNN architecture operating over the node (n), edge (e), and graph (G) attribute vectors of the u- and d-NatQG graphs (Fig. 2 and 3). ⊕ = concatenation. | ||
The MXMNet architecture encodes molecules as a multiplex graph including local and global representations in two separated layers. The local layer accounts mainly for covalent interactions and includes geometric information in the edges. In contrast, the global layer represents non-covalent interactions by connecting the atomic nodes within a cutoff distance of 10 Å. Besides standard message passing within each layer, a cross-layer mapping is used to exchange information between the two layers. Adding to the base implementation of Xie,99 in which the graphs were built and informed with a molecular mechanics force field, we developed an MXMNet model in which the NatQG graphs were used as the local layer.
The performance of the NatQG-based MPNN and MXMNet models on the test dataset was assessed using the metrics collected in Table 3 and the correlation plots shown in Fig. 8. In the prediction of the HOMO–LUMO gap, the u-NatQG MPNN achieved the highest accuracy with a MAE of 6.02 mHa and r2 = 0.910. This accuracy, in the milli-Hartree scale, appears to be remarkable given the complexity and diversity of the tmQMg dataset. The HOMO–LUMO gap is a key quantum property of TMCs related to stability and conductivity, which both have a strong impact on applications like catalysis and photovoltaic materials. The performance of the MXMNet models was poorer though they gave an interesting result; i.e. the u-NatQG and d-NatQG implementations achieved higher accuracies than the original base model based on molecular mechanics, showing the value of using electronic structure analysis data (here NBO) to define the topology and attributes of the graph.
| Architecture | Graph | HOMO–LUMO gap | Polarizability | Dipole moment | |||
|---|---|---|---|---|---|---|---|
| MAE | r 2 | MAE | r 2 | MAE | r 2 | ||
| MPNN | u-NatQG | 6.02 | 0.910 | 5.00 | 0.995 | 0.819 | 0.879 |
| d-NatQG | 7.22 | 0.873 | 5.17 | 0.993 | 1.019 | 0.835 | |
| MPNN⊕G | u-NatQG | 6.04 | 0.910 | 4.94 | 0.995 | 0.895 | 0.858 |
| d-NatQG | 7.19 | 0.877 | 4.96 | 0.994 | 0.981 | 0.845 | |
| MXMNet | Base | 9.36 | 0.778 | 4.83 | 0.994 | 0.943 | 0.805 |
| u-NatQG | 8.22 | 0.800 | 3.76 | 0.997 | 0.849 | 0.850 | |
| d-NatQG | 9.07 | 0.795 | 3.98 | 0.996 | 0.838 | 0.863 | |
| SchNet | CRG | 12.6 | 0.693 | 6.81 | 0.991 | 1.45 | 0.729 |
| EdgeUpdate | CRG | 10.2 | 0.785 | 5.67 | 0.993 | 1.13 | 0.696 |
| DimeNet++ | CRG | 10.3 | 0.789 | 5.37 | 0.994 | 1.28 | 0.759 |
| ALIGNN | CRG | 7.72 | 0.859 | 5.43 | 0.993 | 0.705 | 0.900 |
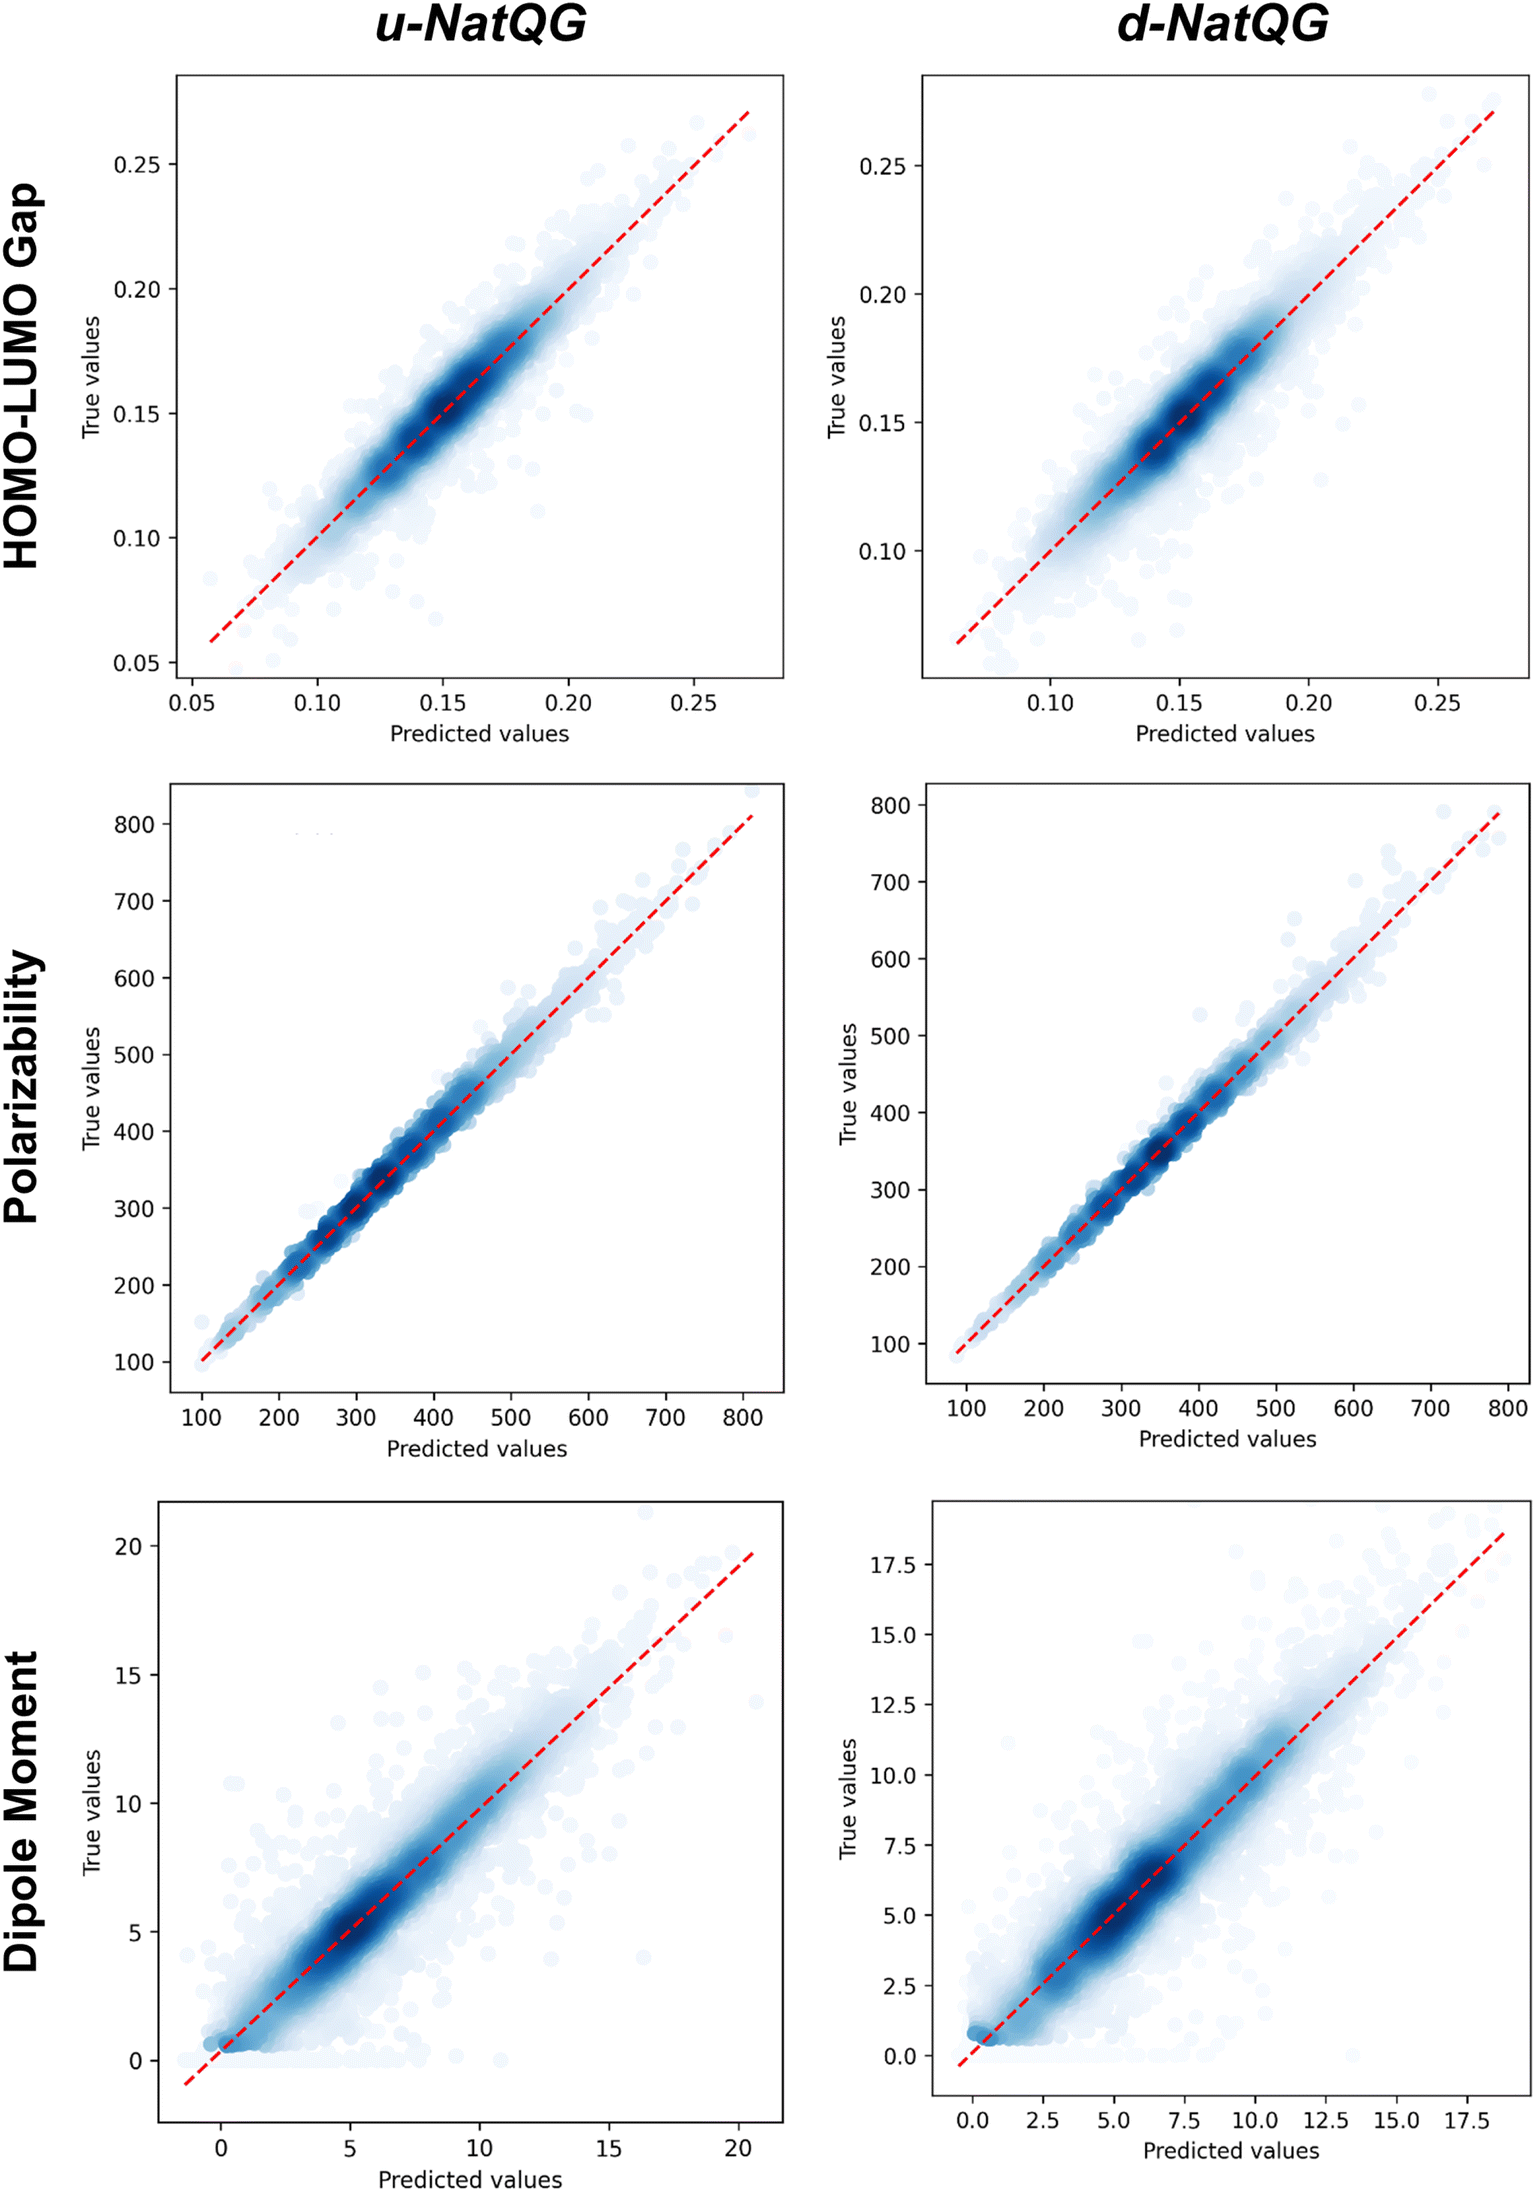 | ||
| Fig. 8 Correlation plots between the true values (i.e. DFT-computed) and the values predicted by the NatQG-based MPNN models. | ||
In contrast with the HOMO–LUMO gap, MXMNet made more accurate predictions for the polarizability and, based on the u-NatQG graph, yielded the lowest MAE of all models tested, with a value of 3.76 bohr3 (r2 = 0.997). With the best MPNN model, this MAE was larger (4.94 bohr3), though the r2 score remained high (0.995) due to the wide range and spread of the polarizability in the tmQMg dataset, compared to other popular datasets containing smaller organic molecules (e.g. QM9101). Regarding the dipole moment, both models yielded MAEs within the range of [0.819–1.019] D. An interesting result with MXMNet is that the base and the NatQG models gave very similar MAEs, with the latter being slightly smaller. This suggests that the partial loss of symmetry that may occur in some systems upon localizing the NBOs does not affect to a large extent the prediction of the dipole moment. Symmetry loss does not seem to have a strong impact on the MPNN models either, which yielded the second lowest MAE for the dipole moment (0.819 D).
GNN models based on cutoff radius graphs (CRG) derived from the atomic coordinates of the tmQMg dataset were also considered. In particular, the performance of the SchNet,102 SchNet with edge updates (EdgeUpdate),103 DimeNet++,104 and ALIGNN105 GNNs was assessed and compared to that of the MPNN and MXMNet. The advanced features of these models include continuous-filter convolutions (SchNet and EdgeUpdate), directional message passing with spherical harmonics (DimeNet++), and line graphs (ALIGNN). For all these four models, the CRG graphs were built with a topology based on a cutoff radius, informing the nodes with the atomic number and the edges with the interatomic distances. ALIGNN uses additional node attributes (e.g. group number and atomic volume) and geometric information (i.e. bond angles), which is also leveraged in DimeNet++. From the perspective of explainability, and in contrast with NatQG, these models are more difficult to relate to the chemical intuition around TMCs because the topology of the CRG graphs differs significantly from that of the skeletal formulae, and their attributes do not refer directly to the electronic structure descriptors used to rationalize the properties of TMCs. The metrics of Table 3 showed that, in general, the NatQG-based GNNs outperformed the CRG models with the exception of the dipole moment, for which ALIGNN gave the lowest MAE and largest r2 (0.705 D and 0.900, respectively).
The performance of the GNN models was also benchmarked against a baseline. The results obtained with the NatQG MPNN models, which were among the most accurate (Table 3), were compared to those obtained upon replacing all NBO data in the nodes and edges by generic properties. The (Z, T, S, χ) vector of properties, where Z = atomic number, T = valence (node degree), S = covalent radius, and χ = Pauling electronegativity, was used to attribute the nodes. These properties have been previously used to compute autocorrelation functions for TMCs.97 The edges were attributed with the (BO, d) vector, where BO = bond order and d = bond distance. Table 4 and Fig. 9 show the results obtained with this baseline representation, together with those of the u-NatQG and d-NatQG graphs. In addition to the HOMO–LUMO gap, polarizability, and dipole moment, the following quantum properties were also predicted: heat capacity, largest vibrational frequency, energies (HOMO, LUMO, electronic, dispersion, zero-point, enthalpy, entropy, and Gibbs), and thermodynamic correction (i.e. the difference between the Gibbs and potential energies). The latter correction, which is predicted with high accuracy (MAE = 1.06 mHa with u-NatQG), is relevant to the field of computational catalysis with TMCs, where it is often used to refine the energies.
| Property | Baseline | u-NatQG | d-NatQG | |||
|---|---|---|---|---|---|---|
| MAE | r 2 | MAE | r 2 | MAE | r 2 | |
| a Using linearly fitted atomic energy offsets. b At constant volume (i.e. Cv). c Difference between the Gibbs and potential energies. | ||||||
| HOMO–LUMO gap | 8.33 | 0.835 | 6.04 | 0.910 | 7.19 | 0.877 |
| Polarizability | 5.87 | 0.993 | 4.94 | 0.995 | 4.96 | 0.994 |
| Dipole moment | 1.71 | 0.537 | 0.895 | 0.858 | 0.981 | 0.845 |
| HOMO energy | 13.1 | 0.734 | 3.21 | 0.991 | 3.79 | 0.987 |
| LUMO energy | 13.0 | 0.722 | 3.51 | 0.988 | 4.05 | 0.984 |
| Electronic energya | 18.8 | 1.000 | 6.61 | 1.000 | 8.01 | 1.000 |
| Dispersion energya | 1.72 | 0.993 | 1.45 | 0.995 | 1.44 | 0.995 |
| Zero-point energya | 0.50 | 1.000 | 0.33 | 1.000 | 0.40 | 1.000 |
| Enthalpy energya | 16.8 | 1.000 | 6.39 | 1.000 | 7.64 | 1.000 |
| Heat capacityb | 0.25 | 1.000 | 0.18 | 1.000 | 0.22 | 1.000 |
| Entropy energy | 2.34 | 0.994 | 1.95 | 0.996 | 2.07 | 0.995 |
| Gibbs energya | 19.7 | 1.000 | 6.38 | 1.000 | 7.37 | 1.000 |
| Thermodynamic correctionsc | 1.36 | 1.000 | 1.06 | 1.000 | 1.23 | 1.000 |
| Largest vibrational freq. | 4.53 | 0.997 | 3.98 | 0.990 | 7.52 | 0.990 |
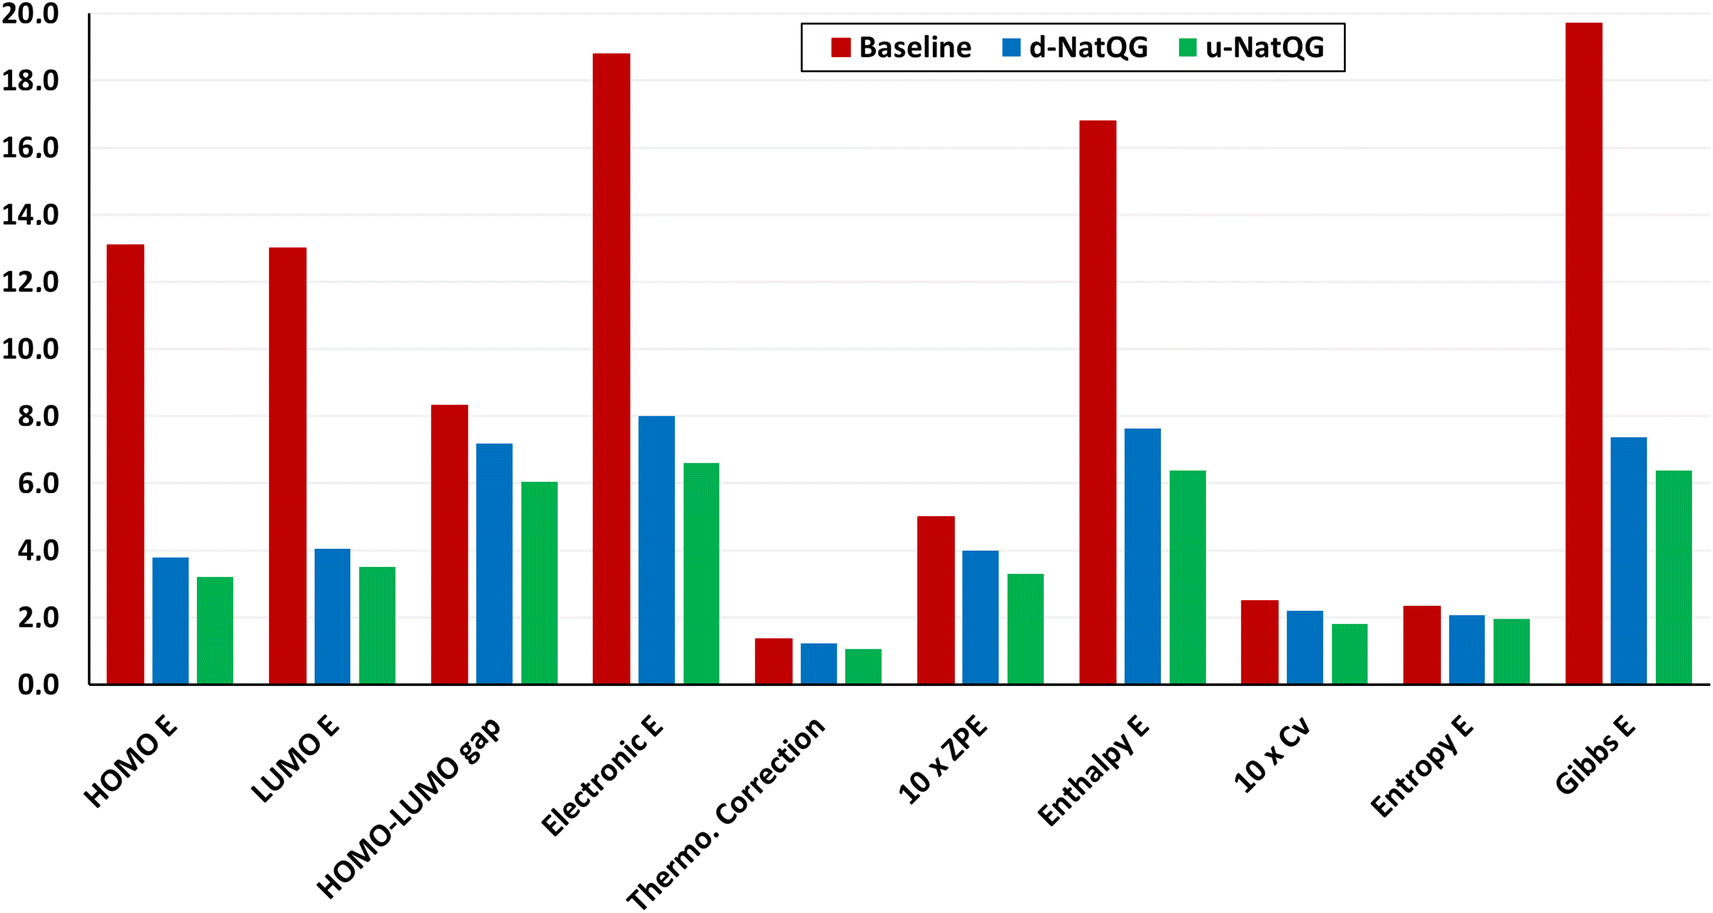 | ||
| Fig. 9 MAE values for the test dataset using the MPNN⊕G model based on the baseline, u-NatQG, and d-NatQG graphs. The units are mHa for all properties except the entropy and the heat capacity at constant volume (Cv), which are in cal mol−1 K, all in the same y-axis scale. E = energy, ZPE = zero-point energy. | ||
For all properties collected in Table 4, the NatQG MPNN models surpassed the accuracy of the baseline, showing the value of using the NBO data for attributing the graph nodes and edges. The only exception was the prediction of the largest vibrational frequency, for which the baseline was more accurate than d-NatQG but less accurate than u-NatQG. For some properties, including the zero-point and entropy energies, the baseline performed at a level similar to NatQG.
Interestingly, for the HOMO–LUMO gap, we observed the following changes in the performance of the model:


again with a stronger contribution of the electronic structure information, as shown by ΔMAEG = −0.56 versus ΔMAEES = −0.93 bohr3 for the polarizability, and ΔMAEG = −0.27 versus ΔMAEES = −0.82 D for the dipole moment.

Another factor contributing to these observations can be the smaller difference between the input and the embedding dimensions, which is 90 for the u-NatQG representation and 123 for baseline – d.
In general, regardless of the property predicted, the models based on the undirected graphs outperformed the directed, which are also more computationally demanding because they contain more edges. The concatenation of the whole-graph attribute vector in the last layer of the MPNN⊕G model improved the results obtained with d-NatQG (Table 3). Further, for the training set, the best performance in the prediction of several properties was obtained with the directed graphs, which thus seem to have a lower generalization capacity (Tables S3 and S4†). However, in most cases, the MAE and r2 values obtained for both graph types were rather similar. The unusual topology of d-NatQG can exclude edges where chemical bonds are present (e.g. Pt–C bonds in Fig. 3), though it retains the fundamental interactions within TMCs (e.g. d → π* backdonation). The remarkable performance of d-NatQG in the GNN models shows the promise of directed graph representations expressing donor–acceptor interactions.
Conclusions
The present work showed how the NBO analysis of TMCs can be used to define NatQG graphs encoding both geometric and electronic structure information. The NatQG graphs enabled the optimization of GNN models for the accurate prediction of the quantum properties of TMCs. These models will contribute to the development of new TMCs, which can play a key role in several fields of high interest, including catalysis, nanomaterials, medicinal chemistry, and renewable energies.With the HyDGL program, the NatQG graphs can be easily built from NBO data, which is used to define both the topology and the attribute vectors. The graphs can be made either undirected (u-NatQG), like a conventional molecular graph, or directed (d-NatQG), for expressing donor–acceptor interactions. Both flavors are infused with electronic structure information that can be directly related to the textbook concepts used to rationalize the structure and reactivity of TMCs.
The NatQG graphs were used to optimize GNN models based on the MPNN and MXMNet architectures. These models predicted several quantum properties of TMCs with remarkable accuracy, including the HOMO–LUMO gap and the polarizability, outperforming other models based on different topologies (CRG graphs) and attributes (periodic table properties). Interestingly, numerical experiments showed that the electronic structure information boosted the models performance by an extent larger than the geometric information. Despite its unusual connectivity, the d-NatQG representation performed at a level similar to u-NatQG, showing the promise of directed donor–acceptor graphs in deep learning.
The results obtained with the NatQG GNNs will be a useful baseline for the development of machine learning models for complex molecular systems. These models can be also applied to the prediction of thermodynamic and kinetic parameters of chemical reactions catalyzed by TMCs https://doi.org/10.48550/arXiv.2011.14115. Further, the tmQMg dataset will be a valuable benchmark for future studies exploring deep graph learning for TMCs.
Data availability
The graphs reported in this study were generated with the HyDGL program, which is openly available at https://github.com/hkneiding/HyDGL. The code has a modular structure that can be easily modified to generate other graph types for any molecular system. The tmQMg dataset is also openly available at the URL https://github.com/hkneiding/tmqmg, which provides access to the NatQG and baseline graphs, outliers, xyz geometries, csv-formatted properties and targets of all TMCs, and the code of the GNN models.Author contributions
H. K. was the main developer of the NatQG graphs, MPNN models, and HyDGL code. R. L. developed the MXMNet model and the GNNs based on CRG graphs. L. L. worked on the linear fitting of the atomic energies. H. K., R. L., L. L., S. R., T. B. P., R. d. B, and D. B. made substantial contributions to the conception and design of the work. D. B. computed the tmQMg dataset and was the main contributor to the writing and revision of the manuscript, and the main developer of the core concept of the research project, including its design and supervision.Conflicts of interest
There are no conflicts of interest to declare.Acknowledgements
H. K. and L. L. acknowledge the support from the European Union's Horizon 2020 research and innovation program under the Marie Skłodowska-Curie grant agreements No. 945371 (H. K.) and 101025672 (L. L.). This article reflects only the authors' view and the REA is not responsible for any use that may be made of the information it contains. D. B. acknowledges the support from the Research Council of Norway through its FRIPRO (catLEGOS project; number 325003) and Centers of Excellence (Hylleraas Centre; project number 262695) programs, and the Norwegian Supercomputing Program (NOTUR; project number NN4654K). We thank Asier Urriolabeitia, Katrin Gugeler, and Lucía Morán for helpful discussions and Kjell Jorner for reviewing a preliminary version of this manuscript.References
- H. Chen, O. Engkvist, Y. Wang, M. Olivecrona and T. Blaschke, The Rise of Deep Learning in Drug Discovery, Drug Discovery Today, 2018, 23, 1241–1250 CrossRef PubMed.
- J. S. Smith, A. E. Roitberg and O. Isayev, Transforming Computational Drug Discovery with Machine Learning and AI, ACS Med. Chem. Lett., 2018, 9, 1065–1069 CrossRef CAS PubMed.
- H. Altae-Tran, B. Ramsundar, A. S. Pappu and V. Pande, Low Data Drug Discovery with One-Shot Learning, ACS Cent. Sci., 2017, 3, 283–293 CrossRef CAS PubMed.
- J. Vamathevan, D. Clark, P. Czodrowski, I. Dunham, E. Ferran, G. Lee, B. Li, A. Madabhushi, P. Shah, M. Spitzer and S. Zhao, Applications of machine learning in drug discovery and development, Nat. Rev. Drug Discovery, 2019, 18, 463–477 CrossRef CAS PubMed.
- K. T. Butler, D. W. Davies, H. Cartwright, O. Isayev and A. Walsh, Machine Learning for Molecular and Materials Science, Nature, 2018, 559, 547–555 CrossRef CAS PubMed.
- R. Olivares-Amaya, C. Amador-Bedolla, J. Hachmann, S. Atahan-Evrenk, R. S. Sanchez-Carrera, L. Vogt and A. Aspuru-Guzik, Accelerated computational discovery of high-performance materials for organic photovoltaics by means of cheminformatics, Energy Environ. Sci., 2011, 4, 4849–4861 RSC.
- T. Rahman, E. Petrus, M. Segado, N. P. Martin, L. N. Palys, M. A. Rambaran, C. A. Ohlin, C. Bo and M. Nyman, Predicting the Solubility of Inorganic Ions Pairs in Water, Angew. Chem., Int. Ed., 2022, 61, e202117839 CAS.
- F. Dattila, R. R. Seemakurthi, Y. Zhou and N. Lopez, Modeling Operando Electrochemical CO2 Reduction, Chem. Rev., 2022, 122, 11085–11130 CrossRef CAS PubMed.
- P. C. Jennings, S. Lysgaard, J. S. Hummelshoj, T. Vegge and T. Bligaard, Genetic algorithms for computational materials discovery accelerated by machine learning, npj Comput. Mater., 2019, 5, 46 CrossRef.
- A. S. Rosen, S. M. Iyer, D. Ray, Z. Yao, A. Aspuru-Guzik, L. Gagliardi, J. M. Notestein and R. Q. Snurr, Machine learning the quantum-chemical properties of metal-organic frameworks for accelerated materials discovery, Matter, 2021, 4, 1578–1597 CrossRef CAS.
- B. J. Bucior, N. S. Bobbitt, T. Islamoglu, S. Goswami, A. Gopalan, T. Yildirim, O. K. Farha, N. Bagheri and R. Q. Snurr, Energy-based descriptors to rapidly predict hydrogen storage in metal-organic frameworks, Mol. Syst. Des. Eng., 2019, 4, 162–174 RSC.
- S. M. Moosavi, A. Nandy, K. M. Jablonka, D. Ongari, J. P. Janet, P. G. Boyd, Y. Lee, B. Smit and H. J. Kulik, Understanding the diversity of the metal-organic framework ecosystem, Nat. Commun., 2020, 11, 4068 CrossRef CAS PubMed.
- V. L. Deringer, A. P. Bartok, N. Bernstein, D. M. Wilkins, M. Ceriotti and G. Csanyi, Gaussian Process Regression for Materials and Molecules, Chem. Rev., 2021, 121, 10073–10141 CrossRef CAS PubMed.
- F. Musil, A. Grisafi, A. P. Bartok, C. Ortner, G. Csanyi and M. Ceriotti, Physics-Inspired Structural Representations for Molecules and Materials, Chem. Rev., 2021, 121, 9759–9815 CrossRef CAS PubMed.
- E. Ren, P. Guilbaud and F.-X. Coudert, High-throughput computational screening of nanoporous materials in targeted applications, Digital Discovery, 2022, 1, 355–374 RSC.
- F. A. Faber, L. Hutchison, B. Huang, J. Gilmer, S. S. Schoenholz, G. E. Dahl, O. Vinyals, S. Kearnes, P. F. Riley and O. A. von Lilienfeld, Prediction Errors of Molecular Machine Learning Models Lower than Hybrid DFT Error, J. Chem. Theory Comput., 2017, 13, 5255–5264 CrossRef CAS PubMed.
- J. S. Smith, B. T. Nebgen, R. Zubatyuk, N. Lubbers, C. Devereux, K. Barros, S. Tretiak, O. Isayev and A. E. Roitberg, Approaching coupled cluster accuracy with a general-purpose neural network potential through transfer learning, Nat. Commun., 2019, 10, 2903 CrossRef PubMed.
- P. Friederich, F. Hase, J. Proppe and A. Aspuru-Guzik, Machine-learned potentials for next-generation matter simulations, Nat. Mater., 2021, 20, 750–761 CrossRef CAS PubMed.
- A. Grisafi, A. Fabrizio, B. Meyer, D. M. Wilkins, C. Corminboeuf and M. Ceriotti, Transferable Machine-Learning Model of the Electron Density, ACS Cent. Sci., 2019, 5, 57–64 CrossRef CAS PubMed.
- S. Amabilino, L. A. Bratholm, S. J. Bennie, A. C. VaucherM, M. Reiher and D. R. Glowacki, Training Neural Nets To Learn Reactive Potential Energy Surfaces Using Interactive Quantum Chemistry in Virtual Reality, J. Phys. Chem. A, 2019, 123, 4486–4499 CrossRef CAS PubMed.
- K. Jorner, A. Tomberg, C. Bauer, C. Skold and P.-O. Norrby, Organic reactivity from mechanism to machine learning, Nat. Rev. Chem., 2021, 5, 240–255 CrossRef CAS.
- K. Jorner, T. Brinck, P.-O. Norrby and D. Buttar, Machine learning meets mechanistic modelling for accurate prediction of experimental activation energies, Chem. Sci., 2021, 12, 1163–1175 RSC.
- J. Wellendorff, K. T. Lundgaard, A. Mogelhoj, V. Petzold, D. D. Landis, J. K. Norskov, T. Bligaard and K. W. Jacobsen, Density functionals for surface science: Exchange-correlation model development with Bayesian error estimation, Phys. Rev. B: Condens. Matter Mater. Phys., 2012, 85, 235149 CrossRef.
- M. Rupp, A. Tkatchenko, K.-R. Mueller and O. A. von Lilienfeld, Fast and Accurate Modeling of Molecular Atomization Energies with Machine Learning, Phys. Rev. Lett., 2012, 108, 058301 CrossRef PubMed.
- K. Hansen, F. Biegler, R. Ramakrishnan, W. Pronobis, O. A. von Lilienfeld, K.-R. Mueller and A. Tkatchenko, Machine Learning Predictions of Molecular Properties: Accurate Many-Body Potentials and Nonlocality in Chemical Space, J. Phys. Chem. Lett., 2015, 6, 2326–2331 CrossRef CAS PubMed.
- C. Duan, J. P. Janet, F. Liu, A. Nandy and H. J. Kulik, Learning from Failure: Predicting Electronic Structure Calculation Outcomes with Machine Learning Models, J. Chem. Theory Comput., 2019, 15, 2331–2345 CrossRef CAS PubMed.
- F. Liu, C. Duan and H. J. Kulik, Rapid Detection of Strong Correlation with Machine Learning for Transition-Metal Complex High-Throughput Screening, J. Phys. Chem. Lett., 2020, 11, 8067–8076 CrossRef CAS PubMed.
- F. Brockherde, L. Vogt, L. Li, M. E. Tuckerman, K. Burke and K.-R. Mueller, Bypassing the Kohn-Sham equations with machine learning, Nat. Commun., 2017, 8, 872 CrossRef PubMed.
- J. Kirkpatrick, et al., Pushing the frontiers of density functionals by solving the fractional electron problem, Science, 2021, 374, 1385–1389 CrossRef CAS PubMed.
- J. Westermayr and P. Marquetand, Machine Learning for Electronically Excited States of Molecules, Chem. Rev., 2021, 121, 9873–9926 CrossRef CAS PubMed.
- J. A. Keith, V. Vassilev-Galindo, B. Cheng, S. Chmiela, M. Gastegger, K.-R. Mueller and A. Tkatchenko, Combining Machine Learning and Computational Chemistry for Predictive Insights Into Chemical Systems, Chem. Rev., 2021, 121, 9816–9872 CrossRef CAS PubMed.
- A. Glielmo, B. E. Husic, A. Rodriguez, C. Clementi, F. Noe and A. Laio, Unsupervised Learning Methods for Molecular Simulation Data, Chem. Rev., 2021, 121, 9722–9758 CrossRef CAS PubMed.
- M. Balodis, M. Cordova, A. Hofstetter, G. M. Day and L. Emsley, De Novo Crystal Structure Determination from Machine Learned Chemical Shifts, J. Am. Chem. Soc., 2022, 144, 7215–7223 CrossRef CAS PubMed.
- C. W. Coley, W. H. Green and K. F. Jensen, Machine Learning in Computer-Aided Synthesis Planning, Acc. Chem. Res., 2018, 51, 1281–1289 CrossRef CAS PubMed.
- S. M. Kearnes, M. R. Maser, M. Wleklinski, A. Kast, A. G. Doyle, S. D. Dreher, J. M. Hawkins, K. F. Jensen and C. W. Coley, The Open Reaction Database, J. Am. Chem. Soc., 2021, 143, 18820–18826 CrossRef CAS PubMed.
- J. M. Granda, L. Donina, V. Dragone, D.-L. Long and L. Cronin, Controlling an Organic Synthesis Robot with Machine Learning to Search for New Reactivity, Nature, 2018, 559, 377–381 CrossRef CAS PubMed.
- S. Szymkuc, E. P. Gajewska, T. Klucznik, K. Molga, P. Dittwald, M. Startek, M. Bajczyk and B. A. Grzybowski, Computer-Assisted Synthetic Planning: The End of the Beginning, Angew. Chem., Int. Ed., 2016, 55, 5904–5937 CrossRef CAS PubMed.
- B. Huang and O. A. von Lilienfeld, Ab Initio Machine Learning in Chemical Compound Space, Chem. Rev., 2021, 121, 10001–10036 CrossRef CAS PubMed.
- J. Jumper, et al., Highly accurate protein structure prediction with AlphaFold, Nature, 2021, 596, 583–589 CrossRef CAS PubMed.
- K. S. Lim, A. G. Reidenbach, B. K. Hua, J. W. Mason, C. J. Gerry, P. A. Clemons and C. W. Coley, Machine Learning on DNA-Encoded Library Count Data Using an Uncertainty-Aware Probabilistic Loss Function, J. Chem. Inf. Model., 2022, 62, 2316–2331 CrossRef CAS PubMed.
- J. R. Kitchin, Machine Learning in Catalysis, Nat. Catal., 2018, 1, 230–232 CrossRef.
- G. d. P. Gomes, R. Pollice and A. Aspuru-Guzik, Navigating through the Maze of Homogeneous Catalyst Design with Machine Learning, Trends Chem., 2021, 3, 96–110 CrossRef.
- B. Meyer, B. Sawatlon, S. Heinen, O. A. von Lilienfeld and C. Corminboeuf, Machine learning meets volcano plots: computational discovery of cross-coupling catalysts, Chem. Sci., 2018, 9, 7069–7077 RSC.
- S. Gallarati, R. Fabregat, R. Laplaza, S. Bhattacharjee, M. D. Wodrich and C. Corminboeuf, Reaction-based machine learning representations for predicting the enantioselectivity of organocatalysts, Chem. Sci., 2021, 12, 6879–6889 RSC.
- M. Cordova, M. D. Wodrich, B. Meyer, B. Sawatlon and C. Corminboeuf, Data-Driven Advancement of Homogeneous Nickel Catalyst Activity for Aryl Ether Cleavage, ACS Catal., 2020, 10, 7021–7031 CrossRef CAS.
- M. Foscato and V. R. Jensen, Automated in Silico Design of Homogeneous Catalysts, ACS Catal., 2020, 10, 2354–2377 CrossRef CAS.
- Z. W. Ulissi, A. J. Medford, T. Bligaard and J. K. Norskov, To address surface reaction network complexity using scaling relations machine learning and DFT calculations, Nat. Commun., 2017, 8, 14621 CrossRef PubMed.
- Z. W. Ulissi, M. T. Tang, J. Xiao, X. Liu, D. A. Torelli, M. Karamad, K. Cummins, C. Hahn, N. S. Lewis, T. F. Jaramillo, K. Chan and J. K. Norskov, Machine-Learning Methods Enable Exhaustive Searches for Active Bimetallic Facets and Reveal Active Site Motifs for CO2 Reduction, ACS Catal., 2017, 7, 6600–6608 CrossRef CAS.
- T. Gensch, G. d. P. Gomes, P. Friederich, E. Peters, T. Gaudin, R. Pollice, K. Jorner, A. Nigam, M. Lindner-D’Addario, M. S. Sigman and A. Aspuru-Guzik, A Comprehensive Discovery Platform for Organophosphorus Ligands for Catalysis, J. Am. Chem. Soc., 2022, 144, 1205–1217 CrossRef CAS PubMed.
- Y. Yang, M. Liu and J. R. Kitchin, Neural network embeddings based similarity search method for atomistic systems, Digital Discovery, 2022, 1, 636–644 RSC.
- D. P. Tabor, L. M. Roch, S. K. Saikin, C. Kreisbeck, D. Sheberla, J. H. Montoya, S. Dwaraknath, M. Aykol, C. Ortiz, H. Tribukait, C. Amador-Bedolla, C. J. Brabec, B. Maruyama, K. A. Persson and A. Aspuru-Guzik, Accelerating the discovery of materials for clean energy in the era of smart automation, Nat. Rev. Mater., 2018, 3, 5–20 CrossRef CAS.
- S. S. V. Sowndarya, J. N. Law, C. E. Tripp, D. Duplyakin, E. Skordilis, D. Biagioni, R. S. Paton and P. C. St John, Multi-objective goal-directed optimization of de novo stable organic radicals for aqueous redox flow batteries, Nat. Mach. Intell., 2022, 4, 720–730 CrossRef.
- L. C. Gallegos, G. Luchini, P. C. St John, S. Kim and R. S. Paton, Importance of Engineered and Learned Molecular Representations in Predicting Organic Reactivity, Selectivity, and Chemical Properties, Acc. Chem. Res., 2021, 54, 827–836 CrossRef CAS PubMed.
- F. Scarselli, M. Gori, A. C. Tsoi, M. Hagenbuchner and G. Monfardini, The Graph Neural Network Model, IEEE Trans. Neural Network., 2008, 20, 61–80 Search PubMed.
- A. C. Mater and M. L. Coote, Deep Learning in Chemistry, J. Chem. Inf. Model., 2019, 59, 2545–2559 CrossRef CAS PubMed.
- F. Hase, I. F. Galvan, A. Aspuru-Guzik, R. Lindh and M. Vacher, How machine learning can assist the interpretation of ab initio molecular dynamics simulations and conceptual understanding of chemistry, Chem. Sci., 2019, 10, 2298–2307 RSC.
- P. Friederich, M. Krenn, I. Tamblyn and A. Aspuru-Guzik, Scientific intuition inspired by machine learning-generated hypotheses, Mach. Learn.: Sci. Technol., 2021, 2, 025027 Search PubMed.
- K. T. Schütt, F. Arbabzadah, S. Chmiela, K. R. Müller and A. Tkatchenko, Quantum-Chemical Insights from Deep Tensor Neural Networks, Nat. Commun., 2017, 8, 13890 CrossRef PubMed.
- G. P. Wellawatte, A. Seshadri and A. D. White, Model agnostic generation of counterfactual explanations for molecules, Chem. Sci., 2022, 13, 3697–3705 RSC.
- J. Jiménez-Luna, F. Grisoni and G. Schneider, Drug discovery with explainable artificial intelligence, Nat. Mach. Intell., 2020, 2, 573–584 CrossRef.
- J. Jiménez-Luna, M. Skalic, N. Weskamp and G. Schneider, Coloring Molecules with Explainable Artificial Intelligence for Preclinical Relevance Assessment, J. Chem. Inf. Model., 2021, 61, 1083–1094 CrossRef PubMed.
- T. Schnake, O. Eberle, J. Lederer, S. Nakajima, K. T. Schütt, K.-R. Müller and G. Montavon, Higher-Order Explanations of Graph Neural Networks via Relevant Walks, IEEE Trans. Pattern Anal. Mach. Intell., 2022, 44, 7581–7596 Search PubMed.
- N. W. A. Gebauer, M. Gastegger, S. S. P. Hessmann, K.-R. Müller and K. T. Schütt, Inverse Design of 3d Molecular Structures with Conditional Generative Neural Networks, Nat. Commun., 2022, 13, 973 CrossRef CAS PubMed.
- J. H. Jensen, A graph-based genetic algorithm and generative model/Monte Carlo tree search for the exploration of chemical space, Chem. Sci., 2019, 10, 3567–3572 RSC.
- M. Foscato, V. Venkatraman and V. R. Jensen, DENOPTIM: Software for Computational de Novo Design of Organic and Inorganic Molecules, J. Chem. Inf. Model., 2019, 59, 4077–4082 CrossRef CAS PubMed.
- K. Nicolaou, P. Bulger and D. Sarlah, Palladium-catalyzed cross-coupling reactions in total synthesis, Angew. Chem., Int. Ed., 2005, 44, 4442–4489 CrossRef CAS PubMed.
- Q. H. Wang, K. Kalantar-Zadeh, A. Kis, J. N. Coleman and M. S. Strano, Electronics and optoelectronics of two-dimensional transition metal dichalcogenides, Nat. Nanotechnol., 2012, 7, 699–712 CrossRef CAS PubMed.
- H.-K. Liu and P. J. Sadler, Metal Complexes as DNA Intercalators, Acc. Chem. Res., 2011, 44, 349–359 CrossRef CAS PubMed.
- K. Kalyanasundaram and M. Gratzel, Applications of functionalized transition metal complexes in photonic and optoelectronic devices, Coord. Chem. Rev., 1998, 177, 347–414 CrossRef CAS.
- P. Friederich, G. dos Passos Gomes, R. De Bin, A. Aspuru-Guzik and D. Balcells, Machine Learning Dihydrogen Activation in the Chemical Space Surrounding Vaska's complex, Chem. Sci., 2020, 11, 4584–4601 RSC.
- D. Balcells and B. B. Skjelstad, tmQM Dataset-Quantum Geometries and Properties of 86k Transition Metal Complexes, J. Chem. Inf. Model., 2020, 60, 6135–6146 CrossRef CAS PubMed.
- N. Fey, Lost in chemical space? Maps to support organometallic catalysis, Chem. Cent. J., 2015, 9, 38 CrossRef PubMed.
- D. J. Durand and N. Fey, Computational Ligand Descriptors for Catalyst Design, Chem. Rev., 2019, 119, 6561–6594 CrossRef CAS PubMed.
- M. Steiner and M. Reiher, Autonomous Reaction Network Exploration in Homogeneous and Heterogeneous Catalysis, Top. Catal., 2022, 65, 6–39 CrossRef CAS PubMed.
- O. Lakuntza, M. Besora and F. Maseras, Searching for Hidden Descriptors in the Metal-Ligand Bond through Statistical Analysis of Density Functional Theory (DFT) Results, Inorg. Chem., 2018, 57, 14660–14670 CrossRef CAS PubMed.
- R. C. Cammarota, W. Liu, J. Bacsa, H. M. L. Davies and M. S. Sigman, Mechanistically Guided Workflow for Relating Complex Reactive Site Topologies to Catalyst Performance in C-H Functionalization Reactions, J. Am. Chem. Soc., 2022, 144, 1881–1898 CrossRef CAS PubMed.
- J. P. Janet and H. J. Kulik, Predicting electronic structure properties of transition metal complexes with neural networks, Chem. Sci., 2017, 8, 5137–5152 RSC.
- J. P. Janet, S. Ramesh, C. Duan and H. J. Kulik, Accurate Multiobjective Design in a Space of Millions of Transition Metal Complexes with Neural-Network-Driven Efficient Global Optimization, ACS Cent. Sci., 2020, 6, 513–524 CrossRef CAS PubMed.
- A. Nandy, C. Duan, M. G. Taylor, F. Liu, A. H. Steeves and H. J. Kulik, Computational Discovery of Transition-metal Complexes: From High-throughput Screening to Machine Learning, Chem. Rev., 2021, 121, 9927–10000 CrossRef CAS PubMed.
- D. Weininger, SMILES, a Chemical Language and Information System. 1. Introduction to Methodology and Encoding Rules, J. Chem. Inf. Comput. Sci., 1988, 28, 31–36 CrossRef CAS.
- M. Krenn, F. Hase, A. K. Nigam, P. Friederich and A. Aspuru-Guzik, Self-referencing embedded strings (SELFIES): A 100% robust molecular string representation, Mach. Learn.: Sci. Technol., 2020, 1, 045024 Search PubMed.
- W. C. Zeise, Ann. Phys., 1831, 21, 497–541 CrossRef.
- K. Atz, F. Grisoni and G. Schneider, Geometric Deep Learning on Molecular Representations, Nat. Mach. Intell., 2021, 3, 1023–1032 CrossRef.
- T. Stuyver and C. W. Coley, Quantum chemistry-augmented neural networks for reactivity prediction: Performance, generalizability, and explainability, J. Chem. Phys., 2022, 156, 084104 CrossRef CAS PubMed.
- Y. Guan, C. W. Coley, H. Wu, D. Ranasinghe, E. Heid, T. J. Struble, L. Pattanaik, W. H. Green and K. F. Jensen, Regio-selectivity prediction with a machine-learned reaction representation and on-the-fly quantum mechanical descriptors, Chem. Sci., 2021, 12, 2198–2208 RSC.
- J. Gilmer, S. S. Schoenholz, P. F. Riley, O. Vinyals and G. E. Dahl, Neural Message Passing for Quantum Chemistry, Proc. Mach. Learn. Res., 2017, 70, 1263–1272 Search PubMed.
- E. D. Glendening, C. R. Landis and F. Weinhold, Natural bond orbital methods, Wiley Interdiscip. Rev.: Comput. Mol. Sci., 2012, 2, 1–42 CAS.
- X. Lu, J. Duchimaza-Heredia and Q. Cui, Analysis of Density Functional Tight Binding with Natural Bonding Orbitals, J. Phys. Chem. A, 2019, 123, 7439–7453 CrossRef CAS PubMed.
- D. Boiko, T. Reschützegger, B. Sanchez-Lengeling, S. Blau and G. D. P. Gomes, Stereoelectronics-Aware Molecular Representation Learning, ChemRxiv, 2022, preprint, DOI:10.26434/chemrxiv-2022-nz4pc.
- A. Dietz, Yet Another Representation of Molecular Structure, J. Chem. Inf. Comput. Sci., 1995, 35, 787–802 CrossRef CAS.
- A. M. Clark, Accurate Specification of Molecular Structures: The Case for Zero-Order Bonds and Explicit Hydrogen Counting, J. Chem. Inf. Model., 2011, 51, 3149–3157 CrossRef CAS PubMed.
- J. P. Perdew, K. Burke and M. Ernzerhof, Generalized gradient approximation made simple, Phys. Rev. Lett., 1996, 77, 3865–3868 CrossRef CAS PubMed.
- S. Grimme, S. Ehrlich and L. Goerigk, Effect of the damping function in dispersion corrected density functional theory, J. Comput. Chem., 2011, 32, 1456–1465 CrossRef CAS PubMed.
- F. Weigend and R. Ahlrichs, Balanced basis sets of split valence, triple zeta valence and quadruple zeta valence quality for H to Rn: Design and assessment of accuracy, Phys. Chem. Chem. Phys., 2005, 7, 3297–3305 RSC.
- C. Adamo and V. Barone, Toward reliable density functional methods without adjustable parameters: The PBE0 model, J. Chem. Phys., 1999, 110, 6158–6169 CrossRef CAS.
- C. W. Coley, R. Barzilay, W. H. Green, T. S. Jaakkola and K. F. Jensen, Convolutional Embedding of Attributed Molecular Graphs for Physical Property Prediction, J. Chem. Inf. Model., 2017, 57, 1757–1772 CrossRef CAS PubMed.
- J. P. Janet and H. J. Kulik, Resolving Transition Metal Chemical Space: Feature Selection for Machine Learning and Structure–Property Relationships, J. Phys. Chem. A, 2017, 121, 8939–8954 CrossRef CAS PubMed.
- R. Ramakrishnan, P. O. Dral, M. Rupp and O. A. von Lilienfeld, Big Data Meets Quantum Chemistry Approximations: The Delta-Machine Learning Approach, J. Chem. Theory Comput., 2015, 11, 2087–2096 CrossRef CAS PubMed.
- S. Zhang, Y. Liu and L. Xie, Molecular mechanics-driven graph neural network with multiplex graph for molecular structures, arXiv, 2020, preprint, arXiv:2011.07457, DOI:10.48550/arXiv.2011.07457.
- F. T. Liu, K. M. Ting and Z.-H. Zhou, Isolation Forest, IEEE International Conference on Data Mining, 8th edn, 2008, DOI:10.1109/ICDM.2008.17.
- R. Ramakrishnan, P. O. Dral, M. Rupp and O. A. von Lilienfeld, Quantum Chemistry Structures and Properties of 134 Kilo Molecules, Sci. Data, 2014, 140022 CrossRef CAS PubMed.
- K. T. Schütt, H. E. Sauceda, P.-J. Kindermans, A. Tkatchenko and K.-R. Müller, Schnet–a deep learning architecture for molecules and materials, J. Chem. Phys., 2018, 148, 241722 CrossRef PubMed.
- P. B. Jørgensen, K. W. Jacobsen and M. N. Schmidt, Neural message passing with edge updates for predicting properties of molecules and materials, arXiv, 2018, preprint, arXiv:1806.03146, DOI:10.48550/arXiv.1806.03146.
- J. Klicpera, S. Giri, J. T. Margraf and S. Günnemann, Fast and uncertainty-aware directional message passing for non-equilibrium molecules, arXiv, 2020, preprint, arXiv:2011.14115, DOI:10.48550/arXiv.2011.14115.
- K. Choudhary and B. DeCost, Atomistic Line Graph Neural Network for improved materials property predictions, npj Comput. Mater., 2021, 7, 1–8 CrossRef.
Footnote |
| † Electronic supplementary information (ESI) available: Further information on the statistics of the tmQMg dataset and its outliers. Technical details of the GNN models, the baseline representation, and the linear fitting of the atomic energies used to predict energy targets. The error metrics obtained with the training dataset, the Python libraries used to develop the HyDGL code, and the computational details of the tmQMg dataset are also provided. See DOI: https://doi.org/10.1039/d2dd00129b |
| This journal is © The Royal Society of Chemistry 2023 |