 Open Access Article
Creative Commons Attribution 3.0 Unported Licence
Conversion of La2Ti2O7 to LaTiO2N via ammonolysis: a first-principles investigation†
Chiara
Ricca
ab,
Tristan
Blandenier
a,
Valérie
Werner
 c,
Xing
Wang
a,
Simone
Pokrant
 c and
Ulrich
Aschauer
 *abc
*abc
aDepartment of Chemistry and Biochemistry, University of Bern, Freiestrasse 3, CH-3012 Bern, Switzerland
bNational Centre for Computational Design and Discovery of Novel Materials (MARVEL), 1015 Lausanne, Switzerland
cDepartment of Chemistry and Physics of Materials, University of Salzburg, Jakob-Haringer-Str. 2A, A-5020 Salzburg, Austria. E-mail: ulrich.aschauer@plus.ac.at
First published on 21st July 2023
Abstract
Perovskite oxynitrides are, due to their reduced band gap compared to oxides, promising materials for photocatalytic applications. They are most commonly synthesized from {110} layered Carpy-Galy (A2B2O7) perovskites via thermal ammonolysis, i.e. the exposure to a flow of ammonia at elevated temperature. The conversion of the layered oxide to the non-layered oxynitride must involve a complex combination of nitrogen incorporation, oxygen removal and ultimately structural transition by elimination of the interlayer shear plane. Despite the process being commonly used, little is known about the microscopic mechanisms and hence factors that could ease the conversion. Here we aim to derive such insights via density functional theory calculations of the defect chemistry of the oxide and the oxynitride as well as the oxide's surface chemistry. Our results point to the crucial role of surface oxygen vacancies in forming clusters of NH3 decomposition products and in incorporating N, most favorably substitutionally at the anion site. N then spontaneously diffuses away from the surface, more easily parallel to the surface and in interlayer regions, while diffusion perpendicular to the interlayer plane is somewhat slower. Once incorporation and diffusion lead to a local N concentration of about 70% of the stoichiometric oxynitride composition, the nitridated oxide spontaneously transforms to a nitrogen-deficient oxynitride. Since anion vacancies are crucial for the nitrogen incorporation and diffusion as well as the transformation process, their concentration in the precursor oxide is a relevant tuning parameter to optimize the oxynitride's synthesis and properties.
1 Introduction
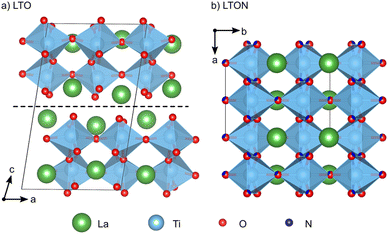
Perovskite oxynitrides are promising photocatalysts, since their band structure is well-suited to both absorb solar light and drive the water-splitting redox reactions.1–4 These materials can exist as nitrogen-rich ABN2O or nitrogen-poor ABNO2 compositions, the latter generally being more active in photocatalytic applications.1 While the A and B cations could, in principle, be selected from a large part of the periodic table,5 the compositions most popular in photocatalysis have Nb5+, Ta5+ or Ti4+ B sites, which are paired with A-site cations such as Sr2+, Ca2+ or La3+ respectively to respect charge neutrality. A particularly well-studied composition is LaTiO2N (LTON).1LTON is most often synthesized via thermal ammonolysis of a La2Ti2O7 (LTO) oxide precursor.1,6,7 LTO belongs to the family of layered Carpy-Galy perovskite oxides,8–10 which are constituted of slabs of distorted corner-sharing TiO6 octahedra stacked along the c-axis (Fig. 1a), subsequent slabs being linked via La–O bonds across the interlayer plane.11–13 These bonds are known to be weak, leading to preferential cleavage of microscopic LTO crystals along the interlayer plane.14 During ammonolysis LTO is placed under a flow of ammonia (NH3) at temperatures higher than 600 °C for several hours. According to the reaction LTO + 2NH3 → 2LTON + 3H2O, this process leads to formation of LTON, which has an orthorhombic perovskite structure with a mixture of O and N anions (Fig. 1b). While a cis order is preferred within the individual octahedra,15 LTON was shown to assume only partial16,17 or no long-range anion order.18,19
The transformation of LTO to LTON is a highly complex process, that has to involve the substitution of O by N, removal of excess O (the cation:anion ratio is 1![[thin space (1/6-em)]](https://www.rsc.org/images/entities/char_2009.gif) :
:![[thin space (1/6-em)]](https://www.rsc.org/images/entities/char_2009.gif) 3.5 in LTO and 1
3.5 in LTO and 1![[thin space (1/6-em)]](https://www.rsc.org/images/entities/char_2009.gif) :
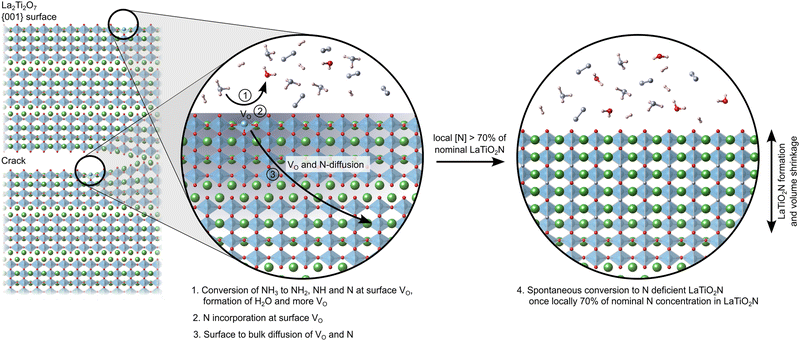
:![[thin space (1/6-em)]](https://www.rsc.org/images/entities/char_2009.gif) 3 in LTON) and ultimately the corner-sharing linking of octahedra across the interlayer plane.6,7,14 At high temperature the 2NH3 ⇌ N2 + 3H2 equilibrium is shifted towards the products and NH2, NH and N species may thus exist on LTO surfaces. Atomic and molecular hydrogen will form H2O with lattice oxygen, creating oxygen vacancies. These vacancies are assumed to be instrumental for further NH3 decomposition and nitrogen incorporation, leading to a chain reaction. While initially any of the typically exposed LTO (100), (010) and (001) surfaces14 could interact with NH3 and its decomposition products, the transformation is associated with a volume shrinkage (see vertical dimensions in Fig. 1a and b) that leads to the formation of cracks that preferentially expose the LTO (001) interlayer plane.7 A large proportion of N can thus be assumed to be incorporated by interaction of NH3 and its decomposition products with the (001) surface and subsequent diffusion into the layered LTO structure, while O atoms diffuse towards this surface and are removed as H2O. This hypothesis is supported by the experimental observation that the oxynitride is not exclusively formed at the surface of the LTO particles, but stripes of LTON are observed extending into the bulk, following cracks oriented perpendicular to [001].6 Once these diffusion processes result in a composition around a interlayer plane sufficiently close to LTON, the octahedra are assumed to link via a relative lateral displacement of the adjacent slabs in the so-called zipper mechanism.6,7
3 in LTON) and ultimately the corner-sharing linking of octahedra across the interlayer plane.6,7,14 At high temperature the 2NH3 ⇌ N2 + 3H2 equilibrium is shifted towards the products and NH2, NH and N species may thus exist on LTO surfaces. Atomic and molecular hydrogen will form H2O with lattice oxygen, creating oxygen vacancies. These vacancies are assumed to be instrumental for further NH3 decomposition and nitrogen incorporation, leading to a chain reaction. While initially any of the typically exposed LTO (100), (010) and (001) surfaces14 could interact with NH3 and its decomposition products, the transformation is associated with a volume shrinkage (see vertical dimensions in Fig. 1a and b) that leads to the formation of cracks that preferentially expose the LTO (001) interlayer plane.7 A large proportion of N can thus be assumed to be incorporated by interaction of NH3 and its decomposition products with the (001) surface and subsequent diffusion into the layered LTO structure, while O atoms diffuse towards this surface and are removed as H2O. This hypothesis is supported by the experimental observation that the oxynitride is not exclusively formed at the surface of the LTO particles, but stripes of LTON are observed extending into the bulk, following cracks oriented perpendicular to [001].6 Once these diffusion processes result in a composition around a interlayer plane sufficiently close to LTON, the octahedra are assumed to link via a relative lateral displacement of the adjacent slabs in the so-called zipper mechanism.6,7
Despite all experimental observations pointing towards the zipper mechanism, the indirect nature of the data does not yet allow a complete atomic-scale understanding of the transformation of LTO to LTON. From the above discussion, it is apparent that defects will play a crucial role in the NH3 decomposition, diffusion and zipper-mechanism aspects of the transformation mechanism. It is thus imperative to understand how O vacancies form in LTO, how they assist NH3 decomposition, how N is incorporated into LTO and how the anionic species diffuse in the layered structure. On the other hand, defects in LTON, resulting for example from incomplete transformation, also affect the final chemical and physical properties of the oxynitride. In particular non-stoichiometry or structural defects in LTON were shown to be detrimental for the photocatalytic performance.7,20 Nevertheless, other studies report better photocatalytic performance for LTON containing less than the stoichiometric amount of nitrogen (about 70–80%), despite the crystalline quality being inferior compared to stoichiometric LTON.21,22
In this work, we aim to gain insights on the transformation mechanism from LTO to LTON via density-functional theory (DFT) calculations. Our approach is to understand the defect chemistry of both the oxide precursor and the formed oxynitride as well as the diffusion kinetics of the most stable defect species. This is motivated by the fact that a highly defective LTO will eventually transform into an also defective LTON, our results providing an estimation of the required defect concentrations. We also study the interaction of NH3 and its decomposition products with the LTO (001) surface to establish the role of surface defects in N incorporation. A deeper knowledge of the defect chemistry and thermodynamics of these materials will pave the way towards a better understanding of the transformation mechanism and of the properties of the resulting oxynitride. These insights are key to identify strategies and guidelines for the synthesis design of oxynitrides with improved photo-electrochemical or photocatalytic activity.
2 Methods
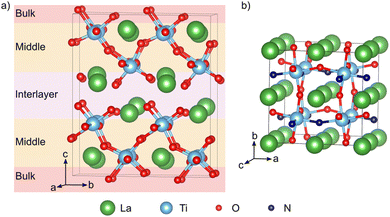
Density functional theory (DFT) calculations were performed with the QUANTUM ESPRESSO package23,24 using the PBE25 exchange–correlation functional with a Hubbard U correction26,27 of 3 eV on the Ti 3d states. Ultrasoft pseudopotentials28 with La(5s, 5p, 6s, 5d), Ti(3s, 3p, 4s, 3d), O(2s, 2p), and N(2s, 2p) valence states were employed, while wave functions and the augmented density were expanded in plane waves up to cutoffs of 40 and 320 Ry, respectively. This setup was previously validated for LTON29 and also reproduces the experimental LTO lattice parameters to within 1% (ESI† Section S1). Compared to more advanced exchange–correlation treatments, for example using hybrid functionals, the DFT+U approach is known to reliably describe defect states in titanates,30 at a computational cost compatible with the required screening of a large number of defect configurations.LTO was modeled using a 1 × 2 × 1 supercell containing 88 atoms derived from the 44-atom unit cell (space group, P21)12 (Fig. 2a). A 3 × 2 × 3 Monkhorst–Pack k-point mesh31 was used to sample the Brillouin zone of this supercell. Anion vacancy and substitutional defects in various charge states were created on the 14 symmetry inequivalent anion sites in this structure, while for anion interstitials we considered 22 different sites. To simplify the discussion, we will designate defects as lying either in the interlayer, the middle or bulk layer as shown in Fig. 2a. Defect pairs of vacancies, substitution and interstitial defects were also considered.
LTON has an orthorhombic 20-atom unit cell with a longer b-axis18,19 containing octahedral rotations and more importantly anion (dis)order (Fig. 1b). For our calculations we use a 40-atom  pseudo-cubic supercell (Fig. 2b) with a cis anion order that was shown to be more favorable compared to a trans anion arrangement.29 Reciprocal space was integrated using a 4 × 4 × 4 Monkhorst–Pack k-point grid.31 For anion vacancy and substitutional defects we considered the two symmetry inequivalent sites, while for interstitials 16 different sites were sampled. In addition, we also considered cation antisite defects (LaTi and TiLa) in LTON along with pairs of the aforementioned defects.
For stoichiometric cells, both ionic positions and cell parameters were optimized, while for defective calculations, only atomic positions were relaxed with lattice vectors fixed to those of the respective stoichiometric cell. Structural relaxation was performed until the total energy and forces converged below 1.4 × 10⁻⁵ eV and 5 × 10⁻² eV Å−1, respectively.
We will refer to defects in a Kröger–Vink-like32 notation (Xqs), where the main letter (X) refers to the defect species, the subscript (s) to the defect site and – deviating from the formal notation – the numeric superscript (q) to the total charge of the simulation cell. The formation energy33 of such a defect is computed as
 | (1) |
 and Etot,stoi are the DFT total energies of the defective and stoichiometric supercells, respectively. EF is the Fermi energy relative to the valence band maximum of the stoichiometric system, which can assume values within the band gap Eg (0 ≤ EF ≤ Eg) of the non-defective structure. Since our semi-local DFT calculations inevitably underestimate band gaps (ESI† Section S1), we use experimental band gaps for both materials. Ecorr is a corrective term necessary for charged defects (with an automatically added neutralizing background) to align the electrostatic potential of the defective charged cell with the one of the neutral stoichiometric cell. It was obtained by calculating the electrostatic potential difference between the two systems via averaging the electrostatic potential in spheres around atomic sites located far from the defect.34 No further finite-size corrections33 were applied, given the relatively high dielectric constant of LTO (42–6235) and LTON (75020). Finally, ni indicates the number of atoms of a certain species i that are added (ni > 0) or removed (ni < 0) from the supercell to form the defect and μi the species’ chemical potential. We define the chemical potential as μi = μi0 + Δμi, where μi0 is the chemical potential in a reference state and Δμi varies within thermodynamic stability limits and directly relates to the chemical environment. Pure metals are used as reference state for La and Ti, the O2 molecule for O and NH3 (LTON is synthesized under ammonia flow) or N2 (considered as the nitridating agent) for N. The NH3 reference yields an N chemical potential 1.01 eV higher than the N2 reference. We restrict the various Δμi to regions of the phase diagrams where LTO/LTON is stable and where the formation of competing phases, such La2O3 and TiO2, is not favorable (ESI† Section S2). Considering typical conditions during thermal ammonolysis7,14 and the typical n-type nature of transition metal oxides/oxynitrides, we will, in the main text, show results in the N-rich limit and for a Fermi energy at the conduction band edge. More detailed results as a function of these parameters can be found in the ESI† Sections S4 and S5.
Diffusion barriers were calculated using the climbing-image nudged elastic band (NEB) method.36 The number of images was selected for an initial inter-image distance of about 0.25 Å and the path was optimized until the forces on each image converged to 1 × 10⁻³ eV Å−1.
The LTO (001) surface was modeled as a one LTO-layer thick slab with the bottom half of the atoms fixed at bulk positions, a 10 Å vacuum gap and a dipole correction.37 This setup leads to adsorption energies converged to within 0.01 eV. Reciprocal space of this 44-atom cell was sampled with a 3 × 4 × 1 k-point mesh.31 Adsorption energies were calculated as
| ΔEads = Eslab+ads − Eads − Eslab, | (2) |
The optical properties of defective LTON were calculated based on the frequency dependent dielectric matrix within the VASP package,41–44 based the PBEsol45 exchange–correlation functional using PAW potentials46,47 with La(5s, 5p, 5d, 6s), Ti(3s, 3p, 3d, 4s), O(2s, 2p) and N(2s, 2p) valence shells together with a plane-wave cutoff of 500 eV. A rotationally invariant27 Hubbard U correction26 was applied to the Ti 3d orbitals. All calculations were performed with a spin-polarised setup using structures previously relaxed in QUANTUM ESPRESSO. The number of bands was about tripled (600) from the default value (216). Absorption spectra were extracted using the vaspkit package.48
LTON powders are synthesized by thermal ammonolysis of an oxide precursor, LTO. The precursor oxide is produced by a solid-state approach where 12.5 mmol TiO2 (Anatase, Sigma Aldrich, 99.9%), 6.25 mmol La2O3 (Sigma Aldrich, 99.9%), and 12.5 mol NaCl (VWR, 99%) are mechanically mixed using a roll-mill and calcined for 10 h at 1200 °C. After calcination the flux is removed and the resulting La2Ti2O7 is dried at 100 °C for 12 h. For thermal ammonolysis, 1 g of La2Ti2O7 is placed inside an alumina tube which is purged with N2 for 30 min and NH3 for 40 min at a flow rate of 0.2 L min−1. The synthesis conditions are varied by applying various temperatures and durations (1000 °C for 16 h, 18 h, and 25 h, 1050 °C for 18 h and 25 h) while keeping a constant NH3 flow of 0.2 L min−1. UV-vis diffuse reflectance spectra are collected using an UV-vis-NIR spectrophotometer (PerkinElmer, Lambda 1050) equipped with an integrating sphere over a spectral range of 200–900 nm (step size 2 nm). BaSO4 is used as a reference. The spectra are transformed to the Kubelka–Munk function49 and normalized before plotting.
All data are available on the Materials Cloud archive.50
3 Results and discussion
3.1 Interaction of LTO (001) with NH3
The (001) shear interface is known to be the preferred cleaving plane for LTO and can hence be assumed as the dominant surface interacting with NH3 and its decomposition products during ammonolysis. The (001) surface can either be the actual surface of a particle or exposed in cracks formed during ammonolysis.14 In order to gain insights into the interaction and decomposition of NH3 in contact with this surface and the role oxygen vacancies play in this process, we study the interaction of ammonia and its dehydrogenated derivatives with pristine and oxygen deficient LTO (001) surfaces. We find the energetically most favorable oxygen vacancy to reside at the very surface (ESI† Table S2 and Fig. S5). Since in LTO without a surface (Section 3.2) sites away from the interlayer plane are preferred, this preference likely stems from the reduced number of broken bonds at the surface.We find molecular NH3 to adsorb most favorably at a Ti-top site on the stoichiometric surface with an adsorption energy of 0.71 eV, while on the defective surface it adsorbs most favorably above the VO with an adsorption energy of 1.75 eV (Table 1). On the defective surface, an NH3 adsorbed at the Ti1-top site spontaneously migrates into the VO as evident by the almost equivalent adsorption energy. This clearly indicates the importance of VO for the adsorption of ammonia as once adsorbed, transition state theory predicts the molecule to remain bound on the microsecond time scale even at elevated ammonolysis temperatures, whereas residence times in the sub-nanosecond range result on the stoichiometric surface. This is also the case for the decomposition products NH2, NH and N that, when adsorbed adjacent to a vacancy, spontaneously relax into the vacancy, clearly demonstrating this to be the most favorable adsorption site.
| Site | Stoichiometric | Defective |
|---|---|---|
| Ti1-top | −0.71 | −1.75 |
| Ti2-top | −0.71 | −0.66 |
| La1-top | −0.53 | −1.38 |
| La2-top | −0.63 | −1.26 |
| Ti–La-bridge | −0.24 | −1.26 |
| Ti–Ti-bridge | −0.65 | −0.99 |
| La–La-bridge | −0.67 | −1.01 |
| VO | — | −1.76 |
Next, we calculated the thermodynamics of the decomposition reaction of NH3 at a surface VO. We initially consider that for each decomposition step half an oxygen vacancy forms and half a water molecule is released as shown by reactions (3) to (5).
 | (3) |
 | (4) |
 | (5) |
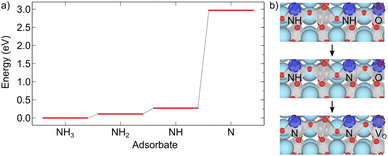
Here stoi stands for the stoichiometric slab, def for a slab with an oxygen vacancy and defprod for a slab with the respective decomposition product (prod = NH3, NH2, NH, N) adsorbed at the vacancy site. We compute the energy profile for the reaction, considering temperature and partial pressure effects via ab-initio atomistic thermodynamics by setting T = 1223 K, pNH3 = 105 Pa and pH2O = 10 Pa, which are conditions relevant for ammonolysis. The resulting energy profile in Fig. 3a shows that while most of the decomposition steps have a moderate energy cost, the final conversion of NH to N is prohibitively large with a height in excess of 2 eV, likely due to the formation of a strongly undercoordinated N atom.
The above reactions, however, also show that the initial facile decomposition steps lead to formation of additional VO adjacent to the initial NH3 adsorbate. Clusters of VO that will partially be filled with additional decomposition products are thus likely to form on the LTO surface. It makes, therefore, sense to consider if the final step could be facilitated in presence of two NH adsorbed in nearby VO. The reaction we study proceeds via transfer of one H from N to an adjacent O followed by the transfer of the second H to the same O, desorption of H2O and formation of the oxygen vacancy. This process is shown in Fig. 3b and has a thermodynamic cost of 1.12 eV, only half of the one in Fig. 3a.
These results highlight that VO are crucial to adsorb NH3 and decompose it to NH, forming additional VO in the process. The proximity of these newly formed VO is then crucial to facilitate the final decomposition step and incorporation of N into LTO. This model shows that surface VO will nucleate regions in which N is incorporated in a chain-like reaction, in agreement with the experimental observation that large regions of LTO simultaneously transform to LTON.14
3.2. Defect chemistry of LTO
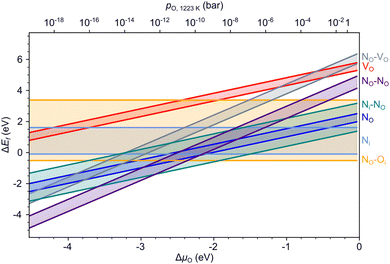
Fig. 4 summarizes the formation energies of all investigated defects and defect pairs in LTO as a function of the oxygen chemical potential and evaluated for experimentally relevant n-type conductivity conditions with the Fermi energy at the conduction band minimum. Details for each defect can be found in the ESI† Section S4 with specific references given below.3.3. Nitrogen diffusion in LTO
Once nitrogen enters LTO as a substitutional N at a (001) crack face or surface, it needs to diffuse deeper into the LTO layered structure to induce the conversion to the oxynitride. We study diffusion of NOvia a VO diffusion vehicle using the NEB method, considering different arrangements of these two defects as well as different charge states. In order to estimate facile diffusion directions, we then use these elemental diffusion events to build migration paths parallel to the interlayer plane in the interlayer, middle and bulk layer as well as paths perpendicular to the interlayer plane. The range of barriers involved in these paths are shown in Table 2.| Path | Barrier range (eV) |
|---|---|
| Parallel, interlayer | 0.01–0.79 |
| Parallel, middle layer | 0.50–1.99 |
| Parallel, bulk layer | 0.78–1.09 |
| Perpendicular, interlayer to middle layer | 0.77–1.67 |
| Perpendicular, within middle layer | 0.77–1.67 |
| Perpendicular, middle to bulk layer | 1.32–1.96 |
The lowest migration barriers are observed for diffusion along the interlayer plane, further suggesting these layers to be rapid diffusion directions, which is in line with elongated pores along this direction and the fact that the LTO to LTON transformation occurs also far from the surface.6 Diffusion parallel to the interlayer plane then becomes increasingly more difficult the further NO is from the interlayer plane. Diffusion barriers perpendicular to the interlayer plane are similar to the parallel ones in deeper layers. This data suggests that while NO is more stable away from the interlayer plane, diffusion to these sites is rather slow. An N-saturated interlayer plane and thus higher driving force, as well as high ammonolysis temperatures are thus prerequisite for N-diffusion away from the interlayer plane.
3.4 Defect chemistry of LTON
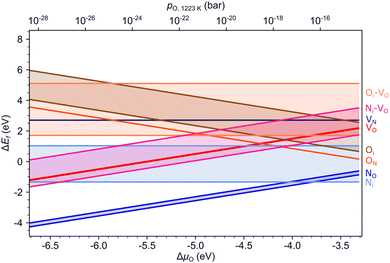
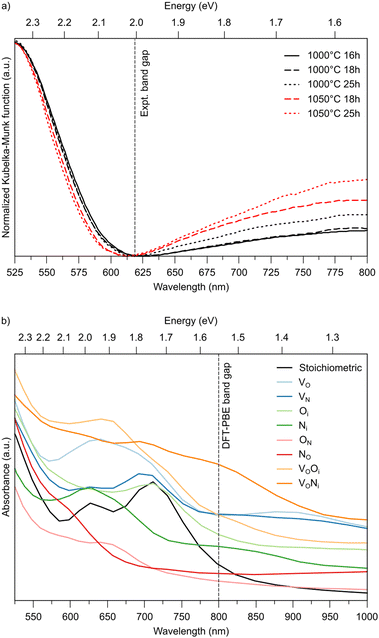
Fig. 5 summarizes the formation energies of all anionic defects and defect pairs in LTON as a function of the oxygen chemical potential and evaluated for experimentally relevant n-type conductivity conditions with the Fermi energy at the conduction band minimum. Details for each defect, can be found in ESI† Section S5 with specific references given below. Also shown in ESI† Sections S5F and S5G is data for cationic antisite defects, as these defects, while potentially promoted by pairing with anion substitutions, have rather high formation energies and are thus not relevant during ammonolysis.To support these computational results, we performed experiments with different ammonolysis times and temperatures. These show that both longer times or higher temperatures lead to emergence of an additional peak around 800 nm (1.55 eV) in the UV-vis spectra of LTON (Fig. 6a), which likely stems from kinetically slow to form defects. To test this hypothesis, we computed the optical absorption spectra for pristine LTON as well as structures with the various relevant defects and defect pairs (Fig. 6b). Even though a direct quantitative comparison with experiment is impossible due to the significantly underestimated band gap in our semi-local DFT calculations, we can see that anionic defects lead to absorption at lower energy (higher wavelength) compared to the pristine sample. While this effect is very minor for substitutional NO and ON defects, it is more pronounced for interstitial Ni and Oi defects. Vacancies (VO and VN) lead to even more significant contributions, that are highest when pairing with an interstitial occurs. Given the rather low bulk VO concentration, it seems reasonable to assign the experimental observation primarily to Ni defects in metastable dimer configurations that have not yet relaxed to NO. This points to the interpretation that extended ammonolysis times or higher temperatures promote Ni and local N superstoichiometry, due to continuous N incorporation at the (crack) surface.
3.5 Crossover defect concentration
The above data on the defect chemistry of both LTO and LTON can be used to estimate the crossover defect concentration, i.e. the N content that thermodynamically stabilizes defective LTON compared to defective LTO. We consider the following two reactions (in proper Kröger–Vink notation) that alter the N content of LTO and LTON respectively, based on the most relevant substitutional NO and ON defects determined above: | (6) |
 | (7) |
We note that despite these reactions being written with N2 and O2 as molecular reactants/products our results are the same if NH3 and H2O would be considered. This is achieved by estimating the total energy of a defective cell by adding the formation energy of the created defects to the total energy of the respective stoichiometric cell. Since these formation energies are calculated for relevant ammonolysis conditions, the appropriate chemical potentials of O and N containing molecular reactants/products are implicitly taken into account. We further note that this simple approach neglects defect-defect interactions that will become relevant for high defect concentrations, which we address below. Using this approach, Fig. 7 shows that defective LTON becomes more stable than defective LTO at about 70% N substitution in LTO.
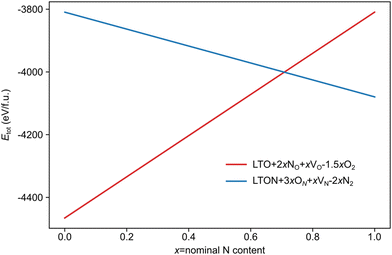 | ||
| Fig. 7 Total energy per formula unit of defective LTO (in red) and LTON (blue) cells obtained according to eqn (6) for LTO and (7) for LTON, as a function of the nominal N content (x). | ||
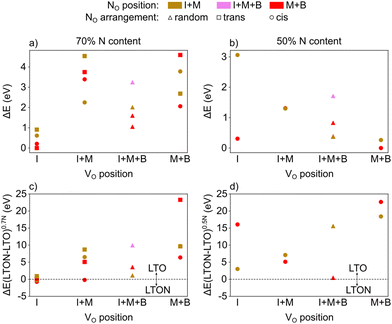
To further prove this finding and to include defect-defect interactions, we altered the 1 × 2 × 1 LTO cell (88 atoms) to result in about 70% N content by introducing 12 substitutional N and 6 oxygen vacancies. NO and VO were inserted in the interlayer (I), the middle (M) or the bulk (B) layer, resulting in either cis or trans local anion order as well as in a random fashion. For each defective LTO configuration, a corresponding  LTON cell with the same number and types of atoms was created in order to compare their total energies.
Fig. 8a reports the relative energy of the various configurations as a function of their VO location (I, M, B or a mixture thereof), the location of NO and the resulting anion order. This data confirms that what we already learned from isolated defects and defect pairs is also valid at high defect concentrations: NO prefers to be in the middle or bulk layer (low lying red data points) and VO are stabilised in the interlayer when NO are present (lowest energies in the I column). Interestingly, when VO are present in the interlayer, we observe spontaneous zipping of the two LTO slabs during structural optimization, the resulting structure being defective LTON. When zipping is observed, the final optimized structure is energetically slightly more stable than the corresponding LTO cell, as shown in Fig. 8c, which reports for each configuration the total energy difference between defective LTON and defective LTO. The most stable defective LTO cell (that spontaneously converts to LTON during relaxation) has a local trans anion order. This is in contrast to the most stable cis anion order in LTON29 but is caused by the trans order leading to an ideal anion arrangement for zipping, i.e. without nitrogen in the interlayer plane.
We repeated the same calculations for 50% nitrogen content (8 substitutional N and 4 oxygen vacancies in LTO). In this case, not only do we observed that VO are more stable in the bulk and middle layer (see Fig. 8b), but, more interestingly, the zipping of the two slabs to form LTON is never observed, LTO always being more stable than LTON (see Fig. 8d). The transformation of LTO to LTON is thus hindered at low N content both energetically as well as by the absence of VO in the interlayer that are required to induce zipping.
4 Conclusions
Our results indicate that surface VO are crucial for the complete decomposition of NH3 to N on the LTO surface. While, in principle, the initial decomposition steps could also occur on the stoichiometric surface, the presence of (H2 induced) VO will lead to clustering of NH adsorbates that are essential to reduce the energetic cost of the final decomposition step ultimately leading to N incorporation into LTO. Since bulk VO concentrations are low, due to the rather high formation energy of this defect, VO will have to be created at the surface.Once incorporated at the surface, N prefers to reside on an O site rather than as an interstitial and to assume a fully ionic N3− charge state. This species is more stable within the middle and bulk layer, suggesting that N diffuses away from the surface and into the LTO crystal. While diffusion parallel to the surface is most facile, the barriers for diffusion into the material are surmountable at typical thermal ammonolysis temperatures. This suggests that N will diffuse both laterally and vertically away from the surface and gradually saturate a region below the initial VO defects with substitutional NO. When nitrogen substitutes for an oxygen, the oxygen atom can become an interstitial, which can be removed from the material by diffusion and/or annihilation with oxygen vacancies. The presence of interstitial O is also in line with the experimentally observed anion superstoichiometry prior to conversion to LTON.
Our calculations indicate that once the local nitrogen content reaches about 70% of the concentration in stoichiometric LTON, the LTON structure becomes thermodynamically more stable than LTO. This structural transformation is spontaneous within our calculations as long as oxygen vacancies are present in the interlayer region, which is the case only for sufficiently high NO concentrations. Based on comparison with experimentally determined UV-vis spectra, the resulting LTON is likely to contain some metastable interstitial N caused by a high local N concentration in the N saturated region below surface VO.
Fig. 9 schematically shows this process of NH3 decomposition at VO on the predominant 001 surfaces and crack faces, followed by N and VO diffusion until a local N content ∼70% of nominal LTON is reached and ultimately collapse of the layered LTO structure to N deficient LTON.
Anion vacancies play a pivotal role in incorporating nitrogen species at the precursor-oxide surface, nitrogen diffusion into the oxide and they are required in the interlayer region during the transformation via the zipper mechanism. While these defects can be created and annihilated during ammonolysis, their concentration is also determined by the precursor oxide. A more oxygen deficient LTO precursor may therefore transform more easily to LTON than a stoichiometric LTO. The anion vacancy concentration in LTO is thus a promising tuning parameter for the synthesis of LTON via ammonolysis of LTO.
Author contributions
C. R., S. P. and U. A. conceptualised research. C. R., T. B. and X. W. conducted DFT calculations, supervised by U. A., V. W. conducted experiments, supervised by S. P., C. R. and U. A. wrote the original draft, all authors reviewed and edited the manuscript.Conflicts of interest
There are no conflicts to declare.Acknowledgements
This research was funded by the Swiss National Science Foundation (SNSF) Professorship Grants PP00P2_157615 and PP00P2_187185, SNSF Project 200021_178791 and the NCCR MARVEL, a National Centre of Competence in Research, funded by the SNSF (grant number 182892). Computational resources were provided by the University of Bern (on the HPC cluster UBELIX, https://www.id.unibe.ch/hpc) and by the Swiss National Super Computing Center (CSCS) under project IDs s955 and s1033.References
- S. G. Ebbinghaus, H.-P. Abicht, R. Dronskowski, T. Müller, A. Reller and A. Weidenkaff, Prog. Solid State Chem., 2009, 37, 173–205 CrossRef CAS.
- A. Fuertes, J. Mater. Chem., 2012, 22, 3293–3299 RSC.
- R.-J. Xie and H. T. (Bert) Hintzen, J. Am. Ceram. Soc., 2013, 96, 665–687 CrossRef CAS.
- W. Wang, M. Xu, X. Xu, W. Zhou and Z. Shao, Angew. Chem., Int. Ed., 2020, 59, 136–152 CrossRef CAS PubMed.
- I. E. Castelli, D. D. Landis, K. S. Thygesen, S. Dahl, I. Chorkendorff, T. F. Jaramillo and K. W. Jacobsen, Energy Environ. Sci., 2012, 5, 9034–9043 RSC.
- S. G. Ebbinghaus, R. Aguiar, A. Weidenkaff, S. Gsell and A. Reller, Solid State Sci., 2008, 10, 709–716 CrossRef CAS.
- S. Pokrant, M. C. Cheynet, S. Irsen, A. E. Maegli and R. Erni, J. Phys. Chem. C, 2014, 118, 20940–20947 CrossRef CAS.
- A. Carpy, P. Amestoy and J. Galy, C. R. Acad. Sci., 1972, 275C, 833 Search PubMed.
- A. Carpy, P. Amestoy and J. Galy, C. R. Acad. Sci., 1973, 277C, 501 Search PubMed.
- M. N. Valdez and N. A. Spaldin, Polyhedron, 2019, 171, 181–192 CrossRef.
- N. Ishizawa, F. Marumo, S. Iwai, M. Kimura and T. Kawamura, Acta Crystallogr., Sect. B: Struct. Crystallogr. Cryst. Chem., 1982, 38, 368–372 CrossRef.
- H. W. Schmalle, T. Williams, A. Reller, A. Linden and J. G. Bednorz, Acta Crystallogr., Sect. B: Struct. Sci., 1993, 49, 235–244 CrossRef.
- D. W. Hwang, J. S. Lee, W. Li and S. H. Oh, J. Phys. Chem. B, 2003, 107, 4963–4970 CrossRef CAS.
- S. Pokrant, S. Dilger and S. Landsmann, J. Mater. Res., 2016, 31, 1574–1579 CrossRef CAS.
- J. P. Attfield, Cryst. Growth Des., 2013, 13, 4623–4629 CrossRef CAS.
- D. Logvinovich, L. Bocher, D. Sheptyakov, R. Figi, S. G. Ebbinghaus, R. Aguiar, M. H. Aguirre, A. Reller and A. Weidenkaff, Solid State Sci., 2009, 11, 1513–1519 CrossRef CAS.
- D. Chen, D. Habu, Y. Masubuchi, S. Torii, T. Kamiyama and S. Kikkawa, Solid State Sci., 2016, 54, 2–6 CrossRef CAS.
- S. J. Clarke, K. A. Hardstone, C. W. Michie and M. J. Rosseinsky, Chem. Mater., 2002, 14, 2664–2669 CrossRef CAS.
- M. Yashima, M. Saito, H. Nakano, T. Takata, K. Ogisu and K. Domen, Chem. Commun., 2010, 46, 4704–4706 RSC.
- G. Lin and X. Xu, ACS Sustain. Chem. Eng., 2020, 8, 9641–9649 CrossRef CAS.
- A. Kasahara, K. Nukumizu, T. Takata, J. N. Kondo, M. Hara, H. Kobayashi and K. Domen, J. Phys. Chem. B, 2003, 107, 791–797 CrossRef CAS.
- A. E. Maegli, E. H. Otal, T. Hisatomi, S. Yoon, C. M. Leroy, N. Schäuble, Y. Lu, M. Grätzel and A. Weidenkaff, Energy Procedia, 2012, 22, 61–66 CrossRef CAS.
- P. Giannozzi, S. Baroni, N. Bonini, M. Calandra, R. Car, C. Cavazzoni, D. Ceresoli, G. L. Chiarotti, M. Cococcioni, I. Dabo, A. D. Corso, S. de Gironcoli, S. Fabris, G. Fratesi, R. Gebauer, U. Gerstmann, C. Gougoussis, A. Kokalj, M. Lazzeri, L. Martin-Samos, N. Marzari, F. Mauri, R. Mazzarello, S. Paolini, A. Pasquarello, L. Paulatto, C. Sbraccia, S. Scandolo, G. Sclauzero, A. P. Seitsonen, A. Smogunov, P. Umari and R. M. Wentzcovitch, J. Phys.: Condens. Matter, 2009, 21, 395502 CrossRef PubMed.
- P. Giannozzi, O. Andreussi, T. Brumme, O. Bunau, M. Buongiorno Nardelli, M. Calandra, R. Car, C. Cavazzoni, D. Ceresoli, M. Cococcioni, N. Colonna, I. Carnimeo, A. Dal Corso, S. De Gironcoli, P. Delugas, R. A. Distasio, A. Ferretti, A. Floris, G. Fratesi, G. Fugallo, R. Gebauer, U. Gerstmann, F. Giustino, T. Gorni, J. Jia, M. Kawamura, H. Y. Ko, A. Kokalj, E. Kücükbenli, M. Lazzeri, M. Marsili, N. Marzari, F. Mauri, N. L. Nguyen, H. V. Nguyen, A. Otero-De-La-Roza, L. Paulatto, S. Poncé, D. Rocca, R. Sabatini, B. Santra, M. Schlipf, A. P. Seitsonen, A. Smogunov, I. Timrov, T. Thonhauser, P. Umari, N. Vast, X. Wu and S. Baroni, J. Phys.: Condens. Matter, 2017, 29, 465901 CrossRef CAS PubMed.
- J. P. Perdew, K. Burke and M. Ernzerhof, Phys. Rev. Lett., 1996, 77, 3865–3868 CrossRef CAS PubMed.
- V. I. Anisimov, J. Zaanen and O. K. Andersen, Phys. Rev. B: Condens. Matter Mater. Phys., 1991, 44, 943 CrossRef CAS PubMed.
- S. L. Dudarev, G. A. Botton, S. Y. Savrasov, C. J. Humphreys and A. P. Sutton, Phys. Rev. B: Condens. Matter Mater. Phys., 1998, 57, 1505 CrossRef CAS.
- D. Vanderbilt, Phys. Rev. B: Condens. Matter Mater. Phys., 1990, 41, 7892 CrossRef PubMed.
- S. Ninova and U. Aschauer, J. Mater. Chem. A, 2017, 5, 11040–11046 RSC.
- C. Ricca, I. Timrov, M. Cococcioni, N. Marzari and U. Aschauer, Phys. Rev. Res., 2020, 2, 023313 CrossRef CAS.
- H. J. Monkhorst and J. D. Pack, Phys. Rev. B: Solid State, 1976, 13, 5188 CrossRef.
- F. A. Kröger and H. J. Vink, Solid State Physics, ed. F. Seitz and D. Turnbull, Academic Press, 1956, vol. 3, pp. 307–435 Search PubMed.
- C. Freysoldt, B. Grabowski, T. Hickel, J. Neugebauer, G. Kresse, A. Janotti and C. G. Van de Walle, Rev. Mod. Phys., 2014, 86, 253 CrossRef.
- S. Lany and A. Zunger, Phys. Rev. B: Condens. Matter Mater. Phys., 2008, 78, 235104 CrossRef.
- M. Hojamberdiev, A. Yamaguchi, K. Yubuta, S. Oishi and K. Teshima, Inorg. Chem., 2015, 54, 3237–3244 CrossRef CAS PubMed.
- G. Henkelman, B. P. Uberuaga and H. Jónsson, J. Chem. Phys., 2000, 113, 9901–9904 CrossRef CAS.
- L. Bengtsson, Phys. Rev. B: Condens. Matter Mater. Phys., 1999, 59, 12301 CrossRef CAS.
- K. Reuter and M. Scheffler, Phys. Rev. Lett., 2003, 90, 046103 CrossRef PubMed.
- K. Reuter, C. Stampf and M. Scheffler, Handbook of materials modeling, Springer, 2005, pp. 149–194 Search PubMed.
- A. H. Larsen, J. J. Mortensen, J. Blomqvist, I. E. Castelli, R. Christensen, M. Duak, J. Friis, M. N. Groves, B. Hammer, C. Hargus, E. D. Hermes, P. C. Jennings, P. B. Jensen, J. Kermode, J. R. Kitchin, E. L. Kolsbjerg, J. Kubal, K. Kaasbjerg, S. Lysgaard, J. B. Maronsson, T. Maxson, T. Olsen, L. Pastewka, A. Peterson, C. Rostgaard, J. Schiøtz, O. Schütt, M. Strange, K. S. Thygesen, T. Vegge, L. Vilhelmsen, M. Walter, Z. Zeng and K. W. Jacobsen, J. Phys.: Condens. Matter., 2017, 29, 273002 CrossRef PubMed.
- G. Kresse and J. Hafner, Phys. Rev. B: Condens. Matter Mater. Phys., 1993, 47, 558–561 CrossRef CAS PubMed.
- G. Kresse and J. Hafner, Phys. Rev. B: Condens. Matter Mater. Phys., 1994, 49, 14251–14269 CrossRef CAS PubMed.
- G. Kresse and J. Furthmüller, Computat. Mater. Sci., 1996, 6, 15–50 CrossRef CAS.
- G. Kresse, Phys. Rev. B: Condens. Matter Mater. Phys., 1996, 54, 11169–11186 CrossRef CAS PubMed.
- J. P. Perdew, A. Ruzsinszky, G. I. Csonka, O. A. Vydrov, G. E. Scuseria, L. A. Constantin, X. Zhou and K. Burke, Phys. Rev. Lett., 2008, 100, 136406 CrossRef PubMed.
- P. Blöchl, Phys. Rev. B: Condens. Matter Mater. Phys., 1994, 50, 17953 CrossRef PubMed.
- G. Kresse and D. Joubert, Phys. Rev. B: Condens. Matter Mater. Phys., 1999, 59, 1758–1775 CrossRef CAS.
- V. Wang, N. Xu, J.-C. Liu, G. Tang and W.-T. Geng, Comput. Phys. Commun., 2021, 267, 108033 CrossRef CAS.
- B. M. Weckhuysen and R. A. Schoonheydt, Catal. Today, 1999, 49, 441–451 CrossRef CAS.
- C. Ricca, T. Blandenier, V. Werner, X. Wang, S. Pokrant and U. Aschauer, Conversion of La2Ti2O7 to LaTiO2N via ammonolysis: An ab-initio investigation, Materials Cloud Archive 2023.69, (2023).
- A. Fujishima, X. Zhang and D. A. Tryk, Surf. Sci. Rep., 2008, 63, 515–582 CrossRef CAS.
- F. Meng, Z. Hong, J. Arndt, M. Li, M. Zhi, F. Yang and N. Wu, Nano Res., 2012, 5, 213–221 CrossRef CAS.
Footnote |
| † Electronic supplementary information (ESI) available: Detailed energetics and electronic structure data of all computed defects, phase diagrams and surface calculation details. See DOI: https://doi.org/10.1039/d3cp02159a |
| This journal is © the Owner Societies 2023 |

