
 Open Access Article
 This Open Access Article is licensed under a
 Creative Commons Attribution 3.0 Unported Licence
The contribution of phonons to the thermal expansion of some simple cubic hexaboride structures: SmB6, CaB6, SrB6 and BaB6†
Li
Li
 a,
Keith
Refson
b and
Martin T
Dove
*cde
a,
Keith
Refson
b and
Martin T
Dove
*cde
aCollege of Science, Civil Aviation Flight University of China, 46 Nanchang Road, Guanghan, Sichuan 618307, China
bISIS Facility, Harwell Campus, Chilton, Didcot, OX11 0QX, UK
cCollege of Computer Science, Sichuan University, Chengdu, Sichuan 610065, China. E-mail: martin.dove@icloud.com
dSchool of Mechanical Engineering, Dongguan University of Technology, 1st Daxue Road, Songshan Lake, Dongguan, Guangdong 523000, China
eSchool of Physical and Chemical Sciences, Queen Mary University of London, Mile End Road, London, E1 4NS, UK
First published on 25th March 2023
Abstract
We have performed first-principles calculations of the structure and lattice dynamics in the metal hexaborides SmB6, CaB6, SrB6 and BaB6 using Density Functional Theory in an attempt to understand the negative thermal expansion in the first of these materials. The focus is on the role of Rigid Unit Modes involving rotations of the B6 octahedra similar to the rotations of structural polyhedra connected by bonds in Zn(CN)2, Prussian Blue and Si(NCN)2. However, it was found that there is very low flexibility of the network of connected B6 octahedra, and the lattice dynamics do not support negative thermal expansion except possibly at very low temperature. Thus the negative thermal expansion observed in SmB6 probably has an electronic origin.
1 Introduction
The simple cubic hexaborides XB6, which are formed from some transition metals (X = Sm, Y, La for example) and some alkali earth elements (X = Ca, Sr, Ba) are shown in Fig. 1.1,2 The crystal structure consists of B6 octahedra, linked together by B–B bonds. This is similar to the cubic perovskite structure, but without the octahedral cation, and more importantly with the shared oxygen atom replaced by a B–B bond. In this sense it is like Zn(CN)2,3 which has Zn-centred tetrahedra connected by shared CN bonds, and even more similar to analogues of Prussian Blue in which metal-centred octahedra are connected by shared CN bonds in exactly the same topological layout.4,5 The main difference is that the essential network in SmB6 is entirely made from boron atoms, rather than metal-centred oxide or halide polyhedra, and thus cubic metal hexaboride materials potentially represent a new type of network material. | ||
Fig. 1 The crystal structure of SmB6 (space group Pm![[3 with combining macron]](https://www.rsc.org/images/entities/char_0033_0304.gif) m, lattice parameter 4.134 Å at temperature of 20 K).1 B atoms are the small grey bonded spheres, and Sm atoms are the larger pink atoms at the corners of the unit cell. m, lattice parameter 4.134 Å at temperature of 20 K).1 B atoms are the small grey bonded spheres, and Sm atoms are the larger pink atoms at the corners of the unit cell. | ||
Over the past two decades we have seen a rapid increase in the number of conventional network materials that show negative thermal expansion (NTE), that is, over a range of temperatures the material will shrink rather than expand on heating.6–9 Many of these materials are oxides or analogues based on replacing the oxygen anion by a halogen anion or even a molecular anion.10 In these cases there are structural polyhedra that are connected at corners to form infinite networks. Examples are ReO311,12 and its analogue ScF3,13,14 Zn(CN)23 as an analogue of the cubic cristobalite phase of SiO2, and the most famous NTE material ZrW2O815 with corner linked WO4 tetrahedra and ZrO6 octahedra.
NTE in network materials is commonly associated with a mechanism known as the ‘tension effect’.8 One simple example is cubic ScF3.16 The crystal structure has cubic symmetry, and consists of corner-sharing ScF6 octahedra with linear Sc–F–Sc bonds – essentially it has the cubic perovskite structure without the 12-coordinated cation. The Sc–F bonds are relatively rigid (and have positive thermal expansion), and so rotations of the Sc–F bonds will necessarily reduce the corresponding Sc–Sc distances and hence will lead to overall reduction in the crystal size. Such rotations occur as thermally-excited vibrational motions, and their effect in reducing the Sc–Sc distance exceeds that from the thermal expansion of the Sc–F bonds.14,16 Thus the effect becomes larger with higher temperature, leading directly to NTE. Because atomic motions are correlated, the important question is the extent to which the structure allows for low-frequency rotational vibrations. In structures consisting of connected polyhedra, the question becomes focussed on the balance between the phonons in which the polyhedra rotate as nearly-rigid objects – the Rigid Unit Modes (RUMs)17,18 – and the phonons that lead to bending of the bonds of polyhedra. This point has been discussed in detail elsewhere.19
Of the metal hexaborides, as far as we can tell low-temperature lattice parameters have only been measured for SmB6, which itself is now best known as a topological insulator.20–28 Experimental data show the existence of NTE in SmB6 at low temperatures,1 and we have recently confirmed this with our own diffraction data shown in Fig. 2. On the other hand, there are higher-temperature data for other metal hexaborides, which all show positive thermal expansion above room temperature.2
 | ||
| Fig. 2 Unpublished experimental data for the temperature-dependence of the lattice parameter of SmB6, obtained by the corresponding author with Zhongsheng Wei and Dean Keeble at the XPDF beam line at the Diamond synchrotron facility in the UK. | ||
In this paper we investigate the role of phonons and the standard Grüneisen and tension effect mechanisms8 using density functional theory simulations of SmB6 and analogue materials with alkaline earth cations, CaB6, SrB6 and BaB6. In fact it will be shown here that although there is a phonon mechanism to generate NTE, it is not sufficient in these materials to give NTE over a wide range of temperatures. In the case of SmB6 it is impossible to reproduce the observed NTE from a phonon mechanism, and thus we will conclude that the mechanism for NTE in SmB6 may more likely have an electronic origin.
2 Methods
2.1 DFT methods
Simulations were performed using the CASTEP program,29 version 19. This uses a density-functional-theory method based on periodic structures that make use of plane-wave basis sets. The effects of core electrons were handled using norm-conserving pseudopotentials supplied as part of the CASTEP package (NCP19).The calculations were performed using the standard PBE generalised-gradient approximation30,31 for CaB6, SrB6 and BaB6, assuming the electronic states are those of an insulator. The integration of the electronic states was performed using a Monkhorst–Pack grid32 of 7 × 7 × 7 wave vectors. A cut-off energy of 800 eV was chosen for the plane wave electronic basis set based on convergence tests for energy differences. For structure optimisation, calculations were performed to a convergence of energies to 10−8 eV per atom, convergence of force to 10−4 eV Å−1, and convergence of stress to 10−4 GPa. All limits were chosen on the basis of tests on convergence of energy differences for two similar volumes.
For the calculations on SmB6, on the other hand, the system was treated as a metal. A cut-off energy of 900 eV was used for the electronic basis set. Other details were the same as for the other materials.
We did not consider contributions from magnetic spin moments because it has been shown that SmB6 remains non-magnetic down to very low temperatures.21
2.2 Structure optimisation
The optimised values of the lattice parameters and interatomic distances for all systems are compared with experimental data,1,33 in Table 1. In each case agreement on lattice parameters is good, to within 1%.| a (Å) | B x | B–B (1) | B–B (2) | M–B | |
|---|---|---|---|---|---|
| SmB6 exp | 4.133 | 0.200 | 1.755 | 1.652 | 3.037 |
| SmB6 calc | 4.129 | 0.200 | 1.752 | 1.652 | 3.034 |
| CaB6 exp | 4.152 | 0.202 | 1.750 | 1.677 | 3.053 |
| CaB6 calc | 4.122 | 0.203 | 1.732 | 1.673 | 3.032 |
| SrB6 exp | 4.198 | 0.203 | 1.764 | 1.704 | 3.088 |
| SrB6 calc | 4.194 | 0.203 | 1.762 | 1.702 | 3.085 |
| BaB6 exp | 4.276 | 0.205 | 1.784 | 1.753 | 3.148 |
| BaB6 calc | 4.262 | 0.206 | 1.775 | 1.752 | 3.138 |
The bond distances are shown in Fig. 3, where we are able to make one important point. Increasing the size of the metal atom clearly, from Table 1, creates some strain in the crystal structure. This strain is accommodated mostly by expansion of the length of the B–B bond connecting two octahedra, and to a much lesser extent by increasing the size of the octahedra.
 | ||
| Fig. 3 Comparison of the two experimental1,33 (filled circles) and calculated (open circles) B–B distances in the four hexaborides, plotted as a function of the metal (M) to boron distance. From left to right the metal atoms are Sm, Ca, Sr and Ba. Note that there is a close overlap of the experimental and calculated distances in the case of the SrB6. The upper data are for the B–B distances within the octahedra and the lower data are for B–B distances connecting two octahedra. The lines are fits to the data, and highlight the fact that most of the strain imposed by increasing the size of the metal atom is accommodated though expansion of the B–B bond connecting two octahedra. | ||
2.3 Phonon methods
Phonon frequencies for the alkali earth hexaborides were calculated using the density functional perturbation theory (DFPT) method.34,35 An interpolation method was used to compute frequencies for any wave vector based on calculations of the dynamical matrices performed for a Monkhorst–Pack grid of wave vectors of size 7 × 7 × 7 in reciprocal space. A convergence tolerance for force constants during the DFPT calculations of 10−5 eV Å−2 was used. The phonon acoustic sum rule was enforced. For SmB6 the dynamical matrix was calculated using a supercell method. We have checked in the case of CaB6 that the two methods give substantially the same results.Volumetric thermal expansion8 is given by the formula αV = CV![[small gamma, Greek, macron]](https://www.rsc.org/images/entities/char_e0c4.gif) /BV, where CV is the heat capacity at constant volume, and B = V∂P/∂V is the bulk modulus. The key quantity is the overall Grüneisen parameter , which can be constructed from the individual mode Grüneisen parameters defined as γi = (∂ωi/∂V) × (V/ωi), where ωi is the angular frequency of the phonon labelled i and V is the crystal volume. The overall Grüneisen parameter is formed as
/BV, where CV is the heat capacity at constant volume, and B = V∂P/∂V is the bulk modulus. The key quantity is the overall Grüneisen parameter , which can be constructed from the individual mode Grüneisen parameters defined as γi = (∂ωi/∂V) × (V/ωi), where ωi is the angular frequency of the phonon labelled i and V is the crystal volume. The overall Grüneisen parameter is formed as
 | (1) |
For each system a set of calculations was performed with the crystal structure in its lowest-energy configuration, then a second set of calculations was performed using a lattice parameter expanded by about 1%. Mode Grüneisen parameters were obtained as γi = (Δωi/ωi)/(ΔV/V) from lattice dynamics calculations using a set of random wave vectors. An eigenvector-matching algorithm36 was used to ensure that the correct pairs of modes were compared in the calculation of Δωi. CV was calculated from the phonon frequencies using the standard formula based on differentiation of the Bose–Einstein distribution function.
3 Phonon dispersion curves of CaB6 and SmB6
Here we consider the main details of the phonon dispersion curves. These are shown for SmB6 and CaB6 along the main symmetry directions in reciprocal space in Fig. 4. Corresponding data for SrB6 and BaB6 are given in the ESI.† | ||
Fig. 4 Calculated phonon dispersion curves of SmB6 (left) and CaB6 (right). The wave vector labels have conventional meaning: Γ represents the wave vector (0, 0, 0), X represents 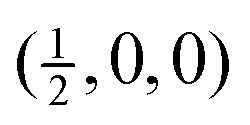 , M represents , M represents  and R represents and R represents  . Results from a single-crystal neutron inelastic scattering experiment37 are represented as points, using different symbols to aid clarity. . Results from a single-crystal neutron inelastic scattering experiment37 are represented as points, using different symbols to aid clarity. | ||
At zero wave vector, the mode decomposition gives acoustic modes with irreducible representation T1u, and A1g + Eg + T1g + T2g + 2T1u + T2u for the optic modes. In CaB6 the two optic T1u modes show splitting of the frequencies of the longitudinal and transverse modes, which is not present in SmB6 because in this case it is a metal. The values of frequencies at zero wave vector are given in Table 2.
| Mode | SmB6 | CaB6 | SrB6 | BaB6 |
|---|---|---|---|---|
| T1u | 4.86 | 5.15, 7.22 | 4.68, 6.27 | 5.63, 6.79 |
| T2u | 15.11 | 14.32 | 14.10 | 13.80 |
| T1g | 17.37 | 18.76 | 18.41 | 18.52 |
| T2g | 22.32 | 23.93 | 23.31 | 22.50 |
| T1u | 25.94 | 26.73, 26.80 | 25.84, 25.90 | 24.86, 24.93 |
| Eg | 34.44 | 33.94 | 32.33 | 29.72 |
| A1g | 38.50 | 37.99 | 36.33 | 33.54 |
Images of the mode eigenvectors are shown in the ESI.† The lowest frequency T1u mode involves simple opposite displacements of the metal cation and B6 octahedron, creating a local electrical dipole moment. The T2u mode consists of sideways displacements of the B–B bond connecting two octahedra in the perpendicular direction. This necessarily causes deformation of the B6 octahedra. The T1g mode involves the rotation of the B6 octahedra without distortion (see the discussion in Section 4), together with a counter rotation of the linking B–B bonds. The higher-frequency T1u mode involves displacements of the linking B–B bond along the direction of the bond, causing bond-bending distortions of the B6 octahedra. The Eg mode involves asymmetric stretching of the B–B bonds within the B6 octahedra. Finally, the A1g mode is the totally-symmetric stretch of all bonds within the B6 octahedra accompanied by an opposite contraction of the linkage B–B bonds.
The low-frequency part of the dispersion curves of SmB6 have been measured by inelastic neutron scattering along the three symmetry directions from zero wave vector at room temperature.37 The measurements included the acoustic modes in each direction, and the lowest set of optic modes that come together as the T1u triplet at just below 5 THz at zero wave vector. Agreement between calculation and experiment is excellent, including the lack of LO/TO splitting of the T1u modes at zero wave vector, the significant flattening of acoustic mode dispersion curves, the subtle cross-over of the transverse and longitudinal acoustic modes for wave vectors around  (half way between the points labelled Γ and M in Fig. 4), the rapid rise of the acoustic modes in increasing wave vector from zero wave vector (Γ), and the maxima in the frequencies of the low-frequency optic modes at the points
  (half way between Γ and M) and
  (half way between Γ and R). The calculated frequencies of the acoustic modes are in excellent agreement with experiment across the whole Brillouin zone for all three directions. The lowest frequency TO modes agree very well with experiment, including the values of the maximum frequencies. The maximum frequencies of the low-frequency LO modes are calculated to have slightly higher frequencies than experiment at the zone boundaries, but the fact that the frequency of the LO mode at wave vector X is lower than that at wave vector M, which in turn is lower than that at wave vector R, is reproduced in the calculation. On the basis of this level of agreement between calculation and experiment we conclude that our DFT approach is reproducing most of the relevant behaviour of the phonon dispersion curves.
For SmB6 and CaB6 we can compare the calculated frequencies for zero wave vector with the results from Raman spectroscopy,25,38 as summarised in Table 3. We consider the agreement to be good.
| Mode | SmB6 Expt | SmB6 Calc | CaB6 Expt | CaB6 Calc |
|---|---|---|---|---|
| A1g | 1280 | 1284 | 1291 | 1264 |
| Eg | 1148 | 1148 | 1149 | 1129 |
| T2g | 730 | 743 | 780 | 780 |
It is interesting to draw attention to the phonon anti-crossing at low frequencies, involving the acoustic and low-lying optic modes. This is particularly evident in the directions Γ–X, where as a result both the transverse and longitudinal acoustic modes are seen to flatten quickly on increasing wave vector, and the optic modes rise sharply. The effect is much larger in SmB6 than in CaB6, leading to lower frequencies at the X point in SmB6. The same effect is seen in other directions Γ–M and Γ–R. It is noticeable that in each case the extrapolation to the zone boundary of the un-crossed acoustic modes gives similar frequencies.
It is also noticeable from Table 2 that there is a significant and consistent decrease in the calculated value of the A1g symmetric stretch mode from SmB6 to BaB6. This is commensurate with a change in B–B bond lengths (Table 1), that is the longer bond has a weaker force constant. However, this trend is not seen in the independent data for SmB6 and CaB6 shown in Table 3, for reasons that are not clear.
The slopes of the acoustic modes were used to calculate the elastic constants and bulk modulus. The method is described in the ESI,† and key data are provided there. The results are shown in Table 4. The results for SmB6, CaB6 and SrB6 are consistent with results given by the Materials Project as computed from analysis using finite strains, although data for BaB6 are not available there.
| C 11 (GPa) | C 44 (GPa) | C 12 (GPa) | B (GPa) | |
|---|---|---|---|---|
| SmB6 | 440 | 71 | 22 | 161 |
| CaB6 | 433 | 54 | 14 | 153 |
| SrB6 | 394 | 66 | 52 | 166 |
| BaB6 | 418 | 98 | 34 | 162 |
4 Flexibility analysis
The Rigid Unit Modes (RUMs)17,18 discussed previously in regard to framework structures composed of corner-linked structural polyhedra, such as silicate and perovskite structures, are the phonons that can propagate without any distortion of the polyhedra. In the case of oxides with corner-sharing polyhedra, the RUMs typically propagate with low frequency. The concept of RUMs can be extended to systems composed of structural polyhedra connected via a shared molecular ligand, as in the related materials Zn(CN)23,40 and Si(NCN)2,41 or analogues of Prussian Blue, Fe4III [FeII(CN)6]3.40 However, as was found in the case of Zn(CN)2, the RUMs that involve bending of the linear Zn–CN–Zn linkage have relatively high frequency, so one should not assume that in these extended network systems the RUMs will have low frequencies,3 which is the pertinent issue for the cubic metal hexaborides.We have evaluated all possible RUMs for the cubic metal hexaboride structure, based on rigid-body motions of the B6 octahedra and with a rigid connecting B–B bond, and disregarding any role of the metal atoms. We begin with a simple count of degrees of freedom and constraints. Each octahedron has 6 degrees of freedom. Each connecting B–B provides one constraint, which is shared between the two connected octahedra. Thus we have 3 constraints for each octahedron. The difference between the numbers of degrees of freedom and constraints implies there are three RUMs for each wave vector, a result confirmed by calculation using a dynamical matrix. It is often found that symmetry leads to the presence of additional RUMs at special wave vectors, and this was found to be the case here using a simple flexibility mode (discussed below). The key results are given in Table 5, and are consistent with those obtained by Goodwin40 for the analogous Prussian Blue crystal.
| Wave vector | Number of RUMs |
|---|---|
| (0, 0, 0) | 6 |
| (ξ, 0, 0) | 5 |
| (1/2, 0, 0) | 5 |
| (1/2, ξ, 0) | 4 |
| (ξ, ξ, 0) | 4 |
| (1/2, 1/2, 0) | 4 |
| (ξ, ζ, 0) | 4 |
The additional three RUMs at wave vector k = (0, 0, 0) are the trivial acoustic modes. The rest of the results given in Table 5 can be accounted for simply by noticing that there are planes of wave vectors of the form (ξ, ζ, 0) containing one additional RUM each. Thus, for example, the wave vector (ξ, 0, 0) lies on the intersection of two such planes and thus has an additional two RUMs, as seen in Table 5. This mode is a shear acoustic mode.
To map the RUMs onto the phonon dispersion curves, we use the rigidity analysis described previously by Rimmer and Dove.36 The eigenvectors from a full lattice dynamics calculation are compared with those from a calculation with a model designed to reproduce the spectrum of RUMs. The calculations were performed using the GULP simulation package.42,43 Strong interatomic distance potentials were applied to the B–B bonds, and bond-bending potentials were applied to the B–B–B angles within the octahedra. No other potentials were applied to the network, meaning that the octahedra can twist about the connecting B–B bonds with no energy cost. The metal atoms were not included in the model.
For a given phonon wave vector k and label i, we form the comparison of the phonon eigenvector ei(k) from the full lattice dynamics calculation with the eigenvectors  for the flexibility model through the vector product relationship defined by Rimmer and Dove:36
 | (2) |
 is the (angular) frequency of the j-th mode in the model calculation, the sum is over all modes in the model calculation, and Ω is an arbitrary value designed simply to prevent divergence when
  ≃ 0, but because we needed to include forces for the motion of the metal atom the RUMs will not quite have zero frequency so it was necessary that the value of Ω is significantly larger than the RUM frequencies. From the orthonormality of the phonon eigenvectors we have mi(k) ≤ 1 for all modes. The case mi(k) ∼ 1 corresponds to the case where there is a close matching of the eigenvector of the phonon in the full calculation to that of a RUM in the model calculation; in this case one of the products of the eigenvectors is close to a value of 1 and the frequency
  ≃ 0.
≃ 0.
The results of the flexibility for SmB6 and CaB6 are shown in Fig. 5, where we plot the dispersion curves of Fig. 4 and shade the curves towards black where there is a perfect match between the phonon and RUM eigenvectors – where, in eqn (2), mi(k) = 1 – and white where there is no match (mi(k) = 0).
 | ||
Fig. 5 Calculated phonon dispersion curves of SmB6 (left) and CaB6 (right) coloured between white and black to indicate the degree to which the mode eigenvectors can be described as a combination of the RUMs identified in a simple flexibility model, where black indicates close alignment of the phonon eigenvectors with the RUMs. The wave vector labels have conventional meaning: Γ represents the wave vector (0, 0, 0), X represents  , M represents , M represents  and R represents and R represents  . . | ||
What we have previously noted is that when the phonon modes that are nominally RUMs are of low frequency, and separated from other modes, we see a clear RUM character.18 However, when they are of higher frequency, or when there are other low-energy modes, the RUM eigenvectors can mix with those of other phonons. This has been discussed previously,19 and is seen in the case of Zn(CN)2 where the RUM eigenvectors are spread over a few modes with frequencies around that of the nominally-RUM phonon,3 and in ZrW2O8 where there is a surface of RUMs in reciprocal space and such a broad distribution of phonon frequencies that the RUM is simply not visible at all.8
In Fig. 5 we see that the RUMs are identified with phonons of relatively high frequency, as in Zn(CN)2.3 In the latter case, this arises from the resistance of the chemical bonds against flexing of the linear Zn–C–N–Zn connection. This is in contrast to the analogous material Si(NCN)2, which we have recently studied using an approach similar to the one here.41 In that case, the Si–N–C linkage is much more flexible, and the RUMs are well separated from the frequencies of all other phonons and are clearly identified as such.
The high frequencies of the RUMs identified in Fig. 5 – see also the discussion of mode eigenvectors for phonons at zero wave vector in Section 3, where we identified the T1g phonon as having RUM character – show that the torstional flexing of the B6–B6 linkage is of high energy, and thus the picture of freely-jointed B6 octahedra is not represented in the phonon spectrum. This is unlike the case of the cubic perovskites, where there is clear evidence from calculated44 and measured45 phonon dispersion curves of a high degree of flexibility of the linked octahedra. In the case of perovskite the RUMs have wave vectors only along the line M–R in reciprocal space,17 that is, for wave vectors between  and
and  , and evidence from inelastic neutron scattering data and calculations show a low frequency along this branch. It is clear in the case of the metal hexaborides, Fig. 4 and 5, that the corresponding line in the dispersion curves does not show low frequencies.
We conclude from this analysis that in fact the network of connected B6 octahedra does not have the flexibility seen in more traditional RUM systems such as cubic perovskites17 and phases of silica or silicates.18 In fact this might have been anticipated from the data shown in Table 1 and Fig. 3. Incorporation of the larger cations causes the B6 octahedra and their connecting B–B bonds to become strained, and hence the whole network will become more taut and less flexible.
5 Thermodynamic properties from vibrational spectra
The phonon densities of states of SmB6 and CaB6 are shown in Fig. 6a and b respectively, and corresponding data for SrB6 and BaB6 are given in the ESI.† The phonon densities of states show the gaps at frequencies of around 20 THz and just above 30 THz as seen in the phonon dispersion curves, Fig. 4. The same gaps are seen in SrB6 and BaB6. | ||
| Fig. 6 Calculation of phonon densities of states for SmB6 (a) and CaB6 (b), and distribution of values of mode Grüeisen parameters across the range of frequencies for SmB6 (c) and CaB6 (d). In the latter two, pink represents a zero of phonon modes with a particular pair of values of frequency and Grüeisen parameters, yellow corresponds to the maximum in the distribution function, and the colour scheme passes from pink to yellow through dark blue. In order to highlight the existence of the distribution function for which there are fewer modes we saturate the scale of the histogram. | ||
Of relevance for the thermal expansion are the mode Grüneisen parameters γi as defined earlier in Section 2.3. We have computed these for a random set of wave vectors, and we plot a histogram of the distribution of values of γ as spread across the range of phonon frequencies. Fig. 6c and d show these distributions for SmB6 and CaB6 respectively, and corresponding data for SrB6 and BaB6 given in the ESI.† It is clear that there are phonons in SmB6 and CaB6 that have negative values of γi, but there are many more that have positive values, particularly at low frequency. However, in SrB6 and BaB6 there are many fewer phonons with negative values of γ.
Fig. 7 shows the distribution of significant values of γ across the dispersion curves of SmB6 and CaB6 shown in Fig. 4; corresponding diagrams for SrB6 and BaB6 are again given in the ESI.†
 | ||
Fig. 7 Calculated phonon dispersion curves of SmB6 (left) and CaB6 (right) coloured between red and blue to indicate the values of the mode Grüneisen parameters γi, where the strongest red indicates values of γi < −1 and the strongest blue indicates values of γi > +3. The wave vector labels have conventional meaning: Γ represents the wave vector (0, 0, 0), X represents  , M represents , M represents  and R represents and R represents  . . | ||
The overall Grüneisen parameters, , of SmB6, CaB6, SrB6 and BaB6, as calculated from eqn (1), are shown as functions of temperature in Fig. 8. Not surprisingly, in the light of the data shown in Fig. 6, and of the corresponding data shown in the ESI,† even at low temperature the overall Grüneisen parameters are dominated by the distribution of positive-valued mode Grüneisen parameters at low frequencies.
 | ||
| Fig. 8 Calculation of the temperature-dependence of the overall Grüneisen parameters of SmB6, CaB6, SrB6 and BaB6. | ||
What we see is that in SrB6 and BaB6 there is not the slightest hint of a negative thermal expansion. On the other hand, CaB6 does show negative thermal expansion for a small range of temperatures at low temperature as indicated by a negative value of . The interesting case for us is SmB6, which we have to conclude does not show negative thermal expansion as arising from the phonons. The accuracy of our calculated phonons is attested by the good agreement with the inelastic neutron scattering data shown in Fig. 4, and so we can conclude that the negative thermal expansion shown by the data in Fig. 2 must have a different origin that of the normal phonon mechanism.8
The values of the coefficients of volume thermal expansion for the four hexaborides, calculated as described in Section 2.3, are shown in Fig. 9. The data, of course, follow the trend seen in the overall Grüneisen parameters (Fig. 8), with a small range of NTE seen in CaB6 only.
 | ||
| Fig. 9 Calculation of the temperature-dependence of the volume thermal expansion of SmB6, CaB6, SrB6 and BaB6. | ||
6 Discussion
The work of this paper has been concerned with analysing the flexibility of the network of connected B6 octahedra in simple cubic metal hexaborides. The key finding from the DFT phonon calculations presented here is that in each case the network is not particularly flexible, with an energy cost to flex the orientation of one B6 octahedron about the linkage B–B bond connecting two tetrahedra. This was seen in the calculation of RUMs, where their frequencies are far from being low. As a result, we concluded that the NTE observed in SmB6 (Fig. 2) does not have its origin in the tension effect and phonons. On the other hand, there is a weak effect in CaB6 which would be interesting to investigate using low-temperature diffraction methods.The methods employed in this study are based on the quasi-harmonic model of Grüneisen in which the important anharmonic effects are coupling of interatomic force constants with volume. It might be asked whether NTE could arise if account were taken of direct phonon–phonon anharmonic interactions as accounted for, for example, in renormalised phonon theory. Most evidence, and in this we include our own theoretical study that addresses this point exactly,46 is that anharmonic effects will lower the magnitude of the mode Grüneisen parameters of the renormalised phonons because their frequency will increase, and cannot change the sign of mode Grüneisen parameters from positive to negative. We do not believe that there is evidence to suggest that the current state of anharmonic phonon theory will indicate that there is a possibility to find NTE when Grüneisen theory doesn’t show NTE.
It is known that there are electronic mechanisms for NTE,47 whether directly so or via magnetic interactions. In this regard, we note that although the samarium atom is magnetic, magnetic ordering in SmB6 has been shown to be absent down to a temperature of 19 mK.21 Thus in our calculations we did not include magnetic interactions, and the good agreement of our calculated phonon dispersion curves with experimental data shows that this was reasonable. It is also observed that samples of the alkali-earth hexaborides can show magnetism, but this is believed to have its origin in a mechanism that is not directly a bulk property, such as broken B–B bonds at surfaces and interfaces, and magnetism of B6 octahedra without saturated connectivity.48
In our calculations on SmB6 we attempted to investigate effects of electron entropy through calculation of changes of electron entropy with volume. However, in our calculations on SmB6 we observed that electron entropy consistently increases with volume across a range of Fermi-Dirac smearing temperatures from 100–1000 K, which means the electron entropy favours positive thermal expansion just as the phonon entropy does. Recently one of us (LL) had calculated the band structure for a range of volumes,49 showing that over a contraction of several percent there is no clear change in the electronic density of states.
At this point we are forced to conclude that the NTE in SmB6 remains of unknown origin.
Author contributions
Li Li: investigation, formal analysis, validation, writing (review & editing), visualisation. Keith Refson: software, writing (review & editing). Martin T Dove: conceptualisation, methodology, software, validation, formal analysis, resources, writing (original draft), visualisation, supervision, funding acquisition.Conflicts of interest
There are no conflicts to declare.Acknowledgements
We acknowledge financial support from National Natural Science Foundation of China, grant number 12174274 (MTD). This research made use of the Apocrita HPC facility of Queen Mary University of London, supported by QMUL Research-IT and initially funded by EPSRC grants EP/K000128/1 and EP/K000233/1 (MTD), and the EPSRC-funded HPC Midlands Plus (EP/P020232/1) Tier-2 system, which we accessed as members of the project consortium (MTD).References
- V. A. Trounov, A. L. Malyshev, D. Y. Chernyshov, M. M. Korsukova, V. N. Gurin, L. A. Aslanov and V. V. Chernyshev, J. Phys.: Condens. Matter, 1999, 5, 2479–2488 CrossRef.
- C.-H. Chen, T. Aizawa, N. Iyi, A. Sato and S. Otani, J. Alloys Compd., 2004, 366, L6–L8 CrossRef CAS.
- H. Fang, M. T. Dove, L. H. N. Rimmer and A. J. Misquitta, Phys. Rev. B, 2013, 88, 104306 CrossRef.
- T. Matsuda, J. E. Kim, K. Ohoyama and Y. Moritomo, Phys. Rev. B, 2009, 79, 172302–172304 CrossRef.
- S. Adak, L. L. Daemen, M. Hartl, D. Williams, J. Summerhill and H. Nakotte, J. Solid State Chem., 2011, 184, 2854–2861 CrossRef CAS.
- C. Lind, Materials, 2012, 5, 1125–1154 CrossRef CAS PubMed.
- J. Chen, L. Hu, J. Deng and X. Xing, Chem. Soc. Rev., 2015, 44, 3522–3567 RSC.
- M. T. Dove and H. Fang, Rep. Prog. Phys., 2016, 79, 066503 CrossRef PubMed.
- R. Mittal, M. K. Gupta and S. L. Chaplot, Prog. Mater. Sci., 2018, 92, 360–445 CrossRef CAS.
- N. Shi, Y. Song, X. Xing and J. Chen, Coord. Chem. Rev., 2021, 449, 214204 CrossRef CAS.
- T. Chatterji, P. Henry, R. Mittal and S. Chaplot, Phys. Rev. B, 2008, 78, 134105 CrossRef.
- M. Dapiaggi and A. N. Fitch, J. Appl. Crystallogr., 2009, 42, 253–258 CrossRef CAS.
- B. K. Greve, K. L. Martin, P. L. Lee, P. J. Chupas, K. W. Chapman and A. P. Wilkinson, J. Am. Chem. Soc., 2010, 132, 15496–15498 CrossRef CAS PubMed.
- L. Hu, J. Chen, A. Sanson, H. Wu, C. Guglieri Rodriguez, L. Olivi, Y. Ren, L. Fan, J. Deng and X. Xing, J. Am. Chem. Soc., 2016, 138, 8320–8323 CrossRef CAS PubMed.
- T. A. Mary, J. S. O. Evans, T. Vogt and A. W. Sleight, Science, 1996, 272, 90–92 CrossRef CAS.
- M. T. Dove, J. Du, Z. Wei, D. A. Keen, M. G. Tucker and A. E. Phillips, Phys. Rev. B, 2020, 102, 094105 CrossRef CAS.
- A. P. Giddy, M. T. Dove, G. S. Pawley and V. Heine, Acta Crystallogr., Sect. A: Found. Crystallogr., 1993, 49, 697–703 CrossRef.
- K. D. Hammonds, M. T. Dove, A. P. Giddy, V. Heine and B. Winkler, Am. Mineral., 1996, 81, 1057–1079 CAS.
- M. T. Dove, Philos. Trans. R. Soc., A, 2019, 377, 20180222 CrossRef CAS PubMed.
- I. Batko and M. Batkova, Solid State Commun., 2014, 196, 18–23 CrossRef CAS.
- P. K. Biswas, Z. Salman, T. Neupert, E. Morenzoni, E. Pomjakushina, F. von Rohr, K. Conder, G. Balakrishnan, M. C. Hatnean, M. R. Lees, D. M. Paul, A. Schilling, C. Baines, H. Luetkens, R. Khasanov and A. Amato, Phys. Rev. B, 2014, 89, 155 Search PubMed.
- J. C. Cooley, M. C. Aronson, A. Lacerda, P. C. Canfield, Z. Fisk and R. P. Guertin, Phys. B, 1995, 206–207, 377–379 CrossRef.
- S. Gabáni, E. Bauer, M. Della Mea, K. Flachbart, Y. Paderno, V. Pavlík and N. Shitsevalova, J. Magn. Magn. Mater., 2004, 272–276, 397–399 CrossRef.
- F. Lu, J. Zhao, H. Weng, Z. Fang and X. Dai, Phys. Rev. Lett., 2013, 110, 096401 CrossRef PubMed.
- P. Nyhus, S. L. Cooper, Z. Fisk and J. Sarrao, Phys. Rev. B, 1997, 55, 12488–12496 CrossRef CAS.
- P. S. Riseborough, Adv. Phys., 2000, 49, 257–320 CrossRef CAS.
- P. Syers, D. Kim, M. S. Fuhrer and J. Paglione, Phys. Rev. Lett., 2015, 114, 096601 CrossRef PubMed.
- B. S. Tan, Y. T. Hsu, B. Zeng, M. C. Hatnean, N. Harrison, Z. Zhu, M. Hartstein, M. Kiourlappou, A. Srivastava, M. D. Johannes, T. P. Murphy, J. H. Park, L. Balicas, G. G. Lonzarich, G. Balakrishnan and S. E. Sebastian, Science, 2015, 349, 287–290 CrossRef CAS PubMed.
- S. J. Clark, M. D. Segall, C. J. Pickard, P. J. Hasnip, M. I. J. Probert, K. Refson and M. C. Payne, Z. Kristallogr. - Cryst. Mater., 2005, 220, 191–194 Search PubMed.
- J. P. Perdew, K. Burke and M. Ernzerhof, Phys. Rev. Lett., 1996, 77, 3865–3868 CrossRef CAS PubMed.
- J. P. Perdew, K. Burke, M. Ernzerhof and R. Ernstorfer, Phys. Rev. Lett., 1997, 78, 1396 CrossRef CAS.
- H. J. Monkhorst and J. D. Pack, Phys. Rev. B, 1976, 13, 5188–5192 CrossRef.
- K. Schmitt, C. Stückl, H. Ripplinger and B. Albert, Solid State Sci., 2001, 3, 321–327 CrossRef CAS.
- S. Baroni, S. de Gironcoli and A. D. Corso, Rev. Mod. Phys., 2001, 73, 515–562 CrossRef CAS.
- K. Refson, P. R. Tulip and S. J. Clark, Phys. Rev. B, 2006, 73, 155114 CrossRef.
- L. H. N. Rimmer and M. T. Dove, J. Phys.: Condens. Matter, 2015, 27, 185401 CrossRef PubMed.
- P. A. Alekseev, A. S. Ivanov, B. Dorner, H. Schober, K. A. Kikoin, A. S. Mishchenko, V. N. Lazukov, E. S. Konovalova, Y. B. Paderno, A. Y. Rumyantsev and I. P. Sadikov, Europhys. Lett., 2007, 10, 457–463 CrossRef.
- N. Ogita, S. Nagai, N. Okamoto, F. Iga, S. Kunii, T. Akamtsu, J. Akimitsu and M. Udagawa, J. Solid State Chem., 2004, 177, 461–465 CrossRef CAS.
- I. Mörke, V. Dvorák and P. Wachter, Solid State Commun., 1981, 40, 331–334 CrossRef.
- A. L. Goodwin, Phys. Rev. B, 2006, 74, 134302 CrossRef.
- L. Li, K. Refson and M. T. Dove, J. Phys.: Condens. Matter, 2020, 32, 465402 CrossRef CAS PubMed.
- J. D. Gale, J. Chem. Soc., Faraday Trans., 1997, 93, 629–637 RSC.
- J. D. Gale and A. L. Rohl, Mol. Simul., 2003, 29, 291–341 CrossRef CAS.
- C. W. Li, X. Tang, J. A. Muñoz, J. B. Keith, S. J. Tracy, D. L. Abernathy and B. Fultz, Phys. Rev. Lett., 2011, 107, 195504 CrossRef PubMed.
- W. G. Stirling, J. Phys. C: Solid State Phys., 1972, 5, 2711–2730 CrossRef CAS.
- H. Fang and M. T. Dove, Phys. Rev. B, 2013, 87, 214109 CrossRef.
- J. P. Attfield, Front. Chem., 2018, 6, 14441–14446 Search PubMed.
- R. Monnier and B. Delley, Phys. Rev. Lett., 2001, 87, 157204 CrossRef CAS PubMed.
- L. Li, C.-E. Hu, M. Tang, Y. Cheng and G.-F. Ji, Philos. Mag., 2017, 97, 1144–1156 CrossRef CAS.
Footnote |
| † Electronic supplementary information (ESI) available. See DOI: https://doi.org/10.1039/d3cp01306e |
| This journal is © the Owner Societies 2023 |