
 Open Access Article
 This Open Access Article is licensed under a
 Creative Commons Attribution 3.0 Unported Licence
Investigation of photoelectron elliptical dichroism for chiral analysis
Jason B.
Greenwood
 * and
Ian D.
Williams
* and
Ian D.
Williams
Centre for Laser Matter Interactions, School of Mathematics and Physics, Queen's University Belfast, Belfast, UK. E-mail: j.greenwood@qub.ac.uk
First published on 22nd May 2023
Abstract
This paper describes a compact new instrument, conceived specifically for measurements of Photo Electron Elliptical Dichroism (PEELD) and designed for simplicity of use as a prototype for a practical analytical device. PEELD is an asymmetry in the electron angular distribution obtained from resonantly enhanced multi-photon ionisation of a chiral molecule, where there is also a non-linear dependence on the polarization ellipticity. Despite the fact that PEELD can provide a unique signature of molecular structure and dynamics it has only been investigated in a few molecules to date. This is addressed in the present study in a range of measurements of several terpenes and phenyl-alcohols. These show that the PEELD signatures in structural isomers can be dramatically different and can also be influenced by the intensity of the light. A systematic study in phenyl-alcohols containing the same chromophore and chiral centre configuration shows consistent PEELD behaviour across the molecules except that the magnitude reduces as the distance from the chromophore to the chiral centre increases. These achievements demonstrate that this relatively simple set up can be used for scientific studies as well as providing a blueprint for a practical chiral analysis instrument.
Introduction
Chirality is a critical property of Life on Earth as the biological building blocks found in Nature, amino acids and sugars, are found almost exclusively with one handedness. Enantiomers are pairs of molecules which are mirror images that can’t be superimposed on one another by rotations and translations alone. As these molecules have the same chemical and physical properties, it is only through their interaction with another chiral structure or environment that they can be distinguished. This ‘handshaking’ dependence becomes very critical in living systems and needs to be carefully considered in the development of new pharmaceuticals, agrochemicals, pheromones, or fragrances.Chiroptical phenomena have been studied since the 19th century through differences in the real and imaginary refractive indicies for left and right circularly polarised light which result in optical rotation and absorption circular dichroism respectively. The latter is an example of how a chiral reagent, in this case the electric and magnetic fields which map out a helical pattern in space, is used to examine the handedness of a material. However, as there is a mismatch between the molecular scale and the wavelength of the light, this interaction is manifested weakly via interactions beyond the electric dipole approximation. As a result, while conventional chiroptical techniques are very important for enantiomeric and structural analysis, they are much slower and less sensitive than can be typically obtained in other types of gas phase analytical chemistry.
However, since the start of this century a number of new chiroptical phenomena have been discovered with intrinsically larger signals which could allow more sensitive enantiomeric differentiation. These include microwave three wave mixing,1–4 Coulomb explosion imaging,5–7 along with photoion circular dichroism (PICD)8–17 and photoelectron circular dichroism (PECD).12,13,18–62
PICD arises through the conventional absorption circular dichroism generated from excitation of an intermediate state, but PECD is manifested through the scattering of the photoelectron by the chiral molecular potential during ionization which generates a forward–backward asymmetry in the angular distribution. Therefore, while large PICD asymmetries (>1%) only exist for specific molecules or through selective excitation to specific vibrational states, these are ubiquitous for PECD and have been obtained in the single-photon, multiphoton, tunnelling, resonant and non-resonant ionization regimes.
For PICD measurements, differences in the total ionization rates are measured by changing the polarization from left to right circulation or the enantiomer from the R to S. This usually means that two separate measurements of the ion yield must be made for opposite polarizations which can introduce errors due to fluctuations in target density, laser parameters or imperfections in the quarter waveplate used to create the circular polarisation (although achiral reference molecules and some sophisticated setups have been used to mitigate these systematic errors).8,16
In contrast the PECD parameter G, which is the normalised difference between the forward to backward electron emission, can be directly measured using only one handedness of the circularly polarized light. Systematic uncertainties can then be minimised or eliminated by averaging with a second measurement taken with the opposite polarization.
The normalised photoelectron angular distribution, described by a partial wave expansion of the electron's wavefunction, results in an expression with 2N terms (where N is the number of photons absorbed and Pi are Legendre polynomials).63,64
 | (1) |
It is through the odd coefficients bi of this expansion that the PECD is expressed. They are non-zero only for chiral molecules irradiated with circularly/elliptically polarized light and change sign for the opposite handedness of the polarization or molecule. Subtraction of experimental data sets obtained with left- and right-circularly polarized light reveals the PECD signature of the molecule as a function of the emission angle θ.
The G parameter can be obtained by integrating the angular distribution over the forward and backward hemispheres. In eqn (1), for single ionization the summation only includes the first two terms yielding G = 2b1. A range of investigations of PECD have shown that it depends on the orbital ionized, the kinetic energy of the emitted electron,20,31,65,66 isomerization25,40,45,53 and conformation of the molecule,24,27,51,61,67 and the final vibrational state in the resulting cation.21,26,68 These show that PECD is a very sensitive probe of molecular properties.
For multiphoton ionization more terms contribute to the angular distribution. In this case, integration of the forward/backward emission, leads to
 | (2) |
The multiphoton ionization process is usually resonantly enhanced (REMPI) and the intermediate state(s) can strongly influence the photoelectron asymmetry. This sensitivity has been used to probe the ultrafast excited state dynamics in fenchone in separate experiments using a two-colour pump-probe scheme34,35 and by exploring how PECD evolves as a function of pulse length.52 Another experiment using a cooled molecular beam and a tuneable, narrowband nanosecond laser found that the PECD was not strongly dependent on the intermediate vibrational state populated, possibly due to the Rydberg nature of the resonance.44
Another important consequence of the population of an intermediate state is that the anisotropy of the excitation results in preferential ionization of molecules with certain orientations. Unlike single photon ionization, where intermediate states are bypassed, this can produce a non-linear dependence of G on the relative proportion of photons that are left- vs. right-circularly polarized (Stokes parameter S3/S0). To distinguish it from PECD this effect has been termed PhotoElectron ELliptical Dichroism (PEELD).40,43,50,56
When the excitation occurs by absorption of linearly polarised photons, molecules orientated with a transition dipole moment along the laser polarisation direction will be preferentially excited. However, for circularly polarized photons, it is molecules with their transition moments lying in the plane of polarization which are excited. Therefore, as S3/S0 changes, the anisotropy of the excitation also changes. Although the photoelectron asymmetry arises from the ionization step, scattering of the emerging electron is very strongly dependent on the molecular orientation and hence the measured asymmetry changes as the ellipticity of the laser pulse changes.
The first observation of PEELD was made in camphor at 400 nm33 and was subsequently validated in our own laboratory.56 A more detailed study of photoelectron angular distributions from camphor and fenchone as a function of pulse ellipticity, showed that this provides an additional observable which is sensitive to the molecular characteristics.40 By acquiring data while continuously varying the pulse ellipticity and performing Fourier analysis of the resulting signal, the chemical and chiral content of a mixture of compounds was demonstrated within a few seconds, without the need for any pre-separation or mass analysis. A follow-up paper observed PEELD signatures at two different wavelengths in S-ibuprofen, showing the potential for analysis of species of pharmaceutical interest.43
Controlling the anisotropy of the excitation in this way, has helped reveal subtle excited state couplings which can be hidden in conventional or even PECD spectroscopy.50 Despite this potential for uncovering molecular dynamics, or as a unique analysis tool, PEELD has yet to be studied more widely. The present article describes the design and implementation of a simple experimental set-up which has been used to characterise the nature of PEELD in a range of chiral molecules.
Apparatus
A variety of different experimental setups have been used to measure PECD/PEELD. For the first PECD measurement in 2001, two detectors with a limited angular acceptance were fixed at 180° to each other and could be rotated around the interaction point.19 With the development of Velocity Map Imaging (VMI) instruments it became possible to acquire the 3D angular distribution and energy spectrum of the photoelectrons from their 2D projection onto a position sensitive detector. This powerful technique has allowed PECD to be examined in exquisite detail.20,33,39,57,60,66,69 Alternatively, with a time-resolved spectrometer the 3D angular distribution can be retrieved directly as long as no more than one electron is emitted per laser pulse.29,32,40,46,48,70Although VMI instruments remain the gold standard for studies of PECD, stereo-detection has the advantage of directly extracting the signature G asymmetry parameter using a simpler setup and without the requirement for detailed analysis. For example, a microchannel plate (MCP) detector with a split anode has been used to measure single photon PECD from beams of anions.47 Single channel electron multipliers (CEM), which are more robust for practical applications than MCPs, have been used in our laboratory with a magnetic rather than an electric field to confine the angular spread of the photoelectrons.56 A uniform magnetic field was directed along the laser direction so that the electrons were confined radially while leaving their longitudinal momentum unchanged. In this way those electrons emitted into the forward and backward hemispheres drift apart until they reach an electric field which deflects each electron bunch out of the laser's path into their respective CEM detector.
This apparatus has been used to obtain formative insight on the nature of PECD/PEELD, including for non-volatile species which are more relevant for potential applications.43,71 The ability to quickly detect the enantiomeric excess (e.e.) in samples could be a valuable diagnostic for the discovery of enzymes or organic catalysts employed in asymmetric synthesis of pharmaceutical or other products.72 With such applications in mind, we have designed and built a stereo-detection instrument as a prototype for a practical analytical device. This second generation instrument has a more straightforward configuration than our previous design.
A schematic of the instrument is shown in Fig. 1. It consists of a 6-way KF50 cross pumped by a single turbomolecular pumping station (Agilent TPS-mini) to a base pressure of <10−7 mbar. At its centre sits a grounded stainless steel block with a 6 mm diameter channel into which a laser beam is focussed. An effusive gas jet crosses the laser at 90° through another channel in the block. Two coils in a Helmholtz configuration were placed with their centres concentric with the laser beam to generate a uniform field across the interaction region. A magnetic field strength of 30 Gauss is sufficient to confine all photoelectrons with kinetic energies up to 2 eV within the channel in the interaction block.
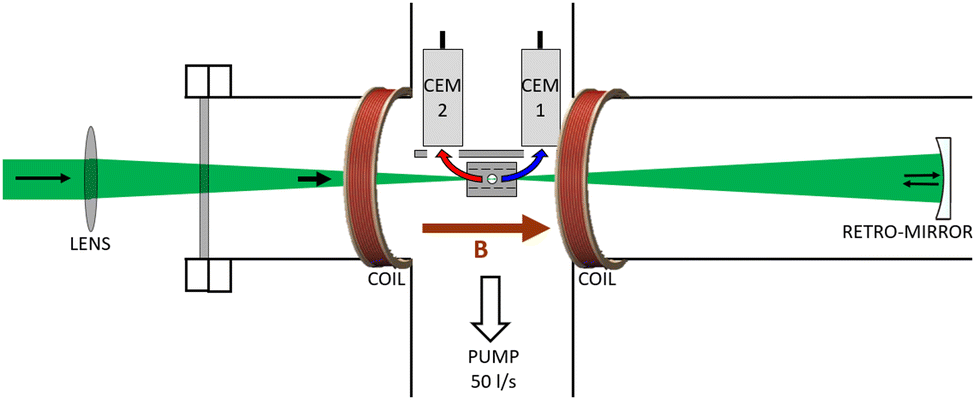 | ||
| Fig. 1 Schematic of the experimental set-up. Laser light at 520 nm is focussed by a plano-convex lens into the centre of a vacuum chamber where it crosses an effusive gas jet inside a grounded stainless steel block. Photoelectrons emitted in the forward (blue) and backward (red) hemispheres are initially confined along the laser axis by a magnetic field B generated by two current-carrying coils. Once each electron bunch emerges from the block they are each attracted by the positive bias on a channel electron multiplier detector (CEM1 and CEM2). A spherical mirror was inserted to reflect the laser pulses to increase the volume of gas exposed to the focussed pulses. | ||
Two Photonis CEM 5901 Magnum detectors operating in a counting mode were placed 11 mm from the laser axis on either side of the interaction block. The front surface of each was positively biased at 300–400 V to generate an electric field which deflected the electrons once they emerged from the grounded interaction block. In this way the counts integrated in the angular ranges 0–90° and 90–180° were measured in CEM 1 and CEM 2 respectively. A double pass configuration was utilised by placing a retro-reflecting spherical mirror (radius of curvature 200 mm) inside the vacuum chamber. This mirror was positioned so that the beam was re-focussed to the same longitudinal position but with the return focus shifted radially by about 100 μm from the original focus. As this reflection causes a reversal of both the light polarization and the forward/backward assignment of CEM 1 and 2, the same signal asymmetry was generated from both passes of the laser. In this way the signal rate could be doubled for the same target density.
While much of the spectroscopic detail is averaged out with this approach, by streamlining the design to include only the essential elements needed to measure PECD/PEELD, chiral analysis was achieved without the need for a complex instrument. The footprint of the vacuum system housing the apparatus, including the pumps, was 30 × 15 × 65 cm. The only power supplies required for operation were a 1 A constant current supply for the coils producing the magnetic field (Danntech DCCU) and two +4 kV supplies from a single computer controlled CAEN DT5533EP unit for the CEMs. Compared to our previous instrument,56 which is already much less complex and more compact than other experiments that use position sensitive detectors, the device in Fig. 1 requires fewer power supplies, a smaller vacuum chamber, and the overall setup occupies an order of magnitude smaller volume. Further details of the design can be found in a recent PhD thesis.71
To multiphoton ionize the target molecules, femtosecond laser pulses were obtained from a Spectra Physics Spirit HE 1040-30-SHG laser, based on an Yb3+ doped lasing medium operating at a fundamental wavelength of 1040 nm (dimensions: laser head 87.5 × 34 × 16 cm, power supply 60 × 56 × 75). For this study the second harmonic was used with a pulse length of 300 fs, pulse rates of 200 kHz or 1 MHz, and pulse energies up to 4 μJ. The linearly polarised 520 nm pulses passed through a half waveplate (Halle Optics) mounted in a Thorlabs SM05 fast stage capable of a rotational frequency of up to 5 Hz, followed by a fixed quarter waveplate (Halle). By rotating the half waveplate through an angle of 45°, measurements were taken alternately for left and right polarizations corresponding to the same S3/S0 magnitude. The polarisation at every half waveplate angle used for acquisition was measured using the rotating waveplate method.73 These values aligned closely with that expected from perfect waveplates. |S3/S0| = 0.99 was measured at angles where circular polarisation was expected.
The asymmetry parameter G was calculated from these measurements using eqn (3) which eliminates any imbalance in the relative detection efficiency of the CEMs (F and B correspond to counts in the forward and backward detectors and L and R the left- and right-handed polarization respectively).
 | (3) |
The laser pulses were focussed down to a focal waist diameter of 30 μm by a plano-convex lens with a focal length of 150 mm, generating intensities up to 3 × 10¹² W cm−2. The target gas density was adjusted to produce a count rate of about 20 kHz in each CEM which was 10% of the laser repetition rate. All samples in the study were acquired commercially and used without further purification. The quoted chemical purity for all samples was at least 97% but most did not have a certificate of their enantiomeric purity.
For one complete rotation of the half waveplate, there are 8 angles corresponding to the same value of S3/S0 and another 8 for the opposite polarization −S3/S0. To obtain G for a particular value of |S3/S0|, data was acquired for a short period (typically 0.5 s) at one waveplate angle corresponding to the positive S3/S0 value. The angle was then changed by 45° to acquire with the opposite polarization. This was done for all 8 |S3/S0| pairs and then repeated but in the reverse order, i.e. negative followed by positive. Due to the high speed of the rotational stage this could be achieved without any significant dead-time. Therefore, using eqn (3), 16 measurements of G were obtained in a way which minimised any systematic uncertainties due to drifts in the target gas density, laser power or small imperfections in the waveplate. The average value of G and standard deviation were then calculated allowing updates to be displayed approximately every 20 seconds.
This process was repeated multiple times and an overall weighted mean and standard error calculated. For an acquisition time of 4 minutes an uncertainty in G of 0.1% was typically obtained. This potential for rapid chiral identification could be a valuable tool for in situ monitoring of chemical processes.
Results and discussion
Instrument validation – fenchone
To validate the performance of the new instrument, G was measured as a function of |S3/S0| for 1S,4R-(+)-fenchone, with and without the retro-reflecting mirror. These results, shown in Fig. 2, are in very good agreement with each other, demonstrating that multiple passes of a laser pulse through the target gas can be used to increase signal rates while maintaining the same value of G. By introducing multiple reflections with a cavity-type arrangement, further enhancements could in principle be made to the signal rate. | ||
| Fig. 2 PECD asymmetry parameter G as a function of the degree of circular polarization in the laser pulse for (+)-Fenchone with (blue squares) and without (red triangles) a retro-reflecting mirror. The error bars are one standard error of the mean. Weighted best fit lines are plotted using the function G = ax + bx3 + cx5 + dx7 (x = |S3/S0|). | ||
For fenchone at 520 nm, ionization proceeds by 3 + 1 photon absorption via states around 7.2 eV above the ground state (the vertical ionization energy is 8.6 eV),74 so that the electrons take away roughly 1.0 eV of kinetic energy. No change in the value of G was found when the magnetic field was varied in the range 25–75 Gauss indicating all the photoelectrons were being channelled into the detectors. The PEELD effect is evident from the non-linear dependence on |S3/S0| and shows that the largest asymmetry is not always obtained with circular polarization.
Fig. 3 compares data for both fenchone enantiomers measured at intensities of: (a) 3 × 10¹¹ W cm−2; (b) 3 × 10¹² W cm−2. As expected, the enantiomers had the same PEELD dependence but with opposite asymmetry. However, the overall magnitude of G is lower for (−)-fenchone than (+)-fenchone, indicating that the (−)-fenchone sample had a lower enantiomeric purity. To measure this difference, each G vs. |S3/S0| data set was fitted with an odd polynomial weighted by the reciprocal of the variance of each data point. Assuming an e.e. of 100% for the (+) sample, for each intensity enantiomeric excesses of: (a) 66.5 ± 3%; (b) 72.0 ± 6%; were obtained. Both these measurements are in good agreement with our previous estimate for this sample of 66 ± 5% using a different instrument.56
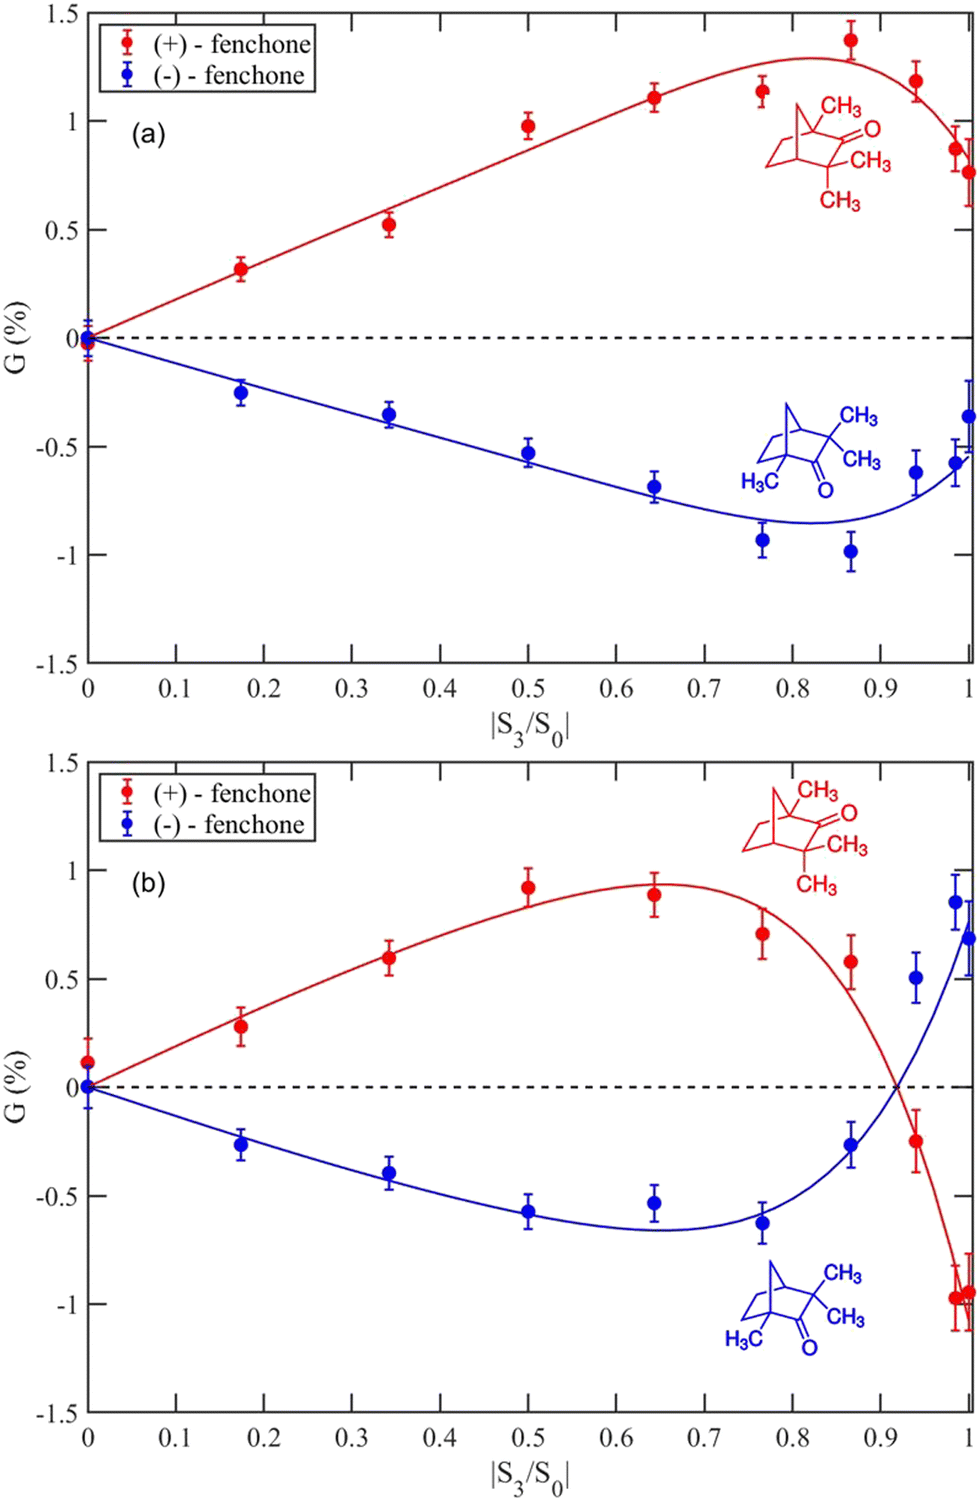 | ||
| Fig. 3 G measured for the (+)-Fenchone (red) and (−)-Fenchone (blue) yielding an e.e. of the (−) enantiomer of: (a) 66.5 ± 3% for an intensity of 3 × 10¹¹ W cm−2; (b) 72.0 ± 6% for an intensity of 3 × 10¹² W cm−2. | ||
Fig. 3 also illustrates that when the intensity was increased by a factor of 10, there was a dramatic change in the PEELD resulting in a change of sign as circular polarization was approached. This intensity dependence indicates that overlapping intermediate states are undergoing Stark mixing, which changes the relative populations of these states. This results in different molecular orientations being preferentially excited and the resulting photoelectron angular distribution is changed. This intensity dependence is in good agreement with measurements made with a VMI instrument at a similar laser wavelength (515 nm).40
α-Pinene and β-pinene
The PECD of the alpha and beta isomers of pinene have previously been studied by single photon ionization just above their ionization threshold75 and α-pinene has also been studied by 2 + 1 ionization for a range of wavelengths from 371–407 nm.49 Very large asymmetries of almost 40% were found for single photon ionization and 10% or lower for the REMPI measurements.The vertical ionization energies of these isomers are 8.6 eV and 9.0 eV.76 Their rigid structures mean that only one conformer is present at room temperature and the ground state is a π state localised around the double bond. The first excited state lies 5.7 eV76 above the ground state and hence ionization with 520 nm proceeds via 3 + 1 photon absorption. PEELD measurements for both enantiomers of α-pinene, Fig. 4a, shows that at least one is not enantiomerically pure. Fitting to the data indicates that (−)-α-pinene has an e.e. of 77.9 ± 3% relative to that of (+)-α-pinene.
 | ||
| Fig. 4 G measured at 3 × 10¹¹ W cm−2 for pinene; (a) enantiomers of α-pinene yielding e.e. = 77.9 ± 3% for the sample of (−)-α-pinene (blue); (b) isomers (−)-α-pinene (blue), (−)-β-pinene at 3 × 10¹¹ W cm−2 (black) and 6 × 10¹¹ W cm−2 (purple). | ||
A non-linear PEELD was also found for the isomers (1S,5S)-(−)-α-pinene and (1S,5S)-(−)-β-pinene but was stronger in the latter (Fig. 4b). They have very similar structures, with the only difference being that the double bond is shifted from the ring to the nearest methyl group with concomitant switch of a hydrogen, causing a dramatic change in asymmetry.
The PEELD of β-pinene also shows a slight dependence on intensity but, unlike fenchone, not when the polarization is fully circular. This suggests that a broader range of states are already being populated by absorption of circularly polarized photons in weak fields, hence there is no change in the populations when the intensity is increased.
Phenyl-alcohols
Due to the presence of the phenyl chromophore in these molecules, the π–π* transition around 250–270 nm means that ionization proceeds via a 2 + 1 + 1 scheme. PEELD measurements for the R enantiomers of 1-phenylethanol, 1-phenyl-2-propanol and 4-phenyl-2-butanol are shown in Fig. 5a. In these three molecules the ionization site and the chiral centre are the same but their physical separation changes. | ||
| Fig. 5 G measured at 3 × 10¹¹ W cm−2 for phenyl-alcohol molecules. (a) 1-phenylethanol (blue), 1-phenyl-2-propanol (red), 4-phenyl-2-butanol (black). There is a linear fit to each with gradients: 2.16 ± 0.05%; 0.74 ± 0.04%; 0.00 ± 0.04%. The samples of 1-phenyl-2-propanol and 4-phenyl-2-butanol each had a certificate for optical purity of 99%. (b) 1-phenyl-2-propanol (red), 2-phenyl-1-propanol (green). | ||
It is noticeable that as the molecule lengthens, the magnitude of G reduces, with no asymmetry observed outside the uncertainties for the largest molecule (<0.04%). This suggests that since the electron is ionized from the chromophore, the effect of the chiral molecular potential is reduced as the separation of the chiral centre and chromophore increases. An alternative explanation is that larger molecules have more conformers present which would tend to reduce the asymmetry when averaged over the ensemble. For the room temperature gas used, two conformers were significantly populated for 1-phenyl-2-propanol77 and more were likely to be present for 4-phenyl-2-butanol. However, recent studies of large molecules have shown that there is not much evidence for PECD being averaged to zero when multiple conformers are populated. For example G = 7% was obtained from a phenylalanine target with as many as six conformers significantly populated and asymmetry was still observed (G = 0.5%) for a peptide consisting of 15 amino acids.51
Unlike the rest of our results, for these three molecules PEELD was absent as the data had a linear dependence at the level of the uncertainties achieved. This suggests that either there is limited excitation anisotropy or the emission asymmetry in the ionization step is weakly dependent on molecular orientation. As there are two intermediate resonances, the transition moments of these excitations may be in different directions and a more isotropically distributed excitation of the ensemble might be achieved prior to the final ionization step. However, a previous measurement of 1-phenylethanol at 260 nm (1 + 1 ionisation) in our lab was also found to have a linear dependence.41
When our target was switched from (R)-1-phenyl-2-propanol to its isomer (R)-2-phenyl-1-propanol (Fig. 5b), G became non-linear and changed sign. This suggests PECD/PEELD can become more sensitive to the molecular orientation after a small structural change. Theoretical calculations have shown that PECD is generally highly dependent on molecular orientation.48,78,79
Conclusions
In this paper, we have demonstrated that a stripped back photoelectron stereo-detection set-up is capable of measuring relative enantiomeric excesses in chiral molecules while also providing evidence for the underlying photoelectron emission mechanisms. By studying a number of different terpenes and phenyl-alcohols, we have shown that these asymmetries are usually strongly dependent on the degree of ellipticity of the ionizing laser pulse when an intermediate excited state is populated (the PEELD effect). This is due to the strong orientation dependence of the photoangular distribution following anisotropic excitation of randomly orientated molecules.We also have shown that PECD and PEELD can be influenced by the laser intensity, something which has not been commonly investigated to date. Most PECD studies have used laser pulses at 400 nm (3.1 eV) which access excited states at 6.2 eV above the ground state via a 2 + 1 ionization process. In the present study, a lower photon energy (2.4 eV) gives a higher excitation energy (7.2 eV) where overlap of multiple states is more likely and Stark mixing makes the asymmetry parameter G sensitive to the electric field strength of the laser.
In some molecules this intensity dependence may limit the precision obtainable with PECD/PEELD for absolute measurements of the enantiomeric excess (e.e.). However, PECD/PEELD could have a bigger impact for new applications where fast sampling is needed such as for in situ analysis or when a high sample throughput is required, something that is not possible with existing technology. Such uses will require the PEELD of molecules of interest to be properly characterised so that the optimum polarization state for measurements can be identified.
The dependence of the photoelectron asymmetry on the ellipticity, wavelength, intensity, and isomerization will also provide a unique molecular signature which could be used to extract chiral and chemical information from a mixture of compounds. From this perspective the instrument described in this paper provides a template for the implementation of a practical chiral analysis instrument. The simple design has a small footprint, with a single integrated vacuum pump, minimal electronics, and real-time data analysis. The largest part of the current set-up is the laser but with continuing advances in technology, reliable and more compact systems will become available so that a commercial PECD/PEELD chiral analysis spectrometer could become available in the near future.
Author contributions
The conceptualization of this study was primarily undertaken by JBG with contributions from IDW. The instrument design, construction and validation was undertaken by JBG. The data acquisition was performed by both authors and the data analysis by JBG. JBG wrote the original draft of the paper which was reviewed and edited by IDW.Conflicts of interest
There are no conflicts to declare.Acknowledgements
This work was supported by the Royal Society (UK) Paul Instrument Fund grant PI170043.References
- M. D. Marshall, H. O. Leung, S. R. Domingos, A. Krin, M. Schnell, N. A. Seifert, Y. Xu and W. Jager, Phys. Chem. Chem. Phys., 2022, 24, 28495–28505 RSC.
- D. Patterson, M. Schnell and J. M. Doyle, Nature, 2013, 497, 475–477 CrossRef CAS PubMed.
- V. A. Shubert, D. Schmitz, D. Patterson, J. M. Doyle and M. Schnell, Angew. Chem., Int. Ed., 2014, 53, 1152–1155 CrossRef CAS PubMed.
- A. K. Patterson, L. H. El-Qarra and D. K. Smith, Chem. Commun., 2022, 58, 3941–3944 RSC.
- M. Pitzer, R. Berger, J. Stohner, R. Dorner and M. Schoffler, Chimia, 2018, 72, 384–388 CrossRef CAS PubMed.
- M. Pitzer, K. Fehre, M. Kunitski, T. Jahnke, L. Schmidt, H. Schmidt-Bocking, R. Dorner and M. Schoffler, J. Visualized Exp., 2017, 126, e56062 Search PubMed.
- M. Pitzer, M. Kunitski, A. S. Johnson, T. Jahnke, H. Sann, F. Sturm, L. P. Schmidt, H. Schmidt-Bocking, R. Dorner, J. Stohner, J. Kiedrowski, M. Reggelin, S. Marquardt, A. Schiesser, R. Berger and M. S. Schoffler, Science, 2013, 341, 1096–1100 CrossRef CAS PubMed.
- U. Boesl and A. Kartouzian, Annu. Rev. Anal. Chem., 2016, 9, 343–364 CrossRef CAS PubMed.
- U. Boesl von Grafenstein and A. Bornschlegl, ChemPhysChem, 2006, 7, 2085–2087 CrossRef PubMed.
- H. G. Breunig, G. Urbasch, P. Horsch, J. Cordes, U. Koert and K. M. Weitzel, Chem. Phys. Chem., 2009, 10, 1199–1202 CrossRef CAS PubMed.
- C. Jeong, H. J. Eun, J. Yun and N. J. Kim, J. Phys. Chem. A, 2022, 126, 4295–4299 CrossRef CAS PubMed.
- C. S. Lehmann, D. Botros and K. M. Weitzel, Phys. Chem. Chem. Phys., 2022, 24, 15904–15911 RSC.
- C. S. Lehmann and K. M. Weitzel, Phys. Chem. Chem. Phys., 2020, 22, 13707–13712 RSC.
- J. Lepelmeier, J. L. Alonso-Gomez, F. Mortaheb, U. Boesl, U. Heiz and A. Kartouzian, Phys. Chem. Chem. Phys., 2017, 19, 21297–21303 RSC.
- J. Lepelmeier, K. Titze, A. Kartouzian, U. Boesl and U. Heiz, Chem. Phys. Chem., 2016, 17, 4052–4058 CrossRef CAS PubMed.
- T. Ring, C. Witte, S. Vasudevan, S. Das, S. T. Ranecky, H. Lee, N. Ladda, A. Senftleben, H. Braun and T. Baumert, Rev. Sci. Instrum., 2021, 92, 033001 CrossRef CAS PubMed.
- K. Titze, T. Zollitsch, U. Heiz and U. Boesl, Chem. Phys. Chem., 2014, 15, 2762–2767 CrossRef CAS PubMed.
- S. Stranges, S. Turchini, M. Alagia, G. Alberti, G. Contini, P. Decleva, G. Fronzoni, M. Stener, N. Zema and T. Prosperi, J. Chem. Phys., 2005, 122, 244303 CrossRef CAS PubMed.
- N. Bowering, T. Lischke, B. Schmidtke, N. Muller, T. Khalil and U. Heinzmann, Phys. Rev. Lett., 2001, 86, 1187–1190 CrossRef CAS PubMed.
- L. Nahon, G. A. Garcia, C. J. Harding, E. Mikajlo and I. Powis, J. Chem. Phys., 2006, 125, 114309 CrossRef PubMed.
- G. A. Garcia, L. Nahon, S. Daly and I. Powis, Nat. Commun., 2013, 4, 2132 CrossRef PubMed.
- G. A. Garcia, H. Dossmann, L. Nahon, S. Daly and I. Powis, Phys. Chem. Chem. Phys., 2014, 16, 16214–16224 RSC.
- M. Tia, B. Cunha de Miranda, S. Daly, F. Gaie-Levrel, G. A. Garcia, L. Nahon and I. Powis, J. Phys. Chem. A, 2014, 118, 2765–2779 CrossRef CAS PubMed.
- S. Daly, M. Tia, G. A. Garcia, L. Nahon and I. Powis, Angew. Chem., Int. Ed., 2016, 55, 11054–11058 CrossRef CAS PubMed.
- L. Nahon, L. Nag, G. A. Garcia, I. Myrgorodska, U. Meierhenrich, S. Beaulieu, V. Wanie, V. Blanchet, R. Geneaux and I. Powis, Phys. Chem. Chem. Phys., 2016, 18, 12696–12706 RSC.
- M. M. Rafiee Fanood, H. Ganjitabar, G. A. Garcia, L. Nahon, S. Turchini and I. Powis, ChemPhysChem, 2018, 19, 921–933 CrossRef CAS PubMed.
- J. Dupont, V. Lepere, A. Zehnacker, S. Hartweg, G. A. Garcia and L. Nahon, J. Phys. Chem. Lett., 2022, 13, 2313–2320 CrossRef CAS PubMed.
- C. Lux, M. Wollenhaupt, T. Bolze, Q. Liang, J. Kohler, C. Sarpe and T. Baumert, Angew. Chem., Int. Ed., 2012, 51, 5001–5005 CrossRef CAS PubMed.
- C. S. Lehmann, N. B. Ram, I. Powis and M. H. Janssen, J. Chem. Phys., 2013, 139, 234307 CrossRef PubMed.
- M. H. Janssen and I. Powis, Phys. Chem. Chem. Phys., 2014, 16, 856–871 RSC.
- M. M. Rafiee Fanood, I. Powis and M. H. Janssen, J. Phys. Chem. A, 2014, 118, 11541–11546 CrossRef CAS PubMed.
- M. M. Fanood, N. B. Ram, C. S. Lehmann, I. Powis and M. H. Janssen, Nat. Commun., 2015, 6, 7511 CrossRef CAS PubMed.
- C. Lux, M. Wollenhaupt, C. Sarpe and T. Baumert, ChemPhysChem, 2015, 16, 115–137 CrossRef CAS PubMed.
- S. Beaulieu, A. Comby, B. Fabre, D. Descamps, A. Ferre, G. Garcia, R. Geneaux, F. Legare, L. Nahon, S. Petit, T. Ruchon, B. Pons, V. Blanchet and Y. Mairesse, Faraday Discuss., 2016, 194, 325–348 RSC.
- A. Comby, S. Beaulieu, M. Boggio-Pasqua, D. Descamps, F. Legare, L. Nahon, S. Petit, B. Pons, B. Fabre, Y. Mairesse and V. Blanchet, J. Phys. Chem. Lett., 2016, 7, 4514–4519 CrossRef CAS PubMed.
- A. Kastner, C. Lux, T. Ring, S. Zullighoven, C. Sarpe, A. Senftleben and T. Baumert, ChemPhysChem, 2016, 17, 1119–1122 CrossRef CAS PubMed.
- M. M. Rafiee Fanood, M. H. Janssen and I. Powis, J. Chem. Phys., 2016, 145, 124320 CrossRef PubMed.
- A. Kastner, T. Ring, B. C. Kruger, G. B. Park, T. Schafer, A. Senftleben and T. Baumert, J. Chem. Phys., 2017, 147, 013926 CrossRef PubMed.
- S. Beaulieu, A. Comby, D. Descamps, S. Petit, F. Legare, B. Fabre, V. Blanchet and Y. Mairesse, J. Chem. Phys., 2018, 149, 134301 CrossRef CAS PubMed.
- A. Comby, E. Bloch, C. M. M. Bond, D. Descamps, J. Miles, S. Petit, S. Rozen, J. B. Greenwood, V. Blanchet and Y. Mairesse, Nat. Commun., 2018, 9, 5212 CrossRef CAS PubMed.
- C. M. M. Bond and J. B. Greenwood, J. Phys.: Conf. Ser., 2019, 1289, 012027 CrossRef CAS.
- A. Kastner, T. Ring, H. Braun, A. Senftleben and T. Baumert, Chem. Phys. Chem., 2019, 20, 1416–1419 CAS.
- A. Comby, C. M. M. Bond, E. Bloch, D. Descamps, B. Fabre, S. Petit, Y. Mairesse, J. B. Greenwood and V. Blanchet, Chirality, 2020, 32, 1225–1233 CrossRef CAS PubMed.
- A. Kastner, G. Koumarianou, P. Glodic, P. C. Samartzis, N. Ladda, S. T. Ranecky, T. Ring, S. Vasudevan, C. Witte, H. Braun, H. G. Lee, A. Senftleben, R. Berger, G. B. Park, T. Schafer and T. Baumert, Phys. Chem. Chem. Phys., 2020, 22, 7404–7411 RSC.
- V. Blanchet, D. Descamps, S. Petit, Y. Mairesse, B. Pons and B. Fabre, Phys. Chem. Chem. Phys., 2021, 23, 25612–25628 RSC.
- K. Fehre, S. Eckart, M. Kunitski, C. Janke, D. Trabert, M. Hofmann, J. Rist, M. Weller, A. Hartung, L. P. H. Schmidt, T. Jahnke, H. Braun, T. Baumert, J. Stohner, P. V. Demekhin, M. S. Schoffler and R. Dorner, Phys. Rev. Lett., 2021, 126, 083201 CrossRef CAS PubMed.
- P. Kruger and K. M. Weitzel, Angew. Chem., Int. Ed., 2021, 60, 17861–17865 CrossRef PubMed.
- G. Nalin, K. Fehre, F. Trinter, N. M. Novikovskiy, N. Anders, D. Trabert, S. Grundmann, M. Kircher, A. Khan, R. Tomar, M. Hofmann, M. Waitz, I. Vela-Perez, G. Kastirke, J. Siebert, D. Tsitsonis, H. Fukuzawa, K. Ueda, J. B. Williams, D. Kargin, M. Maurer, C. Kustner-Wetekam, L. Marder, J. Viehmann, A. Knie, T. Jahnke, M. Ilchen, R. Dorner, R. Pietschnig, P. V. Demekhin and M. S. Schoffler, Phys. Chem. Chem. Phys., 2021, 23, 17248–17258 RSC.
- D. P. Singh, J. O. F. Thompson, K. L. Reid and I. Powis, J. Phys. Chem. Lett., 2021, 12, 11438–11443 CrossRef CAS PubMed.
- S. Beauvarlet, E. Bloch, D. Rajak, D. Descamps, B. Fabre, S. Petit, B. Pons, Y. Mairesse and V. Blanchet, Phys. Chem. Chem. Phys., 2022, 24, 6415–6427 RSC.
- P. Kruger, J. H. Both, U. Linne, F. Chirot and K. M. Weitzel, J. Phys. Chem. Lett., 2022, 13, 6110–6116 CrossRef PubMed.
- H. G. Lee, S. T. Ranecky, S. Vasudevan, N. Ladda, T. Rosen, S. Das, J. Ghosh, H. Braun, D. M. Reich, A. Senftleben and T. Baumert, Phys. Chem. Chem. Phys., 2022, 24, 27483–27494 RSC.
- S. T. Ranecky, G. B. Park, P. C. Samartzis, I. C. Giannakidis, D. Schwarzer, A. Senftleben, T. Baumert and T. Schafer, Phys. Chem. Chem. Phys., 2022, 24, 2758–2761 RSC.
- M. D. J. Waters, N. Ladda, A. Senftleben, V. Svoboda, M. Belozertsev, T. Baumert and H. J. Worner, Chem. Phys. Chem., 2022, 23, e202200575 CrossRef CAS PubMed.
- I. Powis, Chirality, 2008, 20, 961–968 CrossRef CAS PubMed.
- J. Miles, D. Fernandes, A. Young, C. M. M. Bond, S. W. Crane, O. Ghafur, D. Townsend, J. Sa and J. B. Greenwood, Anal. Chim. Acta, 2017, 984, 134–139 CrossRef CAS PubMed.
- C. Sparling, A. Ruget, N. Kotsina, J. Leach and D. Townsend, ChemPhysChem, 2021, 22, 76–82 CrossRef CAS PubMed.
- C. Sparling, S. W. Crane, L. Ireland, R. Anderson, O. Ghafur, J. B. Greenwood and D. Townsend, Phys. Chem. Chem. Phys., 2023, 25, 6009–6015 RSC.
- I. Powis, Adv. Chem. Phys., 2008, 138, 267–329 CrossRef CAS.
- J. Triptow, A. Fielicke, G. Meijer and M. Green, Angew. Chem., Int. Ed., 2023, 62, e202212020 CrossRef CAS PubMed.
- R. Hadidi, D. K. Bozanic, H. Ganjitabar, G. A. Garcia, I. Powis and L. Nahon, Commun. Chem., 2021, 4, 72 CrossRef CAS PubMed.
- S. T. Ranecky, G. B. Park, P. C. Samartzis, I. C. Giannakidis, D. Schwarzer, A. Senftleben, T. Baumert and T. Schafer, Phys. Chem. Chem. Phys., 2022, 24, 2758–2761 RSC.
- B. Ritchie, Phys. Rev. A: At., Mol., Opt. Phys., 1976, 13, 1411 CrossRef.
- K. L. Reid, Annu. Rev. Phys. Chem., 2003, 54, 397–424 CrossRef CAS PubMed.
- C. Lux, A. Senftleben, C. Sarpe, M. Wollenhaupt and T. Baumert, J. Phys. B: At., Mol. Opt. Phys., 2016, 49, 02LT01 CrossRef.
- S. Beaulieu, A. Ferré, R. Géneaux, R. Canonge, D. Descamps, B. Fabre, N. Fedorov, F. Légaré, S. Petit, T. Ruchon, V. Blanchet, Y. Mairesse and B. Pons, New J. Phys., 2016, 18, 102002 CrossRef.
- G. A. Garcia, L. Nahon, C. J. Harding and I. Powis, Phys. Chem. Chem. Phys., 2008, 10, 1628–1639 RSC.
- H. Ganjitabar, G. A. Garcia, L. Nahon and I. Powis, J. Chem. Phys., 2020, 153, 034302 CrossRef CAS PubMed.
- C. Sparling and D. Townsend, J. Chem. Phys., 2022, 157, 114201 CrossRef CAS PubMed.
- K. Fehre, N. M. Novikovskiy, S. Grundmann, G. Kastirke, S. Eckart, F. Trinter, J. Rist, A. Hartung, D. Trabert, C. Janke, G. Nalin, M. Pitzer, S. Zeller, F. Wiegandt, M. Weller, M. Kircher, M. Hofmann, L. P. H. Schmidt, A. Knie, A. Hans, L. B. Ltaief, A. Ehresmann, R. Berger, H. Fukuzawa, K. Ueda, H. Schmidt-Bocking, J. B. Williams, T. Jahnke, R. Dorner, M. S. Schoffler and P. V. Demekhin, Phys. Rev. Lett., 2021, 127, 103201 CrossRef CAS PubMed.
- C. M. M. Bond, PhD thesis, Queen's UniversityBelfast, 2021.
- J. Nazor, J. Liu and G. Huisman, Curr. Opin. Biotechnol, 2021, 69, 182–190 CrossRef CAS PubMed.
- B. Schaefer, E. Collett, R. Smyth, D. Barrett and B. Fraher, Am. J. Phys., 2007, 75, 163–168 CrossRef.
- I. Powis, C. J. Harding, G. A. Garcia and L. Nahon, ChemPhysChem, 2008, 9, 475–483 CrossRef CAS PubMed.
- H. Ganjitabar, R. Hadidi, G. A. Garcia, L. Nahon and I. Powis, J. Mol. Spectrosc., 2018, 353, 11–19 CrossRef CAS.
- D. Kubala, E. A. Drage, A. M. E. Al-Faydhi, J. Kocisek, P. Papp, V. Matejcik, P. Mach, J. Urban, P. Limao-Vieira, S. V. Hoffmann, S. Matejcik and N. J. Mason, Int. J. Mass Spectrom., 2009, 280, 169–173 CrossRef CAS.
- M. J. Tubergen, R. J. Lavrich, D. F. Plusquellic and R. D. Suenram, J. Phys. Chem. A, 2006, 110, 13188–13194 CrossRef CAS PubMed.
- K. Fehre, S. Eckart, M. Kunitski, C. Janke, D. Trabert, M. Hofmann, J. Rist, M. Weller, A. Hartung, L. P. H. Schmidt, T. Jahnke, H. Braun, T. Baumert, J. Stohner, P. V. Demekhin, M. S. Schöffler and R. Dörner, Phys. Rev. Lett., 2021, 126, 083201 CrossRef CAS PubMed.
- M. Tia, M. Pitzer, G. Kastirke, J. Gatzke, H. K. Kim, F. Trinter, J. Rist, A. Hartung, D. Trabert, J. Siebert, K. Henrichs, J. Becht, S. Zeller, H. Gassert, F. Wiegandt, R. Wallauer, A. Kuhlins, C. Schober, T. Bauer, N. Wechselberger, P. Burzynski, J. Neff, M. Weller, D. Metz, M. Kircher, M. Waitz, J. B. Williams, L. P. H. Schmidt, A. D. Muller, A. Knie, A. Hans, L. Ben Ltaief, A. Ehresmann, R. Berger, H. Fukuzawa, K. Ueda, H. Schmidt-Bocking, R. Dorner, T. Jahnke, P. V. Demekhin and M. Schoffler, J. Phys. Chem. Lett., 2017, 8, 2780–2786 CrossRef CAS PubMed.
| This journal is © the Owner Societies 2023 |