 Open Access Article
Tribochemically driven dehydrogenation of undoped sodium alanate under room temperature†‡
Esmeralda
Muñoz-Cortés
 a,
Olga L.
Ibryaeva
 b,
Miguel
Manso Silvan
 c,
Borja
Zabala
 d,
Eduardo
Flores
 e,
Almudena
Gutierrez
 f,
Jose Ramon
Ares
 a and
Roman
Nevshupa
 *f
*f
aDepartment of Physics of Materials, Universidad Autónoma de Madrid, Spain
bDepartment of Applied Mathematics and Computer Science, South Ural State University, Chelyabinsk, Russia
cDepartment of Applied Physics, Nicolás Cabrera Institute and Centre for Microanalysis of Materials, Universidad Autónoma de Madrid, Spain
dTribology & Materials Unit, Fundación Tekniler, Eibar, Spain
eDepartamento de Física Aplicada, Centro de Investigación y de Estudios Avanzados (CINVESTAV), 97310, Mérida, Mexico
fEduardo Torroja Institute of Construction Sciences (IETCC), CSIC, Madrid, Spain. E-mail: r.nevshupa@csic.es; Tel: +34 91103 5746
First published on 1st December 2022
Abstract
An application of mechanical energy was explored as a new non-thermal method to drive H2 emission from undoped sodium alanate at room temperature. It was found that mild rubbing of NaAlH4 pellets under vacuum led to intensive and almost instantaneous gas emission. The dominating species in the emitted gases was H2 (>99%). Traces of mono- and polyalanes, NaAlH4 vapours, CO2 and other non-identified gases were registered. H2 emission involved several first-order processes, whose characteristic time constants ranged widely from 0.6 to 465 s. None of the dehydrogenation reactions could be connected to either the thermal effect of friction or the direct coupling of mechanical forces to the energy landscape of chemical reactions. In turn, it was suggested that the tribochemical reactions can be triggered by plastic deformation and shearing. A linked diffusion-wear model of NaAlH4 triboinduced dehydrogenation, which consistently explains all empirical findings, was put forward.
1 Introduction
Alkali metal alanates are a class of materials containing anionic metal complexes [AlH4]− and alkali metal cations (Li, Na, K). Among them, sodium alanate (NaAlH4) has the most attractive combination of thermodynamic properties and capacity for hydrogen storage (5.6 wt% H2) which makes it a promising candidate for hydrogen energy applications.1 For alkaline alanates, the hydrogen release usually occurs in three consecutive thermally activated reactions ((R1)–(R3)) being (R1) and (R2) the most interesting for typical applications: | (R1) |
 | (R2) |
 | (R3) |
A large variety of alternative strategies pursuing the further enhancement of de- and hydrogenation performance of alkali alanates has been explored so far. Such strategies employ doping with selected transition metals,4,5 adding metal chlorides, fluorides and oxides, decreasing the crystal size by mechanical milling,6,7 confining within nanopores and nanostructures,8–11 and supporting on 2D carbon allotropes12 among others. Despite enormous efforts made during the last two decades, the physical-chemical mechanisms of NaAlH4 dehydrogenation/hydrogenation remain under debate, and the corresponding hydrogen storage technology has not yet reached the readiness level sufficient for its commercial use. In this context, exploring different approaches and less conventional methods can be useful to extend the horizons of research and, in the end, find an efficient and effective solution to the problem of solid-state hydrogen storage.
One such approach is based on the employment of non-thermal energies such as mechanical, photo, and microwave.13 In the past our group explored the effectiveness of mechanical energy in driving dehydrogenation of MgH2 being one of the most stable hydrides.14 The results were striking since a high degree of dehydrogenation (>70%) was achieved by mild rubbing under vacuum at room temperature. These results manifest the peculiar role that tribophysical15,16 and tribochemical17 processes may have for driving dehydrogenation of hydrides at room temperature though they seem to contradict other findings such as the lack of any considerable signs of MgH2 dehydrogenation when it is ball-milled under an inert atmosphere18 or the existence of an opposite reaction of ball-milling assisted synthesis of MgH2 from Mg under H2.19 Rubbing is playing the key role since it produces intensive shearing of surface layers under relatively low loads and well-defined load-speed conditions. This is distinct from a conventional ball-milling process, which involves a larger contribution of impact and larger dispersion of local load-speed conditions. Also, in comparison with ball milling, mild friction causes a notably smaller increase in surface temperature.16 In our previous study, the instant “flash” increase of temperature on local spots of MgH2 hardly exceeded 320 K, which was far below the temperature required for its thermally activated dehydrogenation (≥570 K). Apparently, a vacuum environment is another important factor since it promotes the escape of H2 from the material subjected to mechanical deformation and decreases the rate of the opposite reaction. These observations are in line with the broader tribochemical perspective,14,16,20,21 in which most mechanochemical reactions conducted under mild rubbing conditions are considered non-thermally driven, while the activation mechanisms are related to bond tension and twisting, reduction of potential barriers, interactions with crystal defects and dislocations, electric charge generation, and exo-electron emission among other processes.22–24
From the standpoint of mechanochemical phenomenology, there are certain similarities between alkali alanates and MgH2: both MgH2 and NaAlH4 are stable under mechanical milling25 and can be formed by mechanochemical synthesis from metal precursors under a H2 atmosphere.26,27 Here, the question arises of whether NaAlH4 is as susceptible to tribochemical dehydrogenation as MgH2 is under similar conditions.
The study presented in this work was aimed at exploring, for the first time, the non-thermal dehydrogenation processes for sodium alanate. The dehydrogenation reactions were studied on a micrometre scale using localized rubbing under ultrahigh vacuum. Mechanically Stimulated Gas Emission Mass-Spectrometry (MSGE-MS) was used to determine the kinetic parameters of dehydrogenation as well as the composition and emission behaviour of trace gases, in operando conditions, in accordance with a previously developed original method.28,29 It was complemented by structural, morphological and surface analyses, and modelling to unveil how elemental chemical reactions and gas transport in the bulk and across the surface are coupled with plastic deformation and fracture in the complex hydride.
2 Materials and procedure
NaAlH4 powder (>93%) was purchased from Sigma Aldrich and kept in a glove box under Ar in a sealed flask. X-Ray diffraction with Cu Kα (λ = 0.15418 nm) radiation was employed for the structural characterization of NaAlH4 (See Fig. S1 in ESI‡).To assess the thermal stability of NaAlH4 Temperature-Programmed Desorption Mass Spectrometry (TPD-MS) with alumina crucibles was used. An alumina crucible was used instead of a Pt one to avoid the possible catalytic effect of Pt on the decomposition of NaAlH4. A portion of NaAlH4 powder was placed into an alumina crucible in a glove box under Ar atmosphere (<1 ppm H2O, <1 ppm O2), and then the alumina crucible was transferred to the TPD-MS system, where it was set into another Pt crucible. During the transfer, the sample was briefly exposed to the atmospheric air (about 5 min). The test was carried out under an Ar flux of 50 mL s−1 and a heating rate of 5 °C min−1.
For the mechanochemical test, cylindrical pellets, 13 mm in diameter and 1 mm thick, were fabricated by compacting NaAlH4 powder in a die under a uni-axial pressure of 370 MPa. The pellets were subjected to reciprocating rubbing under high vacuum (10−7 mbar range) using an alumina sphere, 3 mm in diameter. A specially designed friction cell with nearly zero own gas emission was used.30 The motion frequency was 1 Hz. One motion cycle consisted of one forward and one backward stroke, each of which lasted for about 40 ms. The indenter stood still for around 50 ms after the forward stroke and 870 ms after the backward one. The stroke length was la = 7 mm, the mean sliding speed was Vs = 0.18 m s−1 and the normal load was in the range 0.22–0.88 N. The total and partial gas pressures were measured in the experimental vacuum chamber, where the pellets were rubbed, using an ionization Bayard-Alpert type vacuum gauge and a quadrupole mass-spectrometer, correspondingly. To quantify minute gas emission rates (<1 nmol s−1) the experimental chamber was connected to a gas-expansion one through a diaphragm, whose conductance under molecular gas flow was carefully measured.30 The schematic drawing of the experimental system is shown in Fig. S2 in ESI‡ while the detailed description of the system and the procedure for measuring MSGE can be found elsewhere.30,31 Before starting the experiments, the chamber was pumped out for at least 48 hours to achieve stable background pressure (the rate of change of low-pass filtered pressure signal ≤10−11 mbar s−1). The gas emission was evaluated from the pressure time series during the mechanical action and benchmarked against the stable background. Spectral analysis of emission oscillation was carried out using Fast Fourier Transform with Hamming window. The gas composition and the emission rates were determined using a previously developed statistical matrix method.32–34 If not stated otherwise, each test was carried out on a pristine surface zone.
The coefficient of friction on the pellets was measured in a separate experiment using an original ultrahigh vacuum tribometer Ca3UHV with a reciprocating motion configuration.31 An alumina ball, 3 mm in diameter, was used as an indenter. The normal loads were 2–10 N, the stroke length was 3 mm and the mean sliding velocity was 0.147 mm s−1.
The mechanically affected zones (MAZ) were characterized using μ-FTIR spectrometry, μ-Raman confocal spectroscopy (incident laser wavelength λ = 532 nm and power 5.6 mW) and Scanning Electron Microscopy (Hitachi S-3000N). Ultra-microindentation was carried out using a diamond Berkovich indenter. Indentations were performed with a Shimadzu DUH-200 dynamic ultra-microhardness tester (0.02 mN load and 0.005 mm depth resolutions) applying 16 loading-unloading tests at each load on different areas of the pellet. Indentations with maximal loads of 1, 2 and 5 mN were used to estimate the hardness and elastic modulus of sodium alanate according to the model described by Pharr and Oliver, which includes elastic recovery corrections to the microscopic estimations of plastic deformation area.35 All the results were benchmarked against the measurements on the pristine zones of the same pellets.
3 Results and discussion
3.1 Thermal desorption
Hydrogen emission during a temperature ramp is shown in Fig. 1. The H2 emission (H2+m/z = 2) agrees the common three-stage behaviour according to reactions (R1)–(R3).36 The signal with m/z = 41, which showed strong linear correlation with H2 emission, was assigned to argonium (ArH+). Argonium can be usually formed by low-energy collisions of hydrogen and argon ions and/or molecules in an ionization chamber of a mass-spectrometer.37 Apart from H2, emission of trace gases, which were only partially identified, was registered in the temperature range 180–240 °C (a blue highlighted region in Fig. 1), i.e. before the main H2 emission events. The emission of trace gases did not correlate with H2. We concluded that the trace gases shouldn't be related to thermal reactions (R1)–(R3). Further details about trace gases can be found in ESI.‡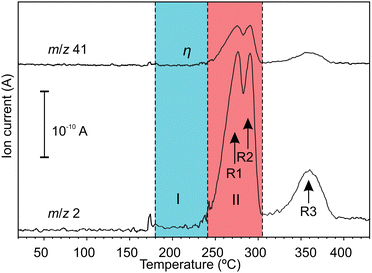 | ||
| Fig. 1 Mass-spectrometric signals with increasing temperature; region I corresponds to the initial stage after melting (T = 180–240 °C); region II corresponds to the main stage at which H2 emission occurs via reactions (R1) and (R2) (T = 240–305 °C). | ||
3.2 MSGE-MS
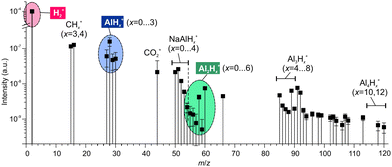 | ||
| Fig. 2 The mass spectrum of gases emitted during rubbing of NaAlH4. Hydrogen is the dominating species exceeding other components by 3 to 5 orders of magnitude. | ||
The trace gases, although in a small amount, showed a reach mass spectrum in the range of m/z 15–120, which was considerably different from the mass spectrum obtained under thermal desorption (see Fig. S2 in ESI‡). The components at m/z = 27–30, 55–60 and ≥84 in Fig. 2 can be assigned to alane and polyalanes (AlxHy, x = 1–4)38 (see Table 1), which have not been found and reported under thermal desorption so far. The components at m/z = 50–54 might point to possible weak NaAlH4 sublimation. The tentative assignment of other minor mass-spectrometric components is given in ESI.‡ These findings demonstrated that tribo-induced reactions must be significantly different from conventional thermal ones.
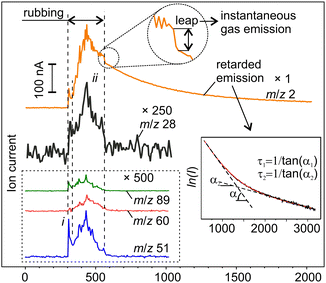
Further mechanistic insight into tribochemical processes can be gained through the analysis of mass-spectrometric time series, some of which are shown in Fig. 3. The analysis of emission dynamics, or behavioural analysis, is a useful tool for the interpretation of intrinsically non-stationary MSGE-MS signals, especially when a large uncertainty about the precursors composition exists.29,32–34,39,40 It is based on a simple concept that if the mass-spectrometer signals arise from the same precursor their time series must show correlated behaviours. Then, the whole mass spectrum can be broken down into several groups in such a way that within each group signals are correlated. Then, each group can be analysed individually and independently from the rest, which significantly simplifies identifying the precursors. The second key concept relies on the fact that the complex emission dynamics is controlled by two processes: mechanical activation of new material volumes due to the expansion of the MAZ and the gas emission from mechanically affected material.16,21 Therefore, the instantaneous emission rate can be described by a convolution of two functions: the rate of the MAZ expansion, Rv, and the specific rate of gas emission from a unit volume of activated material, qs. The latter is a fundamental characteristic of the gas–solid system, which can be determined from the analysis of the gas pressure transients, while the Rv relies upon the severity of mechanical action and mechanical properties of the material and can be determined using structural and morphological analyses of mechanically affected zones.21,33,41 These processes will be further analysed in Section 3.5.
At first sight, the emission behaviours of various gas components were quite similar and consisted of an initial peak (i) just at the beginning of rubbing and a series of irregular peaks superimposed on a slow varying base (ii) (Fig. 3). However, the proportions between the peaks and the base differed between the signals. More significant differences between the emission behaviours were found at and after the end of rubbing when all the signals except hydrogen returned to the background almost immediately. Some of them, e.g. m/z 60 and 89, tended to fade out even in the second half of stage ii before the end of rubbing. Such behaviour is typical for depleting emission sources.34 The driving forces for such gas emission must be directly linked to mechanical action. In contrast, the emission of H2 first leapt down to a certain non-zero value and then continued to decay for thousands of seconds forming a characteristic trail (Fig. 3).21
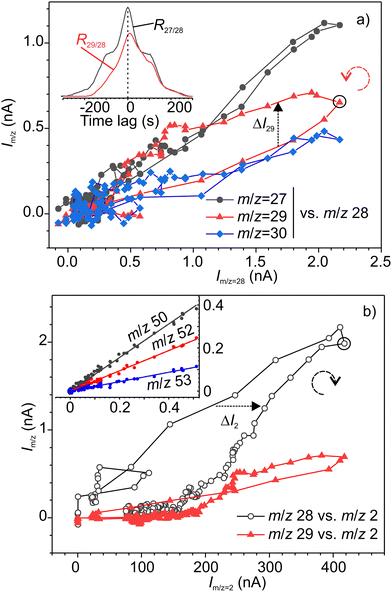
The synchronous emission, i.e. emission occurring during rubbing, and retarded emissions were analysed separately. Fig. 4 illustrates the analysis of correlations between various signals for synchronous emission, where a good example of a strong linear correlation (Pearson's r = 0.88–0.98) for the group of three alane ions AlHx+ (x = 0, 1 and 3) can be seen. The cross-correlation graph for m/z 27–28 shown in the inset in Fig. 4 is symmetric with respect to time lag 0, which means that both signals are correlated with no time lag. Surprisingly, the fourth ion of this group AlH2+ with m/z 29 exhibited a different, loop-like behaviour (Fig. 4a). The lack of linear correlation is also evident from the asymmetric shape of the cross-correlation graph for m/z 29–28 signals (inset in Fig. 4a). The maximum of this graph is positively shifted on around 10 s, indicating that the emission kinetics for the precursors of m/z 29 is slower or delayed with respect to the precursors of m/z 28. From the pair-wise analysis of signals m/z = 27–30 and m/z = 2 it was found that the signal m/z = 29 linearly correlated with hydrogen, but the rest of these ions did not (Fig. 4b). From the correlation of ions m/z = 29, 58, 59 and 60 (see Fig. 5 and Fig. S3 in ESI‡), we deduced that the second precursor must be dialane. The strongest linear correlations among the entire set of signals were found for the ions with m/z 50–53 (inset in Fig. 4b) which can undoubtedly be assigned to the only precursor – sodium alanate.
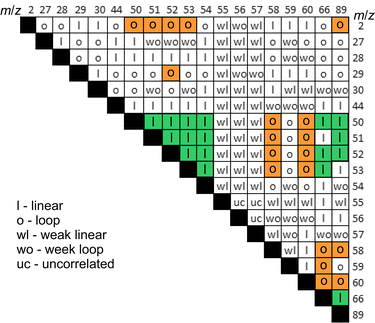 | ||
| Fig. 5 Types of pairwise dependencies for mass-spectroscopic signals. Bold letters and the background highlight strong trends. | ||
Based on the pairwise analysis, the correlations of all signals were classified into four types: strong and weak linear behaviours and strong and weak loop-like behaviours. Fig. 5 shows the map of pair-wise correlations. For some signals, which were denoted “uncorrelated”, the dependency was not completely clear because of the data dispersion. The following major conclusions were drawn from the pairwise correlation analysis:
(a) there are notably strong correlations between the gases of group HAD (Hydrogen, Alane, Dialane). This means that H2 must be formed simultaneously with mono- and di-alanes or that H2 is a product of alanes decomposition.
(b) NaAlH4 emission was not correlated with HAD which means that NaAlH4 sublimation happened without its decomposition. We consider that sublimation should be related to the mechanical shearing of intermolecular bonds rather than to local frictional heating.
(c) Possible alkyl-substituted alanes (AlH2CH3+) and/or CO2+ correlated with NaAlH4, but not with HAD. The presence of methyl groups bonded to Al on the alanate surface, which was briefly exposed to the ambient air during introduction into the vacuum system, is not surprising since CO2 can be reduced by alanates yielding methane.42 However, such contamination must have only a minute effect on the dehydrogenation reaction since all these gases made up around 0.1% of the total emission yield.
(d) The emission of ions with higher masses could not be assuredly and uniquely ascribed to higher alanes. Contributions from other unidentified precursors are highly likely.
Further insight into hidden tribochemical processes was gained through the analysis of the retarded hydrogen emission. It is remarkable that the transient decays showed an unusual multistage behaviour, which could not be associated with one-step first-order tribodesorption processes such as those observed for MgH2 and metals.14,21,43 The time series could not be satisfactorily fitted using equations of reactions with order other than one (see ESI‡ for details). Thus, such reactions were discarded, and the analysis was focused on the interpretation of the trail emission as a combination of several first-order processes of different kinetics.44 In fact, on a semi-logarithmic plot, the experimental data can be fitted reasonably well by a piece-wise linear function (inset in Fig. 3) including the fast (leap) and slow (tail) decays. A detailed analysis of gas emission dynamics and relevant underlying physical processes is given in Section 3.2.3. It can be advanced that the local temperature increase due to mechanical energy dissipation has been discarded as the possible driving force of H2 emission.
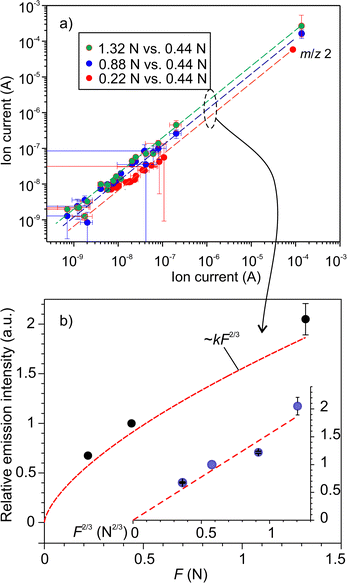
 , where k is the proportionality coefficient, since the reaction rate is proportional to the contact area, which, in turn, is a
  power of the applied load (under elastic regime).45 The red dashed line in Fig. 6b shows the least squares fit of the function
  to the experimental data, which yielded a Radj.2 = 0.6057. The inset of Fig. 6b shows the same data plotted vs.
 , where a good linear dependency is evident. This finding confirms that the gas sources should be located at the sliding interface and in the mechanically affected bulk. The latter is a layer, several nanometeres to several micrometres thick, below the contact surface, where intensive plastic flow and structural degradation take place. The discussion on the effect of stress, strain, plastic flow and wear on gas emission will be continued in Section 3.4.
 | (1) |
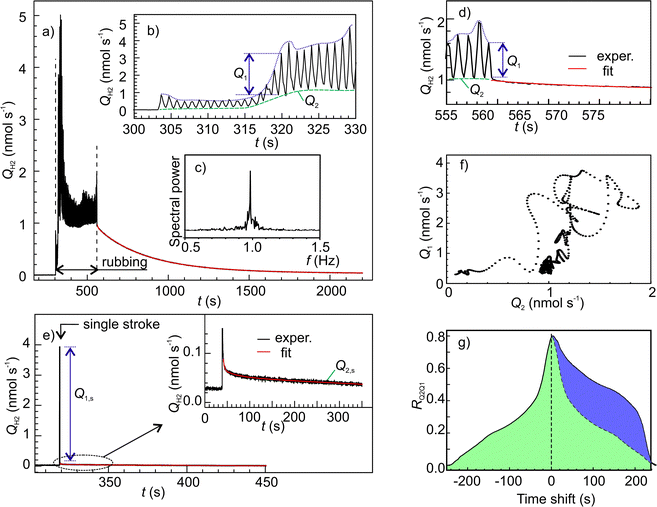
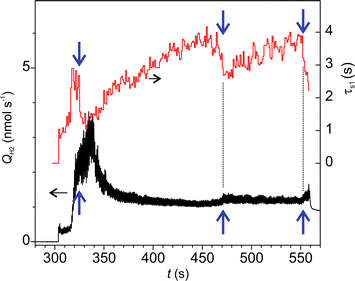
Fig. 7a shows an example of time series of H2 emission rate. In this graph, the oscillatory emission behaviour could be resolved (Fig. 7b) due to the higher data acquisition rate (50 samples s−1). The frequency of the main mode of emission oscillation (1 Hz) perfectly matched the frequency of the indenters periodic motion (Fig. 7c). Further insight into the emission mechanisms was gained through a separate analysis of emission dynamics within each cycle and along various cycles. The falling edges in all cycles were fitted by real exponents using the Matrix Pencil Method46 (see ESI‡ for details). The time constant obtained, τs1, is plotted in Fig. 8, which clearly shows an increasing trend. Also, during occasional emission bursts marked by arrows in Fig. 8, the time constant was anti-correlated with the total emission rate (Spearman correlation coefficient −0.439): the τs1 increased when the QH2 decreased and vice versa. Furthermore, the decrease of τs1 anticipated the appearance of the bursts. Such variations of gas emission dynamics cannot be connected to the fluctuations of surface temperature since heat dissipation at the interface was several orders of magnitude faster than the gas emission.§
The long-term emission dynamics can be characterized by the two parameters derived from the envelope curves shown by blue and green dashed lines in the inset in Fig. 7a. The lower envelope itself gives the offset, Q2, while the difference between the upper and lower envelopes yields the oscillation amplitude, Q1. Both these parameters depend on the decay kinetics.
To measure the emission decay parameters more accurately a separate test with a single rubbing stroke was done. In this case, H2 rose more sharply and showed a bigger leap than after a multi-stroke test (Fig. 7e). The time constants of the three decay components are listed in Table 2, while the relative amplitudes were As1 = 1.00, As2 = 0.0139 and As3 = 0.0111, correspondingly. The τs1 was close to the value of τs1 at the first strokes (Fig. 8) which corroborates our finding that the emission amplitude is controlled mainly by the fastest decay. In contrast, the τs2 and τs3 were significantly greater than the period of rubbing, and, therefore, they must control the slower dynamics of Q2.
| Decay component | 1 | 2 | 3 | |
|---|---|---|---|---|
| Multicycle: in-cycle | τ si | 0.77–4.2 | ||
| Multicycle: trail | τ m i | 27.3 | 306 | |
| Single cycle | τ s i | 0.638 ± 0.015 | 16.0 ± 0.452 | 465 ± 1.5 |
Assuming that to describe gas emission from spatially distributed sources, which are activated at different times, the additivity principle can be employed, the total instant gas flow can be expressed by the following equation:
 | (2) |
 | (3) |
For the sake of simplicity, τs1, which controls fast decay process, can be excluded from the expression for Q2. Then the following expression was obtained:
 | (4) |
The existence of three decay processes raises the question of whether they are interdependent or not. Fig. 7f shows the graph of Q1 as a function of Q2. It is surprising, that this graph does not display any random dispersion typical for experimental measurements, but presents a complex pattern, which resembles phase trajectories in the dynamical systems with chaos. This supports our hypothesis that all three decay processes probably stem from a single emission reaction. This was further corroborated by the cross-correlation analysis of Q1 and Q2 (Fig. 7g), which showed good correlation and a positive shift of Q2, which means that Q2 is delayed 20 to 220 s with respect to Q1.¶ This time lag is within the time scale of τs2 and τs3.
3.3 Surface characterization
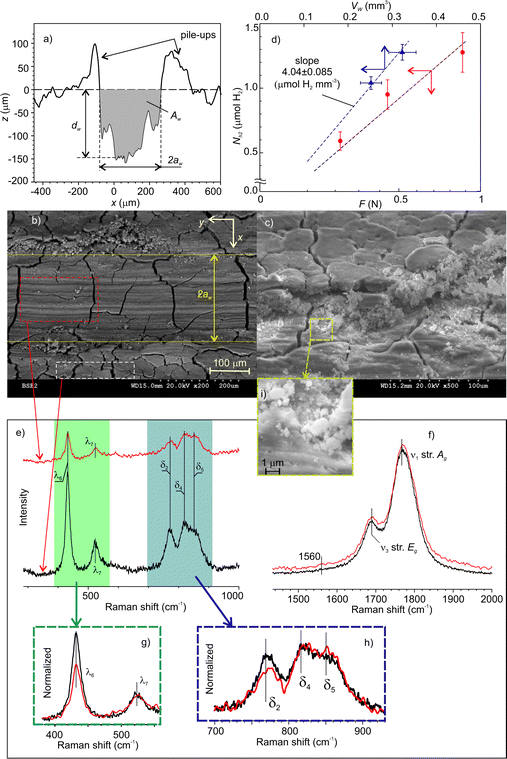
The volume of mechanically affected material, Vma, was estimated from the volume of worn material, Vw, which was determined from the cross-section profiles of the wear scars. A typical profile is shown in Fig. 9a. The maximal depth, dw, width, 2aw, and the cross-section area, Aw, were measured at various points along the wear tracks and averaged.The SEM image (Fig. 9b) shows the accumulation of fine agglomerated debris on both sides of the wear track. A closer look at the BSE-SEM images (Fig. 9c) did not reveal any significant grey shift indicating no major composition changes. The changes were mainly structural in form of longitudinal grooves on the worn surfaces and pile-ups on the sides. However, the network of deep cracks on the surface was not distorted by rubbing. This suggests that, under low and moderate load, material damage was localized at the contact zone, while its mechanisms were abrasion and plastic deformation. However, this does not preclude that under higher loads, the initial cracks could trigger the detachment of larger pieces of material, which could leave the contact zone without being crashed. This can explain why the amount of emitted hydrogen relatively decreased with increasing load. The enlarged portion of image 9c (Fig. 9i) revealed a number of submicrometer size debris.
Fig. 9d shows the total amount of emitted H2 as a function of the normal load and the Vw. The molar efficiency of dehydrogenation, Em, i.e. the number of moles of H2obtained from one mole of deformed NaAlH4, was estimated from the slope of the linear fit to the experimental data with zero intercepts. The apparent density of the cold-pressed pellets was about 1.4 g cm−3![[thin space (1/6-em)]](https://www.rsc.org/images/entities/char_2009.gif) 47 and the molar mass of NaAlH4 is 54 g mol−1. This yields Em = 15% (see 2%), which is a fascinating result considering that the dehydrogenation took place at room temperature.
47 and the molar mass of NaAlH4 is 54 g mol−1. This yields Em = 15% (see 2%), which is a fascinating result considering that the dehydrogenation took place at room temperature.
The absence of any noticeable chemical changes on the contact surfaces was confirmed by Raman spectrometry. Fig. 9e and f show the spectra which have the same characteristic bands assigned solely to NaAlH4.48–51 The only small difference between the two spectra concerns the decrease in intensity of the AlH4− libration mode at 432 cm−1.
Such decrease and the red shift of libration band with increasing temperature were previously reported by Borgschulte et al.52 This mode was associated with the external vibration of AlH4− as a rigid unit concerning a NaAlH4 lattice.53 Since in our study both spectra were measured at a constant temperature, the decrease of libration mode can be ascribed to the depletion of AlH4− concentration on the MAZ. Contrary to the expectations, the Na3AlH6 bands, which usually accompany thermal dehydrogenation, were not found. This result is also supported by micro-FTIR spectrometry (see Fig. S3 in ESI‡). According to these data, we can infer that triboinduced dehydrogenation of NaAlH4 occurred through a chemical path, which is different from the sequential thermal reactions (R1) and (R2).
3.4 Frictional heat generation and a specific energy for hydrogen triboemission
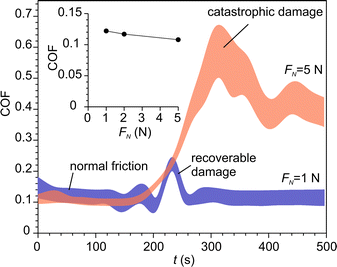
The increase of contact temperature at sliding contact, ΔT, was modelled using Jaegers fundamental solution for moving heat sources.48,49Table 3 summarizes the parameters, which were fed into the model. Hardness, Young modulus and coefficient of friction (COF) were experimentally determined in this work. Fig. 10 shows the COF at various normal loads. COF was nearly constant during normal friction. The events of occasional recoverable damage at the surface were accompanied by temporal increases in COF. However, under higher loads, a transition from normal friction to high friction occurred when the density of defects achieved a critical level, which led to catastrophic damage to the material. The surface temperature was determined for both regimes.| Units | NaAlH4 | Al2O3 | ||
|---|---|---|---|---|
| This study | Literature | |||
| a Calculated from the bulk modulus. b For pellets compacted at various pressures. | ||||
| Hardness | Mpa | 0.7–0.9 | 5.77–9.1754 | 1800 |
| Young modulus | Gpa | 19–25 | 49.5–76.054 | 34555,56 |
| 51.857a | ||||
| Poissons ratio | 0.17–0.1954,57 | 0.2356,58 | ||
| Thermal conductivity | W (m K)−1 | 0.259 | 3460 | |
| 0.2–1.647b | ||||
| 0.28–0.5561 | ||||
| 1.62–1.7247 | ||||
| Density | kg m−3 | 124047,59,61 | 3780 | |
| 138047 | ||||
| Heat capacity | J (kg K)−1 | 158459,61 | 784 | |
| 1150 ± 6047 | ||||
| Max. temperature increase ΔT (K) | ||
|---|---|---|
| Friction regime | Load | |
| 0.22 N | 1.32 N | |
| Normal | 0.68 | 1.68 |
| Catastrophic | 3.77 | 9.39 |
Also, Jaegers model was used to determine the characteristic times of temperature flashes. The temperature maximum situated at the trailing part of the contact area because of large Pécklet numbers.62,63 So, the duration of the temperature increase was approximately tc = 2aw/Vs, where Vs is the sliding velocity. For our experimental conditions tc = 0.44–1.56 ms. The time constants of temperature decay of a surface point after leaving the contact zone were determined by fitting the dimensionless solution of Jaeggers equation at relevant Pécklet numbers. The resulting values ranged from 0.11 to 1.11 ms, which yielded the total duration of the temperature decay below 6 ms. It should be stressed that both heat-up and cool-down times are about three orders of magnitude smaller than the smallest empirically found time constant of H2 triboemission. Bearing this in mind and taking into account that the maximal “flash” temperature was below 320 K, thermal effect of friction has been disregarded as a possible activation mechanism for NaAlH4 dehydrogenation.
Although irrelevant for triggering tribochemical reactions, frictional heating is still an important channel of mechanical energy dissipation, together with the enthalpy of tribochemical reaction and the increment of internal energy of a solid. Taking into account that the mechanical energy equals the total work of friction, the following equation of energy balance can be written:
| Am = FNNclaμ = ΔHNH2 + ΔE + ΔU | (5) |
 | (6) |
3.5 Possible mechanisms of non-thermal tribo-induced dehydrogenation of sodium alanate
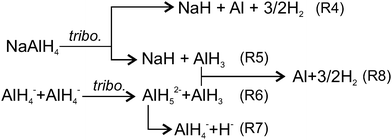
This study led us to the conclusion that conventional two-step thermally driven reactions (R1) & (R2) cannot explain the tribochemical decomposition of NaAlH4, since Na3AlH6 was not formed. Various authors6,65 discussed the possibility that under specific conditions dehydrogenation of NaAlH4 can go via alternative one-step (R4) or two-step ((R5) & (R8)) pathways (Fig. 11). For instance, when the size of NaAlH4 nanoparticles is below 52 nm, reaction (R4) is thermodynamically more favourable than the conventional two-step reaction.6 Baldé proposed that the activation energy decreases as the particle size decreases from 30 nm to below 10 nm.65 Using these data and supposing that nanoparticles are produced by rubbing we found that the experimentally observed emission decays with time constants τs1, τs2 and τs3 could be associated with the freshly generated nanoparticles of the following size: <2 nm, 2–10 nm and 10–19 nm, respectively (see ESI‡ for more details). However, generation of such a big number of ultra-fine nanoparticles (about 15% of the volume of MAZ) is questionable considering the mild rubbing conditions and the short duration of the test.7The two-step pathway (R5) & (R8) does not seem plausible either. Although it can explain both H2 and AlH3 emission, the high energy barrier of the first step, i.e. separation of AlH3 from AlH4− (enthalpy −60 kJ mol−166 and activation energy 116 kJ mol−1![[thin space (1/6-em)]](https://www.rsc.org/images/entities/char_2009.gif) 67) raises reasonable doubts about the effectiveness of mild mechanical forces to drive the reaction at room temperature. Effective coupling of the mechanical forces to an energy landscape of a chemical reaction usually takes place, when mechanical energy can be concentrated in a small volume, i.e. for hard and brittle materials. For soft materials such as NaAlH4, the applied mechanical energy per bond constitutes only a minute fraction (<0.05%) of the activation barrier,64,68–71 which is by far insufficient to drive hydrogen emission observed in this study.
67) raises reasonable doubts about the effectiveness of mild mechanical forces to drive the reaction at room temperature. Effective coupling of the mechanical forces to an energy landscape of a chemical reaction usually takes place, when mechanical energy can be concentrated in a small volume, i.e. for hard and brittle materials. For soft materials such as NaAlH4, the applied mechanical energy per bond constitutes only a minute fraction (<0.05%) of the activation barrier,64,68–71 which is by far insufficient to drive hydrogen emission observed in this study.
Among various hypotheses, which can be put forward to explain the experimental findings, the following one appears to be the most plausible, although it still needs to be validated through additional atomic-scale studies and simulation. The hypothesis relies on the consideration of alternative ways of connecting mechanical energy and chemical reaction in materials of low hardness such as NaAlH4 where various channels with low activation barriers for dissipation of mechanical energy can exist. Among others, the most energetically favourable microscopic mechanisms for mechanical energy dissipation include the generation and migration of vacancies, dislocations, crystal borders, twins and so on. These phenomena tend to increase structural disorder and entropy36 that shifts the chemical potential of the solid and creates a thermodynamic force72 leading to linked, but slipped in time, mass transport and chemical reactions.73 On the atomic scale, the relative motion of atoms and atomic groups, which are only weakly bonded or not bonded under unstrained conditions, results in approaching each other and reaching the distances, at which chemical reactions between them become possible. Two of such possible reactions are shown in Fig. 11 ((R6) and (R7)). In the first step, the vertices of two AlH4− ions approach each other under applied stress. The nearest diagonally located AlH4− groups are likely to be involved. Then, H from one AlH4 can be donated to another AlH4 to form AlH52−. The activation barrier of this reaction without external forces is only 32 kJ mol−1 H274 and it requires a minute shift <1 Å of the Al atoms from their equilibrium positions.75 Under spatial constraints induced by stress and strain the activation barrier can be further lowered.76 The AlH52− ion is metastable since the reverse barrier is about 4–10 kJ mol−1.77 It was reported that under elevated temperature, penta-coordinated Al could be further transformed to a hexa-coordinated state (energy barrier 36 kJ mol−1), always when this transformation is accompanied by simultaneous diffusion of Na+ species to satisfy Coulomb neutrality and stabilize AlH63− ions. However, under room temperature diffusion of AlH3 and NaH vacancies is slow. For example, taking the value of diffusion activation barrier 44 kJ mol−178,79 the diffusion rate at 295 K is more than two orders of magnitude lower, than at 400 K. Thus, the further transformation of AlH52− into AlH63− is kinetically hindered, and decomposition of AlH52− proceeds according to (R7). This hypothesis agrees with our experimental findings, i.e. lack of Raman bands of Na3AlH6 and the decrease of libration Raman mode due to consumption of AlH4− groups in reactions (R6) and (R7).
Further formation of H2 can proceed through the association of two hydrides (R7) or via the decomposition of alane (R6). Reaction (R8) shows the formation of H2 from alane, which should occur in the bulk since alane is relatively stable in the gas phase.4 Alanes must be formed at or very close to the interface where neutral AlH3 is more favoured than other ionic species since electrostatic caging by Na+ is less perfect than in the bulk.75 In addition, slow diffusion of alane at room temperature should hinder their release from deeper layers in a reasonable time. Concerning H−, despite the fact that two hydride ions cannot meet each other directly due to strong Coulomb repulsion, the formation of H2 can proceed through various intermediate steps, which were previously investigated.66,75,77,80–82 H− can easily diffuse from the bulk to the surface through minute rotation and rebinding of neighbouring tetrahedral67 whose free-energy barrier for diffusion is 11.6–15.4 kJ mol−1.78,81 Such a low energy barrier makes diffusion much less sensitive to temperature decrease, than diffusion of metal species. At 295 K the rate of H− diffusion is only 3.6-fold lower, than at 400 K. Therefore, at 295 K H diffusion becomes the dominating process controlling the overall reaction rate. In contrast, diffusion of molecular hydrogen in NaAlH4, which occurs as migration of interstitial defect (free-energy barrier around 24 kJ mol−1)78 is too slow at room temperature to match any observed H2 emission decays. Thus, the emitted H2 must be formed at the surface or in a thin (few nanometers) subsurface layer, where intensive mixing of atoms and gas diffusion take place.83
3.6 Emission kinetics and its relationship with the expansion of mechanically affected zone
The model of one-side diffusion from a layer was employed to estimate the thickness of the layer contributing to mechanically stimulated H2 emission (Fig. 12a).84 The layer thickness is related to the time constant of the emission decay, τD, by the following expression: | (7) |
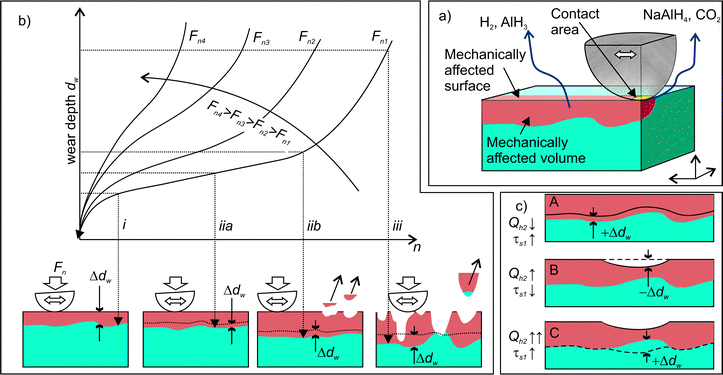
The results of this study demonstrated the crucial role of stress and strain for tribo-induced dehydrogenation of NaAlH4. The connection between the structural degradation (deformation propagation and material damage) in the contact zone and the dynamics of gas emission has been further analysed using the well-established kinetic model of wear, which is schematically shown in Fig. 12b. At the beginning of rubbing, high contact stress causes intensive material deformation (stage (i) in Fig. 12) that can be associated with the emission bursts (stage (i) in Fig. 3). After several tens of rubbing cycles, the contact area increases, while the contact stress decreases. This leads to the stabilization of the wear rate at a lower value. At this stage, the same material is repeatedly deformed each cycle causing a gradual depletion of the emission sources. Occasional local damages and detachments of microscopic debris from the contact zone (iib in Fig. 12a) can intensify the propagation of deformation into a deeper fresh layer86 giving rise to the emission bursts of low intensity at stage (ii) (Fig. 3). When a critical density of defects in the deformed layer is attained, gradual wear switches to a catastrophic one, and fast material disintegration begins. This is accompanied by intensive but chaotic emission behaviour. When the applied load increases the duration of the second stage decreases, as shown by arrows in Fig. 12b.
Furthermore, the linked diffusion-wear model put forward in this work can consistently explain the variations of the time constants of H2 emission, τs1, from the perspective of the dynamics of the thickness of the deformed layer, dw. The gradual increase of the τs1 from 1 to 4 s (Fig. 8) must be associated with the about the two-fold increase of the dw (scheme A in Fig. 12c). The emission bursts and the corresponding sharp drops of τs1 can be explained by a sudden decrease of the dw at the spots, where the material was locally damaged and removed (scheme B in Fig. 12c). This could trigger further propagation of deformation into the bulk and involvement of new material volumes in the mechanically affected zone.
4 Conclusions
Intensive instantaneous dehydrogenation of undoped NaAlH4 was achieved at room temperature using mechanical energy via rubbing in vacuum. H2 was the main emitted species constituting >99% of the total emission. Among minor components, alanes, dialanes, CO2 and traces of NaAlH4 were identified. Behavioural analysis of the pressure time series showed that emissions of H2, alanes and dialanes were highly correlated. This was ascribed to the fact that these gases originated from the same chemical reactions.Further analysis of the H2 emission flux at higher time resolution revealed that the emission decay consisted of two events: the fast decay lasting for a few seconds and a slow retarded emission having various decay components and lasting for thousands of seconds after the end of rubbing. This suggests that the sources of H2 emission must be situated both in the mechanically affected bulk and on the surface of the contact zone. The molar efficiency of dehydrogenation under given experimental conditions was ≥15% (mol H2 per mol NaAlH4).
Various possible emission mechanisms lying behind tribo-induced emission were scrutinized. The thermal effect of friction and the direct coupling of mechanical forces to the energy landscape of chemical reactions were ruled out. An alternative reaction pathway based on the idea that chemical reactions were triggered by the activation of various channels of mechanical energy dissipation in the solid, was proposed. It suggests that the activation barrier for the reaction between unbound or weakly bound groups can be lowered during their mutual approach under strain. On this ground, a linked diffusion-wear model of tribo-induced dehydrogenation of NaAlH4 was proposed. It consistently explains all empirical findings including the complex dynamics of emission time series, the kinetics of emission decays and their relationship with the degree of wear.
Author contributions
E. M.-C.: methodology, validation, formal analysis, investigation. A. G.: formal analysis. O. I.: software, investigation. M. M. S., B. Z., E. F.: investigation. J. R. A., R. N.: conceptualization, methodology, validation, formal analysis, investigation, writing, funding acquisition, supervision, project administration.Conflicts of interest
There are no conflicts to declare.Acknowledgements
We acknowledge E. Roman, G. Moras, S. Sukhomlinov and M. Boiko for fruitful discussion and L. García-Pelayo for assistance with ultra microindentation experiments. MIRE Group thanks to F. Moreno and M. López del Campo for their technical assistance. This work was financially supported by the Ministry of Science and Innovation of Spain (grants PID2019-111063RB-I00, PID2020-112770RB-C22, RTI2018-099794-B-I00, and TED2021-129950B-I00) and the Basque Government via the EMAITEK Plus 2020 programme.Notes and references
- B. Bogdanovic, R. A. Brand, A. Marjanovi, M. Schwickardi and J. Tölle, J. Alloys Compd., 2000, 302, 36–58 CrossRef CAS.
- S.-i Orimo, Y. Nakamori, J. R. Eliseo, A. Züttel and C. M. Jensen, Chem. Rev., 2007, 107, 4111–4132 CrossRef CAS PubMed.
- B. Bogdanovic and M. Schwickardi, J. Alloys Compd., 1997, 253–254, 1–9 CrossRef CAS.
- S. Chaudhuri, J. Graetz, A. Ignatov, J. J. Reilly and J. T. Muckerman, J. Am. Chem. Soc., 2006, 128, 11404–11415 CrossRef CAS PubMed.
- F. Schüth, B. Bogdanovic and M. Felderhoff, Chem. Commun., 2004, 2249–2258 RSC.
- T. Mueller and G. Ceder, ACS Nano, 2010, 4, 5647–5656 CrossRef CAS PubMed.
- J. R. Ares, K. F. Aguey-Zinsou, M. Porcu, J. M. Sykes, M. Dornheim, T. Klassen and R. Bormann, Mater. Res. Bull., 2008, 43, 1263–1275 CrossRef CAS.
- V. Stavila, R. K. Bhakta, T. M. Alam, E. H. Majzoub and M. D. Allendorf, ACS Nano, 2012, 6, 9807–9817 CrossRef CAS PubMed.
- Y. Li, G. Zhou, F. Fang, X. Yu, Q. Zhang, L. Ouyang, M. Zhu and D. Sun, Acta Mater., 2011, 59, 1829–1838 CrossRef CAS.
- R. K. Bhakta, S. Maharrey, V. Stavila, A. Highley, T. Alam, E. Majzoub and M. Allendorf, Phys. Chem. Chem. Phys., 2012, 14, 8160–8169 RSC.
- C. P. Baldé, B. P. C. Hereijgers, J. H. Bitter and K. P. de Jong, Angew. Chem., Int. Ed., 2006, 45, 3501–3503 CrossRef PubMed.
- D. Pukazhselvan, B. K. Gupta, A. Srivastava and O. N. Srivastava, J. Alloys Compd., 2005, 403, 312–317 CrossRef CAS.
- J.-R. Ares, R. Nevshupa, E. Muñoz-Cortés, C. Sánchez, F. Leardini, I.-J. Ferrer, V. Minh Huy Tran, F. Aguey-Zinsou and J.-F. Fernández, ChemPhysChem, 2019, 20, 1248–1262 CrossRef CAS PubMed.
- R. Nevshupa, J. R. Ares, J. F. Fernandez, A. del Campo and E. Roman, J. Phys. Chem. Lett., 2015, 6, 2780–2785 CrossRef CAS PubMed.
- R. Nevshupa and K. Hiratsuka, in Triboluminescence, ed. E. Gnecco and E. Meyer, Springer International Publishing, 2015, book section 4, pp. 57–77 Search PubMed.
- R. Nevshupa, J. Frict. Wear., 2009, 30, 118–126 CrossRef.
- V. V. Boldyrev, Russ. Chem. Rev., 2006, 75, 177–190 CrossRef CAS.
- K.-F. Aguey-Zinsou and J.-R. Ares-Fernandez, Energy Environ. Sci., 2010, 3, 526–543 RSC.
- A. Porcheddu, A. Cincotti and F. Delogu, Int. J. Hydrogen Energy, 2021, 46, 967–973 CrossRef CAS.
- R. A. Nevshupa, E. Roman and J. L. de Segovia, Int. J. Mater. Prod. Technol., 2010, 38, 57–65 CrossRef CAS.
- R. Nevshupa, K. Cruz, I. Martinez, S. Ramos, I. Llorente and E. Roman, Tribol. Int., 2016, 97, 360–370 CrossRef CAS.
- Exo-electron Emission and Tribochemistry, ed. Q. J. Wang and Y.-W. Chung, Springer US, Boston, MA, 2013, p. 998 Search PubMed.
- J. Zhang, Y. C. Zhou, Z. S. Ma, L. Q. Sun and P. Peng, Int. J. Hydrogen Energy, 2013, 38, 3661–3669 CrossRef CAS.
- K. Nogita, X. Q. Tran, T. Yamamoto, E. Tanaka, S. D. McDonald, C. M. Gourlay, K. Yasuda and S. Matsumura, Sci. Rep., 2015, 5, 8450 CrossRef CAS PubMed.
- J. Huot, G. Liang and R. Schulz, J. Alloys Compd., 2003, 353, L12–L15 CrossRef CAS.
- K. Suárez-Alcántara, J. R. Tena-Garcia and R. Guerrero-Ortiz, Materials, 2019, 12, 2724 CrossRef PubMed.
- Y. Shang, C. Pistidda, C. Milanese, A. Girella, A. Schökel, T. T. Le, A. Hagenah, O. Metz, T. Klassen and M. Dornheim, Green Chem., 2022, 24, 4153–4163 RSC.
- A. Rusanov, R. Nevshupa, J. M. Martin, M. A. Garrido and E. Roman, Diamond Relat. Mater., 2015, 55, 32–40 CrossRef CAS.
- R. Nevshupa, J. Caro, A. Arratibel, R. Bonet, A. Rusanov, J. R. Ares and E. Roman, Tribol. Int., 2019, 129, 177–190 CrossRef CAS.
- R. A. Nevchoupa, J. L. de Segovia and E. A. Deulin, Vacuum, 1999, 52, 73–81 CrossRef CAS.
- R. A. Nevshupa, M. Conte, A. Igartua, E. Roman and J. Luis de Segovia, Tribol. Int., 2015, 86, 28–35 CrossRef.
- M. Mahrova, M. Conte, E. Roman and R. Nevshupa, J. Phys. Chem. C, 2014, 118, 22544–22552 CrossRef CAS.
- A. Rusanov, R. Nevshupa, J. Fontaine, J.-M. Martin, T. Le Mogne, V. Elinson, A. Lyamin and E. Roman, Carbon, 2015, 81, 788–799 CrossRef CAS.
- R. Nevshupa, M. Conte, S. Guerra and E. Roman, Lubricants, 2017, 5, 27 CrossRef.
- W. C. Oliver and G. M. Pharr, J. Mater. Res., 1992, 7, 1564–1583 CrossRef CAS.
- M. Christian and K.-F. Aguey-Zinsou, Nanoscale, 2010, 2, 2587–2590 RSC.
- A. V. Phelps, J. Phys. Chem. Ref. Data, 1992, 21, 883–897 CrossRef CAS.
- C. P. Nold and J. D. Head, J. Phys. Chem. A, 2012, 116, 4348–4355 CrossRef CAS PubMed.
- R. Nevshupa, M. Conte, A. del Campo and E. Roman, Tribol. Int., 2016, 102, 19–27 CrossRef CAS.
- S. Mori, T. Kawada and W. C. Xu, Appl. Surf. Sci., 1997, 108, 391–397 CrossRef CAS.
- A. Igartua, E. Berriozabal, R. Nevshupa, E. Roman, F. Pagano, L. P. Nielsen, S. Louring and L. Muntada, Tribol. Int., 2017, 114, 192–200 CrossRef CAS.
- C. L. Hugelshofer, A. Borgschulte, E. Callini, S. K. Matam, J. Gehrig, D. T. Hog and A. Züttel, J. Phys. Chem. C, 2014, 118, 15940–15945 CrossRef CAS.
- C. R. Bagshaw, in Transient-State Kinetic Methods, ed. G. C. K. Roberts, Springer Berlin Heidelberg, Berlin, Heidelberg, 2013, pp. 2638–2644 Search PubMed.
- T. Jacobs, C. M. Mate, K. Turner and R. Carpick, Scanning Probe Microscopy for Industrial Applications: Nanomechanical Characterization, 2013, p. 368 Search PubMed.
- V. N. Ageev, E. Y. Zandberg, N. I. Ionov and A. Y. Tontegode, Phys.-Usp., 1983, 26, 382–383 CrossRef.
- M. Henry, O. Ibryaeva, D. Salov and A. Semenov, Bulletin of the South Ural State University. Series “Mathematical Modelling, Programming and Computer Software”, 2017, 10, 92–104.
- B. A. van Hassel, D. Mosher, J. M. Pasini, M. Gorbounov, J. Holowczak, X. Tang, R. Brown, B. Laube and L. Pryor, Int. J. Hydrogen Energy, 2012, 37, 2756–2766 CrossRef CAS.
- D. J. Ross, M. D. Halls, A. G. Nazri and R. F. Aroca, Chem. Phys. Lett., 2004, 388, 430–435 CrossRef CAS.
- S. Gomes, G. Renaudin, H. Hagemann, K. Yvon, M. P. Sulic and C. M. Jensen, J. Alloys Compd., 2005, 390, 305–313 CrossRef CAS.
- T. G. Adiks, V. V. Gavrilenko, L. I. Zakharkin and L. A. Ignat'eva, J. Appl. Spectrosc., 1967, 6, 546–551 CrossRef.
- M. Enders, M. Kleber, G. Derscheid, K. Hofmann, H.-D. Bauer and B. Scheppat, Appl. Opt., 2020, 59, 9510–9519 CrossRef PubMed.
- A. Borgschulte, A. Züttel, P. Hug, G. Barkhordarian, N. Eigen, M. Dornheim, R. Bormann and A. J. Ramirez-Cuesta, Phys. Chem. Chem. Phys., 2008, 10, 4045–4055 RSC.
- H. Yukawa, N. Morisaku, Y. Li, K. Komiya, R. Rong, Y. Shinzato, R. Sekine and M. Morinaga, J. Alloys Compd., 2007, 446–447, 242–247 CrossRef CAS.
- R.-K. Pan, J.-G. Yao, R.-L. Ji, W.-W. Liu and D.-F. Yin, Int. J. Hydrogen Energy, 2018, 43, 3862–3870 CrossRef CAS.
- C. Baudín, in Alumina, Structure and Properties, ed. M. Pomeroy, Elsevier, Oxford, 2021, pp. 25–46 Search PubMed.
- M. Asmani, C. Kermel, A. Leriche and M. Ourak, J. Eur. Ceram. Soc., 2001, 21, 1081–1086 CrossRef CAS.
- L. George and S. K. Saxena, Int. J. Hydrogen Energy, 2010, 35, 5454–5470 CrossRef CAS.
- P. Auerkary, Mechanical and physical properties of engineering Alumina ceramics, Technical notes, Julkaisija-Utgivare, Technical research center of Finland, Espoo, 1996 Search PubMed.
- B. Bonnetot, G. Chahine, P. Claudy, M. Diot and J. M. Letoffe, J. Chem. Thermodyn., 1980, 12, 249–254 CrossRef CAS.
- M. Kobayashi, T. Goto, T. Aoba and H. Miura, Mater. Charact., 2019, 154, 424–436 CrossRef CAS.
- D. E. Dedrick, M. P. Kanouff, B. C. Replogle and K. J. Gross, J. Alloys Compd., 2005, 389, 299–305 CrossRef CAS.
- X. Tian and J. F. E. Kennedy, J. Tribol., 1994, 116, 167–174 CrossRef.
- F. E. Kennedy, in Frictional heating and contact temperatures, ed. B. Bhushan, Taylor & Francis, 2010, pp. 235–272 Search PubMed.
- P. Y. Butyagin and I. K. Pavlichev, React. Solids, 1986, 1, 361–372 CrossRef CAS.
- C. Baldé, Sodium alanate nanoparticles for hydrogen storage, PhD thesis, Utrecht University, Utrecht, 2008, p. 101 Search PubMed.
- W. Grochala and P. P. Edwards, Chem. Rev., 2004, 104, 1283–1316 CrossRef CAS PubMed.
- H. Gunaydin, K. N. Houk and V. Ozolinš, Proc. Natl. Acad. Sci. U. S. A., 2008, 105, 3673–3677 CrossRef CAS PubMed.
- J. Li, C. Nagamani and J. S. Moore, Acc. Chem. Res., 2015, 48, 2181–2190 CrossRef CAS PubMed.
- A. E. M. Beedle, M. Mora, C. T. Davis, A. P. Snijders, G. Stirnemann and S. Garcia-Manyes, Nat. Commun., 2018, 9, 3155 CrossRef PubMed.
- A. J. Walton, Adv. Phys., 1977, 26, 887–948 CrossRef CAS.
- K. Nakayama and R. A. Nevshupa, Vacuum, 2004, 74, 11–17 CrossRef CAS.
- H. Qian, S. Kjelstrup, A. B. Kolomeisky and D. Bedeaux, J. Phys.: Condens. Matter, 2016, 28, 153004 CrossRef PubMed.
- B. E. Klamecki, Wear, 1984, 96, 319–329 CrossRef.
- G. K. P. Dathar and D. S. Mainardi, J. Phys. Chem. C, 2010, 114, 8026–8031 CrossRef CAS.
- F. Sterpone, S. Bonella and S. Meloni, J. Phys. Chem. C, 2012, 116, 19636–19643 CrossRef CAS.
- C. L. Carr, W. Jayawardana, H. Zou, J. L. White, F. El Gabaly, M. S. Conradi, V. Stavila, M. D. Allendorf and E. H. Majzoub, Chem. Mater., 2018, 30, 2930–2938 CrossRef CAS.
- F. Zhang, B. C. Wood, Y. Wang, C.-Z. Wang, K.-M. Ho and M.-Y. Chou, J. Phys. Chem. C, 2014, 118, 18356–18361 CrossRef CAS.
- G. B. Wilson-Short, A. Janotti, K. Hoang, A. Peles and C. G. Van de Walle, Phys. Rev. B: Condens. Matter Mater. Phys., 2009, 80, 224102 CrossRef.
- K. J. Michel and V. Ozolinš, J. Mater. Chem. A, 2014, 2, 4438–4448 RSC.
- M. Felderhoff and B. Zibrowius, Phys. Chem. Chem. Phys., 2011, 13, 17234–17241 RSC.
- M. Monteferrante, S. Bonella, S. Meloni, E. Vanden-Eijnden and G. Ciccotti, Scientific Modeling and Simulation SMNS, 2008, 15, 187–206 CrossRef CAS.
- E. G. Sorte, R. C. Bowman, E. H. Majzoub, M. H. W. Verkuijlen, T. J. Udovic and M. S. Conradi, J. Phys. Chem. C, 2013, 117, 8105–8113 CrossRef CAS.
- E. A. Deulin and R. A. Nevshupa, Appl. Surf. Sci., 1999, 144–145, 283–286 CrossRef CAS.
- J. Crank and E. Crank, The Mathematics of Diffusion, Clarendon Press, 1979 Search PubMed.
- Q. Shi, J. Voss, H. S. Jacobsen, K. Lefmann, M. Zamponi and T. Vegge, J. Alloys Compd., 2007, 446–447, 469–473 CrossRef CAS.
- S. B. Bulgarevich, M. V. Boiko and V. A. Feizova, J. Frict. Wear, 2017, 38, 316–320 CrossRef.
Footnotes |
| † Open access research data are available at Digital CSIC DOI: https://doi.org/10.20350/digitalCSIC/14811. |
| ‡ Electronic supplementary information (ESI) available: Structural characterization of NaAlH4 powder, details of the experimental setup and procedure for mechanically stimulated gas emission mass spectrometry, results of FTIR analysis, details of the pencil matrix method, analysis of the reaction order of “trail” emission, and analysis of the hypotheses about the mechanisms of hydrogen emission. See DOI: https://doi.org/10.1039/d2cp04681d |
| § In Section 3.3 it is shown that the time constant of any emission decays is about three to five orders of magnitude larger than the time constant of heat dissipation at the interface. |
| ¶ The graph has an asymmetric shape. The blue highlighted shoulder on the right part shows the part of the graph, which diverges from symmetry. This shape indicates a correlation between Q1 and Q2 with a time lag, which matches the difference in time constant between fast and slow decay processes. |
| This journal is © the Owner Societies 2023 |


