
Supercapacitive study for electrode materials around the framework-collapse point of a Ni-based coordination polymer†
Ye
Hong
a,
Tianqi
Chen
a,
Kuaibing
Wang
 *a,
Changyun
Chen
*c,
Cheng
Zhang
d and
Hua
Wu
*ab
*a,
Changyun
Chen
*c,
Cheng
Zhang
d and
Hua
Wu
*ab
aDepartment of Chemistry, College of Sciences, Nanjing Agricultural University, Nanjing 210095, P. R. China. E-mail: wangkb@njau.edu.cn; wuhua@njau.edu.cn
bCollege of Resources and Environmental Sciences, Nanjing Agricultural University, Nanjing 210095, P. R. China
cKey Laboratory of Advanced Functional Materials of Nanjing, School of Environmental Science, Nanjing Xiaozhuang University, Nanjing, 211171, Jiangsu, P. R. China. E-mail: cychen@njxzc.edu.cn
dJiangsu Key Laboratory of Micro and Nano Heat Fluid Flow Technology and Energy Application, School of Physical Science and Technology, Suzhou University of Science and Technology, Suzhou, 215009, China
First published on 9th November 2022
Abstract
A coordination polymer precursor, namely Ni-TATB, has been synthesized from 4,4′,4′′-s-triazine-2,4,6-triyl-tribenzoate (H3TATB) as a tripodal ligand and nickel acetate providing nickel metal nodes. According to the thermogravimetric curve, Ni-TATB is calcined at four temperatures of 300 °C, 365 °C, 375 °C and 400 °C around the collapse point (370 °C), and the corresponding products are obtained, namely, Ni-TATB-300, Ni-TATB-365, Ni-TATB-375 and Ni-TATB-400, respectively. The characterization results show that below 370 °C, with the increase of the calcination temperature, the Ni-TATB skeleton structure will be retained, and more Ni(II) species are exposed on the surface, resulting in the improvement of the electrochemical performance. However, the calcination temperature selected above 370 °C will destroy the framework structure of MOFs and reduce Ni(II) to Ni(0), resulting in a significant decrease in the performance. Electrochemical performance tests show that the Ni-TATB-365 electrode exhibits a maximum specific capacity of 294.5 C g−1 at a current density of 1.0 A g−1, superior to the other electrodes, suggesting that high-temperature activation while maintaining the framework architecture of the coordination polymer can effectively enhance the final performance. Additionally, the asymmetric supercapacitors, which consist of activated carbon (AC) and a Ni-TATB-365 device, Ni-TATB-365//AC, deliver a higher energy density of 24.44 W h kg−1, superior cycling stability and practical applications in powering LEDs.
Introduction
How to efficiently store energy is a key goal to promote the development of human society, and various energy storage devices such as fuel cells, supercapacitors (SCs), and batteries have emerged.1,2 Among them, SCs have drawn much attention owing to their advantages of ultra-fast charging–discharging, ultrahigh power density and long-term endurance ability.3 To design a superior SC device, characteristic electrode materials, either positive or negative electrodes, are essential and the first option to consider, and therefore various materials have been constantly developed recently. Coordination polymers (CPs), containing metal–organic frameworks (MOFs), are a kind of material with tunable pore space composed of organic ligands and metal centers4 and are becoming a research hotspot in the field of SCs. By replacing different organic ligands or transition metals with conjugated systems, various CPs, such as Ni-MOF, Fe-MOF, Co/Zn-MOF, etc., have been obtained, and researchers are still dedicated to improving CP-based electrode materials through novel chemical and physical methodologies.5–7 However, the disadvantages of poor electrical conductivity and unstable structure of CPs still limit their commercial application.One strategy, namely, the preparation of nanostructured materials such as metals, carbon, and metal oxides by decomposing CP precursors, is being applied these days and has proven to be an effective method to address these defects.8,9 CP-based derivatives pyrolyzed under inert conditions are usually carbon-based nanostructured materials, including single-crystal carbon materials, heteroatom-doped carbon materials, carbon/transition metal nanoparticle composites and carbon/transition metal compound composites.10 The achieved inorganic systems could effectively enhance conductivity and stability. Besides, the CP-derived materials are obtained at distinct calcination temperatures, adjusting their i)composition,11–13 ii) morphology,14 and iii) interior function and structural properties.15
CPs have been documented for preparing single-crystal carbon materials with micro/mesoporous architectures16,17 and utilized as electrode materials for electric double-layer capacitors.18,19 Thus far, many literature studies have suggested that the composite materials of metal oxide nanoparticles (NPs) and carbon obtained through a direct pyrolysis method would exhibit better energy density and durability of electrode materials.20 Higher pyrolysis temperature facilitates the formation of ordered graphitic carbon with remarkable electrical conductivity. Still, it is challenging to preserve the original morphology of CPs.21 This will lead to the collapse of abundant pores inside the CPs, which is not conducive to the contact between reactants and metal sites. Regarding this issue, by controllably calcining part of the MOF, Hu and coauthors synthesized active NiO nanoparticles preserving the porous nanostructure of the MOFs, which exhibited efficient electrocatalysis.22 Several research groups found that low-temperature calcination could help to maintain the mother precursor shape and enhance the resulting electrochemical performance.23 Therefore, searching for appropriate decomposition temperatures of CPs becomes a top priority in fabricating inorganic composites.
Inspired by these, a decomposition temperature of CPs is first chosen as a critical point, and several distinct temperatures around this point have been set for comparison. In this regard, a proper pyrolysis temperature around the critical point would be chosen through the comparison data. In this manuscript, 4,4′,4′′-s-triazine-2,4,6-triyl-tribenzoic acid (H3TATB) was selected as the building block for architecting a coordination polymer, namely, Ni-TATB. The strong π–π stacking between every two adjacent triazine rings in the organic ligand TATB is able to enhance the stability of the resulting frameworks.24–27 Four temperatures were selected for calcination under N2 conditions based on the thermogravimetric curve. For convenient description, the derived products were recorded as Ni-TATB-X (X = 300, 365, 375, and 400), respectively. Additionally, the corresponding electrochemical performances of these four electrode materials are also discussed and compared, either in three-electrode or two-electrode configurations.
Results and discussion
The thermogravimetric (TG) curve of Ni-TATB shows three mass drops as shown in Fig. 1a. The first drop occurred in the range of 25 °C to 50 °C, with a loss of 7% of the total weight, which can be attributed to the loss of free water between Ni-TATB molecules. The second drop occurred in the range of 50–370 °C with a loss of 33% of the total weight, which was considered to be mainly the loss of bound water and some of the ligands in Ni-TATB. It can be seen that the framework-collapse point of Ni-TATB occurs at 370 °C, indicating that the material has good thermal stability below 370 °C. Between 370 °C and 440 °C is the third drop of Ni-TATB with a mass loss of 56%, which is considered to be the pyrolysis of ligands and the conversion of Ni-based species. | ||
| Fig. 1 a) TGA curve of the Ni-TATB sample. b) SEM of Ni-TATB. c) Comparison of the XRD patterns of Ni-TATB and its calcined samples. d) Ni 2p XPS spectra of Ni-TATB. | ||
SEM was first used to characterize the distinct morphology alteration for the products around this critical point. The Ni-TATB precursor presented an interlaced elongated nanorod structure (Fig. 1b), which was about 1–2 μm long with a mean width of 80 nm. When the water molecules dropped, the Ni-TATB-300 sample still maintained its nanorod structure (Fig. S1a†), but cracks appeared, and small particles (probably Ni nanoparticles28) were exposed on the surface. With the increase of calcination temperature, such fine particles increase and accumulate on Ni-TATB, causing the morphological fracture. Compared with Ni-TATB-300, Ni-TATB-365 has been broken into more fragments, and smaller particles appeared (Fig. S1b†). Above 370 °C, the SEM image of Ni-TATB-375 displays a loose sponge-like structure, and the tiny particles gathered together into a cluster motif (Fig. S1c†). The surface of Ni-TATB-400 is uneven, and the particles are more tightly gathered than those for Ni-TATB-375 (Fig. S1d†).
FT-IR, XRD, XPS, and EDS tests were further carried out to explore the changes in the composition before and after calcination at different temperatures. The FT-IR peak of Ni-TATB (Fig. S2†) at 3467 cm−1 could be attributed to the adsorption of water molecules or the –OH group. The characteristic peaks at 1593, 1472, 1313 and 1274 cm−1 were assigned to the skeletal vibration of the aromatic ring, and the out-of-plane deformation vibration of the aromatic ring was centered at 846 cm−1, 796 cm−1 and 674 cm−1. Comparing the FT-IR patterns as shown in Fig. S2,† it is found that all calcined samples have almost the same peak shape and position as the Ni-TATB precursor, indicating that the derivatives all contain the organic components of Ni-TATB.
The firm peaks shown by XRD indicated that the Ni-TATB precursor was highly crystalline (Fig. 1c). With the increase of calcination temperature, there were peaks in the 2θ degrees lower than 30°, which further proved that Ni-TATB was still present, which was good agreement with the results of FT-IR. The Ni-TATB-300 and Ni-TATB-365 samples both had a bulge near 2θ = 45°, indicating that the calcination below 370 °C tended to form Ni metals partially, which was related to the nanoparticles observed in the previous SEM images. For the Ni-TATB-375 sample, it showed apparent diffraction peaks at 2θ = 44.5°, 51.8° and 76.4°, corresponding to the (111), (200), (220) planes of cubic Ni (PDF#87-0712), respectively. It is shown that above 370 °C, many Ni ions and ligands undergo chemical bond breakage and are converted into Ni metal. At the calcination temperature of 400 °C, the diffraction peaks of NiO (PDF#71-1179) and Ni (PDF#87-0712) were found simultaneously, indicating that part of the Ni metal was oxidized to NiO by the oxygen species from the ligand. Hence, the derived chemical composition at 400 °C could be MOF/Ni/NiO/C composites, which resemble the recent reports on one-step calcination of Ni-MOF at 400 °C under an Ar atmosphere.23
XPS further confirmed the valence state of the derived composites. Below 370 °C, the Ni 2p spectrum (Fig. 1d and S3a and b†) mainly involves the 2p3/2 orbital (856.16 eV) and 2p1/2 orbital of Ni2+ (873.82 eV) and the 2p3/2 orbital (861.54 eV) and 2p1/2 orbital (880.08 eV) of the satellite peak, indicating the Ni(II) valence state of the Ni-TATB material and no obvious Ni(0) metal. When the calcination temperature exceeds 370 °C (Fig. 2c and d), the 2p3/2 orbital (854.18 eV) and 2p1/2 orbital (871.8 eV) of Ni0 appeared in the XPS narrow spectrum, which was in line with the XRD results. The detailed elemental compositions detected by XPS are listed in Table S1† and confirm the derived materials' composition state. Ni-TATB and its calcined samples contain four elements, namely, C, N, O, and Ni. As the calcination temperature increased, the Ni element ratio on the surface of the Ni-TATAB-365 increased, while it decreased for the Ni-TATB-375 sample. This result suggests that more Ni(II) species were exposed when getting closer to the critical point where the coordination polymer precursors tend to collapse. EDS was also used to detect the proportion of the elements on the surface of the materials, which can correlate well with the XPS results (Fig. S3 and S4†). Moreover, the distinct chemical compositions could also be evidenced by the color change at different calcination temperatures, as shown in Fig. 3.
 | ||
| Fig. 2 Ni 2p XPS spectra of a) Ni-TATB-300, b) Ni-TATB-365, c) Ni-TATB-375, and d) Ni-TATB-400. | ||
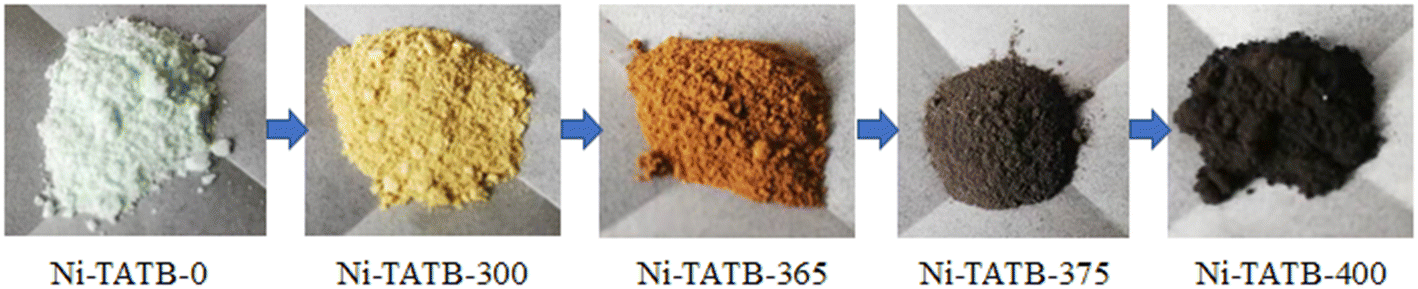 | ||
| Fig. 3 Different colors of the Ni-TATB-X powder, respectively (X = 0, 300, 365, 375, and 400). | ||
Except for the exterior morphology and colors, the interior pore size and distributions were also investigated. N2 adsorption–desorption experiments were carried out for all the as-obtained materials. The adsorption and desorption behaviors were all ascribed to the characteristics of type IV isotherms (Fig. S5†). Meanwhile, it could be observed that the adsorption isotherm had no evident saturated adsorption plateau, indicating the existence of mesoporous structure in these derived materials. Compared to the resulting data, Ni-TATB had the highest specific surface area, average pore size and pore volume. It mainly resulted from the stacking voids between nanorods. With the increase of calcination temperature up to 300 °C, fine cracks appeared and affected the stacking voids between the nanorods, decreasing the resulting specific surface, average pore size and pore volume. For Ni-TATB-365, the nanorods were broken, the original stacked voids were further filled, and more mesopores appeared, resulting in an increase in the specific surface area and a further decrease in the average pore size and pore volume. Beyond 370 °C, due to the pyrolysis of MOFs, Ni and NiO species appeared, and the mesopores began to collapse, causing the decrease of the specific surface area, either for the Ni-TATB-375 or Ni-TATB-400 sample.
The obtained materials, namely, the Ni-TATB precursor, Ni-TATB-300, Ni-TATB-365, Ni-TATB-375, and Ni-TATB-400, were separately utilized as active components to verify the potential electrochemical performances. It could be seen from the CV curves (Fig. 4 and 5a) that all the voltage windows ranged from 0–0.65 V and possessed prominent redox peaks, which suggests that they belong to the battery behavior.29 The redox process mainly occurs in Ni(II) species, which can be converted into Ni(III) species in electrochemical process.30 At scan rates from 5 to 100 mV s−1, the oxidation and reduction peaks shifted more toward the positive and negative electrodes as the scanning potential increased, possibly due to increased ohmic resistance and polarization.31 In comparison, the peak currents of Ni-TATB-300 and Ni-TATB-365 electrodes were much higher than those of Ni-TATB, Ni-TATB-375 and Ni-TATB-400 electrodes, indicating that Ni-TATB-300 and Ni-TATB-365 are more conducive to the transfer of electrons.
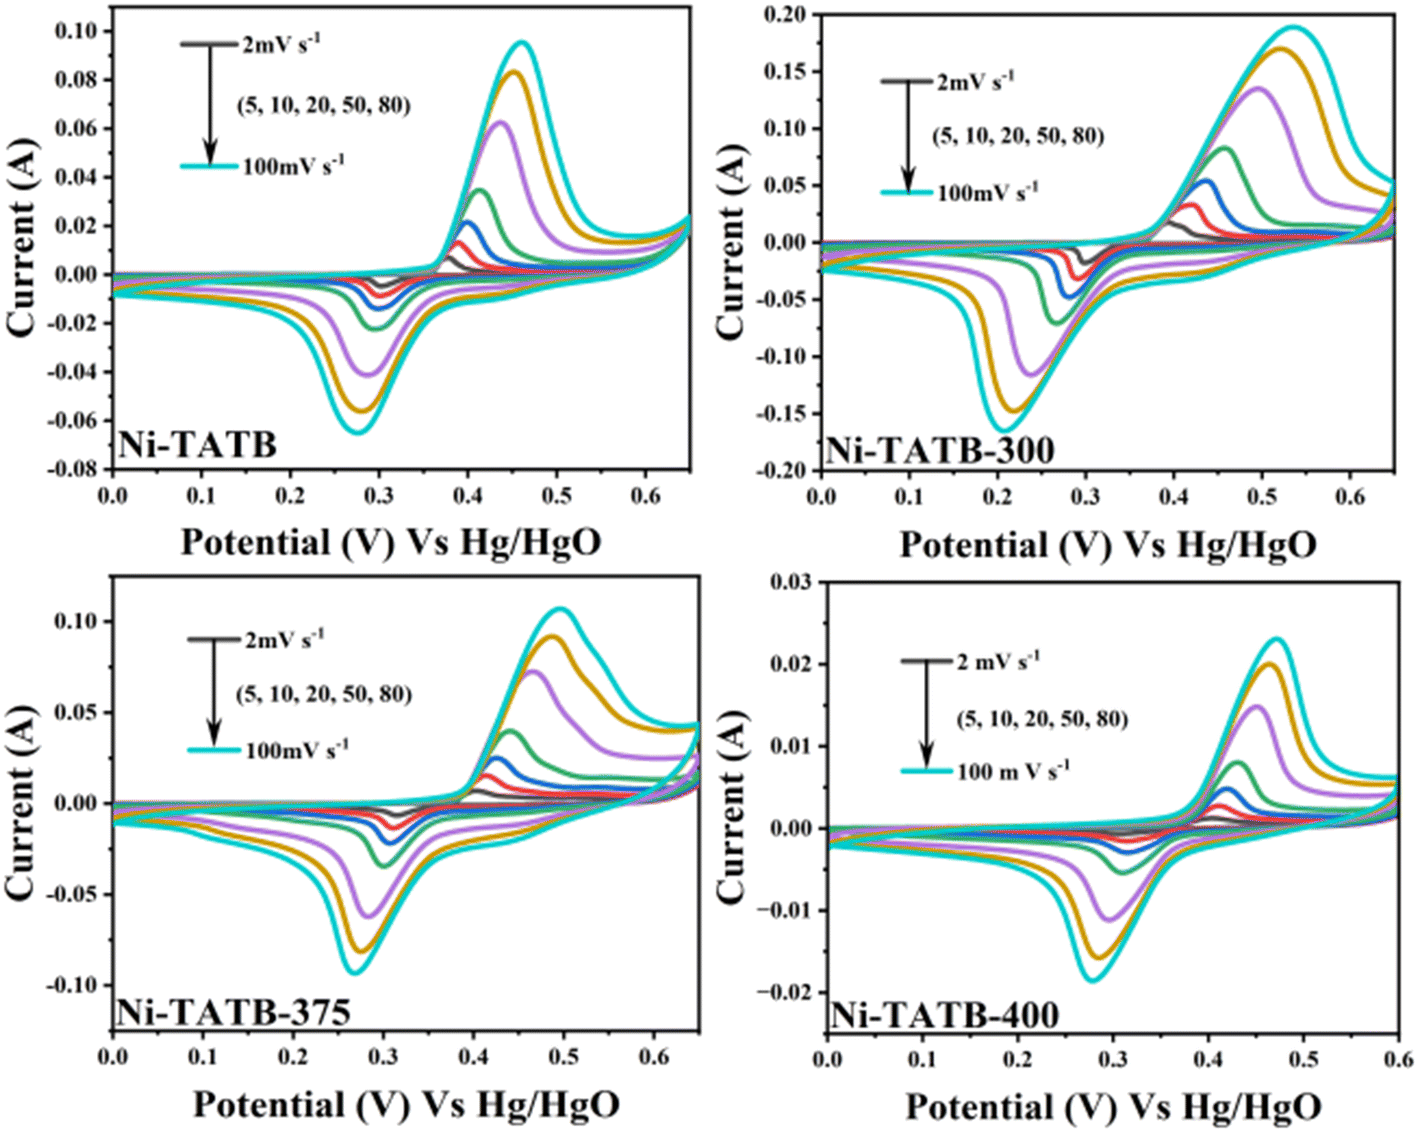 | ||
| Fig. 4 CV curves of Ni-TATB, Ni-TATB-300, Ni-TATB-375 and Ni-TATB-400 at different scan rates. | ||
 | ||
Fig. 5 a) CV curves of Ni-TATB-365 at different scan rates. b) CP curves of Ni-TATB-375 at different current densities. c) Specific capacitance of different electrodes calculated from the CP curves as a function of current density. d) Power-law dependence of peak current on sweep rate for the Ni-TATB, Ni-TATB-300, Ni-TATB-365, and Ni-TATB-375. The sweep rates were varied from 2 to 100 mV s−1. e) Charge storage comparison of Ni-TATB and its derivatives (2 mV s−1 scan rate). The total charge is divided into surface and diffusion contributions. f) Nyquist plots of the electrodes obtained in a frequency range from 0.01 to 100![[thin space (1/6-em)]](https://www.rsc.org/images/entities/char_2009.gif) 000 Hz. 000 Hz. | ||
The galvanostatic charge–discharge curves (GCD) of these five electrodes were then explored at different current densities. There was a voltage plateau during the charge–discharge process, which supports the CV results of a typical feature of the battery behavior (Fig. 5b and S6†). Notably, the Ni-TATB-400 electrode delivered deficient specific capacity (only 16.4 C g−1 at a current density of 1.0 A g−1), corresponding to the lowest peak currents observed from the CV curves. Under the same current density, the Ni-TATB-365 electrode exhibited a superior performance with a maximum specific capacity of 294.5 C g−1, almost 18-fold higher than that of the Ni-TATB-400 electrode. This phenomenon could be due to the almost complete collapse of the MOF frameworks at 400 °C and the dramatically reduced active redox sites, consequently lowering the resulting electrochemical performance.
Fig. 5c depicts the detailed specific capacities versus current densities of Ni-TATB-365 with the other three electrodes, including Ni-TATB, Ni-TATB-300, and Ni-TATB-375. As calculated, their specific capacities reached 261.3 C g−1, 268.3 C g−1 and 234.7 C g−1 at 1 A g−1, respectively. Similarly, the Ni-TATB-300 and Ni-TATB-365 electrodes exhibit superior performances, suggesting that maintaining the framework structure of MOFs is essential for providing more redox-active centers and retaining excellent performance. This result is in good agreement with the CV results. In general, the higher the peak current of the CV curve at the same sweep speed for almost the same loading of the electrode material, the larger the integration area, which means more energy is stored in the material and the specific capacitance measured by the CP test is higher. The specific capacity of the material calcined below 370 °C enhances with the increase in temperature. The Ni-TATB-365 reached the maximum specific capacitance because the MOF-based framework began to collapse partially, and conductive Ni(II) metal species were exposed on the surface, which is beneficial to the contact between the electrolyte and active components. This analysis was concluded from the XRD, XPS and BET tests previously.
The contribution ratios of the surface-control and diffusion-dominant parts of the total charge storage were also calculated. According to the power-law equation proposed by Dunn's group,32 a plot of logi (peak current) versus logv was obtained for the Ni-TATB precursor and its derivative electrodes (Fig. 5d). The simulated b values of Ni-TATB and its derivative electrodes are all between 0.5 and 1.0, indicating that the battery behavior of these electrodes all originates from two mechanisms: the Faradaic diffusion process and the surface-capacitive response. These two independent mechanisms can be further quantitatively determined using the equation i(V)/v1/2 = k1v1/2 + k2,33,34 where i(V) is the peak current in the CV curve, and v represents the scanning potential. The related capacitive contributions of the surface control (k1v) and the diffusion section (k2v1/2) are shown in Fig. S7.† At a sweep rate of 2 mV s−1, the surface contribution of Ni-TATB-365 reaches the maximum at 38.1% of the total stored charge (Fig. 5e). It could be directly involved with the exposed Ni(II) species, which provides abundant redox centers. As evidence, the second higher Ni-TATB-300 also possesses a 35.4% of the surface-controlled charge. Nyquist plots were used to assess their charge-transfer conditions, as shown in Fig. 5f. It is acknowledged that the smaller the diameter of the semicircular part in the low-frequency region, the lower the internal resistance of the material. As expected, the charge-transfer resistance (Rct) of the materials is 4.0 Ω, 9.4 Ω, 14.2 Ω, and 16.8 Ω for Ni-TATB-365, Ni-TATB-300, Ni-TATB and Ni-TATB-375, respectively. Besides, the low series resistance (Rs) of Ni-TATB-365 (0.66 Ω) further explains its superior performance among these electrodes. This result confirms that the maintenance of the metal–organic framework and exposure of Ni(II) species could shorten the diffusion path length and thus enhance the final performance.
In order to further explore their potential applications, Ni-TATB and its calcined samples served as positive electrodes and were separately assembled with activated carbon (AC) negative electrodes to form asymmetric supercapacitor devices, denoted as Ni-TATB//AC, Ni-TATB-300//AC, Ni-TATB-365//AC, and Ni-TATB-375//AC. Two-electrode tests were performed on these devices, before which the charge–discharge profiles of AC and the CV curves of each electrode material at a constant scan rate of 20 mV s−1 were investigated (Fig. 6a and b). At a current density of 1 A g−1, the specific capacitance of the activated carbon achieved 106 F g−1. Based on the polarization curves as shown in Fig. S8,† it was determined that the working potential could reach up to 1.65 V. Under this voltage window, the CV curves of these four devices remained unchanged at each sweep rate, indicating excellent alkali resistance (Fig. S9† and 7a). Through analyzing the discharge branch (Fig. 7b and S10†), Ni-TATB-365//AC exhibited a maximum specific capacitance of 60.7 F g−1 at 1 A g−1. In general, a phase angle close to 90° in the low-frequency region will achieve the ideal capacitive behavior, while close to 45° shows a pseudocapacitive behavior.35,36 As shown in Fig. S11,† the phase angles of the four energy storage devices are 52.8°, 56.7°, 65.2°, and 74.5° for Ni-TATB//AC, Ni-TATB-300//AC, Ni-TATB-365//AC, and Ni-TATB-375//AC in the bode diagram, respectively, indicating that the higher the calcination temperature, the closer the energy storage behavior of the positive material is to the ideal capacitance. Among them, the best performance of Ni-TATB-365//AC could be ascribed to the joint contribution of ideal- and pseudo-capacitors. To further assess the important parameter of energy density and power density, the Ragone diagram based on the charge–discharge profiles was depicted (Fig. 7c), at a power density of 425 W kg−1, an energy density of 24.44 W h kg−1 was achieved for the Ni-TATB-365//AC device, superior to the other devices and compared with other studies.37–41 Then this asymmetric device was assembled into a button battery, and the LED demo experiment was carried out. Two button cells in series could power the small LEDs and last for several minutes (Fig. 7d), proving the superiority of the Ni-TATB-365//AC device and its application potential. Furthermore, the cycling stability of these four devices was investigated by CV at a scan rate of 30 mV s−1 (Fig. S12†). After 2000 unceasing charge–discharge cycles, Ni-TATB//AC, Ni-TATB-300//AC, Ni-TATB-365//AC, and Ni-TATB-375//AC could maintain the specific capacitance above 85%, among which Ni-TATB-300//AC even retained 97.7% of the maximum capacitance retention rate, suggesting its superior practical applications. Besides, the pristine Ni-TATB-365 electrode could endure alkaline erosion and kept the capacity retention up to 109.6% (Fig. S13a†). Based on this superior performance, even after 5000 unceasing charge–discharge cycles, the Ni-TATB-365//AC device also had a surprisingly high capacitance retention rate of 97% (Fig. S13b†).
 | ||
| Fig. 6 a) CP curves of AC at a current density of 1 A g−1 in 6 mol L−1 KOH. b) CV curves of AC and Ni-TATB, Ni-TATB-300, Ni-TATB-365, and Ni-TATB-375 at a scan rate of 20 mV s−1. | ||
 | ||
| Fig. 7 a) CV curve of the Ni-TATB-365//AC device. b) CP curve of the Ni-TATB-365//AC device. c) Ragone plots of the energy density and power density for the Ni-MOF-based devices and some reference samples; d) LED display of Ni-MOFs-365//AC. | ||
Conclusion
A coordination polymer precursor, namely Ni-TATB, with a nanorod-type structure has been synthesized. Thermogravimetry analyses show good thermal stability below 370 °C. To investigate the influence of critical temperature points on final calcination products and their resulting properties, four calcination temperatures are selected around 370 °C, namely, 300, 365, 375, and 400 °C. Under a three-electrode configuration, the electrochemical performances of the Ni-TATB-300 and Ni-TATB-365 electrodes achieved below 370 °C are superior to those of the original Ni-TATB precursor and the electrodes above 370 °C (Ni-TATB-375 and Ni-TATB-400). Among them, the Ni-TATB-365 electrode has the best electrochemical performance, with a specific capacitance of 294.5 C g−1 at a current density of 1.0 A g−1. Even after being assembled into an asymmetric device, the Ni-TATB-365//AC device still exhibits a maximum energy density of 24.4 W h kg−1 at a power density of 425 W kg−1, excellent cycling stability and potential applications on power LEDs. These results indicate that coordination-polymer-derived materials calcined below the framework-collapse temperature, especially near the critical point, will retain the metal–organic framework and better expose the active sites, which will facilitate the transport of electrolyte ions and make good contacts with electrolytes, resulting in enhanced electrochemical performances.Conflicts of interest
There are no conflicts to declare.Acknowledgements
This work was supported by the National Natural Science Foundation of China (22279061), the Fundamental Research Funds for the Central Universities and the Natural Science Foundation of Jiangsu Province (BK20180514 and BK20190503). The authors would like thank the College of Science, Nanjing Agricultural University, for the MiniFlex600 (Rigaku, Japan) used in the PXRD measurement and analysis.References
- M. S. Balogun, W. T. Qiu, W. Wang, P. P. Fang, X. H. Lu and Y. X. Tong, J. Mater. Chem. A, 2015, 3, 1364–1387 RSC.
- L. Li, Z. Wu, S. Yuan and X. B. Zhang, Energy Environ. Sci., 2014, 7, 2101–2122 RSC.
- C. Choi, D. S. Ashby, D. M. Butts, R. H. DeBlock, Q. Wei, J. Lau and B. Dunn, Nat. Rev. Mater., 2019, 5, 5–19 CrossRef.
- W. Zhang, J. Chu and M. Hu, Chem. – Asian J., 2020, 15, 1202–1213 CrossRef CAS PubMed.
- M. Azadfalah, A. Sedghi, H. Hosseini and S. S. Mirhosseini, J. Energy Storage, 2021, 44, 103248 CrossRef.
- J. H. Li, Y. C. Chen, Y. S. Wang, W. H. Ho, Y. J. Gu, C. H. Chuang, Y. D. Song and C. W. Kung, ACS Appl. Energy Mater., 2020, 3, 6258–6267 CrossRef CAS.
- R. Vanaraj, R. Vinodh, T. Periyasamy, S. Madhappan, C. M. Babu, S. P. Asrafali, R. Haldhar, C. J. Raorane, H. Hwang, H. J. Kim, M. Yi and S. C. Kim, Energy Fuels, 2022, 36, 4978–4991 CrossRef CAS.
- Z. J. Jiang, S. Cheng, H. B. Rong, Z. Q. Jiang and J. L. Huang, J. Mater. Chem. A, 2017, 5, 23641–23650 RSC.
- M. Zhong, L. J. Kong, N. Li, Y. Y. Liu, J. Zhu and X. H. Bu, Coord. Chem. Rev., 2019, 388, 172–201 CrossRef CAS.
- W. H. Hu, M. B. Zheng, B. Y. Xu, Y. Wei, W. Zhu, Q. Li and H. Pang, J. Mater. Chem. A, 2021, 9, 3880–3917 RSC.
- S. J. Yang, T. Kim, J. H. Im, Y. S. Kim, K. Lee, H. Jung and C. R. Park, Chem. Mater., 2012, 24, 464–470 CrossRef CAS.
- J. Hu, H. Wang, Q. Gao and H. Guo, Carbon, 2010, 48, 3599–3606 CrossRef CAS.
- S. H. Liu, Z. Y. Wang, S. Zhou, F. J. Yu, M. Z. Yu, C. Y. Chiang, W. Z. Zhou, J. J. Zhao and J. S. Qiu, Adv. Mater., 2017, 29, 1700874 CrossRef PubMed.
- F. Zou, S. L. Chao, Y. X. Wang, Y. L. Wang, Q. X. Guan and W. Li, Environ. Sci.: Nano, 2017, 4, 46–51 RSC.
- J. H. Zhang, M. Huang, B. J. Xi, K. Mi, A. H. Yuan and S. L. Xiong, Adv. Energy Mater., 2018, 8, 1701330 CrossRef.
- M. Hu, J. Reboul, S. Furukawa, N. L. Torad, Q. M. Ji, P. Srinivasu, K. Ariga, S. Kitagawa and Y. Yamauchi, J. Am. Chem. Soc., 2012, 134, 2864–2867 CrossRef CAS.
- B. Liu, H. Shioyama, T. Akita and Q. Xu, J. Am. Chem. Soc., 2008, 130, 5390–5391 CrossRef CAS PubMed.
- J. A. Hu, H. L. Wang, Q. M. Gao and H. L. Guo, Carbon, 2010, 48, 3599–3606 CrossRef CAS.
- J. K. Sun and Q. Xu, Energy Environ. Sci., 2014, 7, 2071–2100 RSC.
- E. Kim and M. Yoon, J. Porous Mater., 2015, 22, 1495–1502 CrossRef CAS.
- M. Zhong, L. J. Kong, N. Li, Y. Y. Liu, J. Zhu and X. H. Bu, Coord. Chem. Rev., 2019, 388, 172–201 CrossRef CAS.
- Q. Hu, X. W. Huang, Z. Y. Wang, G. M. Li, Z. Han, H. P. Yang, X. Z. Ren, Q. L. Zhang, J. H. Liu and C. X. He, J. Mater. Chem. A, 2020, 8, 2140–2146 RSC.
- J. Y. Chen, Q. Xu, Y. Shu and X. Y. Hu, Talanta, 2018, 184, 136–142 CrossRef CAS.
- N. Li, Y. Li, Q. Li, Y. Zhao, C. S. Liu and H. Pang, J. Colloid Interface Sci., 2021, 581, 709–718 CrossRef CAS PubMed.
- Y. Gogotsi and R. M. Penner, ACS Nano, 2018, 12, 2081–2083 CrossRef CAS PubMed.
- Y. Shu, Y. Yan, J. Y. Chen, Q. Xu, H. Pang and X. Y. Hu, ACS Appl. Mater. Interfaces, 2017, 9, 22342–22349 CrossRef CAS.
- S. W. Gao, Y. W. Sui, F. X. Wei, J. Q. Qi, Q. K. Meng and Y. Z. He, J. Mater. Sci.: Mater. Electron., 2018, 29, 2477–2483 CrossRef CAS.
- J. Wang, J. Polleux, J. Lim and B. Dunn, J. Phys. Chem. C, 2007, 111, 14925–14931 CrossRef CAS.
- V. Augustyn, J. Come, M. A. Lowe, J. W. Kim, P. Taberna, S. H. Tolbert, H. D. Abruña, P. Simon and B. Dunn, Nat. Mater., 2013, 12, 518–522 CrossRef CAS PubMed.
- J. Wang, J. Polleux, J. Lim and B. Dunn, J. Phys. Chem. C, 2007, 111, 14925–14931 CrossRef CAS.
- S. Manoharan, S. Sahoo, P. Pazhamalai and S. J. Kim, Int. J. Hydrogen Energy, 2018, 43, 1667–1674 CrossRef CAS.
- A. Nashim, S. Pany, K. M. Parida and J. Nanda, ChemistrySelect, 2019, 4, 12037–12042 CrossRef CAS.
- N. Li, Y. Li, Q. Li, Y. Zhao, C. S. Liu and H. Pang, J. Colloid Interface Sci., 2021, 581, 709–718 CrossRef CAS PubMed.
- X. X. Meng, J. Y. Li, B. L. Yang and Z. X. Li, Appl. Surf. Sci., 2020, 507, 145077 CrossRef CAS.
- S. W. Gao, Y. W. Sui, F. X. Wei, J. Q. Qi, Q. K. Meng, Y. J. Ren and Y. Z. He, Nano, 2019, 14, 1950032 CrossRef CAS.
- M. Azadfalah, A. Sedghi and H. Hosseini, J. Mater. Sci.: Mater. Electron., 2019, 30, 12351–12363 CrossRef CAS.
- S. Zhao, H. Wu, Y. Li, Q. Li, J. Zhou, X. Yu, H. Chen, K. Tao and L. Han, Inorg. Chem. Front., 2019, 6, 1824–1830 RSC.
Footnote |
| † Electronic supplementary information (ESI) available. See DOI: https://doi.org/10.1039/d2ce01236g |
| This journal is © The Royal Society of Chemistry 2023 |