
Optimizing extraction solvents for deoxynivalenol analysis in maize via infrared attenuated total reflection spectroscopy and chemometric methods†
Antoni
Femenias
a,
Polina
Fomina
 b,
Valeria
Tafintseva
c,
Stephan
Freitag
de,
Volha
Shapaval
c,
Michael
Sulyok
de,
Boris
Zimmermann
c,
Sonia
Marín
a,
Rudolf
Krska
def,
Achim
Kohler
c and
Boris
Mizaikoff
*bg
b,
Valeria
Tafintseva
c,
Stephan
Freitag
de,
Volha
Shapaval
c,
Michael
Sulyok
de,
Boris
Zimmermann
c,
Sonia
Marín
a,
Rudolf
Krska
def,
Achim
Kohler
c and
Boris
Mizaikoff
*bg
aApplied Mycology Unit, Food Technology Department, University of Lleida, UTPV-XaRTA, Agrotecnio, Av. Rovira Roure, 191, 25198 Lleida, Spain
bInstitute of Analytical and Bioanalytical Chemistry, Ulm University, Albert-Einstein-Allee 11, 89081 Ulm, Germany. E-mail: boris.mizaikoff@uni-ulm.de
cFaculty of Science and Technology, Norwegian University of Life Sciences, 1432 Ås, Norway
dUniversity of Natural Resources and Life Sciences, Vienna, Austria
eDepartment of Agrobiotechnology, IFA-Tulln, Institute of Bioanalytics and Agro-Metabolomics, Konrad-Lorenz-Strasse 20, 3430 Tulln an der Donau, Austria
fInstitute for Global Food Security, School of Biological Sciences, Queens University Belfast, University Road, Belfast, BT7 1NN, Northern Ireland, UK
gHahn-Schickard, Sedanstrasse 14, 89077 Ulm, Germany
First published on 25th November 2022
Abstract
Farmers, cereal suppliers and processors demand rapid techniques for the assessment of mould-associated contamination. Deoxynivalenol (DON) is among the most important Fusarium toxins and related to human and animal diseases besides causing significant economic losses. Routine analytical techniques for the analysis of DON are either based on chromatographic or immunoanalytical techniques, which are time-consuming and frequently rely on hazardous consumables. The present study evaluates the feasibility of infrared attenuated total reflection spectroscopy (IR-ATR) for the analysis of maize extracts via different solvents optimized for the determination of DON contamination along the regulatory requirements by the European Union (EU) for unprocessed maize (1750 μg kg−1). Reference analysis was done by liquid chromatography coupled to tandem mass spectrometry (LC-MS/MS). The studied maize samples were either naturally infected or had been artificially inoculated in the field with Fusarium graminearum, Fusarium culmorum or Fusarium verticillioides. Principal component analysis demonstrated that water and methanol–water (70![[thin space (1/6-em)]](https://www.rsc.org/images/entities/char_2009.gif) :30% v) were optimum solvents for differentiating DON contamination levels. Supervised partial least squares discriminant analysis resulted in excellent classification accuracies of 86.7% and 90.8% for water and methanol–water extracts, respectively. The IR spectra of samples with fungal infection and high DON contamination had distinct spectral features, which could be related to carbohydrates, proteins and lipid content within the investigated extracts.
:30% v) were optimum solvents for differentiating DON contamination levels. Supervised partial least squares discriminant analysis resulted in excellent classification accuracies of 86.7% and 90.8% for water and methanol–water extracts, respectively. The IR spectra of samples with fungal infection and high DON contamination had distinct spectral features, which could be related to carbohydrates, proteins and lipid content within the investigated extracts.
1. Introduction
Fusarium graminearum and Fusarium culmorum are plant-pathogenic fungal species commonly found on cereals, which have several negative effects on plant growth and cereal quality. In preharvest stages and during storage, these fungal species can grow on cereal ears and cause associated diseases. Maize ear rot is a severe disease caused by the growth of these species during flowering and before kernel development. Corn susceptibility to infection can trigger root, stalk and ear rot. Its most common effects are discolouration of ears, mycelial red or pink growth and drying of husks associated with weight loss. Thus, symptomatic ear rot affects cereal quality and it is also related to a decreased crop yield and economic loses.1,2Under suitable conditions, these Fusarium species produce mycotoxins as part of their secondary metabolism. One of the most prevalent mycotoxins produced by these fungal species is deoxynivalenol (DON), which is a well-known mycotoxin generally found in cereals. DON is most frequently produced and accumulated on grain during preharvest stages.3 Even the asymptomatic growth of Fusarium on maize ears can accumulate high amounts of DON, as well as fumonisins among other mycotoxins. Consequently, symptom inspection is an insufficient indicator of mycotoxin presence.4 Recent studies clear indicate that global warming and weather extremes as a result of climate change can have a massive impact on fungal invasion on food crops leading to an increase of DON incidence and other mycotoxins in some years.5 The amount of mycotoxin contaminated crops are generally anticipated to increase with the global warming, but at the same time major variations in mycotoxin contamination are also expected.6
Furthermore, DON presence in cereals is considered threatening to humans and livestock due to the associated diseases caused by the consumption of mycotoxin contaminated food and feed. DON exposure is mainly from cereals and cereal-based foods, wheat making the highest proportion (56–100%).6 High exposure mediates acute gastrointestinal symptoms in humans (e.g. vomiting), yet, the effects from chronic human exposure remain unknown. Weight gain suppression and anorexia are the most common chronic effects in animals. Anorexia is a frequently detected problem in livestock that causes weight loss and can have significant economic impact.7 In addition and due to its high stability, DON is not only removed to a limited extend by commonly used food processing methods, such as milling, baking, boiling, etc.8,9 Consequently, to fight against Fusarium toxins contamination, many countries have established maximum contamination levels for foodstuffs, in particular for DON. Since 2006, the European Comission10 has established the maximum concentration level for DON in unprocessed maize at 1750 μg kg−1 and maize intended for human consumption at 750 μg kg−1.
The most commonly used analytical methods for the determination of a wide range of mycotoxins, including DON, in cereals are based on liquid chromatography coupled to tandem mass spectrometry (LC-MS/MS), but also other detectors, such as UV and FLD are used.11 For the rapid detection of DON and other regulated toxins, immunoanalytical approaches, such as enzyme-linked immunosorbent assays (ELISA) are employed. However, these methods have in common that they are time consuming due to the required complex sample preparation, which usually involves extraction and clean-up, requires consumables and potentially hazardous chemicals, and are destructive.12 Moreover, routine analytical techniques require trained personnel and expensive laboratory equipment to quantify the mycotoxin contamination levels. Thus, new approaches are needed for the rapid and cost-effective determination of mycotoxins in food and feed samples.
Within the realm of photonic methods, infrared attenuated total reflection (IR-ATR) spectroscopy using Fourier transform infrared (FTIR) techniques has been proposed as an effective technique for mycotoxin detection in cereals. Since this technique requires minimal sample preparation, its implementation could significantly reduce sample handling time and in the end overall cost of the analysis.13 Additionally, IR spectroscopic methods hardly use any consumables or reagents; thus, IR-ATR spectroscopy may be considered an eco-friendly ‘green’ technique.14 Using FTIR spectroscopy provides additional associated advantages such as the ability to obtain holistic information on the sample composition, reliability, robustness and the potential to be miniaturized.15 Moreover, spectra acquisition with routine IR-ATR spectroscopy requires minimal training and device maintenance, and is ideally suited for rapid screening of cereal samples prior to laboratory confirmation vie more sophisticated standard methods only for the samples with contamination levels close to or above the legally established limits.
IR spectroscopy probes molecular vibrations in a non-destructive way. The mid-infrared (MIR) spectral region between 4000–400 cm−1 can be used to obtain the molecular fingerprint of the sample, and thus, provides comprehensive chemical information of the matrix under investigation.16 Protein, lipid and polysaccharide content of biological samples may be readily determined.17 Thus, sample changes due to fungal infestation univocally result in changes of the MIR spectrum linked to changes in sample composition. However, it should be noted that IR spectra of cereal samples are complex, due to the abundance of signals related to various chemical constituents (i.e. carbohydrates, proteins, lipids, water, etc.). Hence, the interpretation of variations in the IR spectrum is difficult and should not only rely on individual spectral bands. Consequently, multivariate methods such as principal component analysis (PCA), partial least squares regression (PLS-R), and partial least squares discriminant analysis (PLS-DA) are required to extract information from complex MIR spectra to obtain accurate and robust classification and quantification results.15,18
The present study describes the application of IR-ATR spectroscopy for the analysis of Fusarium fungal contamination of maize. Previous IR studies have shown that Fusarium fungi contaminations can be rapidly detected based on the observed changes in spectral regions related to lipid, protein and carbohydrate content variations. PCA could separate the blank samples from the DON and ergosterol contaminated ones with at least a 75% accuracy. For confirmation, DON levels were determined by gas chromatography (GC) and ergosterol by high pressure liquid chromatography (HPLC).19 Resulting, blank samples (<310 μg kg−1 of DON) and DON contaminated ones (310–2596 μg kg−1) were discriminated with an accuracy of 100%. The proposed method directly recorded IR-ATR spectra of ground (i.e. powdered) samples exploring different particle sizes with an optimum reproducibility obtained for a particle size of 100–250 μm.20 Using the same analysis and contamination conditions as the previous study, Kos et al.21 optimized the sample preparation comparing different sieving fractions and obtaining the highest DON concentrations at a particle size between 100–250 μm. The PCA results for maize sieved at 100–250 μm particle size displayed a 100% separation of blank (<310 μg kg−1 of DON) and contaminated (310–2596 μg kg−1) samples (79% for unsieved), thereby decreasing the relative standard deviation of the spectral measurements. Classifications on maize at DON regulatory limits was also investigated by Kos et al.22 IR spectroscopy was successful used to discriminate samples at a 1750 and 500 μg kg−1 DON threshold with minimum sample pre-treatment underlining the suitability of the proposed method for rapid measurements at industrial entry or storage points.22 Other mycotoxins have been also evaluated by IR-ATR spectroscopy in cereal commodities. The application of the method for fumonisin analysis has not shown positive results for concentrations lower than 10 mg kg−1 and it was only possible to distinguish between extremely contaminated samples (190 mg kg−1) and samples with low contamination (below 10 mg kg−1).23 However, the application of machine learning algorithms to IR-ATR data revealed exceptional results for DON contaminated sample classification,15 with IR-ATR having been applied to a series of ground cereal samples.23–25
Since IR-ATR spectroscopy is highly versatile in terms of the nature of the sample matrix, IR spectroscopy of cereal extracts obtained via optimized solvents may be a promising approach for mycotoxin analysis. Therefore, the present study aimed at evaluating different solvents in order to optimize discrimination between high and low DON contaminated samples. The main objective of this study was to establish a rapid analytical method based on IR-ATR analysis of maize extracts for the classification of DON contaminated samples at the regulatory threshold. Therefore, water, organic solvents and water–solvent mixtures have been tested to obtain a more robust method vs. ground/sieved solid samples. The obtained IR data sets were analyzed via PCA and sparse PLS-DA (SPLS-DA) to establish the IR-based differentiation of high and low contaminated samples.
2. Material and methods
2.1 Sample preparation
Maize samples were supplied by Saatbau Linz (SBL; Linz, Austria) and by the Cereal Research Center (CRC; Szeged, Hungary). The samples consisted of maize hybrids used for field production which included dent or flint kernels types. Two types of contamination experiments were performed. Low contaminated samples were obtained by natural contamination in the field. Conversely, high contaminations were generated with artificial infection by silk injection or toothpick inoculation of F. graminearum, F. verticillioides or F. culmorum, each species inoculated separately by each method. The artificial infections were performed during preharvest. Silk channel infection was performed 5 days after 50% of silking, while toothpick infection was performed 10 days after 50% silking. For the silk channel infection, maize ears were injected in the silk channel with 2 ml of Fusarium suspension at a concentration of 5 × 10⁵ conidia ml−1. The suspensions were obtained according to the method performed by Mesterházy,26 in which a bubble breeding method in mung bean broth was used. Frozen aliquots (−80 °C) were thawed rapidly to 35 °C before use. For the toothpick infection, a hole to the centre of the ear was drilled, followed by inserting a toothpick overgrown with Fusarium isolate. Harvested samples were milled (Romer, Union, MO, USA), followed by the solvent extraction. The samples were labelled according to the inoculation method: injection of F. graminearum in the silk channel (IG); toothpick inoculation with F. culmorum (ZC); injection of F. verticillioides in the silk channel (IV); toothpick inoculation with F. verticillioides (ZV); and natural infection unknown strains (NA).Before weighting, the obtained maize powder was shaken to homogenize the mycotoxin content. Then, 200 mg of powder were weighted at the precision balance (Sartorius Gmbh, Gottingen, Germany) and were transferred to a 1.5 ml tube (Eppendorf AG, Hamburg, Germany). 800 μl of solvent was added to the tube. In the first part of the study, the tested solvents were (v/v values in parenthesis): water (100), methanol:water (70:30), acetonitrile:water (70:30), ethanol:water (70:30), methanol:water (30:70) and methanol (100). The tubes were shaken horizontally on the rocking platform (VWR, UK) for 30 minutes at 70 rpm. Then, the extracts were centrifugated at the Clinical 100 centrifuge (VWR, UK) for twice 2 minutes at 5800 rpm obtaining the liquid phase in each step. In the second part of the work, a deeper evaluation of a bio-based solvent (water) and a non-bio-based solvent methanol:water (70:30) was performed, increasing number of samples in both datasets.
For the spectroscopic analysis, an aliquot of each extract (10 μl) was pipetted on the ATR crystal ensuring complete coverage. In all cases, enough time was allowed for solvents to evaporate before analysing. The times used were 15 minutes for water (100) and methanol:water (70:30); 5 minutes for acetonitrile:water (70:30), ethanol:water (70:30), methanol:water (30:70); and 2 minutes for methanol (100). Once the solvent was evaporated, the solid residues at the ATR crystal surface were analyzed by IR spectroscopy. Between each analysis, the crystal was cleaned with isopropanol, and a background spectrum of the empty ATR setting was measured for atmospheric compensation. In the first part of the study, a reduced sample set was used to explore effects of four different solvents; thereafter, one green and one non-green solvent were selected for further investigations. The remaining samples were extracted and analysed with those solvents using the same procedure to increase the size of the dataset in order to obtain robust classification models.
2.2 Infrared spectroscopy
All infrared spectra were recorded using a routine FTIR spectrometer (ALPHA II, Bruker Optik GmbH, Ettlingen, Germany) equipped with the platinum ATR unit. The ATR unit is equipped with a single reflection diamond ATR crystal. The Opus 8.1. Software (Bruker Optik GmbH, Ettlingen, Germany) was used to record the spectra. For each spectrum, 128 scans with the resolution 2 cm−1 were averaged. The spectral range of the MIR region (4000–400 cm−1) was selected for the analysis. The ranges between 3100–2800 cm−1 and 1800–800 cm−1 were significant for the chemometric data evaluation, since all relevant bands for the analysis are within these spectral regions (Table 1), as determined during previous studies.22 A raw IR spectrum (4000–800 cm−1) from a maize sample extracted with methanol 70% is represented in Fig. 1(a). The fingerprint regime of the same extract (1800–800 cm−1), relevant for data evaluation, is displayed in Fig. 1(b). Each extract was analyzed three times. Beyond the maize bands, characteristic bands of DON belong to the range of 1800–800 cm−1: e.g. band at 1680 cm−1, which corresponds to C–O vibrations. The EssentialFTIR Spectroscopy Software Toolbox (Operant LLC, USA) was used to convert the spectra to multifile format for further data evaluation. All data pre-processing was done during the chemometric analysis.| Vibrations | Wavenumber, cm−1 |
|---|---|
| C–H | 2900 |
| C–O ester stretching | 1745 |
| C–O fatty acid | 1710 |
| Amide I | 1650 |
| Amide II | 1540 |
| –C–H stretching, fatty acid | 1490–1425 |
| –C–H symmetric bending, methyl groups | 1420–1330 |
| Ring vibrations of carbohydrates | 1030 |
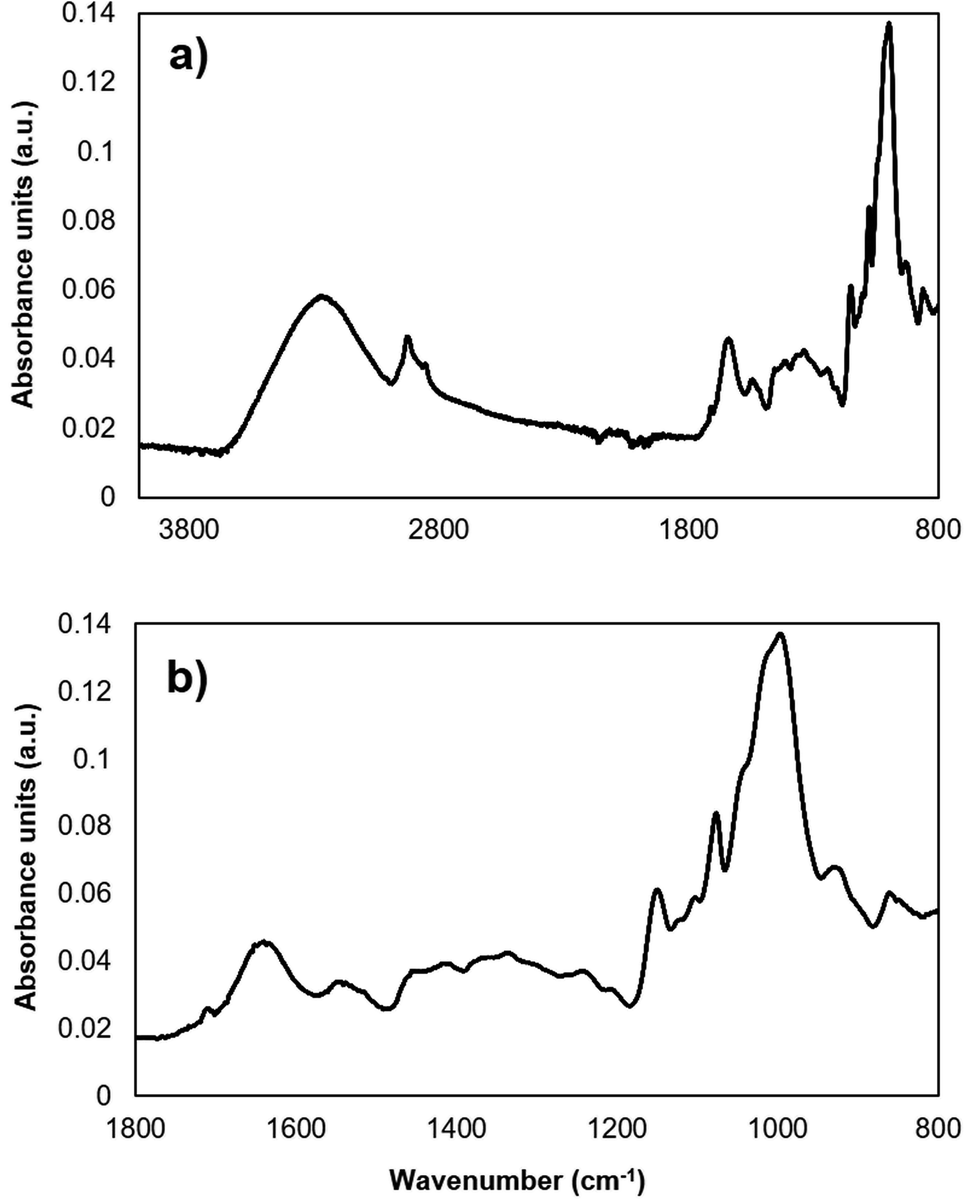 | ||
| Fig. 1 IR spectra of maize extracts. (a) IR raw spectra of a maize extract within a range of 4000–800 cm−1. (b) IR spectra of the selected fingerprint region within a range of 1800–800 cm−1. | ||
2.3 Reference method
Homogenised samples of 5 g were extracted with 20 ml of extraction solvent (acetonitrile/water/acetic acid 79:20:1, v/v/v) for 90 min on a rotary shaker (GFL 3017, Burgwedel, Germany). After a 1 + 1 (v/v) dilution using dilution solvent (acetonitrile/water/acetic acid 79:20:1, v/v/v), the diluted extracts were analysed by liquid chromatography without further pre-treatment. As a reference method we applied liquid chromatography-mass spectrometry (LC-MS/MS) with a QTrap 550 LC-MS/MS System (Applied Biosystems, USA) equipped with TurboIonSpray electrospray ionization (ESI) source and 1290 Series HPLC Systems (Agilent, Germany). The detailed parameters of the reference measurements are described by Sulyok et al.27 The accuracy of the method is verified on a routine basis by regular participation in proficiency testing schemes. This approach quantifies the exact concentrations of DON in the maize samples and confirmed the DON presence in extracts analysed by the FTIR. The limit of detection for DON was 1.2 μg kg−1.
2.4 Data analysis
Spectral quality test and outlier detection was done prior to analysis according to previously published study.28 Thus, spectra of one sample from water dataset, one from acetonitrile, one from ethanol, four from methanol 30%, three from methanol 100% were removed from the analysis. Spectral pre-processing was applied prior to data analysis and modelling. The following was done: (1) spectra of each sample were averaged; (2) second derivative was calculated using Savitzky–Golay algorithm29,30 with second order polynomial and window size 13; (3) the spectral ranges 3100 to 2800 and 1800 to 800 cm−1 were chosen and used for the analysis; (4) extended multivariate signal correction (EMSC) was applied using linear and quadratic terms.31,32 The same pre-processing was applied to each dataset and the pre-processed spectra were used in all subsequent analyses.Principal Component Analysis (PCA) was applied in order to discover patterns in the data in an unsupervised manner. Supervised analysis was done using sparse partial least squares discriminant analysis (SPLS-DA). SPSL-DA is a variable selection technique which is used to establish robust models which are much easier to interpret.33,34 In SPLS-DA loading weights are penalized using soft thresholding resulting in sparse loadings. SPLS algorithm penalizes the loading weight vectors according to a parameter called degree of sparsity, which defines a number of zeros in a given loading.35,36 For each PLS component, we selected the degree of sparsity to be 99%. This means that for each PLS component 99% of variables were penalized and thus put to zero and only 1% of variables were used for model building.
The models established in the analysis were discriminative models for low vs. high DON samples. The threshold was selected to be 1750 μg kg−1 according to the EU standard.10 Thus, samples with DON < 1750 μg kg−1 were considered uncontaminated, while samples with DON ≥ 1750 μg kg−1 were considered contaminated with DON. The supervised modelling was performed for the samples extracted by water and methanol–water (70:30) solvents since they were selected for its advantages and performance. For the rest of the solvents, we decided to not further proceed after unsupervised PCA confirmation.
SPLS-DA models were established using leave-one-out cross-validation. Such an approach is fully justified since no replicates were present in the dataset, all of them were averaged prior the analysis. The optimal number of latent variables (Aopt) was selected based on the classification accuracy of the groups. The number was optimized to maximize the accuracy of the group with the lowest classification accuracy.37 This approach aids in avoiding biased classification of one of the groups, especially if the groups are unbalanced. Regression coefficients, scatter plots and correlation loading plots were used to learn about models and patterns in the data.
3. Results
3.1 DON variability within the maize samples
This study has investigated a maize sample set with known DON-contamination concentrations. DON concentration distribution is displayed to represent the number of samples within each contamination level for the two inoculation types used (Fig. 2). It provides individually the DON concentrations distribution histograms for naturally contaminated (Fig. 2a) and artificially inoculated samples (Fig. 2b). Comprehensibly, the concentration range for naturally contaminated samples was narrower (96–6528 μg kg−1) than for inoculated ones (81.6–73840 μg kg−1). Despite the range differences, both inoculation groups had balanced number of samples above and below the EU regulatory limit, as required to build robust classification models at the established threshold. Naturally contaminated sample set was composed of 11 samples in the low contamination group and 8 in the high contaminated group, while the inoculated set had 24 samples below the threshold and 32 above.
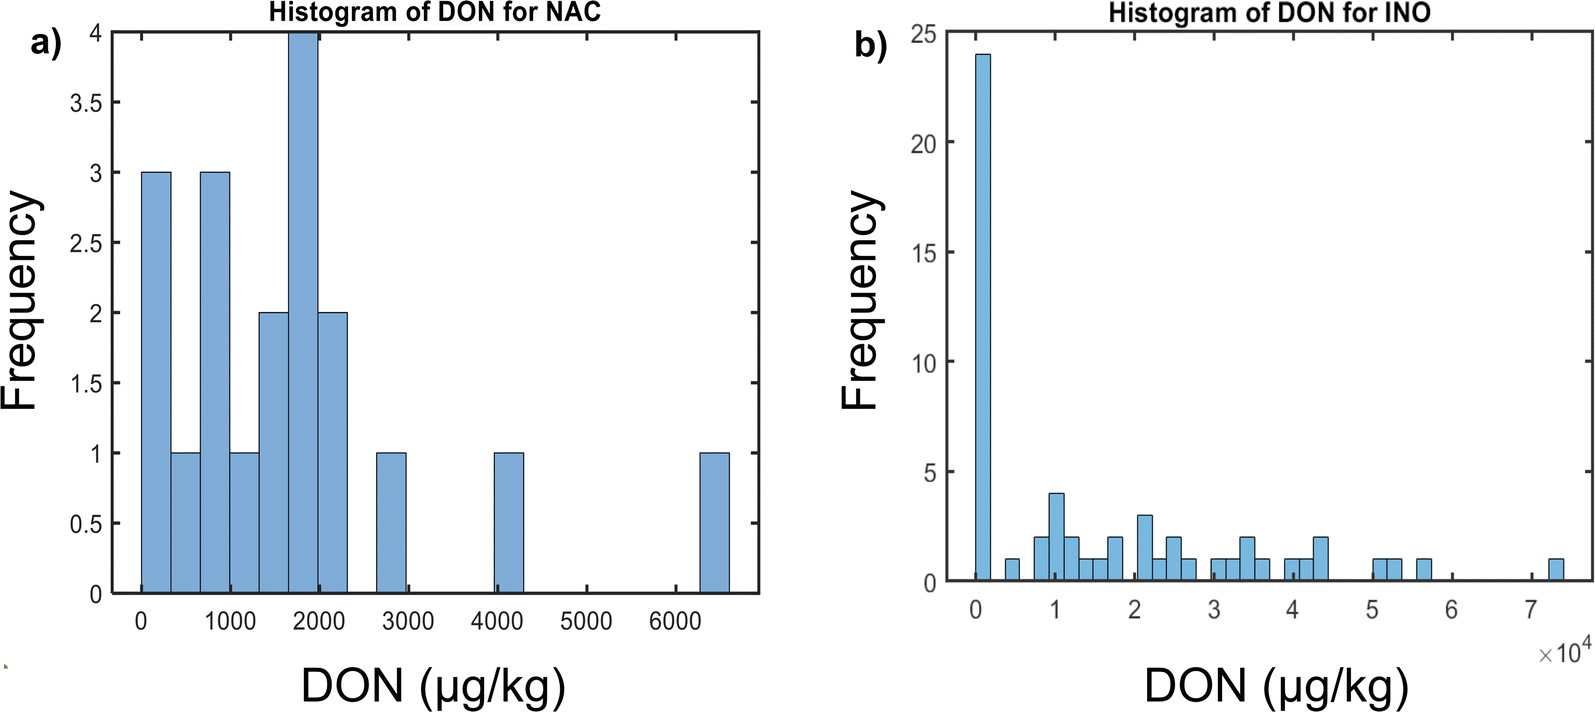 | ||
| Fig. 2 Histogram of DON concentrations of (a) naturally contaminated (NAC), and (b) artificially inoculated (INO) maize samples. | ||
3.2 Spectral comparison of DON-contaminated and uncontaminated maize samples
The solid residue of 10 μl drops on the ∼3 × 3 mm ATR crystal surface was analyzed 3 times. The obtained spectra showed differences depending on the solvent due to the different substance extracted by the solvents. It should be noted that not the entire spectral region was used during data analysis. Thus, the data between 3100–2800 cm−1 and 1800–800 cm−1 spectral regions was selected to eliminate external interferences e.g. atmospheric changes. This reduction in spectral range ensured adequate representation of the sample-relevant spectral information besides removing noise and spectral contributions not related to the sample. To obtain the first overview over the differences caused by fungal-related contaminations, the differences found in raw spectra of highly and low contaminated maize extracts for each solvent were studied. Fig. S1† shows the raw IR spectra at the fingerprint region between the high DON-contaminated sample (52.3 mg kg−1) and the low-contaminated one (0.2 mg kg−1) for the selected solvents. Water and methanol extract spectra presented more variations in absorbance intensities than acetonitrile and ethanol ones. Although the differences should be estimated with a larger sample set and using chemometric tools, in order to model the spectral variations, the representation is an initial approximation to determine the most suitable solvent for DON extraction. A comprehensive statistical analysis was then obtained for a larger sample set.PCA analysis was done using the IR spectra to identify the optimal solvent system to building model for DON prediction. The samples were labelled as contaminated and uncontaminated with 1750 μg kg−1 threshold, depending on the DON concentration analysis done by LC-MS/MS. The differences between groups are presented in PCA score plots (see Fig. S2†). The PCA analysis indicates that none of the solvents allows for clear separation according to the contamination level, although some of them (e.g. ethanol) allow clearer separation of inoculated samples from naturally contaminated compared to acetonitrile. The solvent systems considered in the preliminary study had different environmental properties, as defined by the solvent selection guides.38 For the subsequent supervised modelling, one bio-based and recommended solvent (water) and one non-bio-based and recommended/problematic solvent system (methanol–water, 70:30) were selected.39 The PCA score plots display a clustering tendency for the water extracts, although ethanol PCA showed overlap of spectra belonging to uncontaminated samples (specified by 0 in plots) and contaminated samples (specified by 1 in plots). In addition, the separation of water extracts was predominantly linked to DON contamination, while ethanol extracts exhibited a separation according to the inoculation type (natural vs. inoculation in blue and red colours, respectively). Regarding the environmental properties of these solvents, despite both of them being non-toxic and bio-based, water is preferred over ethanol due to its flammability. Consequently, from the green solvents water was selected for its applications and preference over other solvents.
From the non-bio-based solvents, acetonitrile and methanol did not show clustering tendency in the PCA score, neither for the inoculation type nor for DON levels. Whereas for methanol–water system (30:70), we can see mostly clear clustering of the samples according to the inoculation type, for methanol–water (70:30) the cluster tendency follows again the separation into DON groups according to the threshold without any observable impact of the inoculation type. Methanol–water (70:30) was selected as besides water for the further supervised analysis. Once water and methanol were selected, additional measurements were carried out.
Furthermore, it was of interest to assess the spectral variance according to the inoculated species. The PCA score plot of the enlarged datasets in Fig. 3 provides this information and the inoculation type, described in the previous section. The PCA score plots show clear clustering according to the fungal species. Clustering was more well-defined for methanol–water (70:30) extracts than for water. In methanol (70:30) extracts, PC1 and PC2 divided more prominently samples infected with F. culmorum (DON producer, samples in brown colour) from F. verticillioides (predominantly fumonisin producer, in blue and purple) and naturally contaminated (in green). Although the set only included three samples infected with F. graminearum, the samples were clustered in between two groups of inoculated samples. The results of unsupervised data analysis by PCA indicate that the fungal species produce different changes on the cereal matrix, thus causing differences in the MIR spectra. The PCA suggests that DON-producer species cause different compositional changes than the fumonisin-producers, providing broader separation from the naturally contaminated samples. Further, supervised multivariate analysis was used to obtain more information.
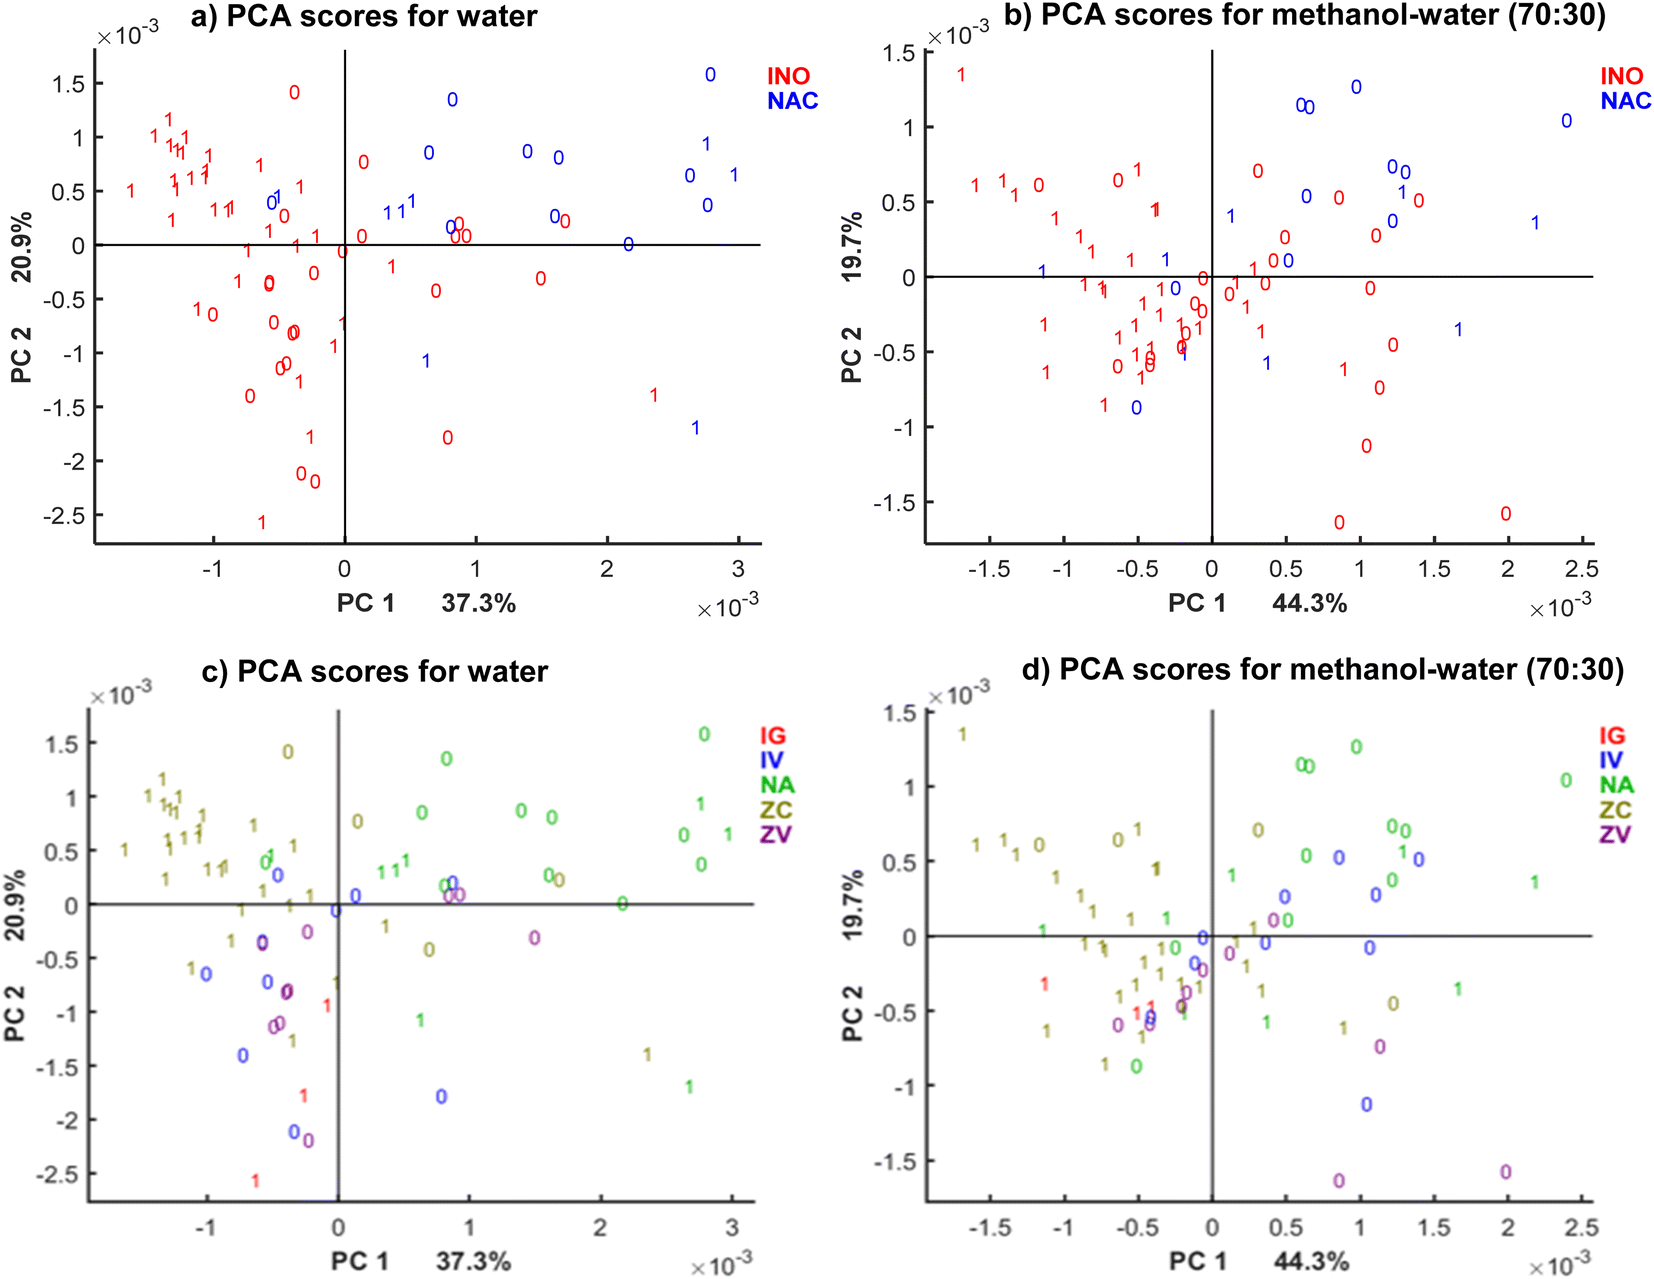 | ||
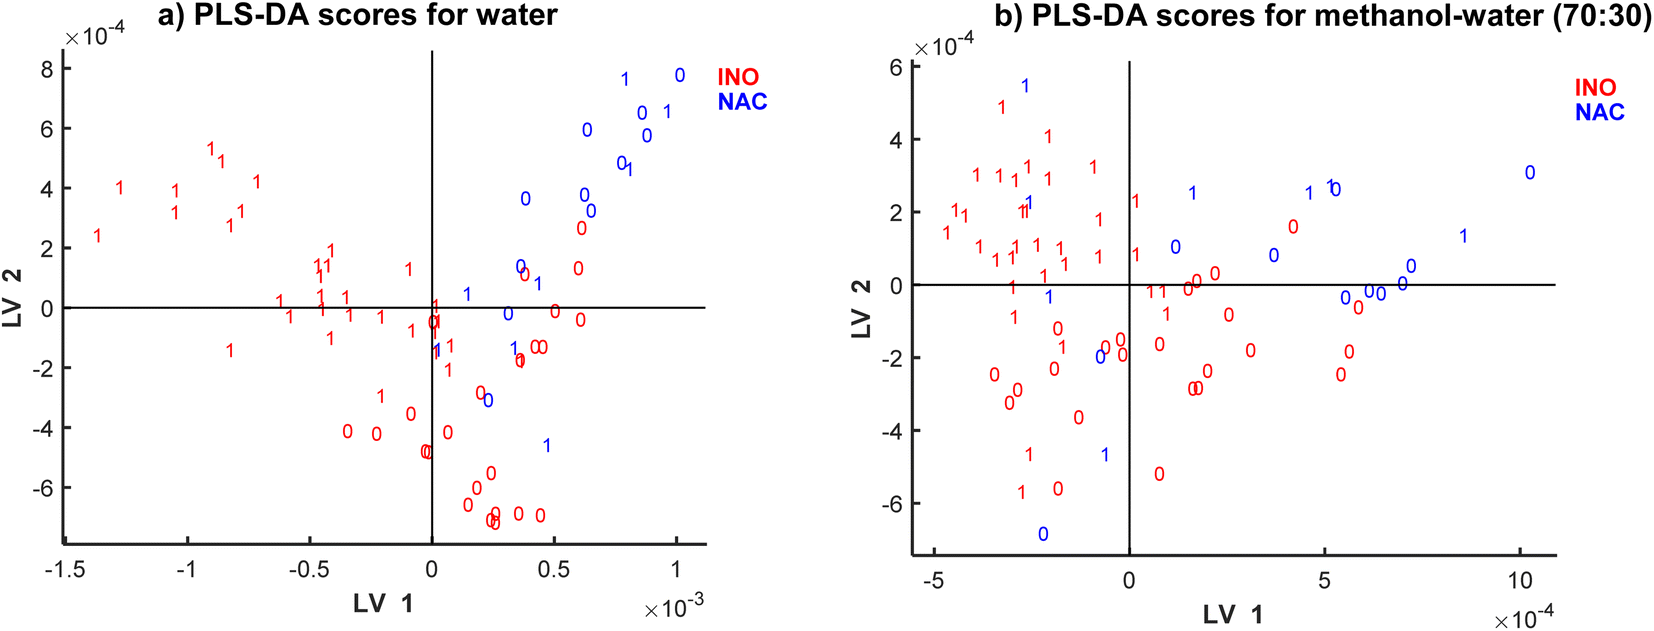
| Fig. 3 PCA score plot for the first two PCs of different solvents (a and c) water, (b and d) methanol 70% where colours of labels correspond to (a and b) inoculation type: inoculated in red and naturally contaminated in blue, (c and d) fungal strain and inoculation method used (IG: F. graminearum in the silk channel; ZC: toothpick inoculation with F. culmorum; IV: injection of F. verticillioides in the silk channel; ZV: toothpick inoculation with F. verticillioides and; NA: natural infection, unknown strains), while labels correspond to DON levels where 0: DON < 1750 μg kg−1, 1: DON ≥ 1750 μg kg−1 obtained by the reference method. The PCA plots (a), (c) and (b), (d) represent the same models with different colour coding used. | ||
3.3 Determination of an optimized solvent to extract DON for IR analysis by supervised modelling based on SPLS-DA
Classification of maize samples into contaminated and non-contaminated groups was done using SPLS-DA method. The threshold for DON was set at 1750 μg kg−1, and the two datasets evaluated: water extracts and methanol–water (70:30) extracts. Fig. 4 presents the results of classification while Fig. 5 provides scatter plots of the model to show the clustering patterns in the SPLS-DA model. We can observe that the difference of the accuracy of the two models is 4.1%, with higher accuracy in methanol–water (90.8%) than water (86.7%). The models have the same number of LVs: Aopt = 11, which indicated moderate complexity. The overall number of samples incorrectly classified were 10 for water and 7 for methanol–water. Among the total samples with contaminations higher or equal to 1750 μg kg−1 (40), 15% (7 samples) were incorrectly classified in water extracts, while 10% (4 samples) for methanol–water, indicating that the percentage of false negatives is also higher for water extractions, while the number of false positives was equal for both solvent systems. From the incorrectly classified samples, three were common in both models, with DON concentrations equal to 1904, 2024 and 6528 μg kg−1. As it can be seen, two of these samples have contamination close to the threshold value of 1750 μg kg−1. The most discriminant spectral variables obtained from the regression models were 820 cm−1, 924–1150 cm−1 (highest peaks at 1050 and 1016 cm−1), 1540–1745 cm−1 and 2853 and 2925 cm−1 for water, and 820 cm−1, 980–1150 cm−1, 1399 cm−1, 1560 cm−1 (amide II), 1655 cm−1 (amide I), 1733 cm−1 and 2854 and 2917 cm−1 for methanol–water (70:30).
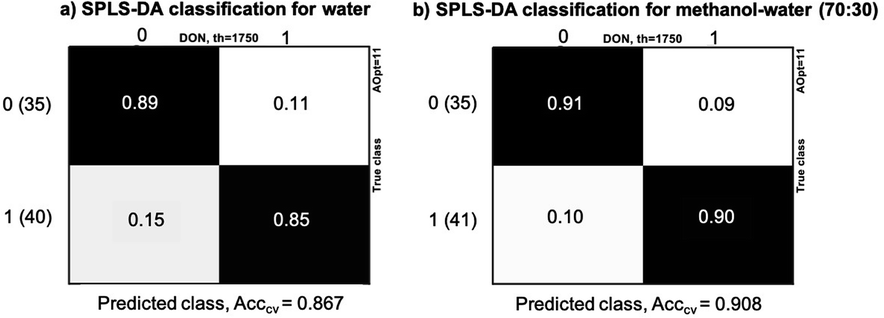 | ||
| Fig. 4 SPLS-DA classification results for maize samples into two groups: non-contaminated labelled as (0) DON < 1750 μg kg−1 and contaminated labelled as (1) DON ≥ 1750 μg kg−1 (a) in water and (b) methanol–water (70:30) extracts. The results are provided as accuracy of cross-validation, the number of latent variables are Aopt = 11 for both models, the number of samples are indicated in parenthesis next to groups' labels 1 and 0. | ||
 | ||
| Fig. 5 SPLS-DA score plot of (a) water and (b) methanol–water (70:30) extracts. The colour corresponds to inoculation type: inoculated in red and naturally contaminated in blue, and labels represent DON concentration (0: < 1750 μg kg−1, 1: ≥ 1750 μg kg−1). | ||
The scatter plots shown in Fig. 5 represent patterns in the samples space of the SPLS-DA models. There are clear clusters of contaminated vs. non-contaminated samples represented by labels 1 and 0, respectively, with a small cluster of overlapping samples. The clustering is also characterized by the type of inoculation: natural and inoculation represented by colours. Thus, both types of information are detected in spectra: inoculation type and contamination level. SPLS-DA model for methanol–water (70:30) did not present such clear clusters for the inoculation type (presented in colours), although a much clear clustering is observed according to DON contamination.
To observe the influence of the samples clustering by different fungal species the same SPLS-DA models scatter plots are shown in Fig. 6, and labelled by the DON contamination level (0 or 1) and fungal species of contamination (colour coded). Since the naturally contaminated samples do not have the information on the fungal species they are contaminated by, these samples were colour coded separately (green). The score plot shows clear clustering according to the fungal species. For water extracts, there is a clear separation in latent variable (LV) LV1 of the samples infected by F. graminearum and F. culmorum (red) from the naturally infected samples (green).
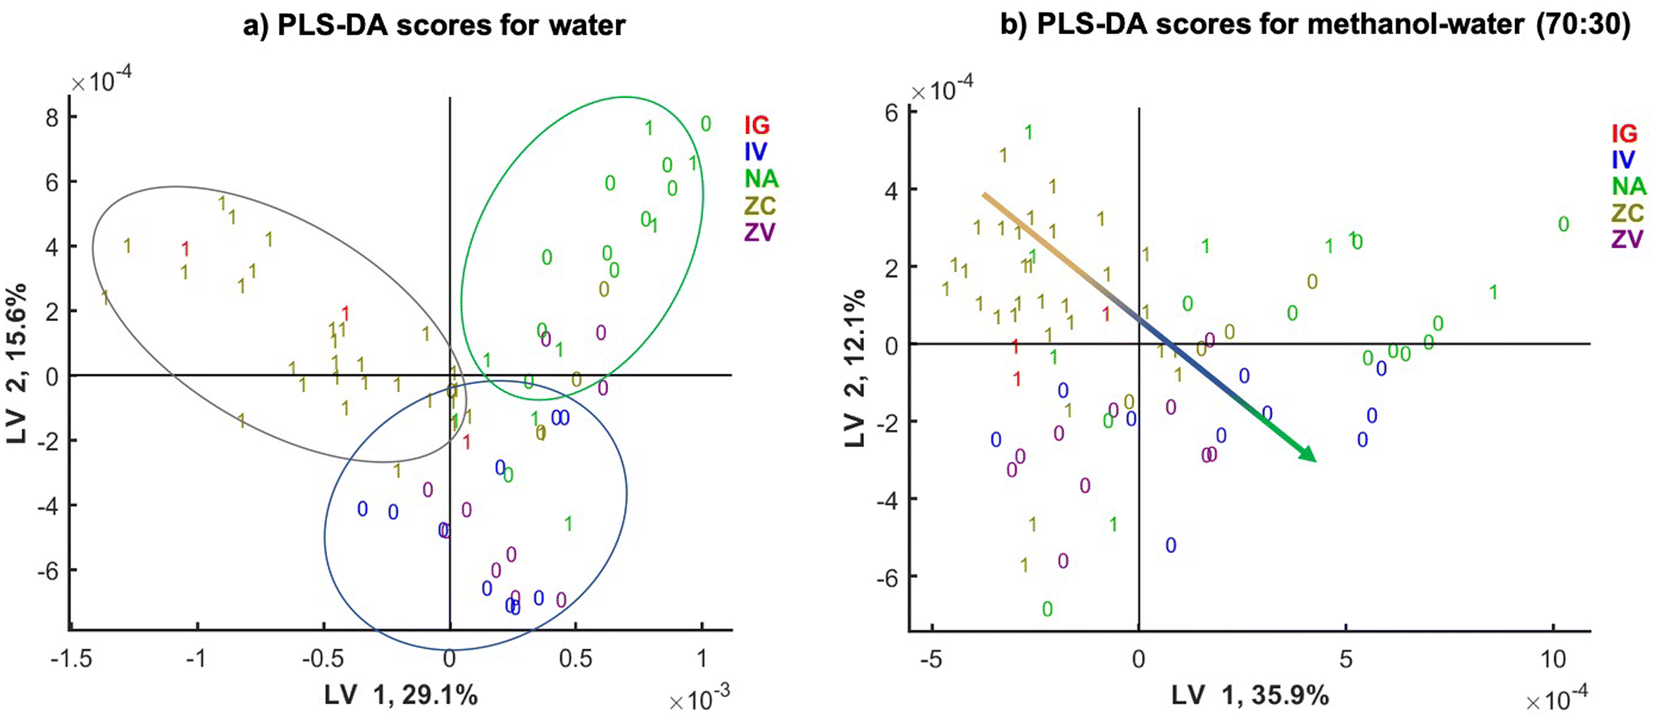 | ||
| Fig. 6 SPLS-DA score plot of (a) water and (b) methanol 70% extracts. Colours represent fungal strains and method of inoculation used (IG: F. graminearum in the silk channel; ZC: toothpick inoculation with F. culmorum; IV: injection of F. verticillioides in the silk channel; ZV: toothpick inoculation with F. verticillioides and; NA: natural infection, unknown strains) and labels represent DON concentration (0: < 1750 μg kg−1, 1: ≥ 1750 μg kg−1). | ||
LV2 is separating these two clusters from a third cluster (blue) represented by the samples infected with F. vericilloides by two types of inoculation: the injection into the silk channel (labelled by IV) and took pick inoculated samples (labelled by ZV). This indicates that the clustering according to DON depends also on the fungal species infecting the sample and their ability to produce DON. In addition, injected and toothpick inoculated F. verticilloides are clustered together, suggesting that the type of inoculation does not affect the classification performance. The scatter plot of SPLS-DA model for the methanol–water (70:30) extracts shows even clearer clustering according to the fungal species used to infect the maize. There is a linear trend of fungal species shown by arrow in the LV1 and LV2 plane. There is somewhat less separation of the naturally infected samples in green.
Correlation loading plots were investigated in order to assess patters in the sample space and the variable space (representing different spectral variables). Such analysis allows the visualization of correlations between spectral variables, design parameters and any metadata available in the experiment. To obtain a correlation loading plot, scores of the corresponding model are used and the variables of interest are projected onto the scores. Fig. 7(a) and (b) represent the correlation analysis for the water extracts and methanol–water (70–30) extracts, respectively. Based on the distances between variables in the correlation loading plot, variables clustering together are strongly correlated to each other. Points closer to the outer circles are highly important and well explained by the model, while those close to the centre do not have any importance. Points far along the LV1 and LV2 axes present no correlation.
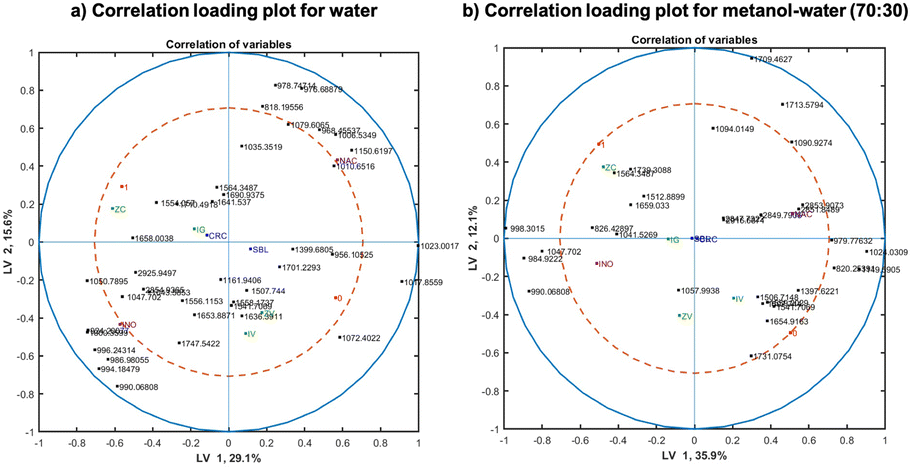 | ||
| Fig. 7 Correlation loading plots using SPLS-DA models' scores for (a) water and (b) methanol–water (70:30) showing correlations of the major spectral variables and design parameters such as maize origin, type of inoculation, fungal species and DON levels for the first two latent variables (LV1 and LV2). | ||
In the correlation loading plots for both solvent systems, the origin of the samples (labelled by CRC and SBL) did not have importance for the model in LV 1 and 2, appearing in the centre of the plot. However, the inoculation type (inoculated or naturally infected, labelled by INO and NAC in purple) are negatively correlated with high importance on the model for both solvents, despite that the importance of them being slightly lower in methanol–water (70:30) extracted samples. Contrarily, the groups of samples with DON above and below the limit (labelled by 0 and 1 in red) for methanol–water (70:30) extraction presented higher importance than in water. However, for both solvents, they correlated negatively in the plot. It is important to underline that F. culmorum infected group positively correlated with DON contaminated samples. On the opposite side of the plot, F. verticillioides correlate negatively with the other fungal species and positively with DON contaminations below the threshold. It is also notable that both F. verticillioides inoculation methods (injection and toothpick inoculation) are highly correlated, demonstrating that the inoculation type does not matter as much as the fungal species.
The spectral features with high influence in the models are similar for water and methanol–water (70:30) extracts in the inoculated (INO) group, represented mostly by the carbohydrate peaks in the region 990–1050 cm−1. However, the correlation is completely different for naturally infected samples, showing a strong correlation of the carbohydrate peaks in the region 1000–1150 cm−1 for water extracts, while more non-polar substances, underlined by the bands in fatty acids peaks between 2847–2917 cm−1 were observed for methanol–water extracts, which is expectable as methanol is less polar than water. The majority of peaks with high importance in the correlation loading plot of the water extracts are carbohydrate peaks and they are mostly correlated to the inoculation type and Fusarium strain. This is linked to the high solubility of mono and oligosaccharides in water. The loading plot of the methanol–water extracts show a lot of different peaks, such as lipid peaks (1740 and 1731 cm−1), fatty acid peaks (2847–2917 cm−1), protein peaks (1659, 1654, 1564 and 1541 cm−1) in addition to carbohydrate peaks (1047, 990 and 984 cm−1). Those bands have also high importance on DON prediction model (below and above the threshold).
4. Discussion
In this study, a variety of contaminated samples with different Fusarium fungal species and DON levels relevant to the EU regulatory threshold (DON = 1750 μg kg−1) were used to explore the feasibility of IR spectroscopy to discriminate between contaminated and uncontaminated maize samples by investigating extracts. In the first instance, the selection of the optimal spectral region is fundamental to remove the non-informative spectral variables. The lipid–water (3100–2800 cm−1) and the fingerprint region (1800–800 cm−1) used in the analysis proved to contain sufficient information to discriminate between DON contaminated and uncontaminated samples using chemometric models (Fig. S1† shows the spectra of the fingerprint region). Due to DON polarity, several polar solvents were selected to test their ability to extract DON from maize samples.40 However, even highly-contaminated maize samples contain relatively small amount of DON compared to other matrix constituents, and thus it is unlikely that DON is being directly detected by IR spectroscopy. Matrix compounds extracted by the used solvents can be considered associated with fungal infestation an in the end with DON contamination, as shown in this manuscript. Further studies might explore others solvents to determine fungal growth-associated nonpolar compounds, such as lipids. DON contamination in maize samples was broadly distributed on equitable parts divided into edible or non-edible depending on the EU limit. Understandably, the number of inoculated samples with high DON was higher than naturally-contaminated ones. However, the number of naturally contaminated samples above the DON threshold and inoculated below it was enough to ensure the representation of both groups and, at the same time, the variability was large on each class. In addition, this study used a larger sample set than previously published investigations with similar aims.25,41 A considerable number of samples with concentrations close to the limit was used to obtain a robust model (see Fig. 2). The DON concentration distribution at cut-off concentrations ensured the representability of low contaminations as in the studies of Kos et al. and Öner et al.15,22Considering the unsupervised modelling and the recommendations in solvent selections, acetonitrile and ethanol exhibited disadvantages compared to other tested solvents. Contrarily, methanol–water (70:30) and water PCA plots displayed a tendency in separation (as displayed by the corresponding PCA plots) depending on the artificial and natural contamination, as well as the fungal species. PCA results indicate that IR spectra of extracts can be used for contamination-based discrimination. The PCA plots indicate that the clustering depends on the fungal components and their compositional changes produced in the cereal matrix extracted by the polar solvents. Thereby the information obtained by recording IR spectra of the extract can not only be used to develop models for DON prediction, but also to study the alteration of the sample by the fungi.
The supervised results (SPLSDA) provided a more in-depth explanation of the clustering behaviour and the related IR variations. SPLS-DA classifications exhibited high accuracies in water (86.7%) and methanol–water (70:30) (90.8%) for the chosen threshold (DON = 1750 μg kg−1). From the incorrectly classified, four and three samples for each solvent system, respectively, presented DON levels close to the cut-off value, two of them in common in both models. Some deviations between IR spectroscopy and reference analysis could be caused by the different subsample analysis. In addition, considering that the reference analysis (LC-MS/MS) has approximately a 5% error, with a tendency to overestimate DON concentration (based on the results submitted to previous ring trials), the misclassifications of the IR-based analysis are extremely reasonable. The error depends on the extraction recovery, the matrix effect and the apparent recovery. Literature displayed relative standard deviations of reproducibility (RSDr) for DON in maize, reporting recovery errors between 10–20%.42,43 Thus, the 5% error can be considered over optimistic and might actually be higher for DON measurements. It is important to notice that, if uncertainties of 20% were considered, the accuracies could increase to 90.7% for water and 93.4% for methanol–water (70:30), with the remaining two samples close to the threshold value (1708.9 and 1747.2 μg kg−1). Both models can be therefore considered to perform similarly good. Although samples with concentrations near the threshold induce error, it is important to point out that they are required to train the algorithms at cut-off concentrations, by modelling the small differences that decide whether samples are rejected or accepted.
DON cannot be directly determined in maize by IR techniques because of the overlapping of the DON spectral signals with the matrix spectral features, displaying a convoluted spectrum. Despite this overlapping, it should be pointed out that the MIR region in general provides more clearly differentiated peaks compared to NIR that justifies the higher sample pre-treatment required. Extensive approaches were used to identify the source of variations induced by different experimental parameters, such as inoculation type and fungal species. SPLS-DA scores exhibited defined clusters for classes of the above and below the DON threshold in both solvent systems and similar tendency in grouping samples by the inoculation type (artificial or natural). However, not only the inoculation type was investigated but also the influence of the taxon (i.e. fungal species) on the model ability to discriminate DON classes, which demonstrated the correlation between the fungal species and DON classes. The results match with those of Kos et al.,22 whose classification could more precisely discriminate DON contaminated maize samples from blank samples when using only F. graminearum and F. culmorum inoculated samples (79%) than when using additionally inoculated F. verticillioides samples, which impacted the accuracy (73%) negatively. Our SPLS-DA results support that finding, since DON-producer species separate well from the naturally infected, but at the same time F. verticillioides (producing in majority fumonisins)44 forms a cluster in between, thus reducing the model performance. Despite the tendency of forming clusters for the inoculation type (natural or artificial), the SPLS-DA results reveal that the clustering is more important due to the different fungal species used. Thus, the clustering tendency according to inoculation type could be attributed to the differences caused by the fungal species.
The correlation loadings plot showed that variations in IR spectra that were important for the classification of DON groups were associated with the proteolytic fungal activity causing the degradation of cereal reserve proteins and of proteins from plant cell walls (affecting mainly the 1650 cm−1 and at 1550 cm−1 bands).45 We observed that F. culmorum infected samples positively correlated with high DON concentration in both solvents. The most relevant spectral signatures for the DON groups are encompassed in the 1740–1510 cm−1 region corresponding to the carbonyl and amide I + II bands, relating to the lipid and protein content, respectively. These signatures were much stronger represented when methanol–water (70:30) was used. This is in good accordance with literature as it has been reported that F. culmorum inoculation reduces the overall lipid content in cereals due to the predominant reduction of oleic acid.46F. graminearum infection had a minor influence on the correlation loading plot. Also, it has been described that its infection reduces the lipid content but to a lesser extent than for F. culmorum infection. Naturally contaminated samples, seem to have a higher lipid content as peaks in the 2950–2850 cm−1 region are found in the methanol–water (70:30) extracts linked to C–H stretching vibration of aliphatic molecules. However, in our study, for the naturally contaminated samples the fungal species are unknown. This region is primarily related to absorptions in alkyl groups, which could be methyl alcohols or methyl ketones as a product of the β-oxidation of lipids, although lipid presence is unlike in polar solvents. The bands are only correlated to natural infection for methanol–water (70:30) and not for water extracts, suggesting that they correspond to the lipids, as methanol is less polar than water.
Characteristic peaks correlated positively to F. culmorum and DON are 1554 cm−1 in water and 1564 cm−1 in methanol–water (70:30). They are probably related to amide I & II vibration (corresponding to C–O and C–N–H stretching and bending vibration) of proteins. Literature reported alterations in proteins depending on the fungal species infecting the cereal. It has been reported that during pathogenic instigation, plant cells increase structural protein content on cell wall as a defensive function to avoid the pathogen penetration.47 Cereal quality is reduced in fungal infection episodes caused by the deterioration of proteins and carbohydrates. Apart from the amide bands, a strong correlation according to the inoculation type (natural or artificial) with the C–O stretching vibrations, primarily for natural infections in water extracts (968, 1006, 1010 and 1079 cm−1) but also for inoculated samples extracted with methanol–water (70:30) (990, 984 and 1047 cm−1), mostly due to polysaccharide absorption. Also, naturally and F. verticillioides infected samples exhibited a positive correlation with carbohydrates characteristic peaks (1035 and 1057 cm−1, respectively). Hettiarachchy & Boyacioǧlu48 reported that the total amount of reducing and nonreducing sugars increases during Fusarium growth caused by the destruction of starch and cellulose, which is underlined by the findings of our study. In addition, is important to declare that using extracts and MIR spectroscopy, we could easily link the origin of the information with certain biomolecules, which is not possible with NIR.
The general results indicated that the classification of samples according to the DON regulatory threshold depends on the inherent food biomolecules alterations, such as lipids, proteins and carbohydrates content due to fungal infection. Those variations are reported to be correlated to the fungal species infecting the cereal. Methanol and water-based extracts presented similar performances, despite methanol–water (70:30) based models being slightly more accurate. Non-polar solvents should also be tested, due to the reported influence of the lipid regions related to the fungal species and DON contamination. Some issues still need to be addressed, such as a larger sample set, where more infected samples by each fungal species should be included. Moreover, naturally contaminated samples are required to build a classification model able to manage the common field DON concentrations. The identification of fungal species in naturally contaminated by genetic analysis would also be interesting. In addition, including more samples with DON concentrations close to the threshold value would be also convenient, to build more robust classifiers able to detect the small variations at cut-off levels and improve the discrimination accuracy around those levels.
5. Conclusions
The unsupervised and supervised analysis used in this study demonstrated the feasibility of water and methanol–water (70:30) solvent systems to extract DON associated components from maize samples. Analyzing the extracts by IR-ATR spectroscopy and using the obtained spectra to build models for the discrimination of contaminated vs. non-contaminated samples (according to DON regulatory threshold of 1750 μg kg−1) with an accuracy of 86.7% and 90.8%, respectively, was demonstrated. The results indicate that the molecules found in the maize extracts are influenced by the DON-producer fungal species (F. culmorum and F. graminearum). Extracts of DON contaminated samples (DON ≥ 1750 μg kg−1), both negatively correlated with the maize extract from the fumonisin-producer (F. verticillioides) and the non-contaminated group (DON < 1750 μg kg−1). The differences in the cereal matrix due to the infestation with different fungal species influence the IR spectra of the extracts, this information can be used to develop models with high classification accuracy to discriminate DON contaminated extracts from non-contaminated, without measuring DON directly. Therefore, the extraction of DON associated components and their detection by IR analysis is feasible and holds great potential to be used in routine analysis. A rapid sample preparation and data analysis automatization makes this approach feasible for its implementation in the cereal industry during processing and storing stages. Moreover, the suitability of water as a green extraction solvent offers an eco-friendly solution, possibly useable as a rapid screening step used before employing more complex techniques like LC-MS/MS analysis. Further developments will be focused on the optimization of the IR spectroscopic technology in terms of miniaturization for potential in-field usage, and an in-depth study of the fungal species influencing DON variability, which may result in more robust models to monitor DON occurrences caused by climate change.
Author contributions
Antoni Femenias: conceptualization, data curation, formal analysis, investigation, methodology, validation, visualization, writing – original draft, writing – review & editing. Polina Fomina: conceptualization, data curation, formal analysis, investigation, methodology, validation, visualization, writing – review & editing. Valeria Tafintseva: conceptualization, formal analysis, methodology, validation, resources, software, visualization, writing – review & editing. Stephan Freitag: conceptualization, data curation, validation, visualization, writing – review & editing. Volha Shapaval: data curation, validation, visualization, writing – review & editing. Michael Sulyok: conceptualization, data curation, validation, visualization, writing – review & editing. Boris Zimmermann: conceptualization, data curation, writing – review & editing, validation, visualization. Sonia Marín: funding acquisition, project administration, supervision, validation, visualization, writing – review & editing. Rudolf Krska: conceptualization, funding acquisition, project administration, supervision, visualization, validation, writing – review & editing. Achim Kohler: conceptualization, funding acquisition, methodology, project administration, resources, supervision, validation, visualization, writing – review & editing. Boris Mizaikoff: conceptualization, funding acquisition, methodology, project administration, resources, supervision, validation, visualization, writing – original draft methodology, writing – review & editing.Conflicts of interest
There are no conflicts to declare.Acknowledgements
This project has received funding from the European Union's Horizon 2020 research and innovation programme under grant agreement No. 101016444. Photonics21. Photonics Public Private Partnership. https://www.photonics21.org.Notes and references
- M. Pascale, A. Visconti and J. Chelkowski, Eur. J. Plant Pathol., 2002, 108, 645–651 CrossRef.
- A. Logrieco, G. Mulè, A. Moretti and A. Bottalico, Eur. J. Plant Pathol., 2002, 108, 597–609 CrossRef.
- J. J. Pestka, Anim. Feed Sci. Technol., 2007, 137, 283–298 CrossRef.
- K. Gromadzka, L. Błaszczyk, J. Chełkowski and A. Waśkiewicz, Toxins, 2019, 11, 224 CrossRef PubMed.
- S. Uhlig, G. S. Eriksen, I. S. Hofgaard, R. Krska, E. Beltrán and M. Sulyok, Toxins, 2013, 5, 1682–1697 CrossRef PubMed.
- M. Eskola, G. Kos, C. T. Elliott, J. Hajšlová, S. Mayar and R. Krska, Crit. Rev. Food Sci. Nutr., 2020, 60, 2773–2789 CrossRef CAS PubMed.
- J. J. Pestka, Arch. Toxicol., 2010, 84, 663–679 CrossRef CAS PubMed.
- A. Vidal, V. Sanchis, A. J. Ramos and S. Marín, Curr. Opin. Food Sci., 2016, 11, 34–39 CrossRef.
- L. B. Bullerman and A. Bianchini, Int. J. Food Microbiol., 2007, 119, 140–146 CrossRef CAS PubMed.
- European Commission, Off. J. Eur. Communities, 2006, 364, 5–24 Search PubMed.
- R. Krska, P. Schubert-Ullrich, A. Molinelli, M. Sulyok, S. MacDonald and C. Crews, Food Addit. Contam., Part A, 2008, 25, 152–163 CrossRef CAS PubMed.
- N. W. Turner, S. Subrahmanyam and S. A. Piletsky, Anal. Chim. Acta, 2009, 632, 168–180 CrossRef CAS PubMed.
- R. Krska and A. Molinelli, Anal. Bioanal. Chem., 2007, 387, 145–148 CrossRef CAS PubMed.
- A. Gałuszka, Z. Migaszewski and J. Namieśnik, TrAC Trends Anal. Chem., 2013, 50, 78–84 CrossRef.
- T. Öner, P. Thiam, G. Kos, R. Krska, F. Schwenker and B. Mizaikoff, World Mycotoxin J., 2019, 12, 113–122 CrossRef.
- A. Subramanian and L. Rodriguez-Saona, Infrared Spectroscopy for Food Quality Analysis and Control, Elsevier, 2009, pp. 145–178 Search PubMed.
- M. J. Baker, J. Trevisan, P. Bassan, R. Bhargava, H. J. Butler, K. M. Dorling, P. R. Fielden, S. W. Fogarty, N. J. Fullwood, K. A. Heys, C. Hughes, P. Lasch, P. L. Martin-Hirsch, B. Obinaju, G. D. Sockalingum, J. Sulé-Suso, R. J. Strong, M. J. Walsh, B. R. Wood, P. Gardner and F. L. Martin, Nat. Protoc., 2014, 9, 1771–1791 CrossRef CAS PubMed.
- N. Kumar, A. Bansal, G. S. Sarma and R. K. Rawal, Talanta, 2014, 123, 186–199 CrossRef CAS PubMed.
- G. Kos, H. Lohninger and R. Krska, Vib. Spectrosc., 2002, 29, 115–119 CrossRef CAS.
- G. Kos, H. Lohninger and R. Krska, Anal. Chem., 2003, 75, 1211–1217 CrossRef CAS PubMed.
- G. Kos, H. Lohninger, B. Mizaikoff and R. Krska, Food Addit. Contam., 2007, 24, 721–729 CrossRef.
- G. Kos, M. Sieger, D. McMullin, C. Zahradnik, M. Sulyok, T. Öner, B. Mizaikoff and R. Krska, Food Addit. Contam., Part A, 2016, 33, 1596–1607 CrossRef.
- S. Jaksic, I. Jajic, V. Despotovic, M. Zivkov-Balos, I. Stojanov, S. Krstovic, Z. Masic and B. Abramovic, Zb. Matice Srp. Prir. Nauke, 2017, 47–56 CrossRef.
- A. De Girolamo, S. Cervellieri, M. Cortese, A. C. R. Porricelli, M. Pascale, F. Longobardi, C. von Holst, L. Ciaccheri and V. Lippolis, J. Sci. Food Agric., 2019, 99, 1946–1953 CrossRef PubMed.
- B. Abramović, I. Jajić, B. Abramović, J. Ćosić and V. Jurić, Acta Chim. Slov., 2007, 54, 859–867 Search PubMed.
- Á. k. Mesterházy, J. Phytopathol., 1977, 90, 104–112 CrossRef.
- M. Sulyok, D. Stadler, D. Steiner and R. Krska, Anal. Bioanal. Chem., 2020, 412, 2607–2620 CrossRef CAS PubMed.
- V. Tafintseva, V. Shapaval, M. Smirnova and A. Kohler, J. Biophotonics, 2020, 13, 1–15 CrossRef PubMed.
- A. Savitzky and M. J. E. Golay, Anal. Chem., 1964, 36, 1627–1639 CrossRef CAS.
- B. Zimmermann and A. Kohler, Appl. Spectrosc., 2013, 67, 892–902 CrossRef CAS.
- H. Martens and E. Stark, J. Pharm. Biomed. Anal., 1991, 9, 625–635 CrossRef CAS PubMed.
- A. Kohler, J. H. Solheim, V. Tafintseva, B. Zimmermann and V. Shapaval, in Comprehensive Chemometrics, Elsevier, 2020, pp. 83–100 Search PubMed.
- K.-A. Lê Cao, D. Rossouw, C. Robert-Granié and P. Besse, Stat. Appl. Genet. Mol. Biol., 2008, 7(1), 35 Search PubMed.
- I. Karaman, E. M. Qannari, H. Martens, M. S. Hedemann, K. E. B. Knudsen and A. Kohler, Chemom. Intell. Lab. Syst., 2013, 122, 65–77 CrossRef CAS.
- H. Shen and J. Z. Huang, J. Multivar. Anal., 2008, 99, 1015–1034 CrossRef.
- V. Tafintseva, E. Vigneau, V. Shapaval, V. Cariou, E. M. Qannari and A. Kohler, J. Biophotonics, 2018, 11, 1–10 CrossRef.
- V. Tafintseva, T. A. Lintvedt, J. H. Solheim, B. Zimmermann, H. U. Rehman, V. Virtanen, R. Shaikh, E. Nippolainen, I. Afara, S. Saarakkala, L. Rieppo, P. Krebs, P. Fomina, B. Mizaikoff and A. Kohler, Molecules, 2022, 27, 873 CrossRef CAS.
- F. P. Byrne, S. Jin, G. Paggiola, T. H. M. Petchey, J. H. Clark, T. J. Farmer, A. J. Hunt, C. Robert McElroy and J. Sherwood, Sustain. Chem. Process., 2016, 4, 1–24 CrossRef.
- D. Prat, J. Hayler and A. Wells, Green Chem., 2014, 16, 4546–4551 RSC.
- P. Sobrova, V. Adam, A. Vasatkova, M. Beklova, L. Zeman and R. Kizek, Interdiscip. Toxicol., 2010, 3, 94–99 Search PubMed.
- M. Sieger, G. Kos, M. Sulyok, M. Godejohann, R. Krska and B. Mizaikoff, Sci. Rep., 2017, 7, 44028 CrossRef PubMed.
- F. Debegnach, E. Gregori, S. Russo, F. Marchegiani, G. Moracci and C. Brera, Toxins, 2017, 9, 169 CrossRef PubMed.
- A. Santini, R. Ferracane, M. C. Somma, A. Aragón and A. Ritieni, J. Sci. Food Agric., 2009, 89, 1145–1153 CrossRef.
- A. Bottalico and G. Perrone, Eur. J. Plant Pathol., 2002, 108, 611–624 CrossRef.
- T. M. Alconada, M. C. Moure and L. M. Ortega, Vegetos, 2019, 32, 441–449 CrossRef.
- M. Havrlentová, S. Šliková, V. Gregusová, B. Kovácsová, A. Lančaričová, P. Nemeček, J. Hendrichová and P. Hozlár, Microorganisms, 2021, 9, 1–13 CrossRef PubMed.
- K. Houston, M. R. Tucker, J. Chowdhury, N. Shirley and A. Little, Front. Plant Sci., 2016, 7, 1–18 Search PubMed.
- N. S. Hettiarachchy and D. Boyacioǧlu, J. Cereal Sci., 1995, 21, 57–62 CrossRef.
Footnote |
| † Electronic supplementary information (ESI) available: Supplementary Fig. S1 and S2. See DOI: https://doi.org/10.1039/d2ay00995a |
| This journal is © The Royal Society of Chemistry 2023 |