Unraveling the complex electrochemistry of serotonin using engineered graphitic sensors†
Edoardo
Cuniberto
a,
Zhujun
Huang
a,
Michael D.
Ward
 bc and
Davood
Shahrjerdi
 *ad
*ad
aElectrical and Computer Engineering, New York University, Brooklyn, NY 11201, USA. E-mail: davood@nyu.edu
bDepartment of Chemistry, New York University, New York 10003, USA
cMolecular Design Institute, New York University, New York 10003, USA
dCenter for Quantum Phenomena, Physics Department, New York University, New York 10003, USA
First published on 17th November 2022
Abstract
Fast-scan cyclic voltammetry (FSCV) with micron-sized carbon sensors is a promising approach for monitoring the fast dynamics of serotonin (5-HT) neuromodulatory signals in the brain. However, sensor performance using FSCV can be compromised by complex chemical reactions associated with the reduction and oxidation of 5-HT, posing considerable challenges to detection of 5-HT in vivo. Herein we describe the use of engineered graphitic sensors to characterize the complex electrochemistry of 5-HT under a wide range of measurement conditions, with the aim of optimizing the FSCV conditions for in vivo quantitative 5-HT detection. These measurements reveal that water plays a significant role in driving side reactions during low-voltage FSCV measurements, leading to the observation of a well-defined secondary redox couple we associated with the redox reaction of tryptamine 4,5-dione. Remarkably, these side reactions can persist subsequent to the primary redox events associated with 5-HT. Furthermore, the results reveal a critical deviation from this ideal redox behavior if the FSCV anodic limit exceeds +0.8 V, which can be attributed to the generation of radical species from water oxidation. These new insights could lead to new FSCV protocols for more reliable 5-HT detection.
Serotonin (5-HT) is a widespread neurotransmitter in the brain with implications for psychiatric and neurological disorders.1–5 Hence, there is significant research interest in developing technologies for monitoring the dynamics of 5-HT release and uptake in the brain with high spatial (microscale) and temporal (milliseconds) resolution, including genetically-encoded fluorescent protein sensors6–11 and fast-scan cyclic voltammetry (FSCV) with micron-size carbon electrodes.12–23 FSCV is a particularly attractive choice for human translation owing to the absence of inherent ethical and safety barriers. Carbon sensors foul during FSCV detection of 5-HT, however.24 While this fouling is often attributed to byproducts from side reactions of 5-HT,13,14,25,26 a knowledge gap pertaining to the identity and mechanism of 5-HT side reactions under FSCV conditions remains.
A pioneering work by Wrona et al., provides the most comprehensive account for the possible electrochemical reactions in linear sweep voltammetric measurements of 5-HT at physiological pH.27 Their study described a series of electrochemical and chemical reaction schemes that can occur during the redox of 5-HT at slow sweep rates (i.e., sweep rate ν = 200 mV s−1). An important finding of this study was the identification of a dominant electroactive side product formed in the presence of water. This side product displayed a distinct characteristic with increasing ν over a fixed potential sweep range from −0.35 V to +0.6 V. Critically, those experiments revealed a considerable suppression of this side reaction with increasing ν, such that only the primary redox peaks of 5-HT were observable at ν = 50 V s−1. This finding suggests that employing fast sweep rates could mitigate sensor fouling caused by detrimental side reactions of 5-HT.
Sensor fouling remains a severe problem in FSCV detection of 5-HT regardless of the high sweep rates (>100 V s−1).13,25 Although this problem is broadly attributed to side products of 5-HT redox reactions,25,26 the identity and mechanism of those reactions in FSCV measurements remain unknown. Indeed, the typical cyclic voltammograms (CVs) of 5-HT in FSCV measurements with the classic waveform (ν = 400 V s−1, potential sweep from −0.4 V to + 1.3 V) display a shoulder next to the primary oxidation peak of 5-HT, which suggests the presence of following side reactions.25,28 Jackson et al., hypothesized that this shoulder peak is due to the addition of water to the phenylene ring, which they aimed to suppress in their study by modifying the parameters of the FSCV waveform (i.e., potential limits and sweep rate).25 The observation of this shoulder peak at fast sweep rates differs from the report by Wrona et al., who observed the suppression of this electroactive side product as the sweep rate was increased to 50 V s−1.27 More importantly, the primarysignature of the observed side product (i.e., its standard potential, E°, which is independent of sweep rate) in Jackson et al., study does not appear to match the known side product identified by Wrona et al.27
A closer look at these previous reports suggests that the potential sweep range could play a role in producing unknown side reactions in the FSCV measurements of 5-HT. However, studying the effect of the potential sweep range under the FSCV conditions is not possible using existing carbon sensors, as they require a wide potential sweep range (at least from −0.6 V to +1.0 V) to reveal redox peaks of 5-HT and its side products under the typical FSCV conditions (i.e., ν ≥ 100 V s−1). Another significant challenge when studying the side reactions using existing sensors is the broad and generally ill-defined shapes of their corresponding redox peaks in the CVs of 5-HT. This poses a considerable challenge to accurately determine E°, preventing a reliable identification of electroactive compounds from the CVs. Due to these shortcomings of existing sensors, a comprehensive study of 5-HT electrochemistry under FSCV conditions has remained elusive.
Herein we describe a comprehensive study of 5-HT electrochemistry to address three major questions. First, how does the potential sweep range under the FSCV measurement conditions (ν ≥ 100 V s−1) influence side reactions of 5-HT oxidation? Second, how do those side reactions evolve by varying ν from a relatively slow rate (10 V s−1) to a fast rate (200 V s−1)? Third, what is the underlying mechanism of those side reactions? The key to this study here is the use of a new generation of FSCV sensors made from engineered graphitic carbon materials, which were recently developed by our group.29 These sensors offer high sensitivity. They also provide sharp and well-defined redox peaks, allowing FSCV operation at low potentials inaccessible to the existing carbon sensors.30 Our experiments provide new insights into the identity and mechanism of 5-HT side reactions, which reconcile the inconsistent past observations. Lastly, we demonstrate the application of these insights for optimizing the FSCV protocols for selective and sensitive detection of 5-HT.
Results and discussion
Engineered graphitic sensors
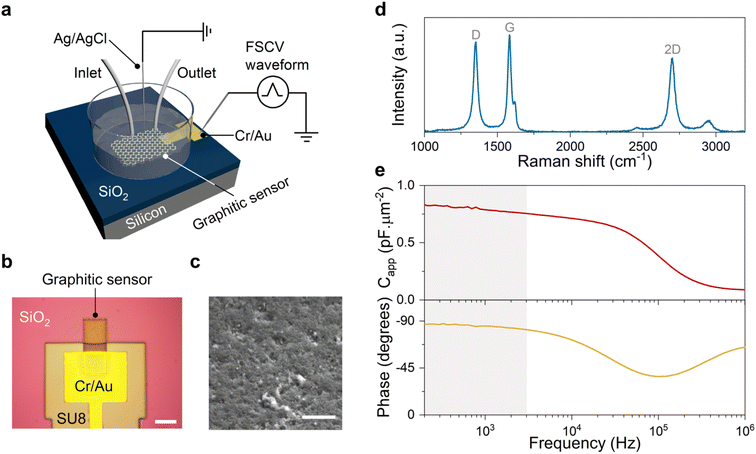
Engineered graphitic sensors with a typical size of 20 × 20 μm2 were used for the experiments described herein. These sensors were fabricated on oxide-coated silicon substrates following protocols previously described by our laboratory29 (see Methods). Fig. 1a–c illustrate the schematic illustration, typical optical and SEM images of a graphitic sensor. The strong D peak in the Raman spectrum of Fig. 1d is consistent with a high density of defects, which we demonstrated previously to be crucial for the high FSCV sensitivity of the resulting sensors.29,31 Furthermore, our materials engineering approach yields fully graphitic carbon materials, evidenced by the sharp G and strong 2D Raman peaks (see Fig. 1d). This structural property of our materials results in electrochemical sensors with a near-ideal capacitive behavior, which was confirmed by the electrochemical impedance measurements (see Fig. 1e). The frequency response plots indicate a slight change of capacitance (<10%) and a phase response close to −90° at frequencies below 3 kHz. These results demonstrate that our sensors can maintain their near-ideal capacitive behavior in the frequency range of FSCV measurements (gray shading in Fig. 1e). This characteristic features a crucial distinction of these engineered graphitic sensors from conventional carbon sensors, which have a mixture of resistive-capacitive behavior.32,33The engineered structure of these graphitic carbon materials results in electrochemical sensors that produce sharp and well-defined peaks in FSCV measurements of electroactive analytes.29,30,34 As discussed below, this unique feature allowed us to examine the effects of the FSCV potential sweep range, revealing the unexpected role of the anodic potential limit (Ua) in driving 5-HT side reactions.
Effect of the FSCV waveform parameters
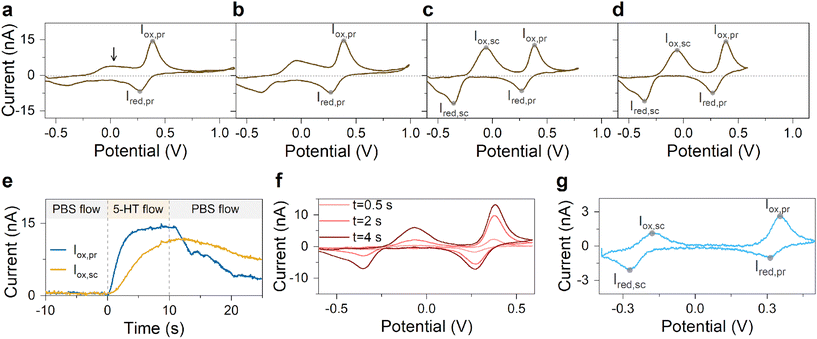
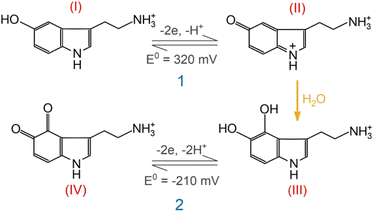
A series of FSCV measurements were performed to examine how the potential sweep range influences the 5-HT electrochemistry. All CVs in this section were recorded while flowing the 5-HT solution over the sensor (see Methods for details). In Fig. 2a–d, we plotted the background-subtracted CVs of 1 μM 5-HT. These CVs were obtained from the same sensor at ν = 200 V s−1 and a repetition scan frequency of 10 Hz. The potential sweep range in these measurements was selected such that the CVs can capture the full shape of all observable oxidation and reduction peaks.The measurements started by obtaining the CV using Ua = +1.15 V, as shown in Fig. 2a. The general shape of the CV is consistent with the previous observation of the 5-HT measurements using the classic FSCV waveform.28 Sharp oxidation and reduction peaks at +380 mV and +270 mV are observable, corresponding to a redox couple with E° = +325 mV. This E° is the signature of 5-HT molecules ( ). The product of 5-HT oxidation is expected to be p-quinone imine (compound II in Scheme 1(1)). Unlike the measurements at low sweep rates,27 the CV revealed more features that indicated the presence of unknown chemical reactions during the FSCV of 5-HT. An asymmetric and broad oxidation peak (marked with an arrow in Fig. 2a) is observable at the shoulder of the 5-HT oxidation peak. The CV also shows a second reduction peak at a negative potential of −400 mV and a significant level of residual current between the two observable reduction peaks. The peculiarities of these features suggest that the 5-HT side reactions could be more complex than previously thought.25
The FSCV measurements were repeated with an identical waveform except for Ua, and their background-subtracted CVs were then plotted, as shown in Fig. 2b–d. These results correspond to three measurements with Ua of +1.0, +0.8, and +0.6 V, respectively. The side-by-side comparison of these results revealed crucial insights. We observed that the change of Ua did not alter the peak positions of the primary redox couple (see ESI† for detailed analysis). This suggests that the apparent electron transfer kinetics of this redox couple remained unchanged in these measurements. In contrast, the features associated with the side reactions undergo stark transformations, suggesting the critical effect of the anodic potential limit on 5-HT side reactions. Interestingly, we also observed that other waveform parameters, such as cathodic potential and sweep rate, have barely any effect on 5-HT side reactions (see ESI†).
A close look at these results revealed that the amplitude of the oxidation shoulder begins to grow by decreasing Ua. Curiously, this feature appeared to complete its transformation into a nearly symmetric peak in FSCV with Ua = +0.8 V. It then maintained its shape characteristics at Ua = +0.6 V. Moreover, the amplitude of the reduction peak of the side reactions increased by lowering Ua. It also completed its shape transformation at Ua = +0.8 V. Remarkably, an observable residual current between the two reduction peaks also began to diminish at Ua < +0.8 V. This result indicates that the observed residual current in CVs with Ua > +0.8 V is an actual response of the sensor to 5-HT-related reactions.
Next, we probed the origin of the secondary redox peaks in the CVs of 5-HT in Fig. 2 by initially focusing on the CV with Ua = +0.6 V (Fig. 2d). Due to their sharp and well-defined shapes, we hypothesized that the secondary peaks in this CV originate from the redox reactions of a single electroactive compound. These properties of the secondary peaks allowed us to assign an E° of −210 mV to this compound. Moreover, analyzing the corresponding transient response of the sensor revealed the slower rise time of the secondary oxidation peak relative to the primary peak (Fig. 2e). In Fig. 2f, the CVs taken from three different times in this measurement illustrate the appearance of the secondary redox peaks following the primary reaction. By combining this observation with the assigned E° of −210 mV, we hypothesized that the secondary peaks are associated with the redox reactions of tryptamine 4,5-dione (i.e., compound IV in Scheme 1(2)).
This hypothesis is based on the proposed reaction mechanism by Wrona et al.,27 suggesting that this compound arises from the nucleophilic attack by water on the quinone imine (compound II). Scheme 1(2) outlines the simplified version of this reaction mechanism. However, this assignment of the secondary redox couple in this analysis contradicts the observation of Wrona et al., which indicated the absence of this redox couple in CVs with a fast sweep rate.
Therefore, we tested the validity of this hypothesis next by studying the CV of 5-HT measured at a slow sweep rate of 10 V s−1, as shown in Fig. 2g. This sweep rate was chosen because the redox couple in Scheme 1(2) was still observable at 10 V s−1 in that previous study.27 The data in Fig. 2g indicated an E° of −210 mV for the secondary redox couple, which agrees with the E° in our FSCV measurements and that reported by Wrona et al.27 This analysis provided strong evidence that the secondary redox couple in Scheme 1(2) can persist in measurements employing fast sweep rates.
With the aid of Scheme 1(2), let us examine the observed evolution of the secondary redox peaks in Fig. 2a–d. A close comparison of the CVs indicates that Ua = +0.8 V corresponds to the onset of the transformation in shape and amplitude of the peaks associated with side reactions. Remarkably, this Ua coincides with the onset of the water oxidation reaction at pH 7.4, which is known to generate chemically active species (e.g., hydroxyl radicals). It is reasonable to expect that these radical species react with 5-HT intermediate compounds, generating additional side reactions that are distinct from those of the secondary redox couple shown in Scheme 1(2). Accordingly, these new reactions will exhaust the intermediate compounds underlying the transformation of the well-defined secondary oxidation peak into a broad and asymmetric shoulder peak (e.g., see Fig. 2b and c). This picture is consistent with the sudden decrease in the amplitude of the secondary redox peaks in experiments with Ua > +0.8 V. The observed evolution of the secondary redox peak is a fundamental phenomenon and can be generalized to other electrodes, such as commercially available carbon fiber microelectrodes (see ESI†).
These other side reactions—arising from radical species due to water oxidation—have not been accounted for in the past FSCV studies of 5-HT13,25,26 and could be an additional cause for the sensor fouling. Therefore, as we demonstrate later, a desirable strategy for robust detection of 5-HT is to design new FSCV waveforms with a potential sweep range that avoids the water oxidation reaction.
Experimental understanding of the secondary redox couple
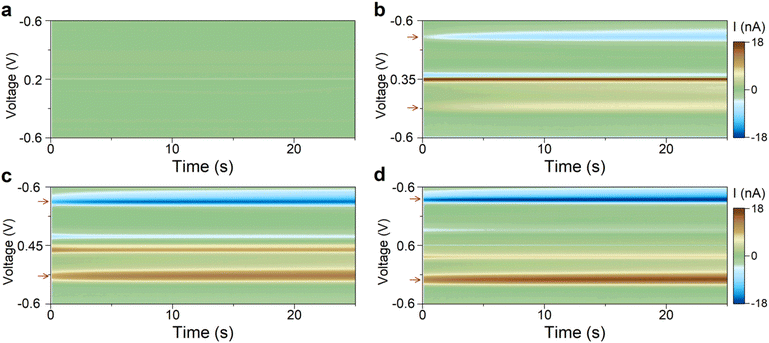
Our results in the previous section suggest that Scheme 1(2) is the mechanism behind the observed secondary redox couple. To corroborate this finding, we designed two experiments described next. These experiments aimed to visualize the two major features of Scheme 1(2): (i) the secondary couple is a follow-up product of the primary reaction, and (ii) the secondary reaction is reversible. All experiments in this section were performed without the flow of 5-HT solution (i.e., static 5-HT solution in the chamber; see Methods).According to Scheme 1(2), the secondary redox couple occurs subsequent to the electrochemical oxidation of 5-HT. Therefore, the first experiment examined whether the oxidation of 5-HT is essential for the formation of the secondary redox couple. To do so, four FSCV experiments were performed using the same sensor. The parameters of the FSCV waveforms were identical among these experiments except for their Ua. The waveforms had ν = 200 V s−1, a 100 ms time interval between the scans, and a rest potential of −0.6 V. In Fig. 3a–d, the color plots display the amplitude of the background-subtracted current of 5-HT measurements corresponding to each waveform.
Fig. 3a displays the color plot of the measurement performed with Ua = +0.2 V. This anodic potential is not high enough (i.e.,  ) to oxidize 5-HT, allowing us to study the potential range where only the secondary reaction should happen. No visible peaks are observable in this plot (see ESI† for the representative CVs). This result reveals that the secondary reaction does not occur in the absence of 5-HT oxidation.
The subsequent experiments used  . Fig. 3b shows the color plot for Ua = +0.35 V. Although this anodic potential is not high enough to obtain a full oxidation peak of 5-HT in the CV plot (see ESI†), it is sufficient to initiate the oxidation of 5-HT. Remarkably, redox peaks associated with the secondary couple became discernable in this plot (marked with arrows). This experiment provides unambiguous evidence that the secondary redox couple forms after the electrochemical oxidation of 5-HT, hence supporting the mechanism in Scheme 1(2).
As larger Ua (+0.45 and +0.6 V) was used in the two subsequent experiments, the steady-state amplitude of the secondary redox peaks became more prominent, as shown in Fig. 3c and d (see ESI† for representative CVs). This observation is consistent with the mechanism in Scheme 1(2). By employing a higher Ua, the primary redox reaction (Scheme 1(1)) will generate a larger number of p-quinone imine molecules (compound II). Since this compound is the basis for the secondary redox reactions (Scheme 1(2)), its higher concentration will promote more follow-up reactions.
According to Scheme 1(2), the secondary redox couple involves reversible redox reactions. A reaction should sustain itself if it is reversible. On this basis, we designed another experiment to examine this property of the secondary couple by posing a question. How will the secondary redox reactions evolve if, after their stabilization, the primary redox reactions are interrupted?
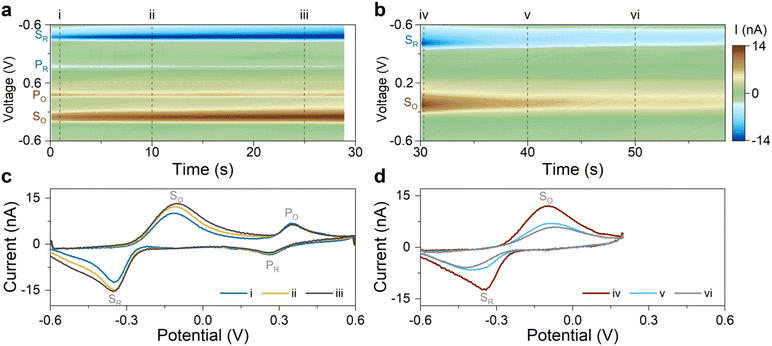
The experiment for answering this question consisted of two sets of FSCV measurements. All measurements were made without the flow of the 5-HT solution. The first set of measurements used an FSCV waveform with a potential sweep range of −0.6 to +0.6 V, capturing the full redox peaks for both the primary and secondary redox couples. The scans were repeated for a duration of ∼30 s at 100 ms time intervals and at ν = 200 V s−1. Fig. 4a displays the color plot of the background-subtracted current amplitudes, indicating the presence of the primary and secondary redox peaks. The plot in Fig. 4c shows three representative CVs of 5-HT at three different times (corresponding to the dashed lines in Fig. 4a). The data indicate that the measurement duration is long enough to permit all redox peaks to stabilize.
The second set of measurements interrupted the primary redox reaction by decreasing Ua from +0.6 to +0.2 V. The other FSCV waveform parameters were kept unchanged. The CVs were then recorded for an additional 30 s. Fig. 4b–d show the color plot of the current and three representative CVs. The data revealed that the amplitude of the secondary redox peaks declined initially and then stabilized as the reaction appeared to reach an equilibrium. This experiment provides evidence for the reversible nature of the secondary redox reactions.
These are remarkable observations: we demonstrated two experiments employing an identical FSCV waveform (see Fig. 3a and 4b) that yielded two drastically different outcomes. These experiments established that although the formation of the secondary redox couple requires the oxidation of 5-HT (Fig. 3a), it can persist in the absence of the primary redox couple (Fig. 4b).
Application to engineering FSCV protocols
This section provides an example of how the insights of this study can be applied to engineer FSCV waveforms for sensitive, selective, and robust detection of 5-HT using engineered graphitic sensors.According to the comprehensive study by Wrona et al., the intermediate products of the side redox reactions can serve as precursors that yield dimers and more complex molecules.27 Those complex products can gradually cover the sensor surface through adsorption. This will consequently degrade the sensitivity by interrupting the electron transfer between the sensor and the target analyte. Therefore, avoiding the 5-HT side reactions is crucial for improving the reliability of sensors in repeated measurements of 5-HT.
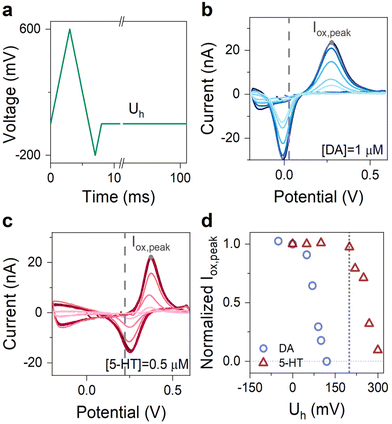
Our findings guide us to employ an anodic potential limit below +0.8 V to avoid side reactions due to radical species generated by the water-splitting reaction. The earlier experiments at ν = 200 V s−1 indicated that Ua = +0.6 V is high enough to capture the full shape of the primary oxidation peak of 5-HT. Our experiments further indicated that under this condition, the byproduct of the secondary redox reaction has E° of −210 mV. Our experiments revealed that implementing a waveform with a hold potential (Uh)>−100 mV can effectively mitigate the oxidation of this compound.
The choice of Uh is also crucial for obtaining an engineered waveform for specific detection of 5-HT. Therefore, we set out to experimentally engineer this parameter of the waveform to achieve highly sensitive detection of 5-HT, while at the same time the sensors remained insensitive to dopamine (DA)—another major neurotransmitter in the brain.12,23,35 To do so, we performed multiple FSCV measurements of DA and 5-HT with concentrations of 1 μM and 500 nM, respectively. In all experiments, we used an N-shape waveform with cathodic and anodic potentials of −0.2 and 0.6 V and only varied Uh. Fig. 5a shows the schematic illustration of this waveform. Fig. 5b–c show the corresponding CVs of DA and 5-HT measured at different Uh. Fig. 5d shows the summary plot, illustrating the evolution of the normalized Iox,peak for both DA and 5-HT plotted as a function of Uh.
These experiments revealed that the normalized Iox,peak of DA and 5-HT remained nearly unchanged below a critical hold potential (Uh,c) and began to decrease monotonically beyond it. From the data, we identified Uh,c for DA and 5-HT to be +50 and +210 mV. Moreover, the data also indicate that our graphitic sensors become insensitive to DA at Uh of about +120 mV. Therefore, for our engineered waveform, we chose Uh = + 200 mV, for which our graphitic sensors simultaneously maintain their high sensitivity to 5-HT. Overall, this Uh ensures a waveform sensitive to 5-HT, insensitive to DA and it is high enough to avoid the oxidation of the secondary product.
Finally, the FSCV waveform should also permit the completion of the reduction process, which is crucial for balancing the electrochemical reactions by minimizing the accumulation of the reductive products. Furthermore, a well-defined reduction peak can aid in identifying the detected analytes. For these reasons, we set the lower potential limit of the FSCV waveform at +50 mV.
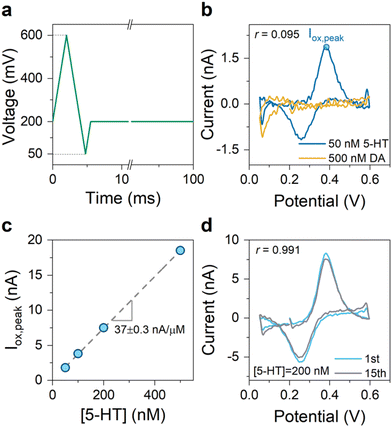
An N-shaped FSCV waveform allows the incorporation of these potential limits. For the proof-of-concept experiments, we created an N-shaped waveform with a repetition scan frequency of 10 Hz and ν = 200 V s−1. Fig. 6a illustrates this waveform, which we refer to as the “SER” waveform. We employed the SER waveform for the in vitro detection of 5-HT and DA using the engineered graphitic sensors. Fig. 6b shows the superimposed CVs of 5-HT and DA measured using the SER waveform, indicating its effectiveness in yielding highly selective detection of 5-HT over DA (r = 0.095). Fig. 6c shows the measured sensitivity plot of 5-HT, obtained from the FSCV measurements of 5-HT at different concentrations using the SER waveform. The plot indicates a high sensitivity of 37 nA.μM−1. Assuming a noise level of 60 pArms for the FSCV detection circuitry34 and the signal-to-noise ratio of 3, the engineered graphitic sensor using the SER waveform can provide an impressive limit of detection of about 5 nM—which is at the lower end of the physiological levels in the brain.
Lastly, we examined how the sensor performance evolves in the repeated experiments of 5-HT detection employing the SER waveform. Past FSCV studies have shown that the 5-HT-related sensor fouling typically manifests itself within the first few trials,26 where each FSCV experiment is one trial. With this in mind, the sensor performance was examined by performing 15 consecutive trials. The nearly unchanged CVs of 5-HT after 15 trials (see Fig. 6d) indicate the prospects of the SER waveform in improving the robustness of the sensor performance for 5-HT sensing experiments.
Conclusions
The study reported here revealed three critical new insights into the complex electrochemistry of 5-HT under FSCV conditions. First, it established that the secondary redox couple (Scheme 1(2)) persists at fast sweep rates. Second, the strength of the secondary reactions depends on the number of water molecules in the solution. Our experiments revealed a sudden decline in the amplitude of the secondary redox peaks once the anodic potential limit exceeded +0.8 V, which coincides with the onset of the water-oxidation reaction at pH 7.4. Lastly, and most critically, the side reactions begin to deviate from the ideal redox behavior in Scheme 1(2) at anodic potentials exceeding +0.8 V. Additional unknown side reactions appear to occur due to the generation of radical species by the water-oxidation reaction. Although this study unraveled the mechanism of these new side reactions, their identity remains unknown. Future studies should focus on identifying these unknown side products in the mixture by combining the electrochemical measurements with analytical techniques (e.g., liquid chromatography). Finally, we established, through a design example, how these insights could contribute to new FSCV protocols with the goal of improving the quantitative detection of 5-HT in vivo.Methods
Fabrication of engineered graphitic sensors
The synthesis of engineered graphitic carbon followed the same steps described in our previous studies.29 Briefly, we first patterned micron-size SU8 islands directly on SiO2-coated silicon substrates using electron-beam lithography (EBL). The SU8 islands were then annealed at 450 °C in a non-oxidizing ambient (80/20 mixture of Ar/H2 gas) and converted into a fully sp2 amorphous carbon. Next, we deposited an ultra-thin layer of nickel (<1 nm) in an ultra-high vacuum e-beam evaporator, followed by annealing at 1100 °C in a dual heating zone MTI furnace. We then converted the graphitic carbon islands into sensors employing standard nanofabrication techniques. High-quality Cr/Au metal leads and contact pads were formed through a sequence of EBL, e-beam metal evaporation, and metal lift-off. The formation of the SU-8 protection layers on the metal leads through EBL completed the sensor fabrication process.Electrochemical measurements
We used 1X phosphate-buffered saline (PBS) with pH 7.4 as the buffer solution. The serotonin (5-HT) and dopamine (DA) solutions with known concentrations were prepared by dissolving their corresponding chemical powders in PBS. All solutions were delivered into a custom-made Y-shaped microfluidic chamber using two program-controlled syringe pumps (World Precision Instruments). A chlorinated silver wire (Ag/AgCl) was used as the reference electrode. The current output of the sensors during FSCV was recorded using a custom-made detection circuitry and digitized using a data acquisition instrument (NI USB-6363 series, National Instruments). The data acquisition and analysis were performed using a custom-made user interface program developed in MATLAB. For experiments in Fig. 2 and 5, the FSCV data were recorded while the PBS and 5-HT solutions flowed into the chamber. For experiments in Fig. 3 and 4, the FSCV data were obtained after stopping the flow of these solutions.Chemicals
Serotonin hydrochloride powder was first dissolved in 1X PBS to form a stock concentration of 2 mM. 5-HT solutions with the desired concentrations were then prepared by diluting the stock solution in 1X PBS. The same procedure was used to prepare DA solutions, starting from dopamine hydrochloride. The 1X PBS (pH of 7.4) was prepared by dissolving 16 g of sodium chloride, 2.88 g of sodium phosphate dibasic, 480 mg of potassium phosphate monobasic, and 400 mg potassium chloride in 2 liters of deionized water. All chemicals were purchased from Sigma Aldrich.Conflicts of interest
The authors declare no competing interests.Acknowledgements
This work was partially supported by NYU WIRELESS and by NYUAD Center for Artificial Intelligence and Robotics (CAIR) under award #CG010.References
- N. M. Barnes and T. Sharp, A review of central 5-HT receptors and their function, Neuropharmacology, 1999, 38(8), 1083–1152 CrossRef CAS PubMed.
- S. Nikolaus, et al., Cortical GABA, striatal dopamine and midbrain serotonin as the key players in compulsive and anxiety disorders-results from in vivo imaging studies, Rev. Neurosci., 2010, 21(2), 119–140 CAS.
- B. Conio, et al., Opposite effects of dopamine and serotonin on resting-state networks: review and implications for psychiatric disorders, Mol. Psychiatry, 2020, 25(1), 82–93 CrossRef PubMed.
- M. C. Avery and J. L. Krichmar, Neuromodulatory systems and their interactions: a review of models, theories, and experiments, Front. Neural Circuits, 2017, 108 CrossRef.
- C. Bédard, et al., Serotonin and dopamine striatal innervation in Parkinson's disease and Huntington's chorea, Parkinsonism Relat. Disord., 2011, 17(8), 593–598 CrossRef.
- J. Feng, et al., A genetically encoded fluorescent sensor for rapid and specific in vivo detection of norepinephrine, Neuron, 2019, 102(4), 745–761 CrossRef CAS.
- S. J. Lee, et al., Cell-type-specific asynchronous modulation of PKA by dopamine in learning, Nature, 2021, 590(7846), 451–456 CrossRef CAS PubMed.
- T. Patriarchi, et al., Ultrafast neuronal imaging of dopamine dynamics with designed genetically encoded sensors, Science, 2018, 360(6396), eaat4422 CrossRef PubMed.
- T. Patriarchi, et al., An expanded palette of dopamine sensors for multiplex imaging in vivo, Nat. Methods, 2020, 17(11), 1147–1155 CrossRef CAS.
- F. Sun, et al., genetically encoded fluorescent sensor enables rapid and specific detection of dopamine in flies, fish, and mice, Cell, 2018, 174(2), 481–496 CrossRef CAS.
- E. K. Unger, et al., Directed evolution of a selective and sensitive serotonin sensor via machine learning, Cell, 2020, 183(7), 1986–2002 CrossRef CAS PubMed.
- M. L. Heien, et al., Real-time measurement of dopamine fluctuations after cocaine in the brain of behaving rats, Proc. Natl. Acad. Sci. U. S. A., 2005, 102(29), 10023–10028 CrossRef CAS PubMed.
- P. Hashemi, et al., Voltammetric detection of 5-hydroxytryptamine release in the rat brain, Anal. Chem., 2009, 81(22), 9462–9471 CrossRef CAS PubMed.
- P. Hashemi, et al., In vivo electrochemical evidence for simultaneous 5−HT and histamine release in the rat substantia nigra pars reticulata following medial forebrain bundle stimulation, J. Neurochem., 2011, 118(5), 749–759 CrossRef CAS.
- K. M. Wood and P. Hashemi, Fast-scan cyclic voltammetry analysis of dynamic serotonin reponses to acute escitalopram, ACS Chem. Neurosci., 2013, 4(5), 715–720 CrossRef CAS PubMed.
- J. E. Baur, et al., Fast-scan voltammetry of biogenic amines, Anal. Chem., 1988, 60(13), 1268–1272 CrossRef CAS PubMed.
- J. J. Day, et al., Associative learning mediates dynamic shifts in dopamine signaling in the nucleus accumbens, Nat. Neurosci., 2007, 10(8), 1020–1028 CrossRef CAS PubMed.
- M. Dayton, et al., Faradaic electrochemistry at microvoltammetric electrodes, Anal. Chem., 1980, 52(6), 946–950 CrossRef CAS.
- C. Owesson-White, et al., Cue-evoked dopamine release rapidly modulates D2 neurons in the nucleus accumbens during motivated behavior, J. Neurosci., 2016, 36(22), 6011–6021 CrossRef CAS.
- P. E. Phillips, et al., Subsecond dopamine release promotes cocaine seeking, Nature, 2003, 422(6932), 614–618 CrossRef CAS.
- N. T. Rodeberg, et al., Hitchhiker's guide to voltammetry: acute and chronic electrodes for in vivo fast-scan cyclic voltammetry, ACS Chem. Neurosci., 2017, 8(2), 221–234 CrossRef CAS.
- J. A. Stamford, et al., Striatal dopamine uptake in the rat: in vivo analysis by fast cyclic voltammetry, Neurosci. Lett., 1984, 51(1), 133–138 CrossRef CAS PubMed.
- R. M. Wightman, et al., Dopamine release is heterogeneous within microenvironments of the rat nucleus accumbens, Eur. J. Neurosci., 2007, 26(7), 2046–2054 CrossRef PubMed.
- M. White, M. Mackay and R. Whittaker, Taking optogenetics into the human brain: opportunities and challenges in clinical trial design, Open Access J. Clin. Trials, 2020, 33 CrossRef.
- B. P. Jackson, S. M. Dietz and R. M. Wightman, Fast-scan cyclic voltammetry of 5-hydroxytryptamine, Anal. Chem., 1995, 67(6), 1115–1120 CrossRef CAS PubMed.
- K. E. Dunham and B. J. Venton, Improving serotonin fast-scan cyclic voltammetry detection: new waveforms to reduce electrode fouling, Analyst, 2020, 145(22), 7437–7446 RSC.
- M. Z. Wrona and G. Dryhurst, Electrochemical oxidation of 5-hydroxytryptamine in aqueous solution at physiological pH, Bioorg. Chem., 1990, 18(3), 291–317 CrossRef CAS.
- A. C. Schmidt, et al., Carbon nanotube yarn electrodes for enhanced detection of neurotransmitter dynamics in live brain tissue, ACS Nano, 2013, 7(9), 7864–7873 CrossRef CAS.
- E. Cuniberto, et al., Nano-engineering the material structure of preferentially oriented nano-graphitic carbon for making high-performance electrochemical micro-sensors, Sci. Rep., 2020, 10(1), 1–11 CrossRef.
- E. Cuniberto, et al., Anomalous sensitivity enhancement of nano-graphitic electrochemical micro-sensors with reducing the operating voltage, Biosens. Bioelectron., 2021, 177, 112966 CrossRef CAS PubMed.
- T. Wu, et al., Quantitative principles for precise engineering of sensitivity in graphene electrochemical sensors, Adv. Mater., 2019, 31(6), 1805752 CrossRef.
- J. A. Johnson, C. N. Hobbs and R. M. Wightman, Removal of differential capacitive interferences in fast-scan cyclic voltammetry, Anal. Chem., 2017, 89(11), 6166–6174 CrossRef CAS PubMed.
- J. A. Johnson, N. T. Rodeberg and R. M. Wightman, Measurement of basal neurotransmitter levels using convolution-based nonfaradaic current removal, Anal. Chem., 2018, 90(12), 7181–7189 CrossRef CAS.
- K.-D. You, et al., An Electrochemical Biochip for Measuring Low Concentrations of Analytes With Adjustable Temporal Resolutions, IEEE Trans. Biomed. Circuits Syst, 2020, 14(4), 903–917 Search PubMed.
- H. N. Schwerdt, et al., Long-term dopamine neurochemical monitoring in primates, Proc. Natl. Acad. Sci. U. S. A., 2017, 114(50), 13260–13265 CrossRef CAS PubMed.
Footnote |
| † Electronic supplementary information (ESI) available. See DOI: https://doi.org/10.1039/d2an01451c |
| This journal is © The Royal Society of Chemistry 2023 |

