Copper nanocluster-Ru(dcbpy)32+ as a cathodic ECL-RET probe combined with 3D bipedal DNA walker amplification for bioanalysis†
Xumei
Zhou‡
,
Mingjing
Li‡
,
Shengfang
Niu
,
Jing
Han
 *,
Sanping
Chen
 and
Gang
Xie
*
Key Laboratory of Synthetic and Natural Functional Molecule of the Ministry of Education, College of Chemistry & Materials Science, Northwest University, Xi'an, Shaanxi 710127, P. R. China. E-mail: hanjing@nwu.edu.cn; xiegang@nwu.edu.cn
First published on 29th November 2022
Abstract
In this study, a cathodic intra-molecular electrochemiluminescence resonance energy transfer (ECL-RET) probe was exquisitely designed via the integration of an ECL donor (Cu NCs) with an acceptor (Ru(dcbpy)32+), and further employed the 3D bipedal DNA walker amplification strategy to monitor the platelet-derived growth factor BB (PDGF-BB). Specifically, blue emission Cu NCs with low consumption, biocompatibility and numerous resources, act as well-overlapped donors and significantly improve the ECL efficiency of Ru(dcbpy)32+. More impressively, the intra-molecular ECL-RET of Cu NC-Ru endowed a better and more stable ECL signal by reducing the electron-transfer distance and decreasing the energy loss. Furthermore, 3D bipedal DNA walker amplification was employed to efficiently convert the target PDGF-BB into numerous DNA strands, achieving sensitive target amplification. By virtue of such design, the constructed aptasensor exhibited a sensitive and selective assay for PDGF-BB with a detection range from 0.01 pM to 10 nM and a detection limit of 3.3 fM. The intramolecular ECL-RET and 3D bipedal DNA walker amplification strategy designed in this study will provide valuable insight into promising ultrasensitive ECL bioanalysis.
1. Introduction
Electrochemiluminescence resonance energy transfer (ECL-RET) has been proven as an effective strategy for improving the ECL efficiency of luminophores.1–4 As is well-known, ECL-RET as a spectroscopy method has been extensively used for the construction of ECL biosensors owing to ECL-RET having an absent excitation light source or interference from the unnecessary scattered light.5–7 For the sake of constructing a sensitive ECL-RET system, it is essential to search for well-matched ECL donor–acceptor pairs.8,9 For example, Ru(dcbpy)32+, the most extensively researched ECL luminophore, serves as a versatile ECL energy acceptor of matched ECL donors, including multiple quantum dots (QDs),10 g-C3N4 nanosheets,11 luminol12 and metal nanoclusters. Owing to their renewability and excellent biocompatibility, metal nanoclusters attracted research attention among numerous ECL donors. Recently, several metal nanoclusters as ECL donors and Ru(dcbpy)32+ as acceptor have been implemented, such as Au NCs,13 Pt NCs14 and Ag NCs.15 It is undeniable that the integration of noble metal nanomaterials as donors leads to prominent performance; however, it is limited by the high cost of noble metals. It remains promising expectation to seek a high-efficiency candidate with low consumption, renewability and high abundance in nature.Cu nanoclusters (Cu NCs) have received substantial attention in biosensing, fluorescence bioimaging, biolabeling and catalysis owing to their inherent virtues of being cost-effective, toxicity-free, having numerous resources, and an easy synthesis procedure.16–18 Particularly, in the ECL sensing field, Cu NCs were employed as an emerging kind of luminophore to construct biosensing platforms.19 Referring to previous reports, Cu NCs exhibited different emissions by various synthetic methods, such as blue,20 red and orange emitting Cu NCs.21 Evidently, red and orange Cu NCs with an emission wavelength of approximately 620 nm were unsuitable donors for the cathodic ECL of Ru(dcbpy)32+. In principle, blue Cu NCs with an emission wavelength of about 450 nm were desirable donor candidates for the cathodic ECL luminophore of Ru(dcbpy)32+. On the basis of the above, we synthesized blue Cu NCs with an ECL emission peak at 445 nm; impressively, it can be employed as a desirable donor candidate owing to the ECL emission peak of Cu NCs perfectly overlapping with the absorption peak of Ru(dcbpy)32+.22 To the best of our knowledge, the blue Cu NCs have not yet been used as ECL-RET donors for the cathodic ECL of Ru(dcbpy)32+. Drawing inspiration from this, it was conceivable that utilizing Cu NCs and Ru(dcbpy)32+ as a superior donor-receptor pair could enhance the ECL intensity of Ru(dcbpy)32+, leading to a better ECL intensity. With the goal of reducing the electronic transferring distance and decreasing the energy waste, further improving the ECL efficiency and enhancing the stability of Ru(dcbpy)32+ considerably, we integrated both Cu NCs and Ru(dcbpy)32+ into one nanocomposite to form intra-molecular ECL-RET.
Platelet derived growth factor BB (PDGF-BB), a latent and essential protein biomarker, is used for the early diagnosis and clinical treatment of some chronic dermal wounds in humans.23 Apparently, it is important for a rapid, sensitive and accurate monitoring level of PDGF-BB in biochemical analysis and clinical diagnostics. Noticeably, the 3D bipedal DNA walker is one of the high-efficiency self-assembly amplified strategies and swings around an unspecific area by walking along specified tracks for exporting numerous DNA autonomously. Therefore, it plays an indispensable role in enhancing recognition efficiency and assay sensitivity.24 Herein, an intra-molecular ECL-RET platform was constructed by integrating Cu NCs (donor) and Ru(dcbpy)32+ (acceptor) into one nanostructure and incorporating the 3D bipedal DNA walker amplification strategy for a specific and ultrasensitive assay of PDGF-BB. As shown in Scheme 1, in the initial state, Cu NCs-Ru as an intra-molecular ECL-RET luminophore emitted a strong ECL intensity. After that, upon the addition of the target (PDGF-BB), a bipedal aptamer structure was formed, which could activate the 3D bipedal DNA walker amplification strategy to transfer PDGF-BB into abundant DNA strands (Fc-S1). Simultaneously, numerous Fc-S1 would cause an effective quenching of the ECL of Cu NCs-Ru, resulting in the ECL intensity remarkably decreasing with the increase in the concentration of PDGF-BB. Consequently, the ingenious integration of intra-molecular ECL-RET and 3D bipedal DNA walker realized dual signal amplification, which endowed the designed aptasensor with high specificity and sensitivity for PDGF-BB analysis, providing great promise in clinical disease diagnosis.
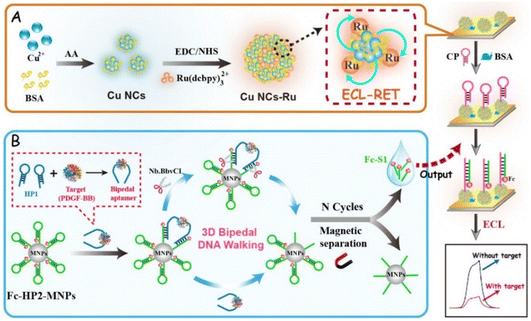 | ||
| Scheme 1 Schematic illustration of the designed ECL aptasensor: (A) preparation of Cu NCs-Ru, (B) mechanism of the 3D bipedal walking strategy. | ||
2. Experimental section
2.1. Preparation of Cu nanoclusters (Cu NCs)
First, based on the reported literature with some modification,25 0.1 g of BSA was dissolved into 10 mL of ultrapure water and ultrasonication for 10 min, then with the addition of NaOH solution (1 M), the pH gradually became 6.0 under stirring. Next, 1 mL of fresh-prepared solutions of AA (0.1 M) and 100 μL of Cu2+ (0.1 M) were successively added into the above BSA solution and observed for 12 h at 25 °C to obtain a Cu NC mixture. Subsequently, the above mixture was dialyzed against ultrapure water for 48 h in order to remove all small molecular impurities. Finally, the resultant Cu NCs were successfully obtained and stored at 4 °C until further use.2.2. Preparation of Cu NCs-Ru
First, 1 mL of the mixture solution containing 0.1 M EDC and 0.01 mM NHS was injected into Ru(dcbpy)32+ solution (1 mg mL−1, 2 mL) and stirred for 1 h at 25 °C. Next, Cu NCs (1 mg mL−1, 2 mL) were poured into the above activated solution of Ru(dcbpy)32+. After gentle stirring for 1 h, the product of Cu NCs-Ru was centrifuged and washed with ultrapure water repeatedly to eliminate the supernatant. Eventually, the as-prepared Cu NCs-Ru was re-dispersed in 10 mL ultrapure water containing 5% Nafion.2.3. Preparation of Fc-HP2 modified magnetic nanoparticles (Fc-HP2-MNPs)
First, 500 μL mixtures containing 100 mM EDC and 10 mM NHS were added into carboxylic-coated magnetic nanoparticles (MNPs, 300 μL, 1 mg mL−1) and reacted for 1 h at 25 °C to activate the carboxyl groups of MNPs. Afterward, the MNPs were separated and washed three times with PBS. Subsequently, with the introduction of 300 μL of Fc-HP2 (2.5 μM), the mixtures were reacted at 37 °C and kept for 12 h to ensure sufficient reaction. When the reaction was completed, BSA was used to block the nonspecific adsorption sites. Finally, the product of Fc-HP2-MNPs was separated with a magnet, re-dispersed into 300 μL of PBS and reserved at 4 °C until further use.2.4. Target-triggered 3D bipedal DNA walker amplification
First, 10 μL of HP1 (2.5 μM) incubated with various concentrations of PDGF-BB was placed for 1 h at 25 °C to form a bipedal aptamer structure. Subsequently, 10 μL Fc-HP2-MNPs and Nb.BbvCI (1 U μL−1) were added into the above solution (contained HP1 and PDGF-BB) and incubated at 37 °C for 2 h to activate the 3D bipedal DNA walker signal amplification. After magnetic separation, Fc-labeled DNA fragments (Fc-S1) produced by the 3D bipedal DNA walker in the supernatant were collected.2.5. Fabrication of modified ECL aptasensor
Prior to fabrication, bare GCE (Φ = 3 mm) was meticulously polished and carefully cleaned to a glossy surface with 50 nm alumina powder, then finely cleaned with ultrapure water under ultrasonication. After that, 10 μL of the as-prepared ECL luminophore of Cu NCs-Ru was dropped onto the surface of the clean GCE to yield a Cu NCs-Ru decorated electrode (Cu NCs-Ru/GCE). Following that, 10 μL of CP was immobilized on the above-modified electrode to obtain CP/Cu NCs-Ru/GCE. Subsequently, 10 μL of BSA (0.25%) was incubated with the modified electrode for blocking the residual binding sites and the resultant aptasensor (BSA/CP/Cu NCs-Ru/GCE) was achieved. Eventually, 10 μL of Fc-S1 obtained from a 3D bipedal DNA walker was dropped onto the fore-mentioned aptasensor and incubated for 2 h to obtain the final aptasensor (Fc-S1/BSA/CP/Cu NCs-Ru/GCE). Each step of the aforementioned modified electrode was rinsed with ultrapure water slightly.3. Results and discussion
3.1. Characterization of Cu NCs
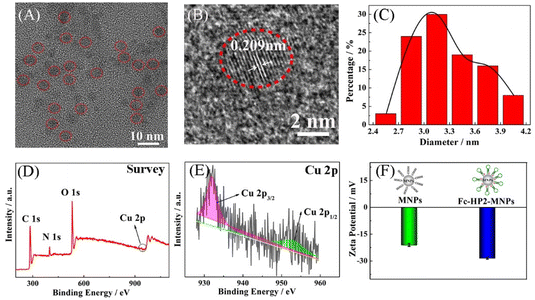
Cu NCs were characterized by HRTEM and XPS first. It can be displayed in the HRTEM image of Fig. 1A that Cu NCs are spherical, highly monodispersed and fairly uniform. At the same time, the lattice parameter of single Cu NCs in Fig. 1B is 0.209 nm and corresponds to the (111) lattice fringes of Cu, which shows its good crystallinity.26 It can be observed that Cu NCs are primarily distributed in the narrow range from 2.4 to 4.2 nm with an average size of approximately 3.3 nm (Fig. 1C). Furthermore, the component of the prepared Cu NCs and the valence state of the copper element in the Cu NCs were also determined by XPS measurement. As shown in Fig. 1D, it can be observed that Cu NCs consist of the desirable elements including C, O, N and Cu. Specifically, two distinctly characteristic peaks are located at 931.98 eV and 952.38 eV, which is ascribed to the Cu 2p3/2 and 2p1/2 of Cu0 or Cu+ (Fig. 1E), respectively. These outcomes are consistent with the previous literature.27–29 The results above clearly justify the successful preparation of Cu NCs. In addition, the average zeta potentials of modified MNPs change from −21 mV to −28 mV, which is attributable to the combination of negative MNPs with a number of negative Fc-HP2 linked by amide bonds, manifesting the successful synthesis of Fc-HP2-MNPs (Fig. 1F).303.2. ECL-RET between Ru(dcbpy)32+ and Cu NCs
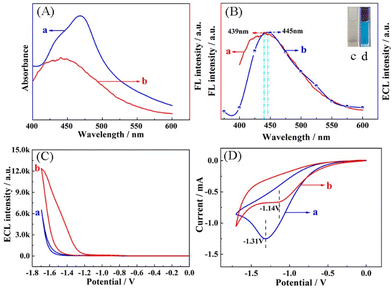
To clarify the possible ECL-RET mechanism of Cu NCs (donor) and Ru(dcbpy)32+ (acceptor), their spectral properties were measured. Fig. 2A shows an apparent overlapping between the UV-vis absorption spectrum of Ru(dcbpy)32+ (curve a) and the fluorescence (FL) emission spectrum of Cu NCs (curve b), which illustrates the favourable RET potentiality from Cu NCs (donor) to Ru(dcbpy)32+ (acceptor). The luminescence property of the Cu NCs is expressed by the FL spectrum and the ECL spectrum. Fig. 2B displays its FL emission wavelength at around 439 nm (curve a). Moreover, the ECL spectrum of Cu NCs is located at around 445 nm (curve b). In the inset of Fig. 2B, photographs of the well-dispersive Cu NCs under a daylight lamp and UV irradiation (365 nm) show transparent color and bright blue, respectively. Furthermore, the possibility of ECL-RET can be investigated by the following ECL and CV characterizations. According to Fig. 2C, the ECL signal is increased to approximately 12![[thin space (1/6-em)]](https://www.rsc.org/images/entities/char_2009.gif) 000 a.u. (curve b) with the assistance of Cu NCs due to the ECL-RET from the Cu NCs (donor) to Ru(dcbpy)32+ (acceptor). Simultaneously, the CV peak current of Cu NCs-Ru accordingly shifts positively from −1.31 V to −1.14 V compared with that of pure Ru(dcbpy)32+ (Fig. 2D). Above results indicate the occurrence of RET between Cu NCs (donor) and Ru(dcbpy)32+ (acceptor).31 On the basis of the above-mentioned findings, the novel ECL aptasensor based on intra-molecular Cu NCs-Ru as a cathodic ECL-RET probe is proposed to sensitively detect PDGF-BB.
000 a.u. (curve b) with the assistance of Cu NCs due to the ECL-RET from the Cu NCs (donor) to Ru(dcbpy)32+ (acceptor). Simultaneously, the CV peak current of Cu NCs-Ru accordingly shifts positively from −1.31 V to −1.14 V compared with that of pure Ru(dcbpy)32+ (Fig. 2D). Above results indicate the occurrence of RET between Cu NCs (donor) and Ru(dcbpy)32+ (acceptor).31 On the basis of the above-mentioned findings, the novel ECL aptasensor based on intra-molecular Cu NCs-Ru as a cathodic ECL-RET probe is proposed to sensitively detect PDGF-BB.
3.3. Characterization of the electrode modification
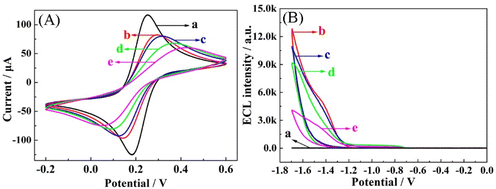
To observe the construction of the step-by-step prepared aptasensor, the assembly process was characterized by CV and ECL measurements. As exhibited in Fig. 3A, bare GCE shows a well-defined redox peak (curve a), demonstrating the outstanding electron transfer rate on the bare GCE. After Cu NCs-Ru are immobilized on GCE (curve b), there is a distinct decrease in the peak current compared with bare GCE (curve a). Due to their internal nature, Cu NCs-Ru may not facilitate electron transport on the surface of GCE. When CP (curve c) and BSA (curve d) are sequentially incubated with the electrode, the peak currents continuously weaken. The reason for this is that the nonconductive DNA chain and protein layer obstructs the electron transfer.32 Successively, when Fc-S1 is introduced to the electrode, it can be captured by CP on the surface of the modified electrode through a DNA hybridization reaction (curve e). It can be seen that the CV peak current is further decreasing, which accounts for the DNA chain hindering the interfacial electron transport. Therefore, CV characterization implies the successful fabrication of the aptasensor.Simultaneously, ECL characterization was also employed to survey the assembly steps of the aptasensor. As shown in Fig. 3B, nearly zero ECL emission peak of bare GCE was detected in 0.1 M S2O82− solution (curve a). After Cu NCs-Ru are coated on the GCE, the strong initial ECL signal is obtained (curve b), indicating that the intra-molecular ECL-RET improves the ECL intensity in this system. However, the ECL responses are continuously decreased by follow-up combination with CP (curve c) and BSA (curve d) due to their inferior electron transfer ability. Upon the hybridization of probe Fc-S1 with CP (curve e), the ECL response declines enormously, which can contribute to the obviously quenching effects of Fc-S1 on the ECL intensity of the Cu NCs-Ru system. Taken together, the ECL results agreed well with those of CV, verifying the successful assembly of the designed ECL aptasensor as expected.
3.4. Analytical performance
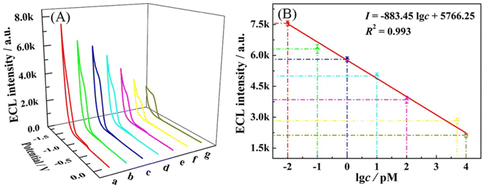
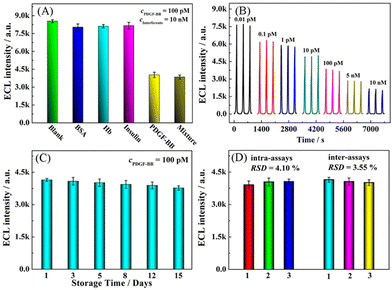
![[thin space (1/6-em)]](https://www.rsc.org/images/entities/char_2009.gif) log
log![[thin space (1/6-em)]](https://www.rsc.org/images/entities/char_2009.gif) c + 5766.25 with a squared correlation coefficient (R2) of 0.993, and the detection limit (LOD) is calculated to be 3.3 fM (S/N = 3). Furthermore, some previous reported works for PDGF-BB detection are listed in Table S2.† These results demonstrate that the fabricated aptasensor possesses excellent analytical performance in the PDGF-BB assay, which can be ascribed to the intra-molecular ECL-RET of Cu NCs-Ru combined with 3D bipedal DNA walker signal amplification.
c + 5766.25 with a squared correlation coefficient (R2) of 0.993, and the detection limit (LOD) is calculated to be 3.3 fM (S/N = 3). Furthermore, some previous reported works for PDGF-BB detection are listed in Table S2.† These results demonstrate that the fabricated aptasensor possesses excellent analytical performance in the PDGF-BB assay, which can be ascribed to the intra-molecular ECL-RET of Cu NCs-Ru combined with 3D bipedal DNA walker signal amplification.
4. Conclusions
In summary, we have successfully developed an intra-molecular ECL-RET aptasensor for sensitive PDGF-BB detection. It is noteworthy to mention that the Cu NCs-Ru possessing excellent ECL response originated from the intra-molecular ECL-RET realizing the extremely high ECL efficiency. In addition, benefiting from the ingenious integration of intra-molecular ECL-RET of Cu NCs-Ru and 3D bipedal DNA walker for dual signal amplification, the fabricated ECL aptasensor exhibited a detective limitation as low as 3.3 fM. Accordingly, the fabricated ECL aptasensor showed excellent anti-interference capacity and stability, and was successfully applied to the analysis of PDGF-BB in real serum. Most importantly, it will hold great potential in the detection of targets and clinical biological analysis.Conflicts of interest
The authors declare no competing financial interest.Acknowledgements
We gratefully acknowledge financial support from the National Natural Science Foundation of China (21973073, 21973074 and 21727805), the Natural Science Foundation of Shaanxi Province (2018JM2058 and 2018JM5180), the Top-rated Discipline Construction Scheme of Shaanxi Higher Education.References
- Y. Chen, S. W. Zhou, L. L. Li and J. J. Zhu, Nano Today, 2017, 12, 98–115 CrossRef CAS.
- Y. Chen, X. D. Gou, C. Ma, D. C. Jiang and J. J. Zhu, Anal. Chem., 2021, 21, 7682–7689 CrossRef PubMed.
- C. Ma, M. X. Wang, H. F. Wei, S. J. Wu, J. R. Zhang, J. J. Zhu and Z. X. Chen, Chem. Commun., 2021, 57, 2168–2171 RSC.
- T. T. Han, J. L. Yang, Y. Wang, Y. Cao, Y. Y. Wang, H. Y. Chen and J. J. Zhu, Electrochim. Acta, 2021, 381, 138281 CrossRef CAS.
- H. Q. Zhang, M. Lai, A. Zuehlke, H. Y. Peng, X. F. Li and X. C. Le, Angew. Chem., Int. Ed., 2015, 54, 14326–14330 CrossRef CAS PubMed.
- X. L. Yang, Y. N. Tang, S. D. Mason, J. B. Chen and F. Li, ACS Nano, 2016, 10, 2324–2330 CrossRef CAS.
- M. S. Khan, H. Ameer, A. Ali, R. Manzoor, L. Yang, R. Feng, N. Jiang and Q. Wei, Biosens. Bioelectron., 2020, 147, 111767–111773 CrossRef CAS PubMed.
- Z. Y. Li, Z. F. Lin, X. Y. Wu, H. T. Chen, Y. Q. Chai and R. Yuan, Anal. Chem., 2017, 89, 6029–6035 CrossRef CAS.
- Y. Lu, H. Ke, Y. Wang, Y. Zhang, H. Li, C. Huang and N. Jia, Biosens. Bioelectron., 2020, 170, 112664–112671 CrossRef CAS PubMed.
- X. F. Wang, H. W. Liu, H. L. Qi, Q. Gao and C. X. Zhang, J. Mater. Chem. B., 2020, 8, 3598–3605 RSC.
- R. P. Liang, L. D. Yu, Y. J. Tong, S. H. Wen, S. P. Cao and J. D. Qiu, Chem. Commun., 2018, 54, 14001–14004 RSC.
- H. J. Wang, Y. Q. Chai, H. Li and R. Yuan, Biosens. Bioelectron., 2018, 100, 35–40 CrossRef CAS.
- Y. C. Yu, C. Lu and M. N. Zhang, Anal. Chem., 2015, 87, 8026–8032 CrossRef CAS PubMed.
- C. Wang, M. Chen, Q. Han, J. L. Wu, X. Zhao and Y. Z. Fu, Biosens. Bioelectron., 2020, 156, 112146–112151 CrossRef CAS PubMed.
- Y. Zhou, Y. Q. Yu, Y. Q. Chai and R. Yuan, Talanta, 2018, 181, 32–37 CrossRef CAS PubMed.
- X. M. Zhuang, X. Q. Gao, C. Y. Tian, D. L. Cui, F. Luan, Z. G. Wang, Y. Xiong and L. X. Chen, Chem. Commun., 2020, 56, 5755–5758 RSC.
- S. Maity, D. Bain, S. Chakraborty, S. Kolay and A. Patra, ACS Sustainable Chem. Eng., 2020, 8, 18335–18344 CrossRef CAS.
- Y. Huang, H. Feng, W. Liu, Y. Zhou, C. Tang, H. Ao, M. Zhao, G. Chen, J. Chen and Z. Qian, Anal. Chem., 2016, 88, 11575–11583 CrossRef CAS.
- M. C. Pan, Y. M. Lei, Y. Q. Chai, R. Yuan and Y. Zhuo, Anal. Chem., 2020, 92, 13581–13587 CrossRef CAS PubMed.
- C. Wang, C. X. Wang, L. Xu, H. Cheng, Q. Lin and C. Zhang, Nanoscale, 2014, 6, 1775–1781 RSC.
- Z. G. Wang, B. K. Chen, A. S. Susha, W. H. Wang, C. Reckmeier, R. Chen, H. Z. Zhong and A. Rogach, Adv. Sci., 2016, 3, 1600182 CrossRef PubMed.
- P. Wu, X. Hou, J. J. Xu and H. Y. Chen, Chem. Rev., 2014, 114, 11027–11059 CrossRef CAS.
- G. F. Pierce, J. E. Tarpley, J. Tseng, J. Bready, D. Chang, W. C. Kenney, R. Rudolph, M. C. Robson, J. Vande Berg and P. Reid, J. Clin. Invest., 1995, 96, 1336–1350 CrossRef CAS.
- Y. Y. Li, G. A. Wang, S. D. Mason, X. L. Yang, Z. C. Yu, Y. Y. Tang and F. Li, Chem. Sci., 2018, 9, 6434–6439 RSC.
- Z. G. Wang, A. S. Susha, B. K. Chen, C. Reckmeier, O. Tomanec, R. Zboril, H. Z. Zhong and A. Rogach, Nanoscale, 2016, 8, 7197–7202 RSC.
- X. F. Jia, J. Li and E. K. Wang, Small, 2013, 9, 3873–3879 CrossRef CAS PubMed.
- X. Hu, X. D. Zhang, H. Y. Cao and Y. M. Huang, Sens. Actuators, B, 2022, 353, 131130 CrossRef CAS.
- W. We, Y. Lu, W. Chen and S. Chen, J. Am. Chem. Soc., 2011, 133, 2060–2203 CrossRef.
- M. Zhao, A. Y. Chen, D. Huang, Y. Zhuo, Y. Q. Chai and R. Yuan, Anal. Chem., 2016, 88, 11527–11532 CrossRef CAS PubMed.
- L. M. Yang, X. H. Yin, B. An and F. Li, Anal. Chem., 2021, 93, 1709–1176 CrossRef CAS.
- Z. Q. Fan, Z. Q. Lin, Z. P. Wang, J. Wang, M. Xie, J. Zhao, K. Zhang and W. Huang, ACS Appl. Mater. Interfaces, 2020, 12, 11409–11418 CrossRef CAS PubMed.
- J. Chen, J. Zheng, K. Zhao, A. Deng and J. G. Li, Chem. Eng. J., 2020, 392, 123670–123679 CrossRef CAS.
Footnotes |
| † Electronic supplementary information (ESI) available: Reagent and materials, optimization of experimental conditions and recovery assay of PDGF-BB in human serum samples. See DOI: https://doi.org/10.1039/d2an01321e |
| ‡ These authors contributed equally to this work. |
| This journal is © The Royal Society of Chemistry 2023 |

