DOI:
10.1039/D3RA01813J
(Paper)
RSC Adv., 2023,
13, 14291-14305
An ab initio DFT perspective on experimentally synthesized CuBi2O4†
Received
20th March 2023
, Accepted 4th May 2023
First published on 10th May 2023
Abstract
Here we present a comprehensive density functional theory (DFT) based ab initio study of copper bismuth oxide CuBi2O4 (CBO) in combination with experimental observations. The CBO samples were prepared following both solid-state reaction (SCBO) and hydrothermal (HCBO) methods. The P4/ncc phase purity of the as-synthesized samples was corroborated by Rietveld refinement of the powdered X-ray diffraction measurements along with Generalized Gradient Approximation of Perdew–Burke–Ernzerhof (GGA-PBE) and the Hubbard interaction U corrected GGA-PBE+U relaxed crystallographic parameters. Scanning and field emission scanning electron micrographs confirmed the particle size of the SCBO and HCBO samples to be ∼250 and ∼60 nm respectively. The GGA-PBE and GGA-PBE+U derived Raman peaks are in better agreement with that of the experimentally observed ones when compared to local density approximation based results. The DFT derived phonon density of states conforms with the absorption bands in Fourier transform infrared spectra. Both structural and dynamic stability criteria of the CBO are confirmed by elastic tensor and density functional perturbation theory-based phonon band structure simulations respectively. The CBO band gap underestimation of GGA-PBE as compared to UV-vis diffuse reflectance derived 1.8 eV was eliminated by tuning the U and the Hartree–Fock exact-exchange mixing parameter αHF in GGA-PBE+U and Heyd–Scuseria–Ernzerhof (HSE06) hybrid functionals respectively. The HSE06 with αHF = 14% yields the optimum linear optical properties of CBO in terms of the dielectric function, absorption, and their derivatives as compared to that of GGA-PBE and GGA-PBE+U functionals. Our as-synthesized HCBO shows ∼70% photocatalytic efficiency in degrading methylene blue dye under 3 h optical illumination. This DFT-guided experimental approach to CBO may help to gain a better understanding of its functional properties.
1 Introduction
Earth-abundant, stable, and benign bismuth (Bi) based oxides have been the holy grail for photocatalytic materials applicable to environmental pollutant degradation, water splitting, and noxious gas reduction using the renewable solar energy.1–6 The Bi reigns supreme due to many of its interesting properties like pronounced stereochemical activity, charge carrier effective mass reduction, and mobility enhancement arising from 6s lone electron pair, sp hybridization, spin–orbit interaction, and possesses useful optical, dielectric, and magnetic properties.7–14 The majority of the Bi-based oxides are n-type semiconductors and in applications like water splitting, two-photon processes require an efficient p-type light absorber to form a p/n-photoelectrochemical cell.15–17 The built-in electric field in the p/n structure aids the photogenerated electron–hole pair separation and thereby enhances the photocatalytic activities.18 Since copper-based oxides exhibit a p-type semiconducting nature, alloying Bi and Cu oxides to form ternary oxides like copper bismuth oxide CuBi2O4 (CBO hereafter) displays the desired p-type conductivity.19,20 The alloying reduces the CBO self-reduction directing the photo-electrons away from the Cu-3d orbital and reduces the electronic band gap to achieve efficient solar absorption.21 Moreover, surface passivation in combination with Fermi level engineering in CBO can facilitate carrier selective transport.22
The CBO has been synthesized both in powder and film forms by following different synthesis routes. The phase pure tetragonal powdered CBO can be obtained in solid-state reactions near 800 °C.18,23–27 The sol–gel methods produced CBO with a lower solution temperature of ∼200 °C followed by subsequent thermal annealing at elevated temperatures (∼600–800 °C).28–30 The dendritic CBO nanoparticles were obtained at low-temperature (below ∼100 °C) from a solution chemistry approach.31 The hydrothermal approach yield phase pure CBO at temperatures below 180 °C with varying morphology.13,32–37 The thin film CBO emerged from a metal–organic decomposition method and evolved through electrodeposition, drop casting, spray pyrolysis, spin coating, pulsed laser deposition, and reactive co-sputtering.15–17,19,20,22,27,38–42 The relevant physical properties like optical absorption and band gap of CBO may vary depending on the morphology and the particle size resulting from the aforementioned synthesis methods. Several methods like doping, composite structure, surface morphology engineering, and heterostructure use different synthesis methods to modulate carrier transport in CBO to enhance photocatalytic activity.29,31
The CBO crystallizes with tetragonal symmetry in the 3D unit cell where square shaped planar [CuO4]6− units are stacked along c-axis interleaved by Bi3+ ions.42 It holds the promise of an efficient photocatalytic material through (i) optimum electronic energy band gap (1.5–1.8 eV) resulting in an efficient absorber of the visible spectrum of the solar radiation, (ii) proper band edge locations with desired thermodynamic potentials (e.g. straddles both H2O reduction and oxidation potentials) for both valence band maximum (VBM) (e.g. suitable for CO2 reduction) and conduction band minimum (CBm), and (iii) p-type conductivity complementary to n-type nature of most photoelectrode materials.16,17,27,31,34,38,39 Despite these promising aspects, the photoelectrochemical performance of CuBi2O4 still suffers from major drawbacks due to photo-induced Cu2+ reduction (Cu2+ → Cu1+ → Cu), (ii) poor photo carrier mobility (10−3 cm2 V−1 s−1) due to polaronic transport resulting in few tens of nm diffusion lengths which severely restricts the effective thickness of CBO layer for efficient photon conversion, and (iii) modest optical absorption coefficient requiring few hundreds of nm thick layers to generate appreciable current density (∼10 mA cm−2 when exposed to AM1.5G solar illumination).15,20,43 Many of these detrimental effects arise from charge bulk and surface defect-induced carrier losses in CBO.22
The ab initio density functional theory (DFT) based simulations can serve as an indispensable tool to probe CBO functional properties relevant to different aforementioned applications.44 The CBO electronic and magnetic structures were investigated using local density approximation (LDA), Hubbard interaction U corrected LDA+U, and generalized gradient approximation of Perdew–Burke–Ernzerhof (GGA-PBE) functionals where band gap underestimation problem was evident when compared to that of experimentally measured values.14,45 The CBO band gap underestimation was avoided by tuning the Hubbard U parameter in a spin-polarized simulation using the GGA-PBE+U functional.34 The sophisticated self-interaction corrected Heyd–Scuseria–Ernzerhof (HSE06) hybrid functional with Hartree–Fock exact-exchange parameter αHF = 25% produced an overestimation of the CBO band gap.42 Recently, the tuning of αHF parameter has shown to produce more accurate electronic structure simulation as compared to that of the experimental values.46,47 It is hard to find detailed investigations of optical properties, Raman tensor, infrared response, elastic properties, and born charge tensor of CBO in combination with experimental observations in the existing literature. A DFT-guided experimental approach has proven to be invaluable for gaining a better understanding of the CBO functional properties.19,34,42
Here we attempt to perform rigorous ab initio DFT simulations of CBO in combination with detailed experimental observations. The CBO was synthesized following solid-state reaction (SCBO) and hydrothermal (HCBO) methods, and phase purity was confirmed using Rietveld refinement of the powder X-ray diffraction (XRD). The crystallographic parameters of both SCBO and HCBO samples were benchmarked against the GGA-PBE and GGA-PBE+U simulations. The sample's morphology and grain size were estimated by scanning and field emission scanning electron microscopy (SEM, FESEM), and the chemical purity was ensured from energy dispersive X-ray spectroscopy (EDX). The experimental room temperature (RT) Raman peaks for both SCBO and HCBO samples were identified in Raman tensor simulation using LDA, GGA-PBE, and GGA-PBE+U functionals. The RT Fourier-transform infrared (FTIR) peaks of the as-synthesized samples were compared with phonon density of states (DOS) in the cases of GGA-PBE and GGA-PBE+U functionals. The elastic stress tensor-based structural stability and vibrational phonon band structure (BS) derived dynamic stability of CBO were confirmed for both GGA-PBE and GGA-PBE+U functionals. We tuned the electronic and optical properties of CBO, simulated using GGA-PBE+U and HSE06 functionals to match the experimental electronic band gap and linear optical properties. We performed the photocatalytic methylene blue (MB) degradation of the HCBO under simulated solar exposure and estimated its degradation capability. In short, this comprehensive ab initio DFT approach aiding the experimental observation may facilitate a better understanding of CBO's physical properties.
2 Methodology
2.1 Computational details
The DFT-based first principles spin-polarized simulations were facilitated by projector augmented wave (PAW) using the Vienna Ab Initio Simulation Package (VASP).48–50 The tetragonal CBO unit cell with P4/ncc (130) symmetry containing 28 atoms, Cu (04), Bi (08), and O (16), in total, was considered in all simulations presented here. The PAW pseudo-potentials used 17, 15, and 6 electrons from Cu (3p63d104s1), Bi (5d106s26p3), and O (2s22p4) in valence configuration respectively. The rest of the electrons, apart from these valence ones, are considered as frozen core electrons in the PAW. The Monkhorst Pack 4 × 4 × 6 grid k-points mesh was used to sample the Brillouin Zone (BZ) during the full structural relaxation and optimization until the Hellmann–Feynman force and self-consistent total electronic energy convergence thresholds reach 10−4 eV Å−1 and 10−8 eV respectively. The plane wave cut-off was set to 500 eV in all cases except for the elastic properties simulations where the cut-off is set to 620 eV.
The DFT models the unknown electron interaction by different exchange-correlation functionals whose computational complexities and accuracy vary over its various kinds.44,51 In VASP-based simulations, we make use of three different functionals to simulate various materials' properties. The semilocal GGA-PBE was the first one to be used here.52 The use of LDA in VASP was avoided as it yields a metallic ground state for CBO due to self-interaction error.14 The presence of localized Cu-3d and Bi-5d orbitals in CBO dilutes Coulomb Interaction (CI) in the case of GGA-PBE.53–55 The diluted CI is boosted by the Hubbard interaction parameter U = 7 eV in the GGA-PBE+U formalism.34,42,56 The U parameter is material dependent and requires ad-hoc choice or parametric optimizations.54 The Bi-5d usually has negligible contributions on the electronic properties of its oxides making the exact value of U on it less critical and even can be treated as core in PAW.57,58 The third one is the computationally HSE06 hybrid functional that makes reliable estimates for CI in the localized d-orbitals to yield electronic and optical properties with better accuracy.54,55,59–64 The HSE06 uses the GGA-PBE electron correlation and divides the exchange into short and long-range parts.65–67 The use of partial exact Hartree–Fock exchange in HSE06 gives the required sophistication to combat the self-interaction error.61 The Hartree–Fock exact-exchanged mixing parameter αHF in HSE06 was tuned while keeping the screening parameter μ fixed to 0.2 Å−1 for reproducing the experimental observations.68–70 The computational burden in the case of HSE06 electronic BS simulations was kept manageable using the WANNIER90 tool.54,71,72 We make use of density functional perturbation theory (DFPT) to simulate vibrational phonon DOS and BS.73,74 The optical properties were derived from the BS using Fermi's golden rule along with the standard Kramer–Kronig relations for GGA-PBE, GGA-PBE+U, and HSE06 functionals.46,53,54 The simulated dielectric tensor for an unpolarized electromagnetic wave-driven back-scattered geometry, when differentiated using the finite difference method, yields the desired Raman tensor.46,75 In the case of Raman peak position simulation, we make use of QUANTUM-ESPRESSO (QE) with the same aforementioned simulation parameters except the plane wave cut-off was set to 400 eV for LDA and 500 eV in cases of GGA-PBE and GGA-PBE+U functionals.76–82
2.2 CBO magnetic configuration
We have considered the CBO formula unit as shown in Fig. 1 with four different spin magnetic configurations, i.e., ferromagnetic (FM), C-type antiferromagnetic (AFM-C), G-type antiferromagnetic (AFM-G), and A-type antiferromagnetic (AFM-A).14,45,83,84 To probe the spin structure, we fully relaxed the CBO unit cell with 28 atoms by sampling the BZ (4 × 4 × 6 k points) for both GGA-PBE and GGA-PBE+U functionals using 10−8 eV and 10−4 eV Å−1 for electronic and Hellmann–Feynman force convergences respectively. The estimated ground state energies including the non-magnetic (NM) configurations are compiled in Table S1 in ESI.† None of the functional produced any metallic ground state for the NM configurations.19 In recent times, the non-magnetic metallic phase of CBO is predicated which may display exotic behavior.85,86 Moreover, the AFM-C and AFM-G configurations turned out to be very close in total energies with the former being slightly lower for both GGA-PBE and GGA-PBE+U functionals. Hence we used the AFM-C spin configuration for all simulations presented in this article.
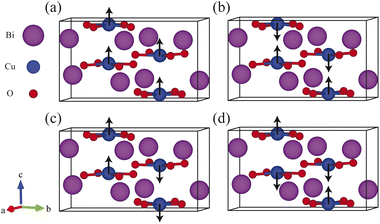 |
| | Fig. 1 Different spin magnetic orientations in CBO unit cell: (a) ferromagnetic (FM), (b) A-type antiferromagnetic (A-AFM), (c) C-type antiferromagnetic (C-AFM) and (d) G-type antiferromagnetic (G-AFM). Atomic spin orientations are marked with a black arrow. | |
2.3 Sample preparation
2.3.1 Solid state reaction. The Bi2O3 (Merck Germany, 99+% pure) and CuO (Merck Germany, 99.9% pure) powders were mixed with the desired stoichiometric ratio by grinding for 6 h in a ceramic mortar and pestle. The mixture was converted to circular pellets with 20 kN force in a hydraulic press (Weber-Pressen) before loading into the muffle furnace. The sample was sintered at 700 °C for 28 h with a heating rate of 10 °C min−1 in air. The resultant blackish powder was milled for 2 h before being subjected to all subsequent measurements.
2.3.2 Hydrothermal. Bi(NO3)3·5H2O (Merck Germany, 99+% pure) and Cu(NO3)2·5H2O (Merck Germany, 99+% pure) were used as precursor materials. The Bi(NO3)3·5H2O was completely dissolved into 65% w/w concentrated HNO3. The Cu(NO3)2·5H2O was dissolved in an aqueous solution with constant and vigorous magnetic stirring. Both solutions were mixed properly with the desired amount of as-prepared NaOH (25 mL 6 M) added to obtain a solution pH of 11. The solution was loaded into a 100 mL Teflon-lined stainless steel autoclave and heated to 180 °C for 24 h inside an oven. The resultant solution was agitated with 3 consecutive 20 min cycles of vortex and sonication. The solution precipitate was collected with a centrifuge (10![[thin space (1/6-em)]](https://www.rsc.org/images/entities/char_2009.gif) 000 rpm; 8 min; 4 cycles), rinsed, and then dried at 120 °C for 12 h.
000 rpm; 8 min; 4 cycles), rinsed, and then dried at 120 °C for 12 h.
2.3.3 Photocatalytic sample preparation. The 10 ppm MB was dispersed into a 100 mL aqueous solution. The 0.2 g per L HCBO sample was used as a photocatalytic agent with two different values of solution pH 5 and 10 using the required amount of NH4OH. The solution was subjected to constant magnetic stirring during the time of optical exposure by a Hg–Xe lamp to eliminate the chance of MB concentration gradient formation near the sample capable of causing spurious effects.
2.4 Characterization techniques
The high-temperature thermal sintering was performed in muffle furnace (Nabertherm LT 5/14 & Kejia M1700). The universal oven (XU058) was used for low-temperature sample heat treatments. The hydrothermally synthesized sample was subjected to vortex mixing (BIOBASE MX-S), sonication (GT SONIC-D6), and centrifugation (REMI C-24PLUS). The XRD pattern of the powdered samples was measured from 10° to 80° using a Rigaku SmartLab SE multipurpose XRD system with Cu Kα radiation irradiation at λ = 0.15418 nm emitted at 35 kV accelerating voltage with an emission current of 20 mA. The samples' morphology and chemical purity analysis were done using both SEM (AVO 18 Research) and FESEM (JEOL 7610F) coupled with EDX (JED 2300). The hydrodynamic size of the sample was estimated from dynamic light scattering (DLS) measurements using a nanoPartica SZ-100V2 nanoparticle analyzer. The RT Raman spectra were recorded using a MonoVista Confocal Raman Microscope CRS+ with 532.090 nm laser excitation. The PerkinElmer FTIR spectrometer was used to characterize the chemical bond vibrations. The UV-vis diffuse reflectance was performed with a Shimadzu UV-2600i UV-vis-NIR spectrometer. The photocatalytic efficiency of HCBO in degrading the MB dye exposed to the Hg–Xe lamp simulated solar irradiation was estimated from UV-vis absorption spectra.
3 Results and discussion
3.1 X-ray diffraction analysis
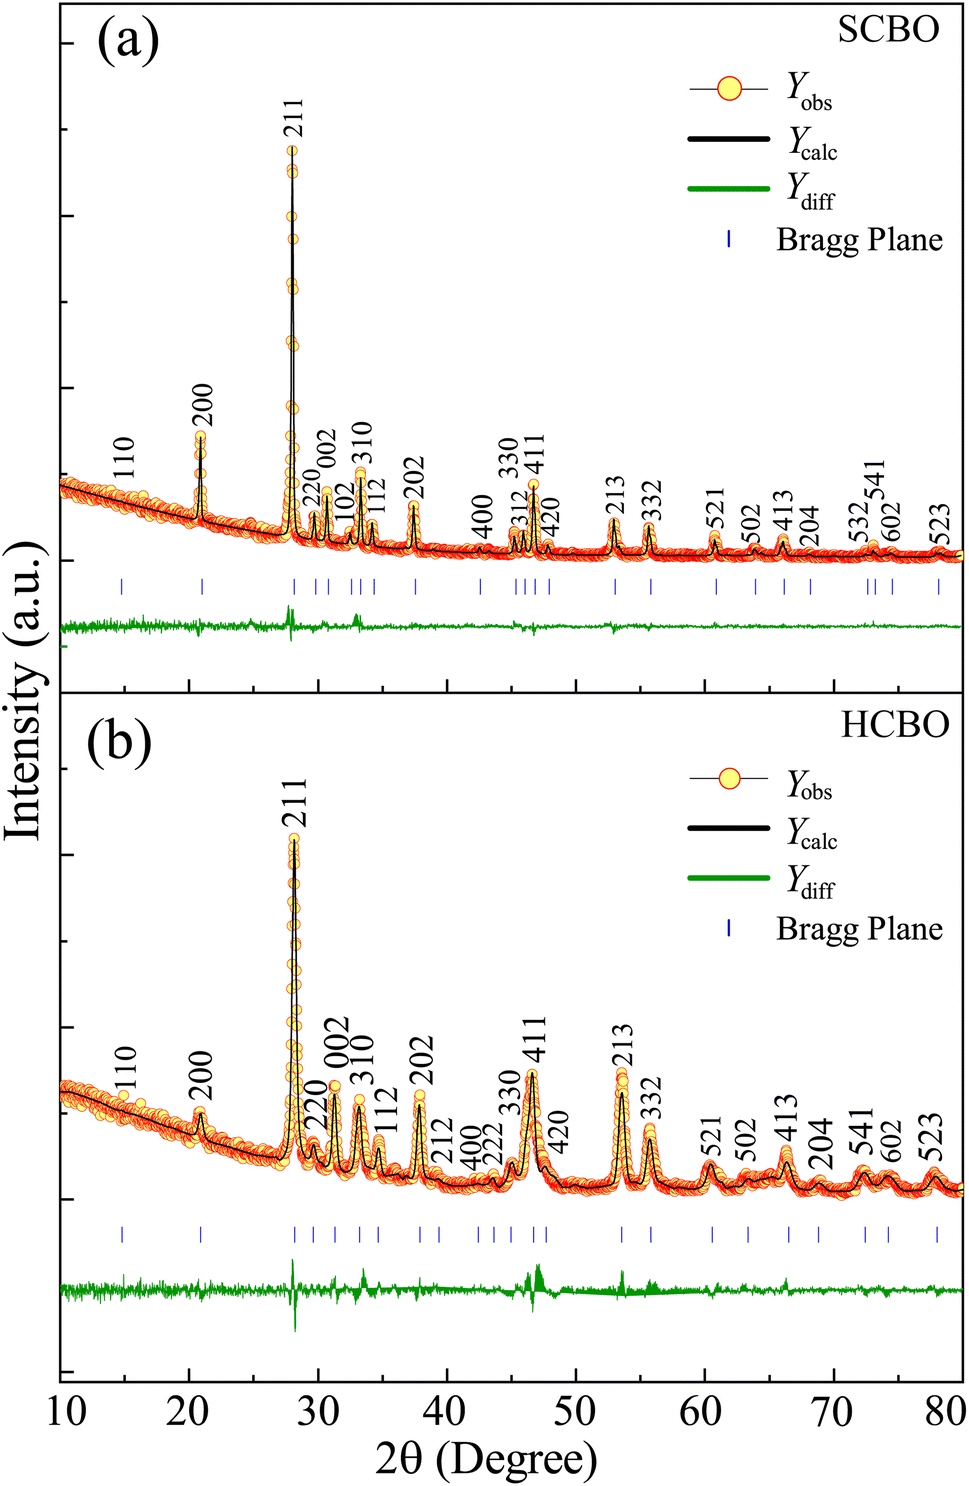
The crystal structure and phase purity of both SCBO and HCBO samples were investigated from the powdered XRD measurements with 2θ angular range of 10–80° as shown in Fig. 2(a) and (b). The intense narrow XRD peaks are located as per JCPDS PDF# 42-0334 for both samples confirming the desired tetragonal crystal structure with P4/ncc (130) space group symmetry.15–17,19,34,41,42 The Rietveld refinement further confirms the high phase purity of the samples fitting parameter χ2 values of 1.87 (SCBO) and 1.92 (HCBO) and the extracted crystallographic parameters are displayed in Table 1. The crystallographic parameters for both SCBO (a = b = 8.481 Å and c = 5.807 Å) and HCBO (a = b = 8.612 Å and c = 5.785 Å) are in good agreement with that of ref. 15, 19 and 42.
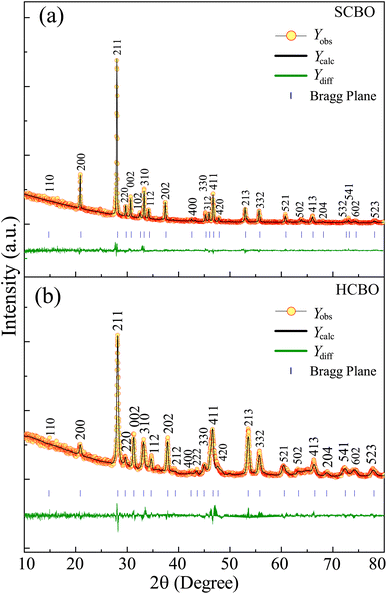 |
| | Fig. 2 Rietveld refined XRD patterns on top of experimentally observed data of (a) SCBO and (b) HCBO. The yellow circles are the experimental data points (Yobs), the black solid line represents the calculated refined pattern Ycalc, the bottom green curve Ydiff shows the difference between the experimental Yobs and calculated Ycalc values. | |
Table 1 Crystallographic parameters, bond angles, and bond lengths measured for both SCBO and HCBO samples from experiments (Exp.) and DFT simulations with GGA-PBE and GGA-PBE+U functionals
| Crystallographic parameters, bond lengths and bond angles |
| Sample |
Symmetry |
|
a (Å) |
b (Å) |
c (Å) |
α (°) |
β (°) |
γ (°) |
V (Å3) |
dCu–O (Å) |
dBi–O (Å) |
| SCBO |
P4/ncc |
Exp. |
8.481 |
8.481 |
5.807 |
90 |
90 |
90 |
417.682 |
1.942 |
2.179, 2.323 |
| HCBO |
P4/ncc |
Exp. |
8.612 |
8.612 |
5.785 |
90 |
90 |
90 |
429.053 |
1.972 |
2.206, 2.327 |
| P4/ncc |
GGA-PBE |
8.517 |
8.517 |
6.035 |
90 |
90 |
90 |
437.753 |
1.960 |
2.198, 2.376 |
| P4/ncc |
GGA-PBE+U |
8.502 |
8.502 |
6.030 |
90 |
90 |
90 |
435.908 |
1.945 |
2.193, 2.377 |
In the case of the in-plane crystal parameters a and b, the GGA-PBE (GGA-PBE+U) provides a = b = 8.517 Å (a = b = 8.502 Å) which are overestimation (underestimation) for SCBO (HCBO) sample. But in the case of out-of-plane parameter c, both GGA-PBE (6.035 Å) and GGA-PBE+U (6.030 Å) yield an overestimation for SCBO and HCBO samples. Overall, both the GGA-PBE and GGA-PBE+U overestimate the experimentally measured unit cell volume of SCBO and HCBO. This volume overestimation is well established as the GGA-PBE underbinds the atoms in the unit cell.54,55,87–89 Moreover, our DFT-derived lattice parameters are consistent with that of ref. 19, 34 and 42, confirming the reliability of our simulations.
3.2 Morphology and EDX analysis
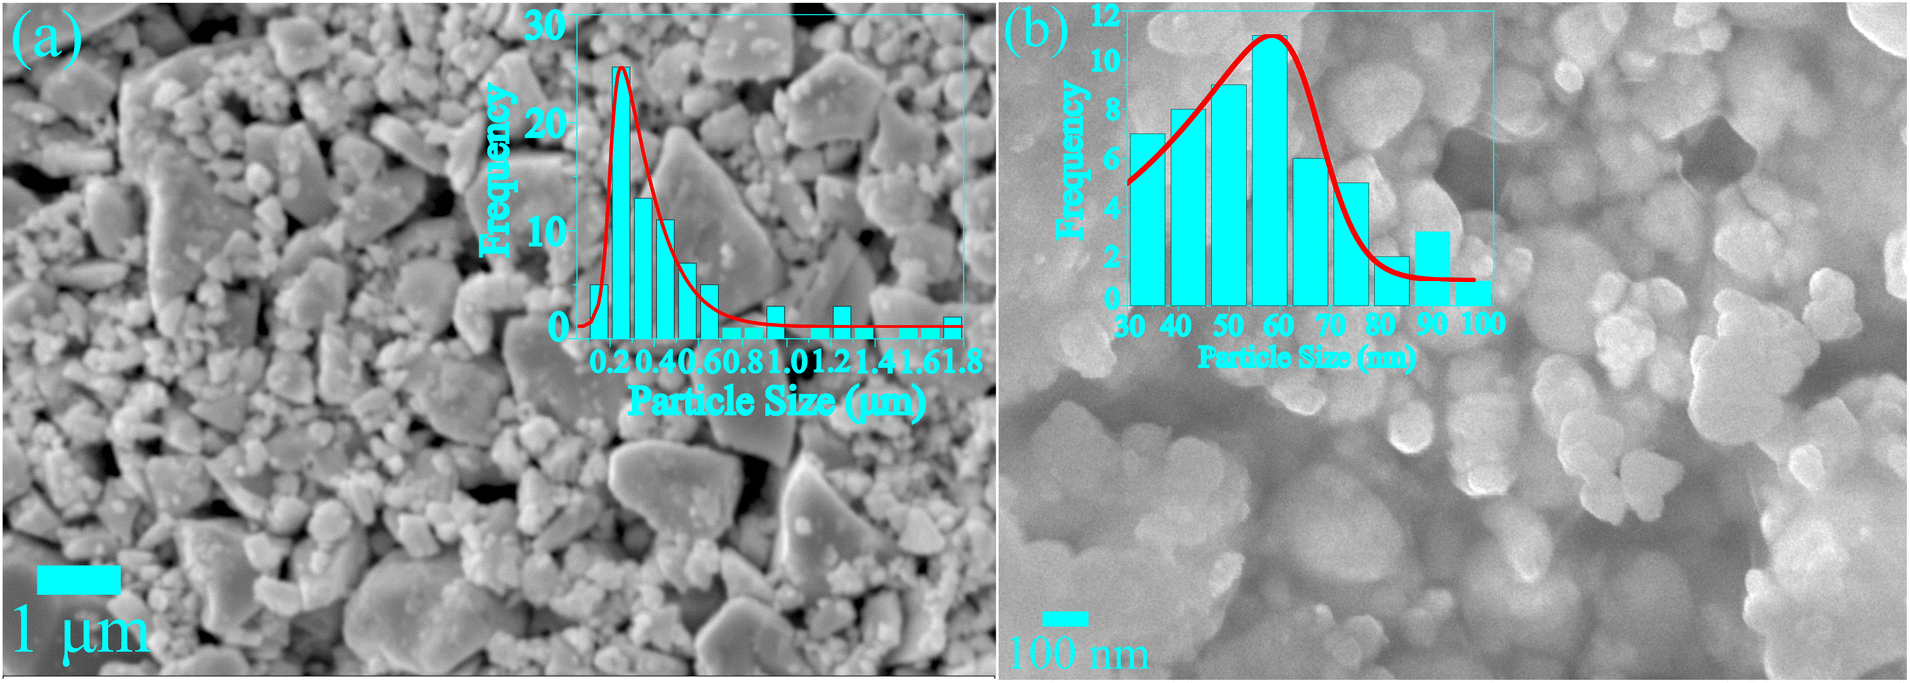
The SEM and FESEM micrographs were recorded to analyze the morphology and microstructure of SCBO and HCBO samples as depicted in Fig. 3(a) and (b) respectively. The grain size histograms show mean values of 250 nm and 60 nm in cases of SCBO and HCBO respectively. The thermal annealing at the elevated 700 °C for the SCBO sample may have facilitated the larger grain growth.53 The low temperature of 180 °C favors the small particle size of the HCBO sample. The EDX peak analysis confirms the chemical purity by identifying the expected Cu, Bi, and O elements in both SCBO and HCBO samples as shown in Fig. S5 in ESI.† The estimated atomic at% and weight wt% percentages of the aforementioned chemical elements are displayed in Table S2 (see ESI†). The CBO chemical formula dictates theoretical at% (wt%) of Cu, Bi, and O to be ∼14.28 (∼11.65%), ∼28.58 (∼76.62%) and ∼54.14% (∼11.73%) which are in good agreement with the experimentally measured values.
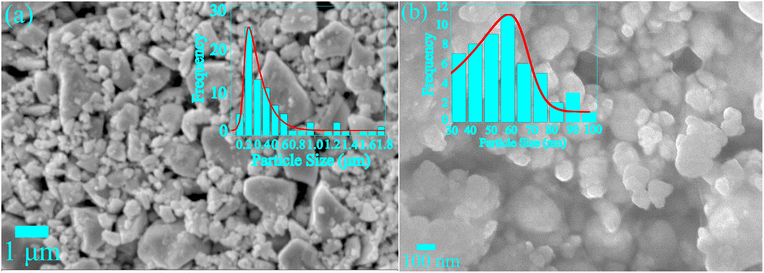 |
| | Fig. 3 (a) SEM micrographs of SCBO, (b) FESEM micrographs HCBO with particle size histograms superimposed. | |
3.3 Dynamic light scattering
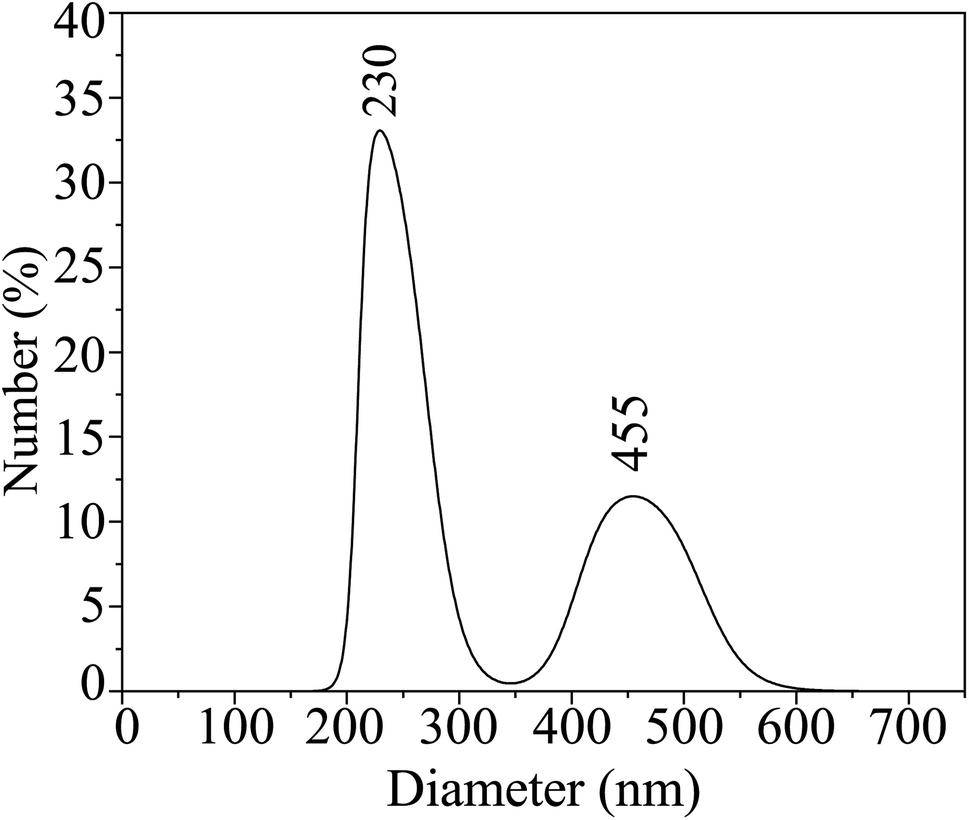
The hydrodynamic size distribution of the HCBO samples in the colloidal suspension was estimated from DLS correlation analysis as shown in Fig. 4. The distribution bimodal with one intense peak centered at 230 nm and the other weaker peak appeared at 455 nm. The HCBO particles undergo a dispersed random walk in small clusters as they interact with the laser beam. The motion of the individual clusters is convoluted from their size, viscosity, and temperature of the solution. Hence small aggregation of 60 nm HCBO particles may have defined the hydrodynamic sizes to be in the aforementioned range.90,91
 |
| | Fig. 4 Size distribution of HCBO nanoparticles from dynamic light scattering measurements. | |
3.4 Raman spectroscopy
To probe the structure and symmetry of the underlying crystal through the vibrational phonon spectra, the RT Raman spectra were obtained for both SCBO and HCBO samples as shown in Fig. 5. The centrosymmetric P4/ncc space group defines the Wyckoff positions of Cu (4c), Bi (8f), and O (16g), and the 25 Raman modes are labeled by ΓRaman = 5Ag + 5B1g + 4B2g + 11Eg. All these Raman bands usually appear together in a pure single crystal CBO sample. Out of the 25 Raman bands, 9 Raman modes are observed in both SCBO and HCBO samples. The observed Raman bands are identified with their corresponding symmetry along with the DFT simulated peak positions using LDA, GGA-PBE, and GGA-PBE+U functionals in Table 2 (also in Table S3 in ESI† with corresponding atomic motion). The LDA missed detection of the Raman peaks at 136 (A1g) and 830 cm−1 (A1g) originating from translation and breathing modes of CuO4 respectively. Both GGA-PBE and GGA-PBE+U successfully detected all the experimentally observed Raman peaks. The close match of the experimental Raman peaks with that of ref. 19, 26, 92–94 and DFT simulation further corroborates the phase purity of the as-synthesized samples. The B1g Raman peaks are missing due to their lower intensity two orders of magnitude as compared to that of B2g modes.
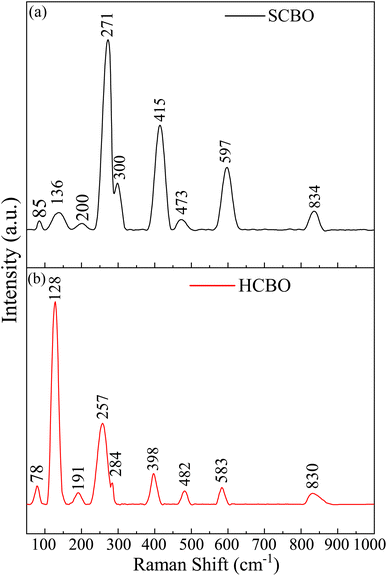 |
| | Fig. 5 RT Raman spectra of (a) SCBO, (b) HCBO samples. | |
Table 2 Experimental Raman peaks of both SCBO and HCBO samples along with that of DFT simulation with LDA, GGA-PBE, and GGA-PBE+U functionals
| Raman peak analysis |
| SCBO (cm−1) |
HCBO (cm−1) |
LDA (cm−1) |
GGA-PBE (cm−1) |
GGA-PBE+U (cm−1) |
Symm. |
| — |
— |
44 |
37 |
30 |
A1g |
| 85 |
78 |
78 |
85 |
72 |
B2g |
| — |
128 |
127 |
128 |
128 |
A1g |
| 136 |
— |
— |
138 |
138 |
A1g |
| 200 |
191 |
194 |
191 |
194 |
Eg |
| 271 |
257 |
260 |
261 |
274 |
A1g |
| 300 |
284 |
290 |
308 |
282 |
B2g/Eg |
| 415 |
398 |
398 |
398 |
398 |
A1g |
| 473 |
482 |
480 |
475 |
486 |
B2g |
| 597 |
583 |
585 |
593 |
593 |
A1g/Eg |
| 834 |
830 |
— |
827 |
825 |
A1g |
3.5 Fourier transform infrared spectroscopy
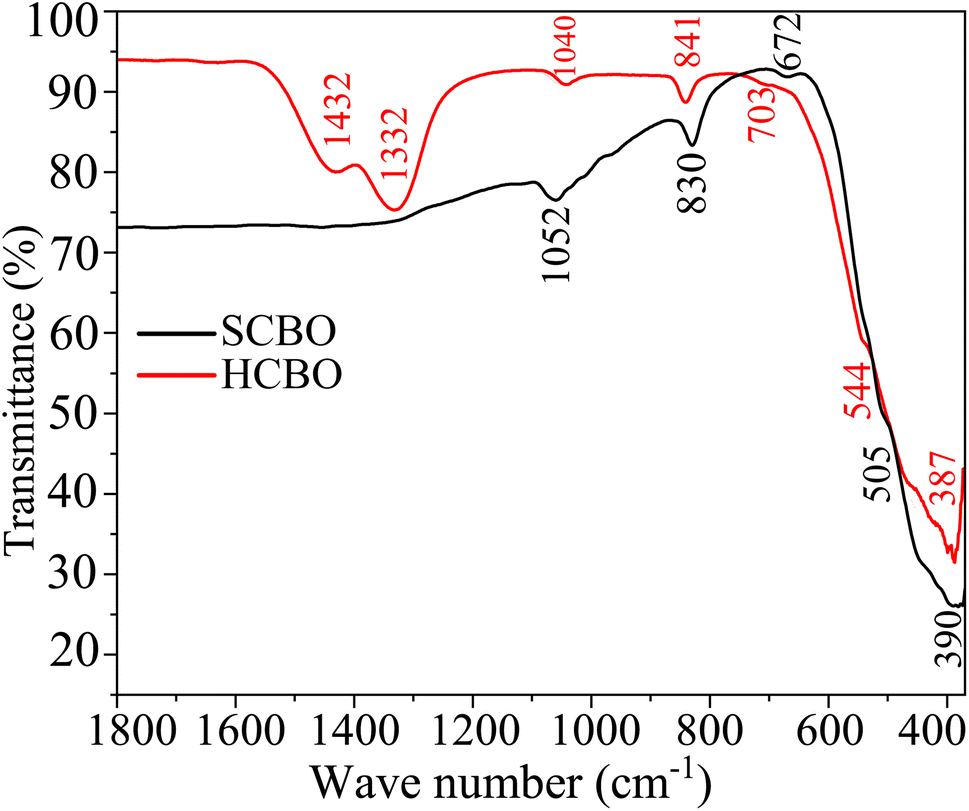
The relevant chemical bond vibrations for both SCBO and HCBO samples were detected through FTIR absorption bands as shown in Fig. 6 and Table S4 (ESI†). The observed bond vibrations are benchmarked against the characteristic peaks in the DFT simulated phonon DOS presented in Section 3.6 of this article. The Cu–O bond stems the absorption near 390 (387) and 505 (544) cm−1 for SCBO (HCBO) sample. The Bi–O bond lengths vary across the CBO unit cell which resonates at different excitation frequencies giving rise to absorptions near 672 (703), 830 (841), 1330, and 1430 cm−1 in the case of SCBO (HCBO) sample. The absorption near 1050 (1040) cm−1 is characteristic of Bi–O–Cu bond vibrations. The good agreement between the experimental FTIR peaks with that of DFT simulation along with other ref. 92 and 95 further validates the crystalline structure and chemical composition of our as-synthesized samples.
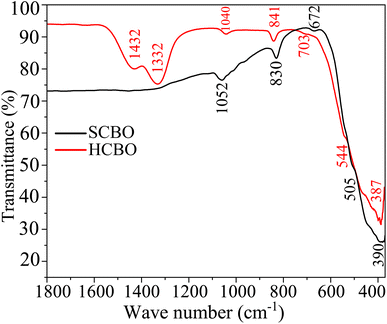 |
| | Fig. 6 The RT FTIR spectra of SCBO and HCBO samples. | |
3.6 Elastic properties simulation
The structural stability is codified in the elastic properties (E.P.) of the materials. We simulated the elastic tensor Cijs by applying a finite perturbation to atoms in the unit cell with forces applied in different directions.96,97 The plane wave energy cut-off is chosen to be 620 eV which is large enough to facilitate the convergence in stress tensor simulation. The simulated E.P. for both GGA-PBE and GGA-PBE+U are tabulated in Table 3. The tetragonal crystal structure with P4/ncc (130) (point group 4/mmm) is characterized by six independent elastic constants, i.e., C11, C12, C13, C33, C44 and C66. Both GGA-PBE and GGA-PBE+U functionals satisfy the structural stability condition for tetragonal CBO through Born rule,98| | |
C11 > |C12|, C44 > 0, C66 > 0, 2C132 < C33(C11 + C12),
| (1) |
as can be seen from Table 3. The important material's elastic properties such as bulk-modulus (BV, BR and BH), shear modulus (GV, GR and GH), Young's modulus (EV, ER and EH), Poisson's ratio (νV, νR and νH) and Pugh's ratio (kV, kR and kH) were determined using three different frameworks Voigt (V), Reuss (R) and Hill (H).99–101 The nonzero U in the case of GGA-PBE+U slightly diminish the BV, BR and BH as compared to that of GGA-PBE indicating a small reduction in compressibility of CBO. But for shear modulus (GV, BR and BH) and Young's modulus (EV, ER and EH), nonzero U increases all these elastic properties indicating enhanced resistance to plastic deformation and stiffness. Both functions preserve the brittle nature of the CBO by the Poisson's ratio being smaller than the threshold value of 0.33. The simulated Pugh's ratios are greater than the brittle/ductile threshold value of 1.75.
Table 3 Elastic constants (Cij), bulk moduli (BV, BR and BH), shear moduli (GV, GR, GH), Young's moduli (EV, ER, EH), Poisson's ratio (νV, νR, νH) and Pugh's ratio (kV, kR, kH) in Voigt–Reuss–Hill framework for CBO using GGA-PBE and GGA-PBE+U functionals
| Elastic properties (E.P.) of CBO |
| E.P. |
GGA-PBE |
GGA-PBE+U |
| C11 (GPa) |
79.396 |
79.703 |
| C12 (GPa) |
50.035 |
47.819 |
| C13 (GPa) |
34.914 |
33.982 |
| C33 (GPa) |
95.857 |
101.064 |
| C44 (GPa) |
21.838 |
22.079 |
| C66 (GPa) |
53.033 |
56.566 |
| BV (GPa) |
54.930 |
54.677 |
| BR (GPa) |
54.928 |
54.606 |
| BH (GPa) |
54.929 |
54.638 |
| GV (GPa) |
28.330 |
29.79 |
| GR (GPa) |
23.627 |
24.753 |
| GH (GPa) |
25.977 |
27.272 |
| EV (GPa) |
72.520 |
75.63 |
| ER (GPa) |
61.993 |
64.511 |
| EH (GPa) |
67.320 |
70.145 |
| νV |
0.280 |
0.270 |
| νR |
0.312 |
0.303 |
| νH |
0.296 |
0.286 |
| kV |
1.940 |
1.84 |
| kR |
2.325 |
2.206 |
| kH |
2.115 |
2.003 |
3.7 Born charge tensor simulation
The dynamic nature of the electronic charge of the localized atom is encoded in the Born effective charge (BEC).102–105 The BEC emerges from the screened Coulomb potential of the ions in the lattice whose vibration originates the phonon modes in the material.106,107 The calculated BEC tensor is reported in Table 4 for both GGA-PBE and GGA-PBE+U functionals. Assuming the closed shell structure, the nominal values for the ionic charges of Cu, Bi, and O are +2, +3, and −2 respectively. By considering the average value of the diagonal elements, a large evident anomaly in the Cu (+9.31) charge state is evident for the GGA-PBE functional. The application of U on the Cu-3d orbital reduces this charge state anomaly to +6.24. In the case of the O1 atom, the average charge state turned out to be +4.15 (+4.10) in cases of GGA-PBE and GGA-PBE+U respectively. This is due to the strong hybridization of O-2p with Cu-3d orbitals.105 In the case of the O2 atom, GGA-PBE (GGA-PBE+U) derived average diagonal BEC turned out to be −2.465 (−2.482) which is quite close to the O atom nominal static close shell charge of −2.
Table 4 Born effective charge tensor of CBO using GGA-PBE and GGA-PBE+U functionals
| |
ZB |
Position |
xx |
xy |
xz |
yx |
yy |
yz |
zx |
zy |
zz |
| CBO [DFT] |
Cu |
4c |
10.262 |
0 |
0 |
0 |
10.262 |
0 |
0 |
0 |
7.411 |
| Bi |
8f |
2.172 |
0.219 |
0 |
−0.219 |
2.172 |
0 |
0 |
0 |
0.343 |
| O1 |
8g |
3.863 |
−1.155 |
0.090 |
−1.155 |
3.863 |
−0.090 |
0.168 |
−0.168 |
4.719 |
| O2 |
8g |
−1.878 |
0.386 |
0.417 |
0.112 |
−3.072 |
−0.159 |
0.684 |
0.214 |
−2.445 |
| CBO [DFT+U] |
Cu |
4c |
6.348 |
0 |
0 |
0 |
6.348 |
0 |
0 |
0 |
6.024 |
| Bi |
8f |
2.306 |
0.285 |
0 |
−0.285 |
2.305 |
0 |
0 |
0 |
0.534 |
| O1 |
8g |
3.792 |
−0.999 |
0.146 |
−0.999 |
3.792 |
−0.146 |
0.268 |
−0.268 |
4.730 |
| O2 |
8g |
−1.875 |
0.252 |
0.418 |
0.076 |
−3.071 |
−0.122 |
0.549 |
0.291 |
−2.499 |
3.8 Phonon properties simulations
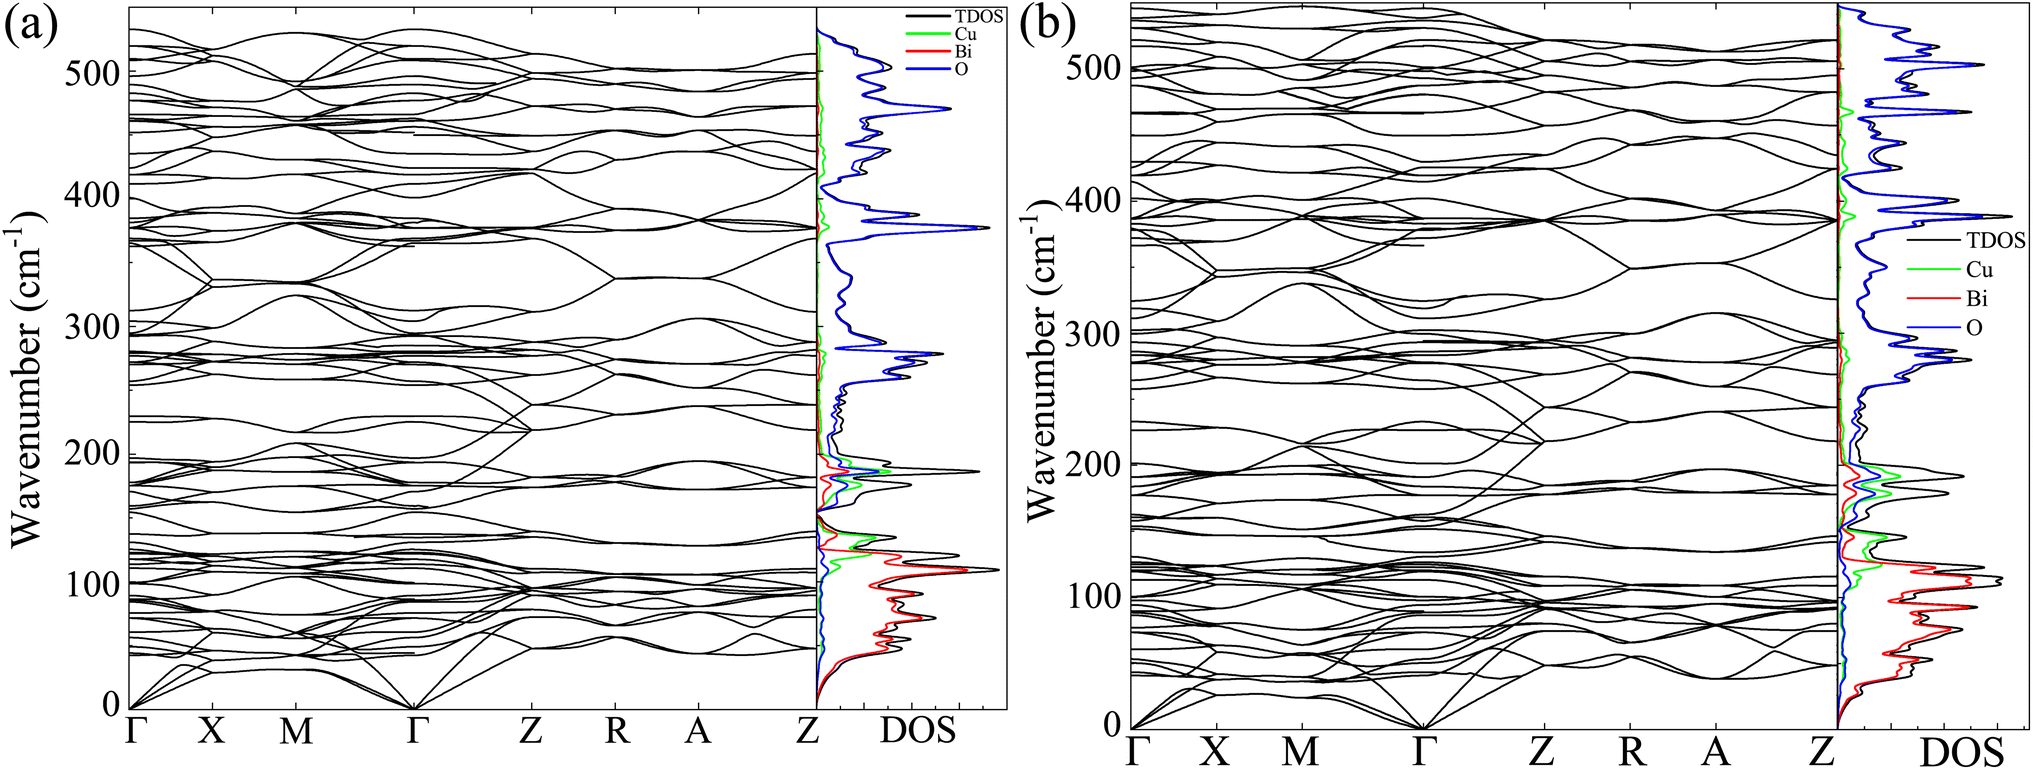
The dynamic stability of the CBO has intimately linked with the characteristic phonon vibrational modes.54 The phonon BS and DOS were derived from the DFPT technique for both GGA-PBE and GGA-PBE+U functionals as shown in Fig. 7(a) and (b) respectively. For both functionals, the degeneracy in the linearly dispersed acoustic phonon branch is evident. The absence of any imaginary phonon modes in the BS dispersion within the entire BZ validates the dynamic stability of the CBO in cases of both GGA-PBE and GGA-PBE+U functionals. This corroborates the fact that the application of a large value of U = 7 eV does not disrupt the dynamic stability of the CBO. Besides, the Bi, Cu, and O, having their atomic masses in descending order, are subject to decreasing inertial resistance in performing atomic vibration. Hence the vibrational spectra of the heavy Bi atoms are dominant in the 10–125 cm−1 range. The moderately heavy Cu and light O atoms stem vibrations in ranges 100–220 and 250–530 cm−1 respectively as can be seen from the phonon DOS plotted in the right columns of Fig. 7(a) and (b). The peaks in the phonon DOS are matched with the FTIR absorption as expected (see Table S4 in ESI†).
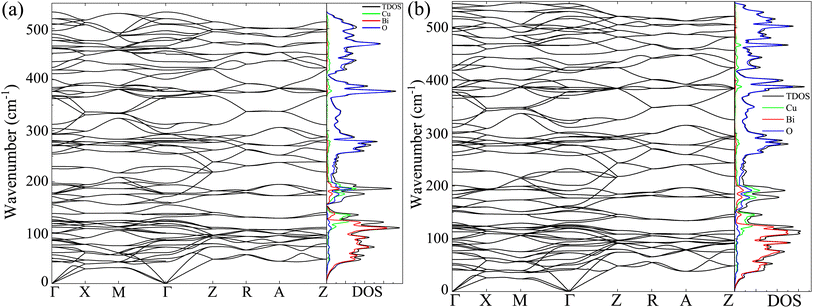 |
| | Fig. 7 Phonon BS, the total DOS (TDOS) and partial DOS (PDOS) for Cu, Bi, and O atoms (in right column) of CBO using the DFPT for (a) GGA-PBE and (b) GGA-PBE+U functionals. The phonon dispersion curves in the BS are plotted along the high symmetry k-points Γ, X, M, Z, R, and A in the BZ. | |
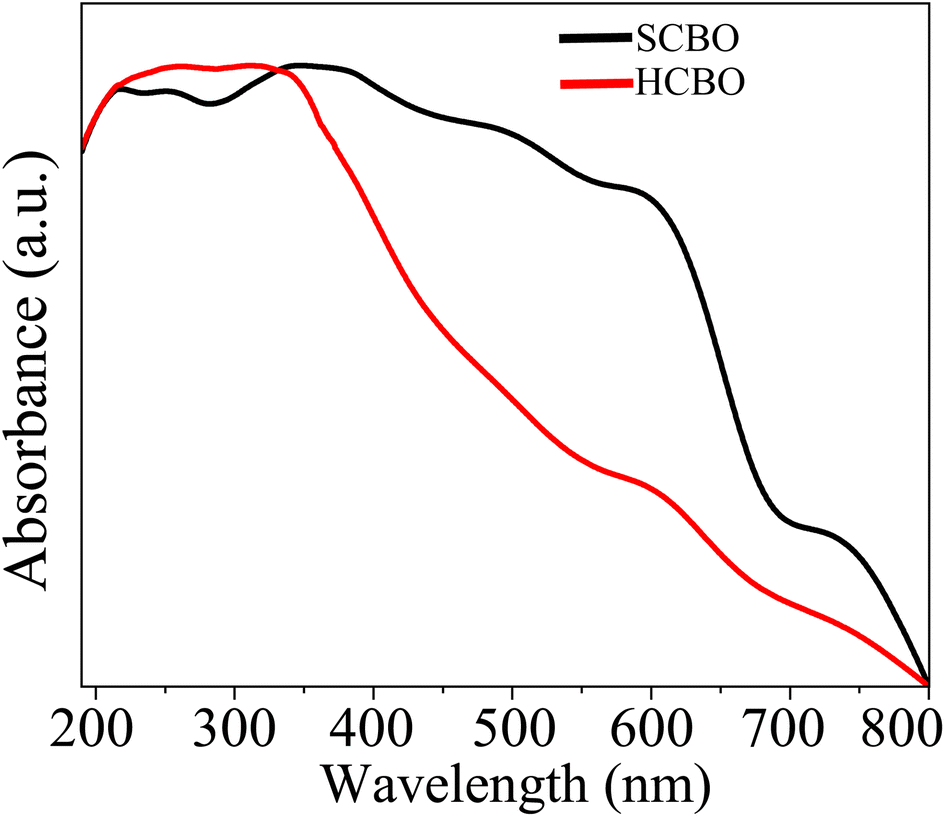
3.9 UV-vis spectroscopy
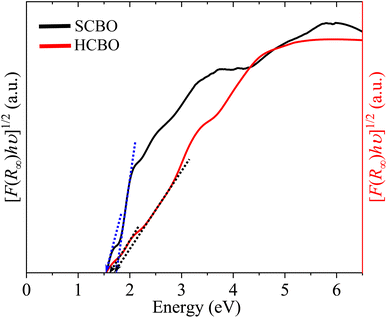
The measured UV-vis diffuse reflectance measurements were transformed into absorption by virtue of Kubelka–Munk function F(R∞) for both SCBO and HCBO samples as displayed in Fig. 8. The presence of multiple absorption edges for CBO is expected.19,42,108 The small absorption commences near 800 nm for both SCBO and HCBO samples. A more pronounced absorption onset is observed at 690 nm with a steeper slope for the SCBO as compared to HCBO sample. Near 550 nm, a sharp rise in absorption is marked for the HCBO sample, whereas the SCBO displayed a gradual increment in absorption.15 The incident photon energy hν is related to F(R∞) through the band gap Eg as| | |
[F(R∞)hν]1/γ = A(hν − Eg),
| (2) |
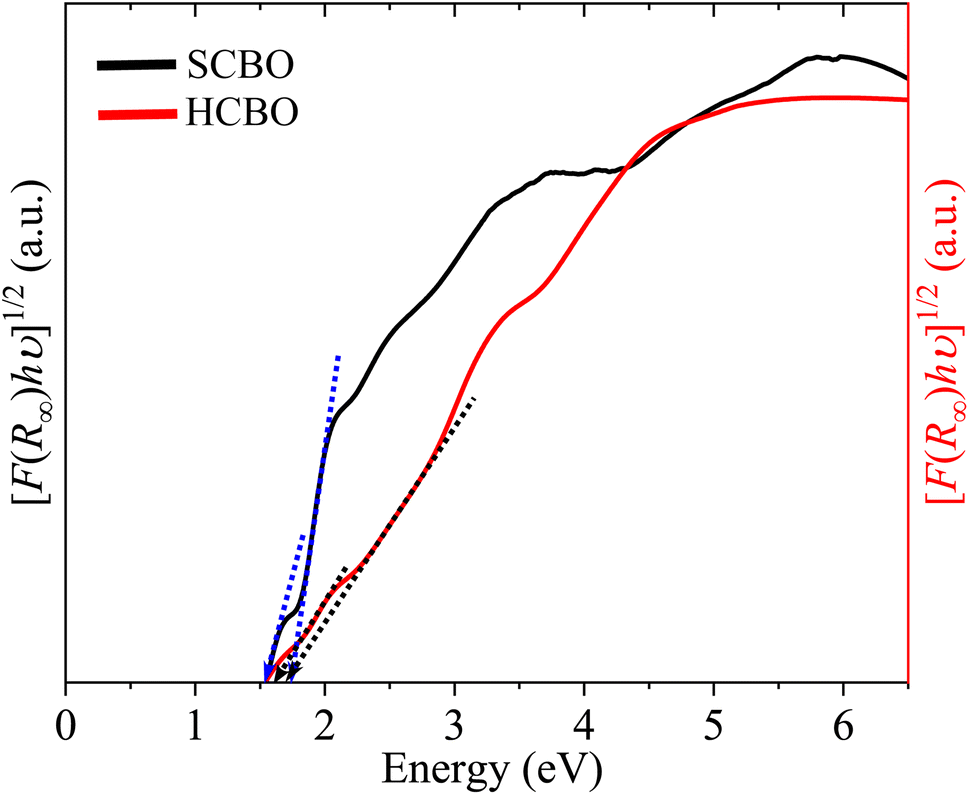
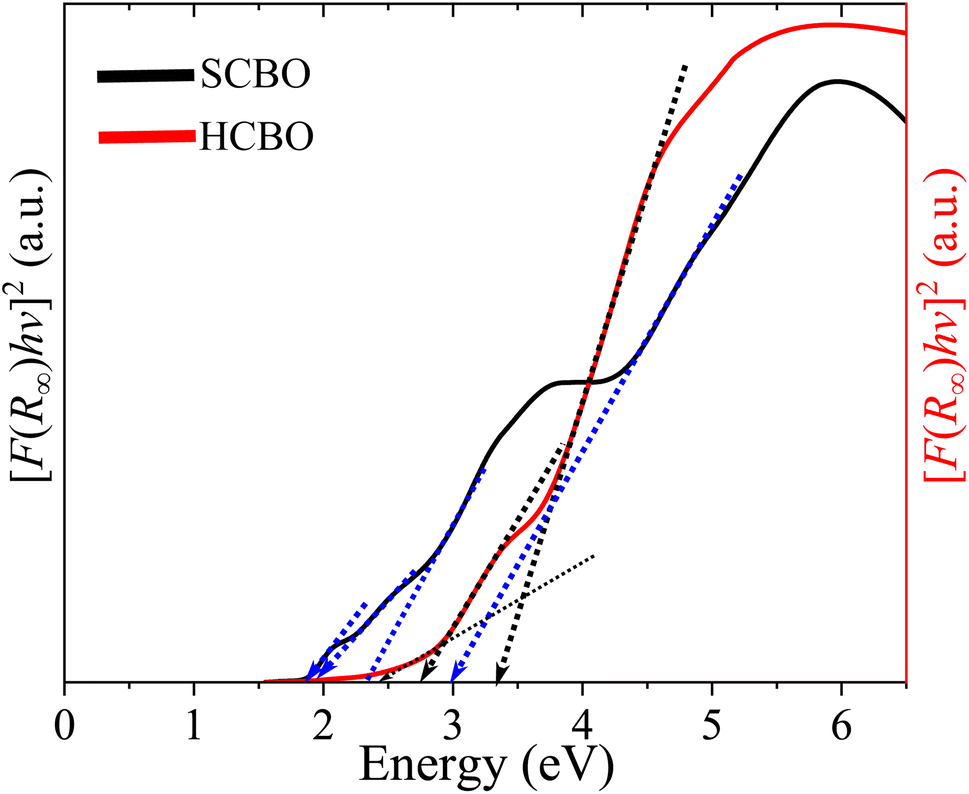
where A stands for a constant, and the parameter γ defines the direct (1/2) and indirect (2) optical transitions. The Tauc plots shown in Fig. 9 are for γ = 2 and yield multiple steep absorption edges which extrapolated to an Eg 1.55 (1.50) and 1.80 (1.78) eV for SCBO (HCBO) sample.19 For the direct optical induced electronic transitions γ = 1/2, the presence of multiple absorption edges is also evident in the Tauc plots in Fig. 10, and they resulted in multiple Eg of 1.85, 1.91, 2.25, 2.96 eV (2.42, 2, 75, 3.31 eV) for SCBO (HCBO) sample. The Eg ∼ 1.5 eV stems from Cu d–d transition. The one near 1.85 eV marks the electronic transition from hybridized O-2p:Cu-3d states in VB to Cu-3d states in CB of CBO. The p–d charge transfer (CT) transition appears near 2.25 eV. The 2.43 eV resembles the CT transition involving Cu-3d orbitals. Above 3 eV, the direct excitation involves p–d CT.
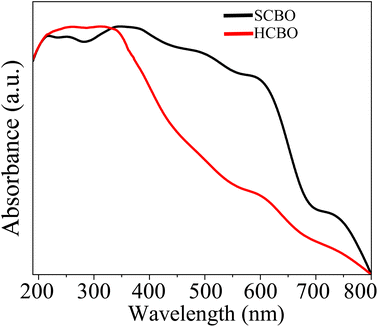 |
| | Fig. 8 UV-vis diffuse absorption spectra of SCBO and HCBO samples. | |
 |
| | Fig. 9 Indirect band gap estimation from Tauc plot of SCBO and HCBO samples. | |
 |
| | Fig. 10 Direct band gap estimation from Tauc plot of SCBO and HCBO samples. | |
3.10 Electronic structure simulation
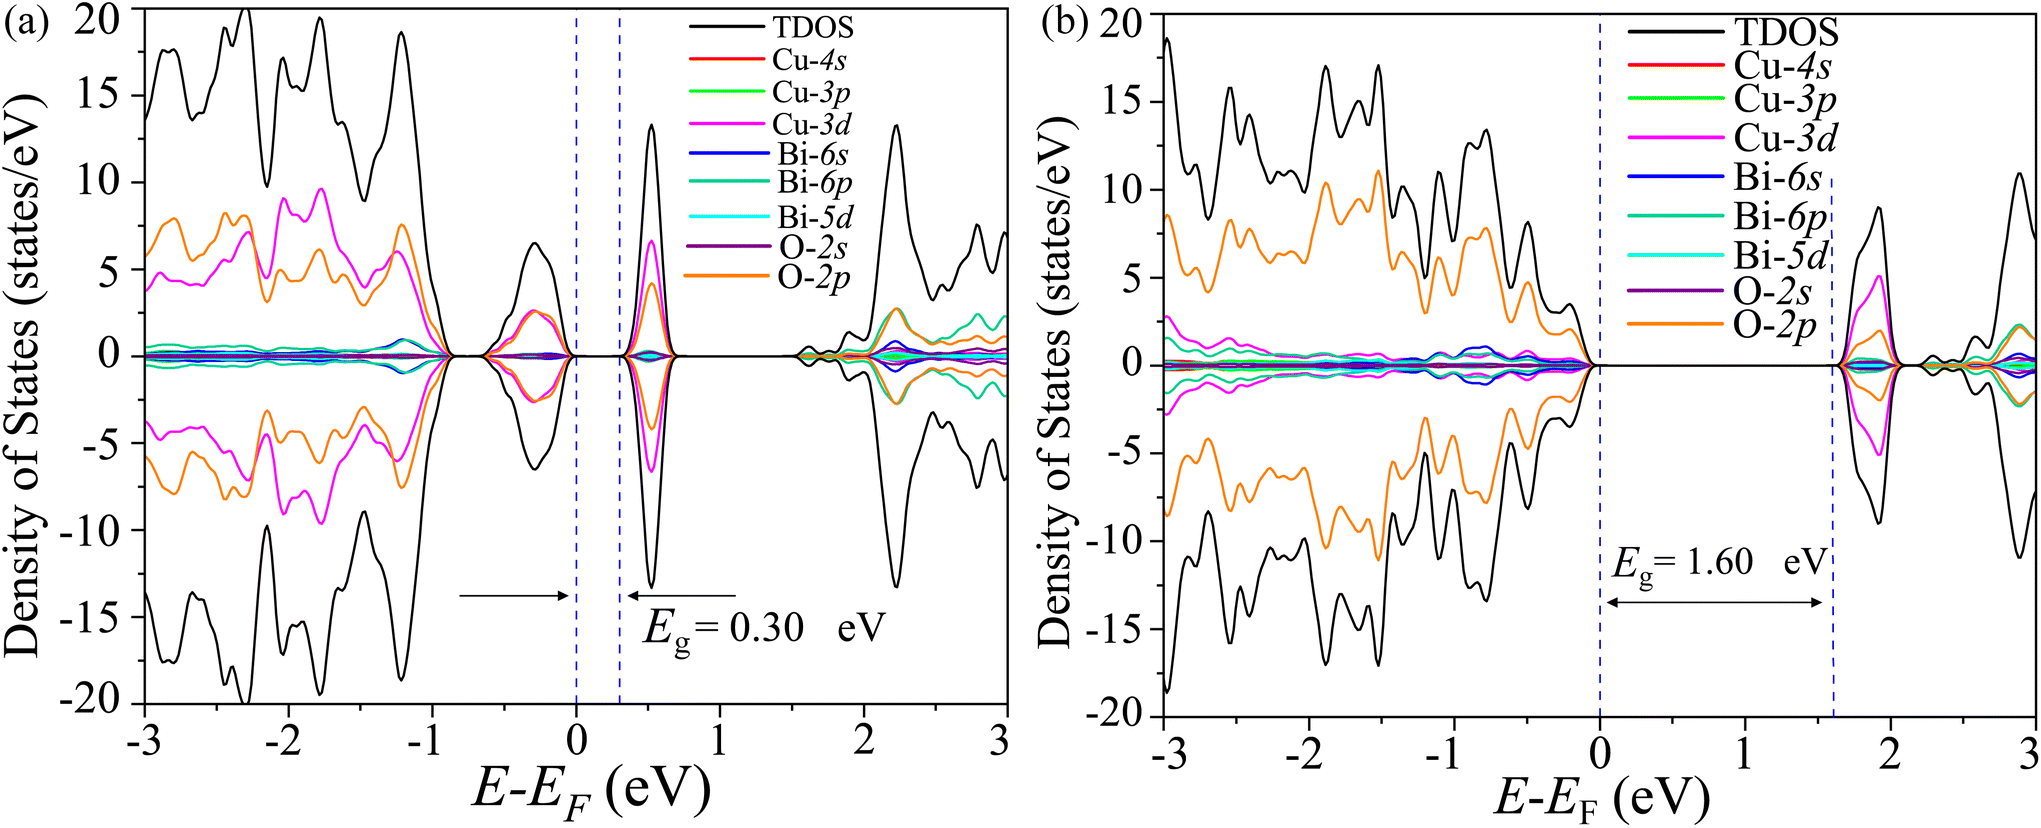
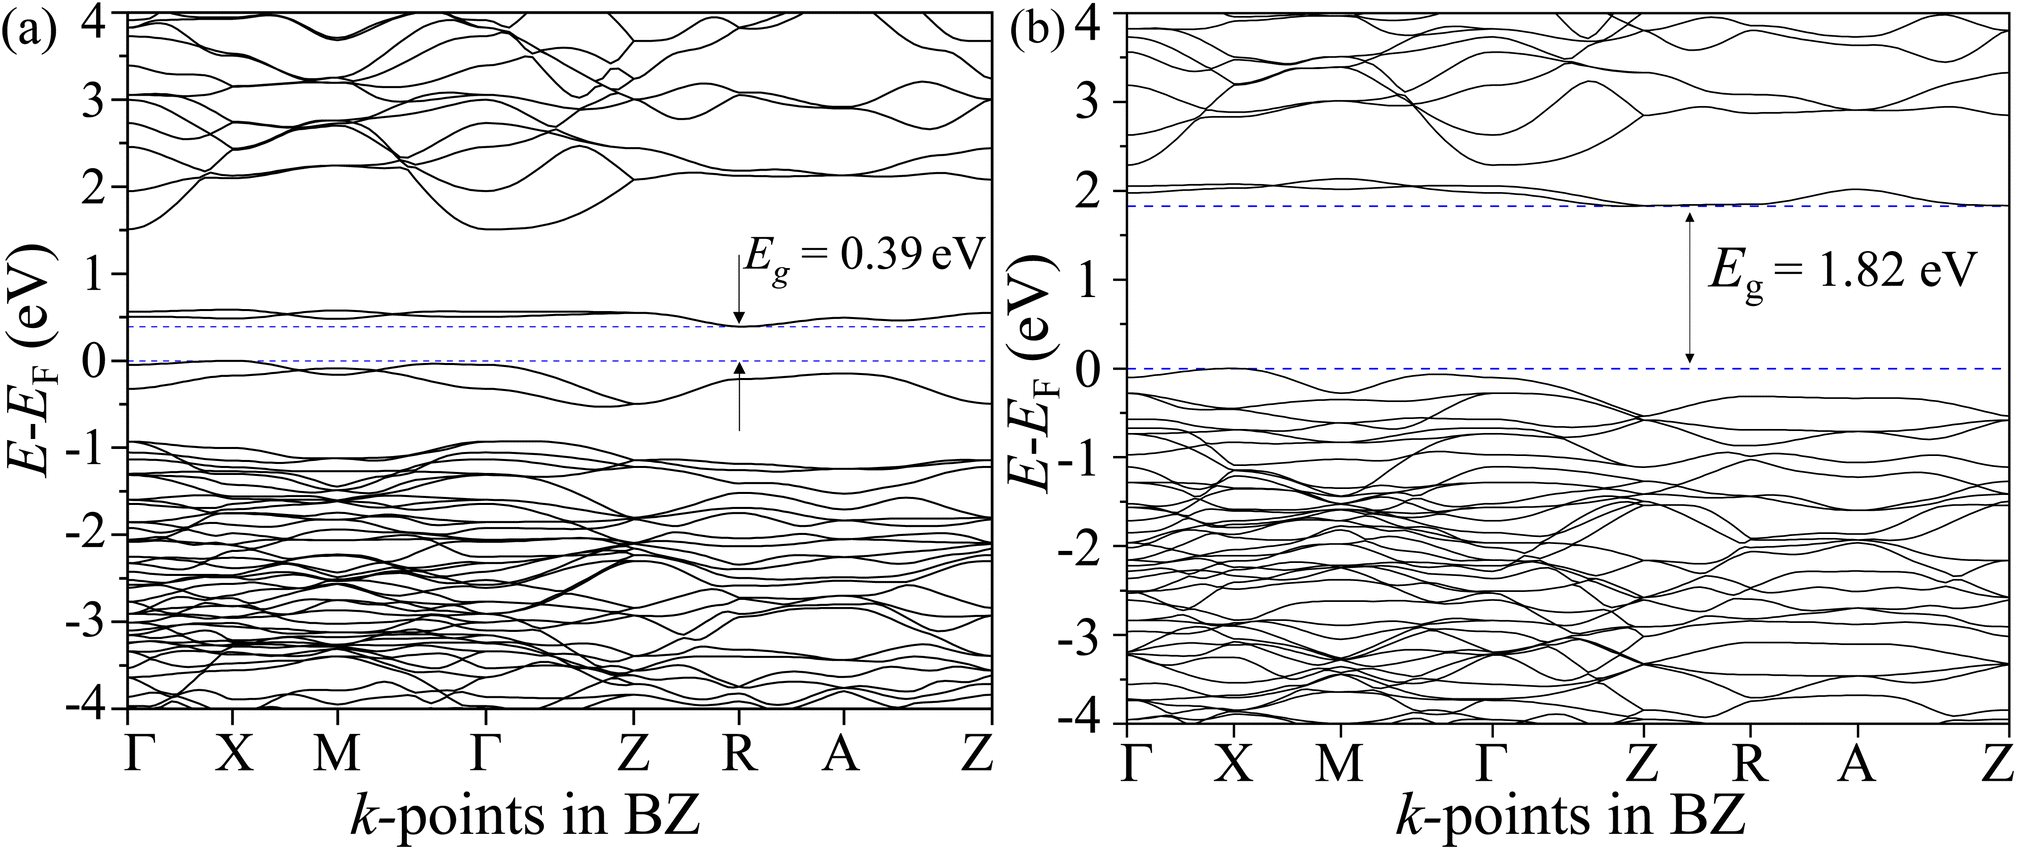
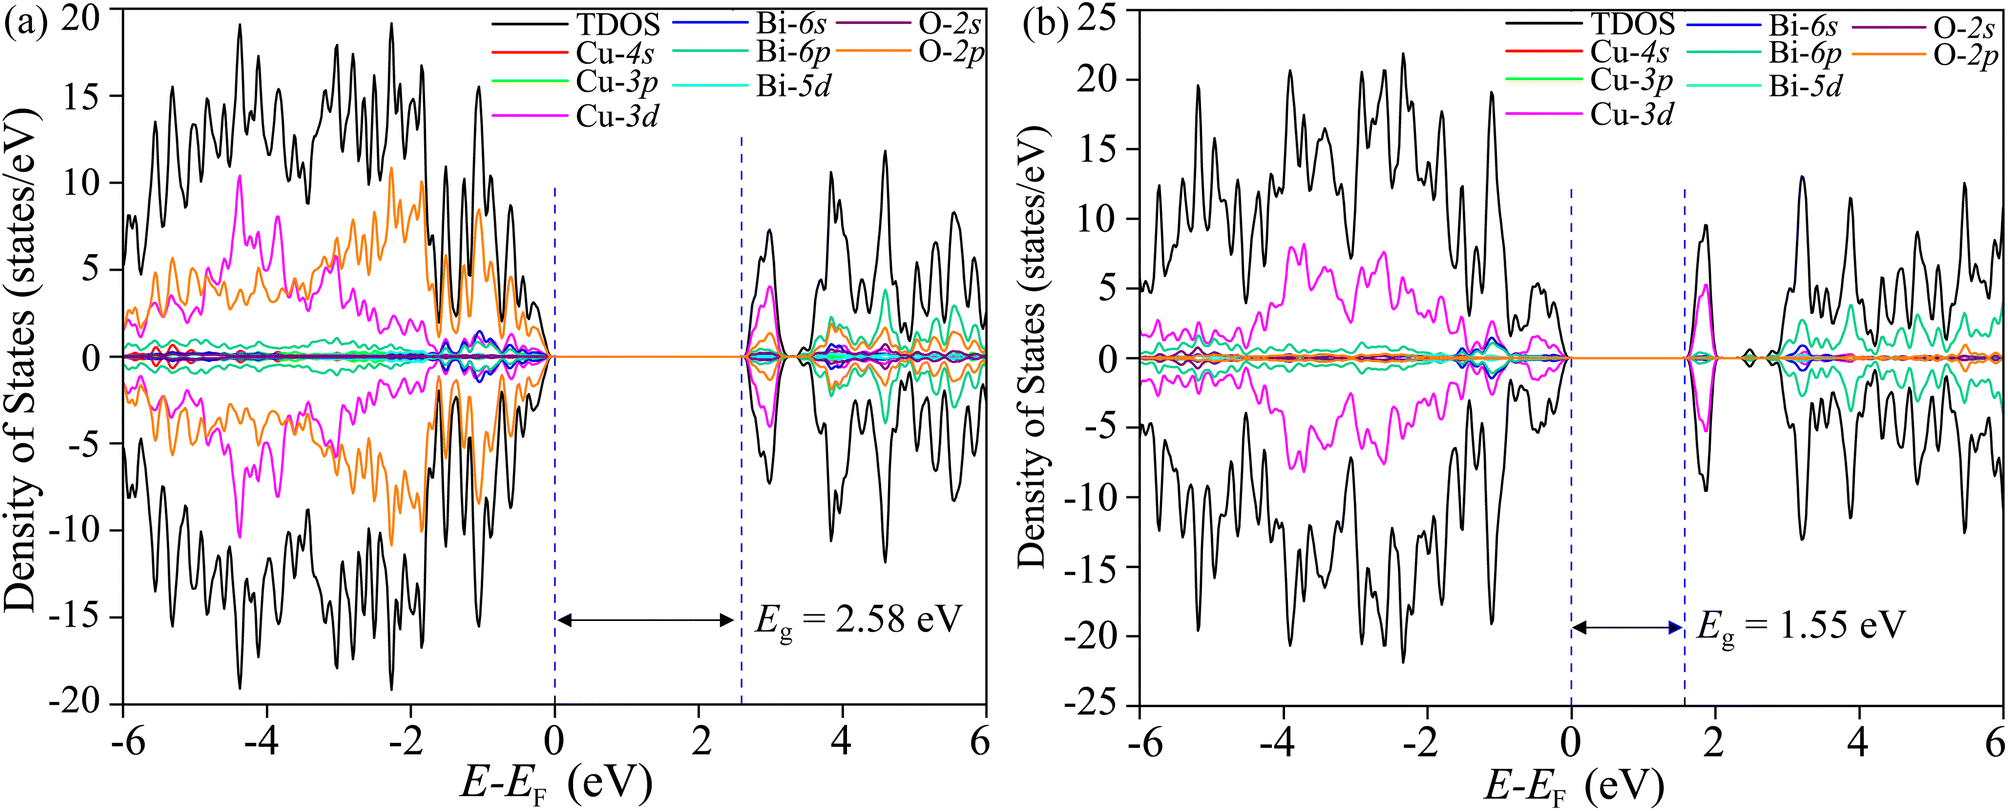
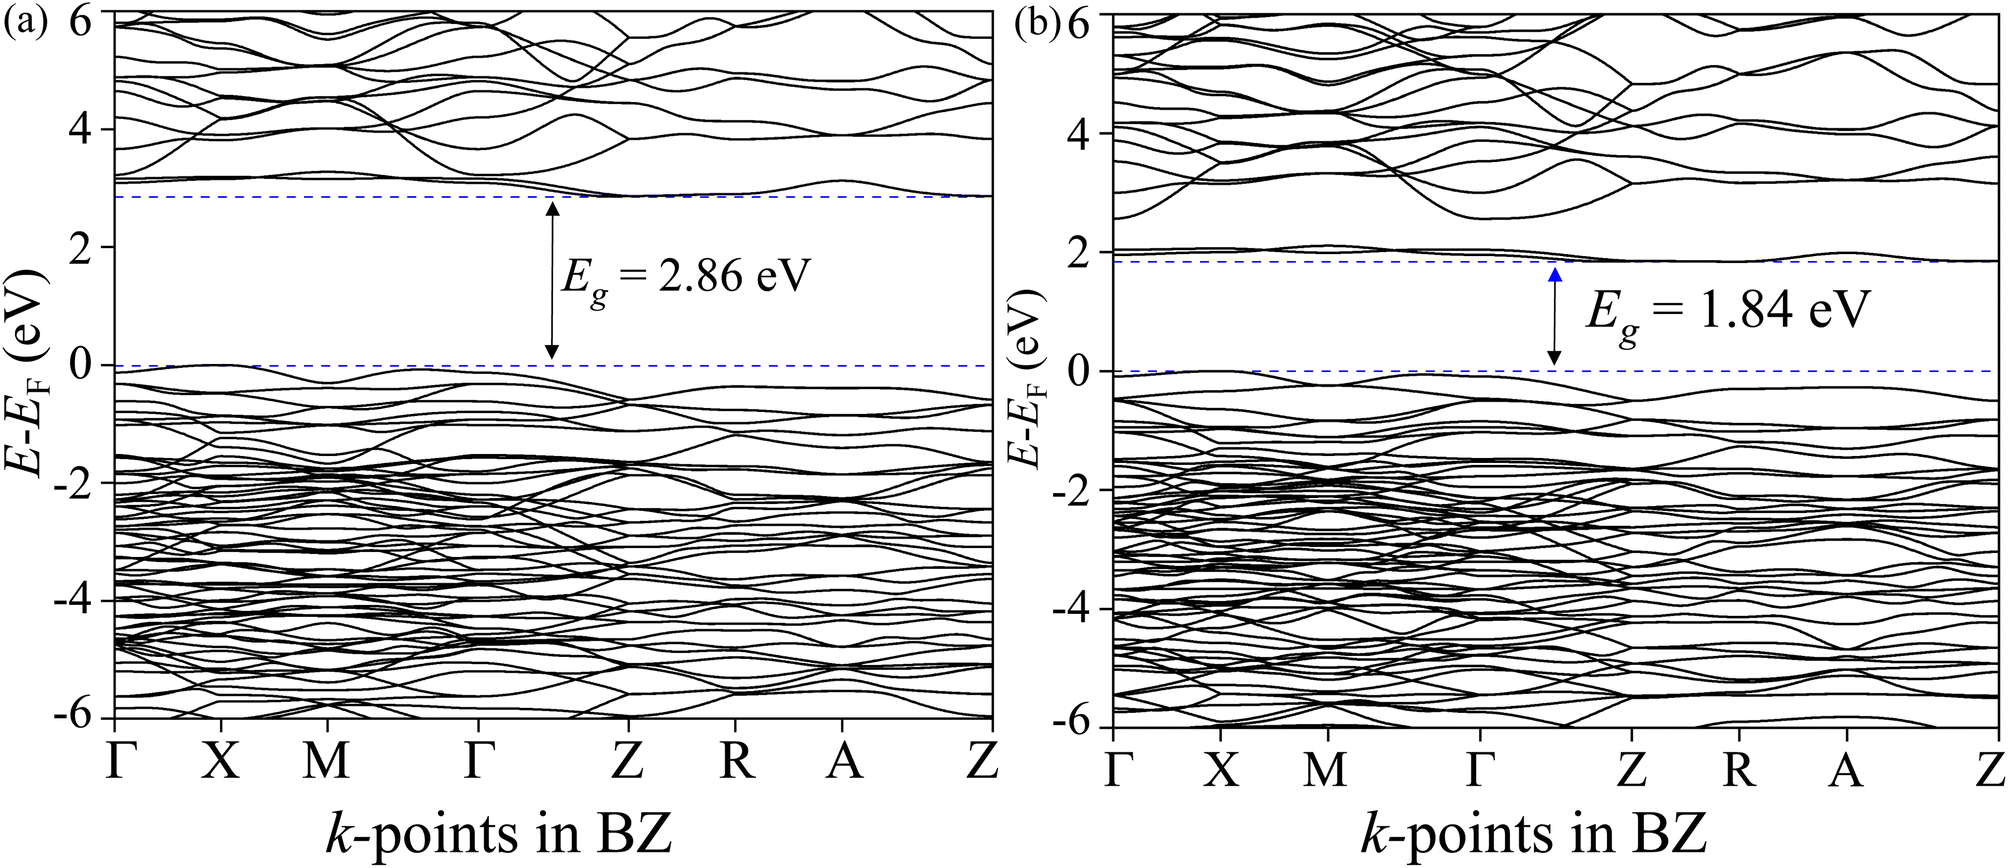
The total density of states (TDOS) and its projections onto relevant CBO orbitals are simulated using GGA-PBE functional as shown in Fig. 11(a). The Fermi energy EF is set as zero of energy. The GGA-PBE isolates the valence band maxima (VBM) and conduction band minima (CBm) by a 0.30 eV forbidden energy window. The ∼0.75 eV narrow bandwidth valence band (VB) stems from strong hybridization among Cu-3d and O-2p orbitals along with very small contributions arising from Bi-5d, Bi-6s and O-2s. The conduction band (CB) extends over a narrow energy range of ∼0.50 eV where Cu-3d and O-2p strongly interact together to provide a dominant contribution with a very weak presence of Bi-(6p, 5d) and O-2s orbitals. The energy gap between the VBM and CBm can be significantly increased to 1.6 eV by introducing Hubbard interaction correction term U = 7 eV to both (Cu-3d, Bi-5d) orbitals within the GGA-PBE+U formalism as can be seen from Fig. 11(b). The non-zero Hubbard U term changes the narrow bandwidth of the VB to the wide band nature. The states near VBM originate from mixing among dominant O-2p and weak Cu-3d, Bi-5d and Bi-6s orbitals. The GGA-PBE+U preserves the narrow-band nature of the CB along with its orbital hybridization to that of GGA-PBE functional. The GGA-PBE derived BS simulation revealed the indirect nature of the CBO band gap Eg = 0.39 eV with VBM located at X and CBm appearing at R points as shown in Fig. 12(a). The GGA-PBE underestimated the experimentally measured CBO indirect band gap Eg = 1.78 eV. The U = 7 eV boosts the diluted Coulomb interaction of both Cu-3d and Bi-5d orbitals and increases the indirect band gap Eg = 1.82 eV with VBM and CBm located at X and Z points as depicted in Fig. 12(b). The sophisticated HSE06 with Hartree–Fock exact-exchange mixing parameter αHF = 25% although preserves the overall nature of orbital mixing and bandwidths of VB as CB to that of GGA-PBE+U, it increases the forbidden gap between VBM and CBm to 2.58 eV as shown in Fig. 13(a). The forbidden energy gap can be tuned by changing the Hartree–Fock mixing parameter αHF.46,47 The energy gap is reduced to 1.55 eV by reducing the exact-exchange mixing αHF to 14% as displayed in Fig. 13(b). The simulated HSE06 BS with αHF = 25% in Fig. 14(a) revealed an indirect band gap of Eg = 2.86 eV which is an overestimation of the experimentally measured Eg = 1.76 eV. The electronic band gap Eg is reduced to 1.84 eV with αHF = 14% in Fig. 14(b) which is in excellent agreement with that of the experimental value of 1.80 eV. For different values of the mixing parameters αHF, the HSE06 keeps the VBM at X point. The CB dispersion from Z → R is very small resulting in band flattening and the CBm can be considered to be located at Z point.
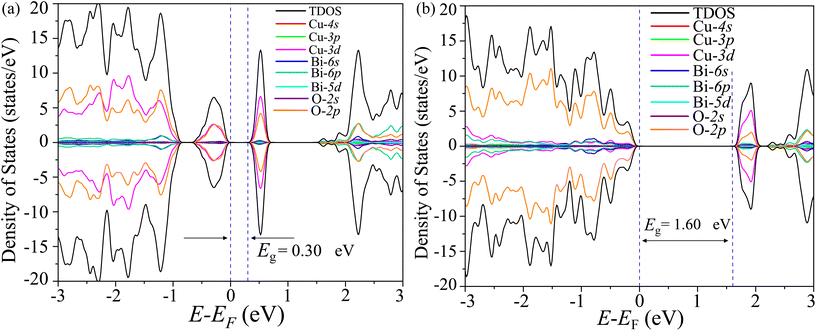 |
| | Fig. 11 TDOS and its projection onto different orbitals in Bi, Cu, and O of CBO for (a) GGA-PBE and (b) GGA-PBE+U functionals. | |
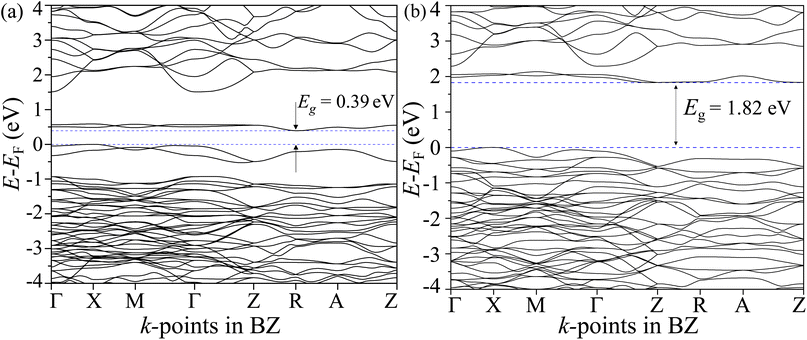 |
| | Fig. 12 Electronic BS along CBO BZ high symmetry k-points Γ, X, M, Z, R, and A for (a) GGA-PBE and (b) GGA-PBE+U functionals. | |
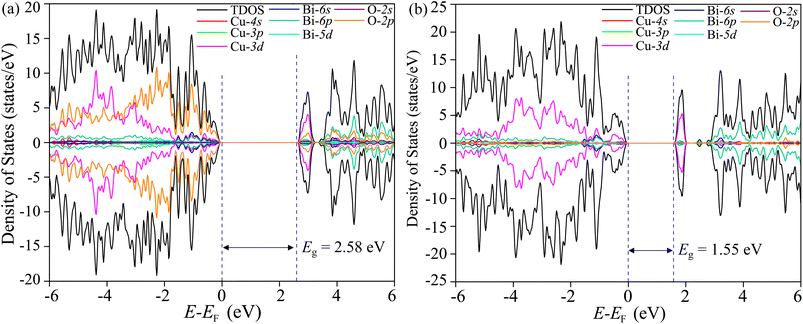 |
| | Fig. 13 TDOS and its projection onto different orbitals in Bi, Cu, and O of CBO for HSE06 functional with (a) αHF = 25% and (b) αHF = 14%. | |
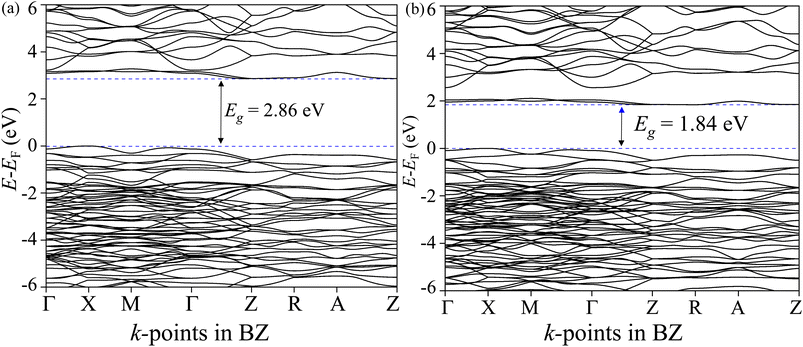 |
| | Fig. 14 Electronic BS along CBO BZ high symmetry k-points Γ, X, M, Z, R, and A for HSE06 functional with (a) αHF = 25% and (b) αHF = 14%. | |
3.11 Optical properties simulation
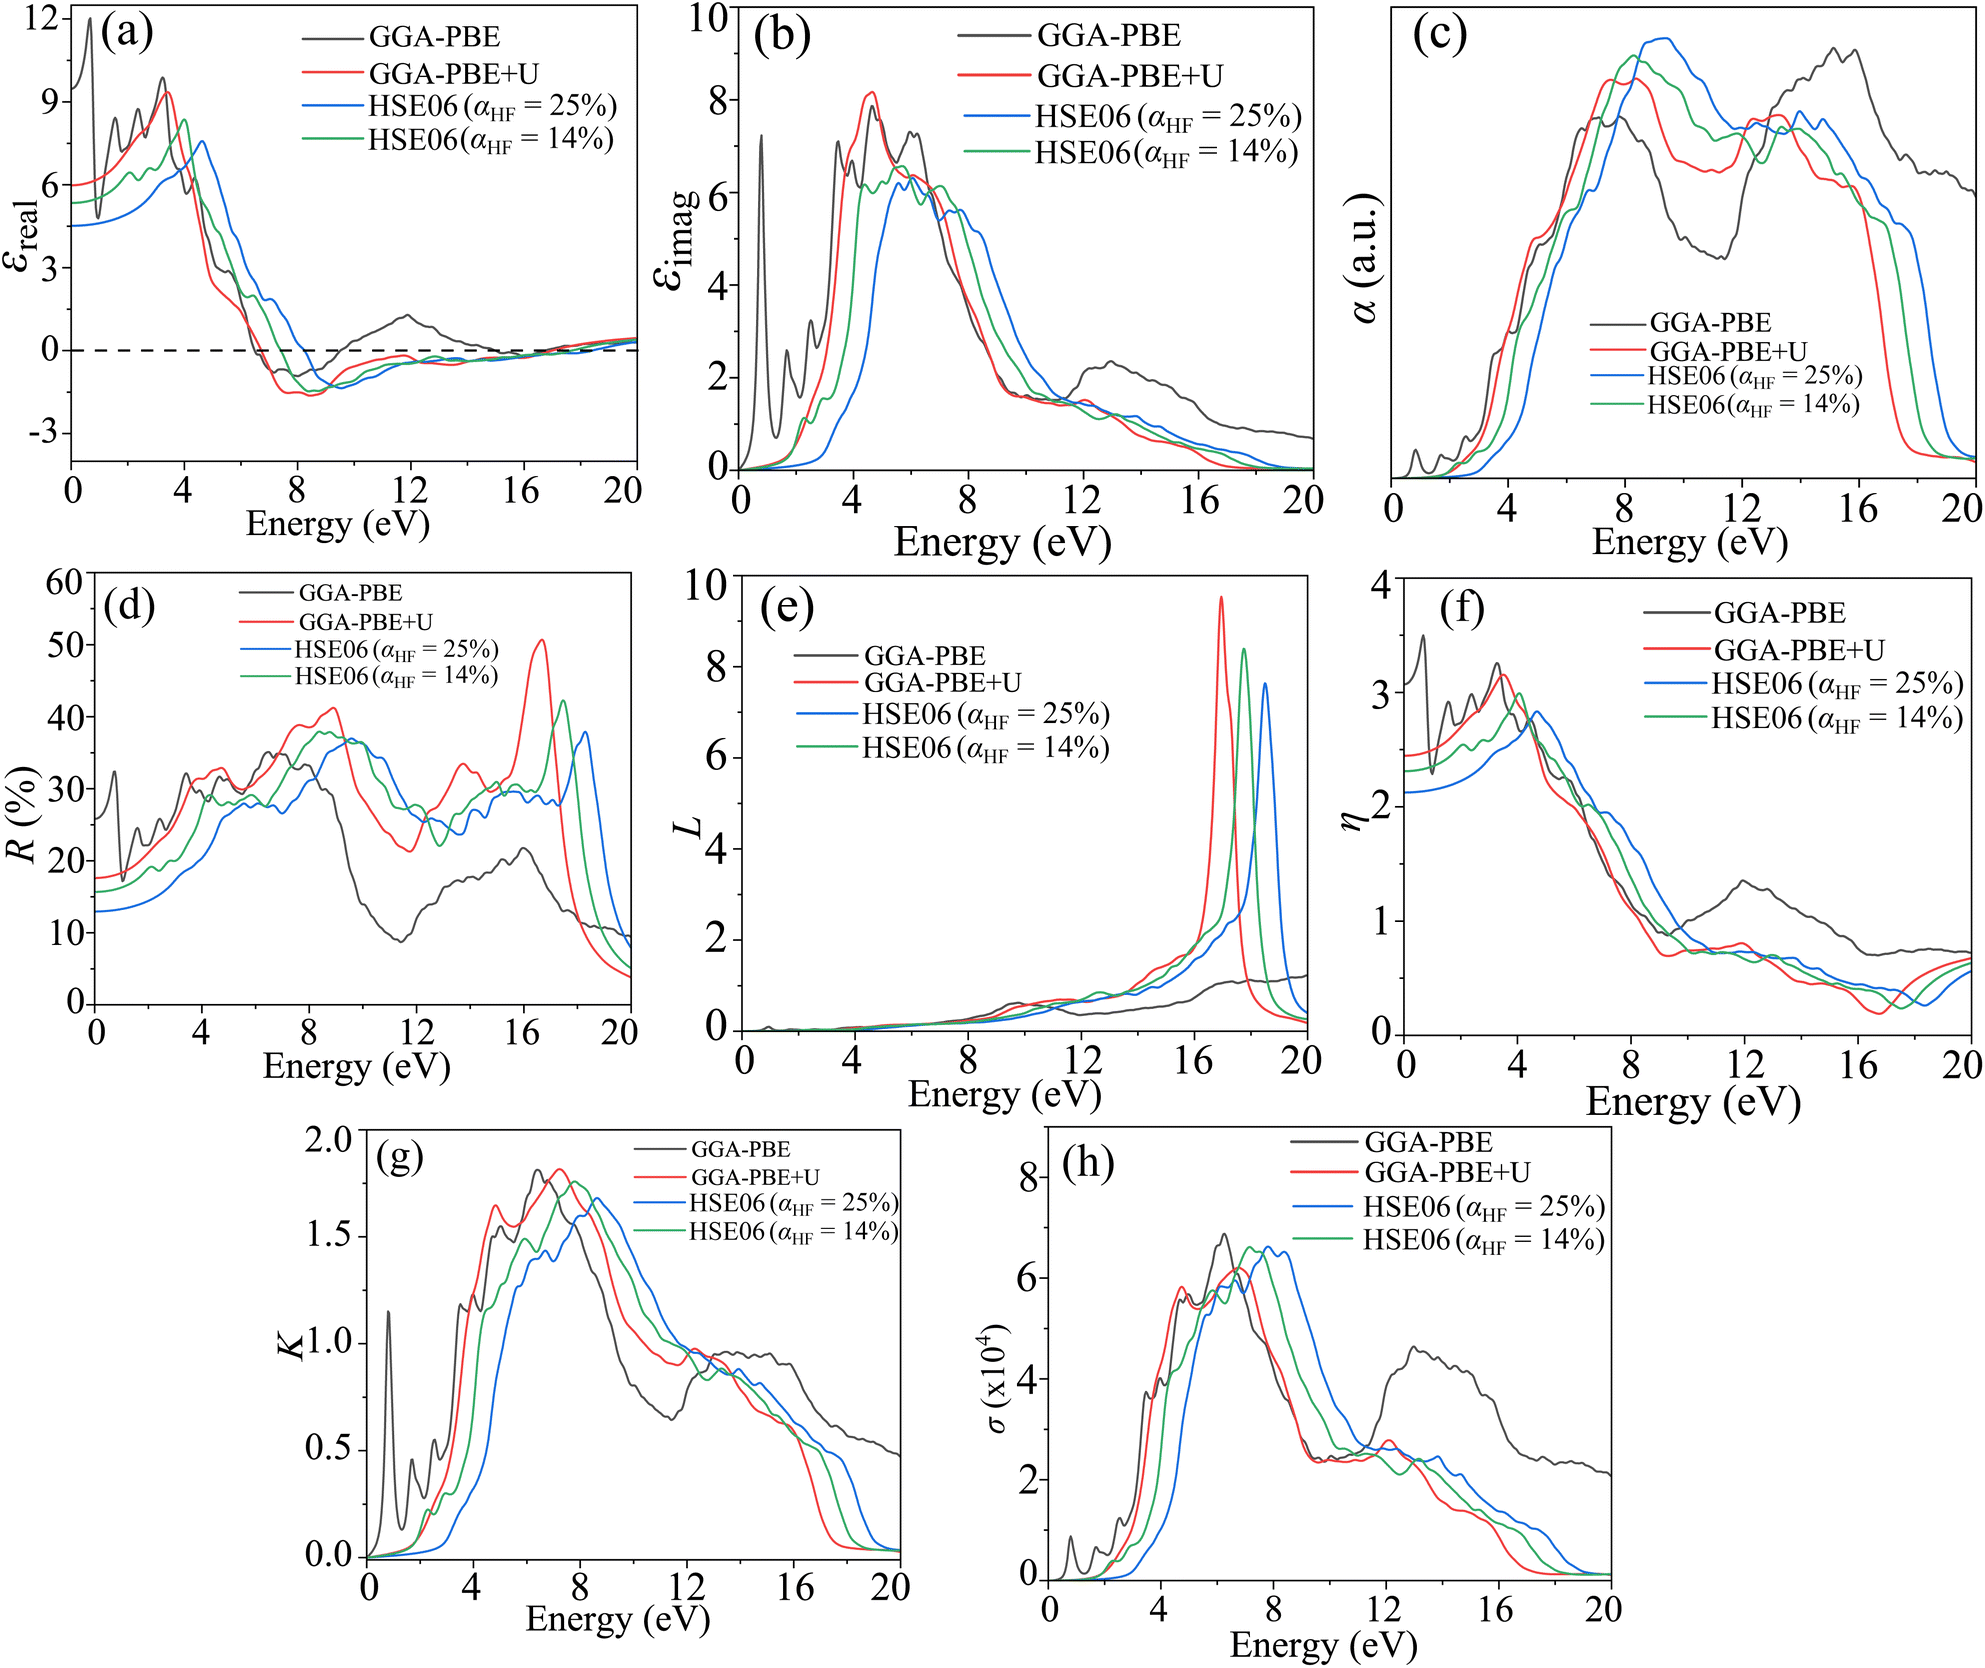
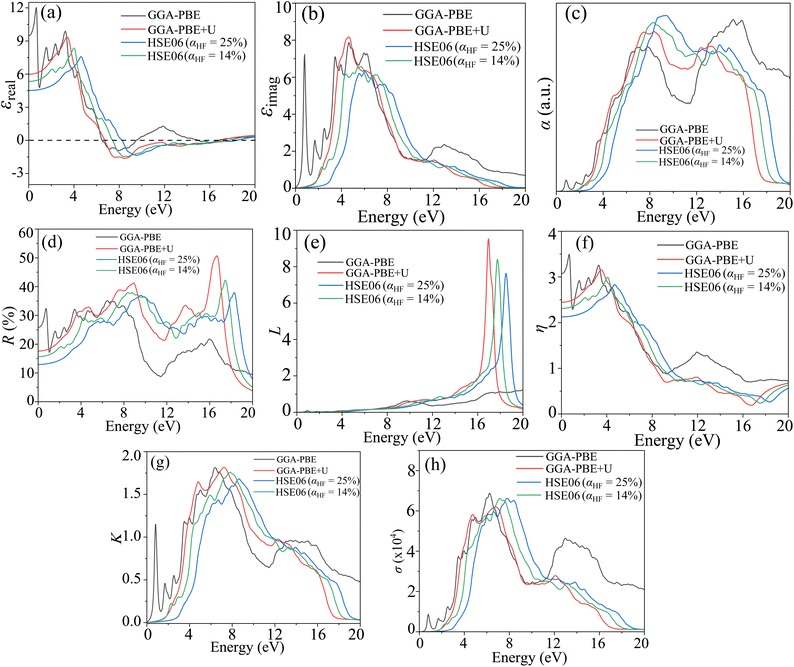
The optical response of the materials can be characterized by the complex dielectric constant ε(ω) = εreal(ω) + iεimag(ω) ( , ω = angular frequency of the optical excitation). The electronic BS calculated from GGA-PBE, GGA-PBE+U, and HSE06 were used to obtain the dipole transition matrix elements to estimate the εimag.46,53,54 The εreal is derived from εimag with Kramer–Kronig relation. Having both εreal and εimag in hand, one can further obtain absorption coefficient α, reflectivity R, energy loss function L, refractive index η, extinction coefficient K, and optical conductivity σ that define the optical behavior of the CBO in the linear regime as shown in Fig. 15. All the optical parameters mentioned here are averaged over the three orthogonal polarization directions Ex, Ey and Ez along spatial x, y, and z coordinates. In the ω → 0 low energy limit, the εreal overestimation (9.44) in the case of the GGA-PBE is reduced to 6.01 with GGA-PBE+U, see Fig. 15(a). The HSE06 provides more fine correction for the overestimated values and yields 4.56 (5.37) for αHF = 25% (αHF = 14%). The CBO electronic transitions started to appear at much lower energy (0.75 eV) as a peak in the εimag for GGA-PBE due to its band gap underestimation as can be seen in Fig. 15(b). The εimag peaks are shifted to higher energies of 4.61 eV, 5.66 eV (αHF = 14%), and 6 eV (αHF = 25%) for GGA-PBE+U and HSE06 functionals as they increase the CBO band gap. The threshold energies beyond which the absorption α rapidly increases match with the estimated band gaps of 0.39 eV, 1.82, 2.86 eV, and 1.84 eV for each of the functionals as depicted in Fig. 15(c). The peaks in α appear at the zero crossing energies of the εreal. In the low energy limit, both GGA-PBE+U and HSE06 functionals result in low reflectivity R below 20% Fig. 15(d) indicating optical transparency due to the free carrier effects in CBO. The R is peaked near 16.93 eV, 17.74 eV, and 18.47 eV for GGA-PBE+U and HSE06 functionals which coincide with the optical loss L peaks in Fig. 15(e). They arise from the induced optical dipole oscillation from the core electrons in CBO and follow a Lorentzian shape. In the static limit, the GGA-PBE overestimates the refractive index η to 3.06 in Fig. 15(f). The GGA-PBE+U brings it down to 2.45 and the HSE06 reduces it close to the experimentally observed value of ∼2. The extinction coefficient K in Fig. 15(g) rises steeply beyond the estimated band gaps of the corresponding functionals and its peak positions merge with the zero crossing energies of εreal. The optical conductivity displayed conductivity threshold energies and peaks positions similar to those of εimag as anticipated in Fig. 15(h) because of the functional relation σ = ωεimag.
 |
| | Fig. 15 Linear optical response of CBO in terms of (a) real part of dielectric constant εreal, (b) imaginary part of the dielectric constant εimag, (c) absorption coefficient α, (d) reflectivity R, (e) loss function L, (f) refractive index η, (g) extinction coefficient K and (h) conductivity σ as a function of photon energy E calculated from GGA-PBE, GGA-PBE+U, and HSE06 (αHF = 25% & 14%) functionals averaged over three different polarization Ex, Ey and Ez. | |
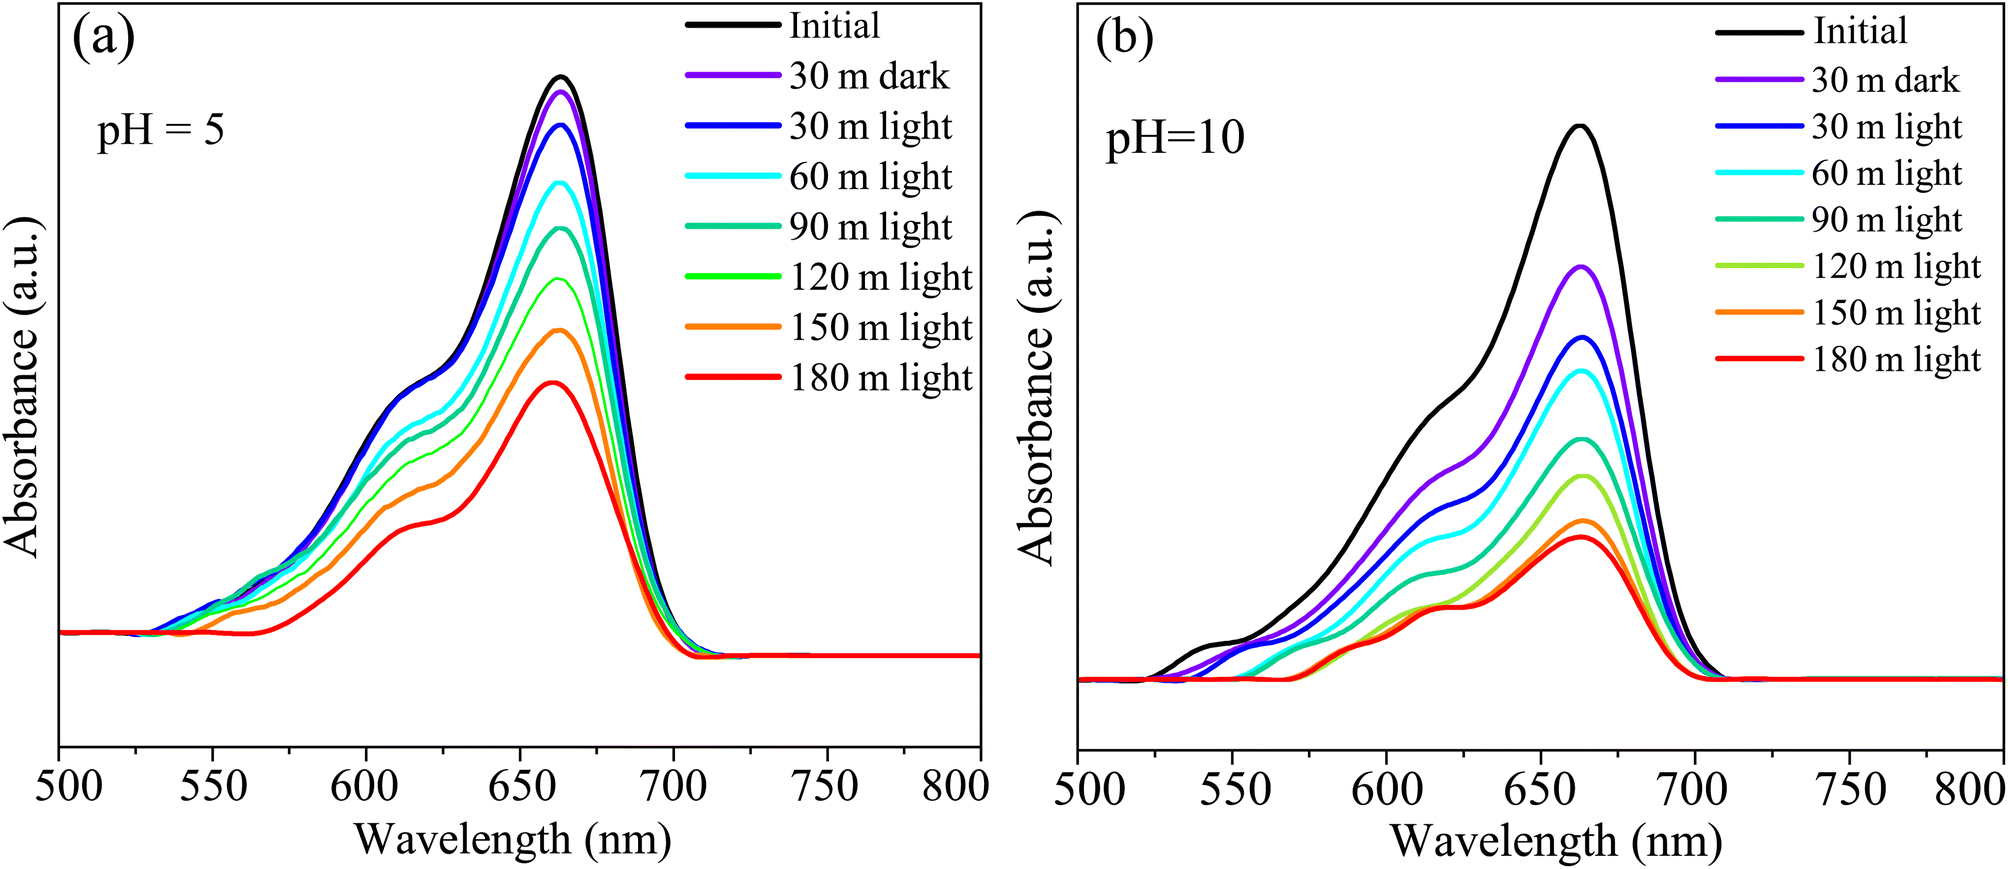
3.12 Photocatalytic measurements
The CBO has the potential as a photocatalytic dye degrading material.30,109,110 We performed photocatalytic measurements to estimate the HCBO's MB dye annihilation capabilities under simulated solar exposure. The MB solution absorption in the visible range of the electromagnetic spectrum is measured for two different pH values (5 and 10) to demonstrate the photocatalytic degradation as shown in Fig. 16(a) and (b). The characteristic MB dye absorption occurs near 663 nm as expected for both pH values.46 The intensity of the MB characteristic absorption peak is undergoing reduction over time demonstrating the destruction of the chromophoric structure of the dye. The HCBO photocatalytic degradation efficiency was derived from the linear rate equation to be 54.97% (69.86%) for a solution pH value of 5 (10) after 3 h of exposure (see Fig. S6 in ESI†). Based on the assumed linearity of the reaction kinematics, the estimated reaction rate k was found to be 0.00426 min−1 (0.00572 min−1) for the pH of 05 (10).
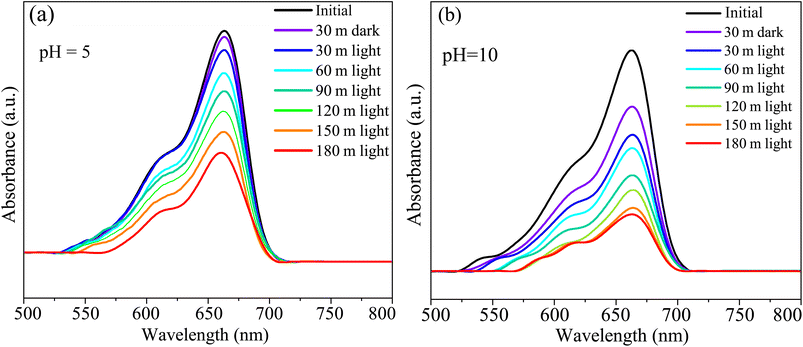 |
| | Fig. 16 The UV-vis absorption spectra during the photodegradation of MB dye of HCBO as a function of exposure time for (a) pH = 5 and (b) pH = 10. | |
4 Conclusion
We performed a detailed ab initio DFT-based simulations to probe the functional properties of as-synthesized CBO. The underlying tetragonal crystal symmetry of CBO was confirmed by powdered XRD measurements aided by the Rietveld refinement technique, and the crystallographic parameters are found to be consistent with GGA-PBE and GGA-PBE+U relaxed structures. The standard SEM, FESEM, and EDX measurements outlined the desired morphology and chemical purity of the as-synthesized CBO samples. The DFT simulated Raman tensor with GGA-PBE and GGA-PBE+U provided excellent agreement with experimentally observed Raman peaks. The FTIR absorption bands conformed with the DFT-simulated phonon DOS. The DFT simulated elastic stress tensor satisfied the Born criteria of structural stability. The absence of imaginary modes in the DFPT-derived phonon BS in the entire BZ of CBO ensured its dynamical stability. We tuned both the Hubbard U and the Hartree–Fock exact-exchange parameter αHF in GGA-PBE+U and HSE06 respectively to match the experimentally measured electronic band gap of CBO from UV-vis diffuse reflectance measurements. We rigorously simulated the linear optical properties of CBO using GGA-PBE, GGA-PBE+U, and HSE06 functionals. We estimated the photocatalytic properties of CBO in degrading the MB dye. This ab initio DFT simulation-guided experimental approach to CBO may have provided a solid theoretical analysis of its functional behavior.
Data availability
The data that support the findings of this study are available from the corresponding author upon reasonable request.
Author contributions
I. A. planned and supervised the entire project, and wrote the original article. Q. S. H. and M. Z. H. prepared the samples with the help of T. H. S. S. N., Q. S. H., S. A., and I. A. performed the DFT simulations. M. N. I. K. helped with XRD, FTIR, and Raman measurements. M. S. B. provided the SEM and EDX measurements. M. H. supervised the FESEM measurements. I. M. S. provided sample synthesis support and DLS measurement. K. S. H. helped with optical measurements. Q. S. H. and I. A. performed the data curation.
Conflicts of interest
The authors declare no competing interests.
Acknowledgements
I. A. gratefully acknowledges support from Special Allocation for Science and Technology 2022–2023 (Code: SRG-222395), Ministry of Science and Technology, Government of the People's Republic of Bangladesh. All simulations were performed in the high-performance computing facility provided by Bangladesh Research and Education Network (BdREN). I. A. is very thankful for this high-performance computational resource support from BdREN. I. A. also thankfully acknowledges Md. Mominul Islam, Department of Chemistry, University of Dhaka for the fruitful discussion regarding the photo-catalytic measurements. I. A. acknowledges support from Md. Shafiul Alam, Dept. of Electrical and Electronic Engineering, University of Dhaka. K. S. H. acknowledges the support from International Science Program (ISP), Uppsala University, Sweden.
Notes and references
- P. Chen, H. Liu, W. Cui, S. C. Lee, L. Wang and F. Dong, EcoMat, 2020, 2, e12047 CrossRef CAS.
- W. Fang and W. Shangguan, Int. J. Hydrogen Energy, 2019, 44, 895 CrossRef CAS.
- R. He, D. Xu, B. Cheng, J. Yu and W. Ho, Nanoscale Horiz., 2018, 3, 464 RSC.
- X. Liu, J. Xiao, S. Ma, C. Shi, L. Pan and J.-J. Zou, ChemNanoMat, 2021, 7, 684 CrossRef CAS.
- S. Wang, L. Wang and W. Huang, J. Mater. Chem. A, 2020, 8, 24307 RSC.
- X. Wu, C. Y. Toe, C. Su, Y. H. Ng, R. Amal and J. Scott, J. Mater. Chem. A, 2020, 8, 15302 RSC.
- R. Yu, A. Fan, M. Yuan, T. Li and J. Wang, Phys. Chem. Chem. Phys., 2016, 18, 23702 RSC.
- Q. Sun, J. Wang, W.-J. Yin and Y. Yan, Adv. Mater., 2018, 30, 1705901 CrossRef PubMed.
- D. Tiwari, D. Alibhai, D. Cherns and D. J. Fermin, Chem. Mater., 2020, 32, 1235 CrossRef CAS.
- A. M. Ganose, C. N. Savory and D. O. Scanlon, Chem. Commun., 2017, 53, 20 RSC.
- N. Lyskov, Y. G. Metlin, V. Belousov and Y. D. Tretyakov, Solid State Ionics, 2004, 173, 135 CrossRef CAS.
- K. Yoshii, T. Fukuda, H. Akahama, J. Kano, T. Kambe and N. Ikeda, Phys. C, 2011, 471, 766 CrossRef CAS.
- A. Abdulkarem, J. Li, A. Aref, L. Ren, E. Elssfah, H. Wang, Y. Ge and Y. Yu, Mater. Res. Bull., 2011, 46, 1443 CrossRef CAS.
- O. Janson, R. Kuzian, S.-L. Drechsler and H. Rosner, Phys. Rev. B: Condens. Matter Mater. Phys., 2007, 76, 115119 CrossRef.
- S. P. Berglund, F. F. Abdi, P. Bogdanoff, A. Chemseddine, D. Friedrich and R. van de Krol, Chem. Mater., 2016, 28, 4231 CrossRef CAS.
- D. Kang, J. C. Hill, Y. Park and K.-S. Choi, Chem. Mater., 2016, 28, 4331 CrossRef CAS.
- N. T. Hahn, V. C. Holmberg, B. A. Korgel and C. B. Mullins, J. Phys. Chem. C, 2012, 116, 6459 CrossRef CAS.
- L. Wei, C. Shifu, Z. Sujuan, Z. Wei, Z. Huaye and Y. Xiaoling, J. Nanopart. Res., 2010, 12, 1355 CrossRef.
- J. K. Cooper, Z. Zhang, S. Roychoudhury, C.-M. Jiang, S. Gul, Y.-S. Liu, R. Dhall, A. Ceballos, J. Yano and D. Prendergast, et al., Chem. Mater., 2021, 33, 934 CrossRef CAS.
- M. Lamers, M. Sahre, M. J. Müller, D. Abou-Ras, R. van de Krol and F. F. Abdi, APL Mater., 2020, 8, 061101 CrossRef CAS.
- I. Sullivan, B. Zoellner and P. A. Maggard, Chem. Mater., 2016, 28, 5999 CrossRef CAS.
- Z. Zhang, S. A. Lindley, D. Guevarra, K. Kan, A. Shinde, J. M. Gregoire, W. Han, E. Xie, J. A. Haber and J. K. Cooper, Adv. Funct. Mater., 2020, 30, 2000948 CrossRef CAS.
- R. Arpe and H. Müller-Buschbaum, Z. Anorg. Allg. Chem., 1976, 426, 1 CrossRef CAS.
- E. Abdelkader, L. Nadjia and B. Ahmed, Appl. Surf. Sci., 2012, 258, 5010 CrossRef CAS.
- A. Elaziouti, N. Laouedj and A. Bekka, Environ. Sci. Pollut. Res., 2016, 23, 15862 CrossRef CAS PubMed.
- F. Zhang and S. Saxena, Appl. Phys. Lett., 2006, 88, 141926 CrossRef.
- T. Arai, M. Yanagida, Y. Konishi, Y. Iwasaki, H. Sugihara and K. Sayama, J. Phys. Chem. C, 2007, 111, 7574 CrossRef CAS.
- J. Zhang and Y. Jiang, J. Mater. Sci.: Mater. Electron., 2015, 26, 4308 CrossRef CAS.
- J. Zhang, Y. Jiang, W. Gao and H. Hao, J. Mater. Sci.: Mater. Electron., 2015, 26, 1866 CrossRef CAS.
- A. Djaballah, R. Bagtache, S. Tartaya and M. Trari, React. Kinet., Mech. Catal., 2021, 134, 1055 CrossRef CAS.
- R. Patil, S. Kelkar, R. Naphade and S. Ogale, J. Mater. Chem. A, 2014, 2, 3661 RSC.
- Y. Xie, Y. Zhang, G. Yang, C. Liu and J. Wang, Mater. Lett., 2013, 107, 291 CrossRef CAS.
- Y. Deng, Y. Chen, B. Chen and J. Ma, J. Alloys Compd., 2013, 559, 116 CrossRef CAS.
- G. Sharma, Z. Zhao, P. Sarker, B. A. Nail, J. Wang, M. N. Huda and F. E. Osterloh, J. Mater. Chem. A, 2016, 4, 2936 RSC.
- W.-D. Oh, S.-K. Lua, Z. Dong and T.-T. Lim, Nanoscale, 2016, 8, 2046 RSC.
- S. Yuvaraj, K. Karthikeyan, D. Kalpana, Y. S. Lee and R. K. Selvan, J. Colloid Interface Sci., 2016, 469, 47 CrossRef CAS PubMed.
- V. Dutta, S. Sonu, P. Raizada, V. K. Thakur, T. Ahamad, S. Thakur, P. Kumar Verma, H. H. P. Quang, V.-H. Nguyen and P. Singh, Environ. Sci. Pollut. Res., 2022, 1 Search PubMed.
- H. S. Park, C.-Y. Lee and E. Reisner, Phys. Chem. Chem. Phys., 2014, 16, 22462 RSC.
- Y. Nakabayashi, M. Nishikawa and Y. Nosaka, Electrochim. Acta, 2014, 125, 191 CrossRef CAS.
- F. Wang, W. Septina, A. Chemseddine, F. F. Abdi, D. Friedrich, P. Bogdanoff, R. van de Krol, S. D. Tilley and S. P. Berglund, J. Am. Chem. Soc., 2017, 139, 15094 CrossRef CAS PubMed.
- Z. Zhang, S. A. Lindley, R. Dhall, K. Bustillo, W. Han, E. Xie and J. K. Cooper, ACS Appl. Energy Mater., 2019, 2, 4111 CrossRef CAS.
- F. E. Oropeza, N. Y. Dzade, A. Pons-Martí, Z. Yang, K. H. Zhang, N. H. De Leeuw, E. J. Hensen and J. P. Hofmann, J. Phys. Chem. C, 2020, 124, 22416 CrossRef CAS PubMed.
- S. Hazra, S. Mandal and A. Ghosh, J. Chem. Phys., 1996, 104, 10041 CrossRef CAS.
- R. O. Jones, Rev. Mod. Phys., 2015, 87, 897 CrossRef.
- S. Matsushima, K. Yamada, H. Nakamura, M. Arai and K. Kobayashi, J. Ceram. Soc. Jpn., 2008, 116, 589 CrossRef CAS.
- M. Z. Hossain, S. S. Nishat, S. Ahmed, Q. S. Hossain, M. Khan, T. Hasan, M. S. Bashar, A. S. H. Faysal, I. M. Syed, K. S. Hossain, S. Hussain, M. M. Khan and I. Ahmed, RSC Adv., 2023, 13, 5576 RSC.
- J. K. Cooper, S. Gul, F. M. Toma, L. Chen, P.-A. Glans, J. Guo, J. W. Ager, J. Yano and I. D. Sharp, Chem. Mater., 2014, 26, 5365 CrossRef CAS.
- W. Kohn and L. J. Sham, Phys. Rev., 1965, 140, A1133 CrossRef.
- G. Kresse and J. Furthmüller, Phys. Rev. B: Condens. Matter Mater. Phys., 1996, 54, 11169 CrossRef CAS PubMed.
- G. Kresse and D. Joubert, Phys. Rev. B: Condens. Matter Mater. Phys., 1999, 59, 1758 CrossRef CAS.
- A. Jain, Y. Shin and K. A. Persson, Nat. Rev. Mater., 2016, 1, 1 Search PubMed.
- J. P. Perdew, K. Burke and M. Ernzerhof, Phys. Rev. Lett., 1996, 77, 3865 CrossRef CAS PubMed.
- J. Fardush Tanha, S. Farhad, U. Honey, N. Tanvir, T. Hasan, S. Shahriyar Nishat, A. Kabir, S. Ahmed, M. Hakim and M. Khan, et al., J. Appl. Phys., 2021, 130, 235107 CrossRef CAS.
- S. Ahmed, S. S. Nishat, A. Kabir, A. S. H. Faysal, T. Hasan, S. Chakraborty and I. Ahmed, Phys. B, 2021, 615, 413061 CrossRef CAS.
- S. Ahmed, T. Hasan, A. S. H. Faysal, S. S. Nishat, M. Khan, A. Kabir and I. Ahmed, Comput. Mater. Sci., 2022, 214, 111743 CrossRef CAS.
- S. Dudarev, G. Botton, S. Savrasov, C. Humphreys and A. Sutton, Phys. Rev. B: Condens. Matter Mater. Phys., 1998, 57, 1505 CrossRef CAS.
- S. Lardhi, L. Cavallo and M. Harb, J. Phys. Chem. C, 2018, 122, 18204 CrossRef CAS.
- H. Ullah, A. A. Tahir and T. K. Mallick, Appl. Catal., B, 2018, 224, 895 CrossRef CAS.
- T. Le Bahers, M. Rerat and P. Sautet, J. Phys. Chem. C, 2014, 118, 5997 CrossRef.
- C. Franchini, J. Phys.: Condens. Matter, 2014, 26, 253202 CrossRef PubMed.
- B. G. Janesko, T. M. Henderson and G. E. Scuseria, Phys. Chem. Chem. Phys., 2009, 11, 443 RSC.
- A. Stroppa and G. Kresse, Phys. Rev. B: Condens. Matter Mater. Phys., 2009, 79, 201201 CrossRef.
- M. Marsman, J. Paier, A. Stroppa and G. Kresse, J. Phys.: Condens. Matter, 2008, 20, 064201 CrossRef CAS PubMed.
- A. Stroppa and S. Picozzi, Phys. Chem. Chem. Phys., 2010, 12, 5405 RSC.
- J. Heyd, G. E. Scuseria and M. Ernzerhof, J. Chem. Phys., 2003, 118, 8207 CrossRef CAS.
- A. V. Krukau, O. A. Vydrov, A. F. Izmaylov and G. E. Scuseria, J. Chem. Phys., 2006, 125, 224106 CrossRef PubMed.
- J. Paier, M. Marsman, K. Hummer, G. Kresse, I. C. Gerber and J. G. Ángyán, J. Chem. Phys., 2006, 124, 154709 CrossRef CAS PubMed.
- J. Paier, M. Marsman and G. Kresse, Phys. Rev. B: Condens. Matter Mater. Phys., 2008, 78, 121201 CrossRef.
- J. P. Perdew, M. Ernzerhof and K. Burke, J. Chem. Phys., 1996, 105, 9982 CrossRef CAS.
- A. D. Becke, J. Chem. Phys., 1993, 98, 1372 CrossRef CAS.
- A. A. Mostofi, J. R. Yates, Y.-S. Lee, I. Souza, D. Vanderbilt and N. Marzari, Comput. Phys. Commun., 2008, 178, 685 CrossRef CAS.
- Y. Hou, S. Ardo and R. Wu, Phys. Rev. Mater., 2021, 5, 065801 CrossRef CAS.
- S. Baroni, S. De Gironcoli, A. Dal Corso and P. Giannozzi, Rev. Mod. Phys., 2001, 73, 515 CrossRef CAS.
- F. Giustino, Rev. Mod. Phys., 2017, 89, 015003 CrossRef.
- S. Prosandeev, U. Waghmare, I. Levin and J. Maslar, Phys. Rev. B: Condens. Matter Mater. Phys., 2005, 71, 214307 CrossRef.
- P. Giannozzi, S. Baroni, N. Bonini, M. Calandra, R. Car, C. Cavazzoni, D. Ceresoli, G. L. Chiarotti, M. Cococcioni and I. Dabo, et al., J. Phys.: Condens. Matter, 2009, 21, 395502 CrossRef.
- P. Giannozzi, O. Andreussi, T. Brumme, O. Bunau, M. B. Nardelli, M. Calandra, R. Car, C. Cavazzoni, D. Ceresoli and M. Cococcioni, et al., J. Phys.: Condens. Matter, 2017, 29, 465901 CrossRef CAS.
- P. Giannozzi, O. Baseggio, P. Bonfà, D. Brunato, R. Car, I. Carnimeo, C. Cavazzoni, S. De Gironcoli, P. Delugas and F. Ferrari Ruffino, et al., J. Chem. Phys., 2020, 152, 154105 CrossRef CAS PubMed.
- D. M. Ceperley and B. J. Alder, Phys. Rev. Lett., 1980, 45, 566 CrossRef CAS.
- G. B. Bachelet, D. R. Hamann and M. Schlüter, Phys. Rev. B: Condens. Matter Mater. Phys., 1982, 26, 4199 CrossRef CAS.
- M. Bettega, L. Ferreira and M. Lima, Phys. Rev. A, 1993, 47, 1111 CrossRef CAS PubMed.
- G. Kresse and J. Hafner, J. Phys.: Condens. Matter, 1994, 6, 8245 CrossRef CAS.
- E. Ong, G. Kwei, R. Robinson, B. Ramakrishna and R. Von Dreele, Phys. Rev. B: Condens. Matter Mater. Phys., 1990, 42, 4255 CrossRef CAS PubMed.
- R. Troc, J. Janicki, I. Filatow, P. Fischer and A. Murasik, J. Phys.: Condens. Matter, 1990, 2, 6989 CrossRef CAS.
- B. Bradlyn, J. Cano, Z. Wang, M. Vergniory, C. Felser, R. J. Cava and B. A. Bernevig, Science, 2016, 353, aaf5037 CrossRef.
- D. Di Sante, A. Hausoel, P. Barone, J. M. Tomczak, G. Sangiovanni and R. Thomale, Phys. Rev. B, 2017, 96, 121106 CrossRef.
- J. P. Perdew and M. Levy, Phys. Rev. Lett., 1983, 51, 1884 CrossRef CAS.
- L. J. Sham and M. Schlüter, Phys. Rev. Lett., 1983, 51, 1888 CrossRef.
- H. Xiao, J. Tahir-Kheli and W. A. Goddard III, J. Phys. Chem. Lett., 2011, 2, 212 CrossRef CAS.
- M. Kaszuba, D. McKnight, M. T. Connah, F. K. McNeil-Watson and U. Nobbmann, J. Nanopart. Res., 2008, 10, 823 CrossRef CAS.
- J. Stetefeld, S. A. McKenna and T. R. Patel, Biophys. Rev., 2016, 8, 409 CrossRef CAS PubMed.
- Z. Popović, G. Kliche, M. Cardona and R. Liu, Phys. Rev. B: Condens. Matter Mater. Phys., 1990, 41, 3824 CrossRef PubMed.
- Z. Popovic, G. Kliche, M. Konstantinovic and A. Revcolevschi, J. Phys.: Condens. Matter, 1992, 4, 10085 CrossRef CAS.
- M. Konstantinovic and Z. Popovic, J. Phys.: Condens. Matter, 1994, 6, 10357 CrossRef CAS.
- S. Labib, J. Saudi Chem. Soc., 2017, 21, 664 CrossRef CAS.
- X. Wu, D. Vanderbilt and D. Hamann, Phys. Rev. B: Condens. Matter Mater. Phys., 2005, 72, 035105 CrossRef.
- S. Shang, Y. Wang and Z.-K. Liu, Appl. Phys. Lett., 2007, 90, 101909 CrossRef.
- F. Mouhat and F.-X. Coudert, Phys. Rev. B: Condens. Matter Mater. Phys., 2014, 90, 224104 CrossRef.
- R. Hill, Proc. Phys. Soc. A, 1952, 65, 349 CrossRef.
- H. Dong, C. Chen, S. Wang, W. Duan and J. Li, Appl. Phys. Lett., 2013, 102, 182905 CrossRef.
- M. Yaakob, M. Taib, M. Deni, A. Chandra, L. Lu and M. Yahya, Ceram. Int., 2013, 39, S283 CrossRef CAS.
- B. Himmetoglu, A. Floris, S. De Gironcoli and M. Cococcioni, Int. J. Quantum Chem., 2014, 114, 14 CrossRef CAS.
- L. Xie and J. Zhu, J. Am. Ceram. Soc., 2012, 95, 3597 CrossRef CAS.
- P. Ghosez, J.-P. Michenaud and X. Gonze, Phys. Rev. B: Condens. Matter Mater. Phys., 1998, 58, 6224 CrossRef CAS.
- P. Ghosez, X. Gonze, P. Lambin and J.-P. Michenaud, Phys. Rev. B: Condens. Matter Mater. Phys., 1995, 51, 6765 CrossRef CAS PubMed.
- S.-G. Ma, T. Gao, S.-C. Li, X.-J. Ma, Y.-H. Shen and T.-C. Lu, Fusion Eng. Des., 2016, 113, 324 CrossRef CAS.
- W. Zhong, R. King-Smith and D. Vanderbilt, Phys. Rev. Lett., 1994, 72, 3618 CrossRef CAS PubMed.
- R. Pisarev, V. Pavlov, A. Kalashnikova and A. Moskvin, Phys. Rev. B: Condens. Matter Mater. Phys., 2010, 82, 224502 CrossRef.
- J. Hou, H. Yang, B. He, J. Ma, Y. Lu and Q. Wang, Fuel, 2022, 310, 122364 CrossRef CAS.
- J. Hou, Y. Xie, Y. Sun, Y. Kuang, Z. Jiao and Q. Wang, Ceram. Int., 2022, 48, 20648 CrossRef CAS.
|
| This journal is © The Royal Society of Chemistry 2023 |
Click here to see how this site uses Cookies. View our privacy policy here. 
 Open Access Article
 This Open Access Article is licensed under a Creative Commons Attribution-Non Commercial 3.0 Unported Licence
 a,
Shahran Ahmed
a,
Shahran Ahmed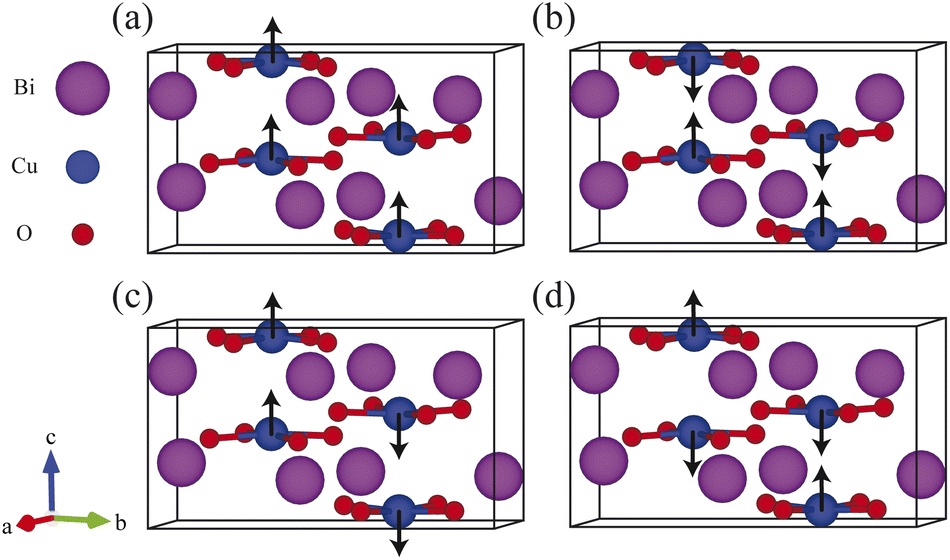

 , ω = angular frequency of the optical excitation). The electronic BS calculated from GGA-PBE, GGA-PBE+U, and HSE06 were used to obtain the dipole transition matrix elements to estimate the εimag.46,53,54 The εreal is derived from εimag with Kramer–Kronig relation. Having both εreal and εimag in hand, one can further obtain absorption coefficient α, reflectivity R, energy loss function L, refractive index η, extinction coefficient K, and optical conductivity σ that define the optical behavior of the CBO in the linear regime as shown in Fig. 15. All the optical parameters mentioned here are averaged over the three orthogonal polarization directions Ex, Ey and Ez along spatial x, y, and z coordinates. In the ω → 0 low energy limit, the εreal overestimation (9.44) in the case of the GGA-PBE is reduced to 6.01 with GGA-PBE+U, see Fig. 15(a). The HSE06 provides more fine correction for the overestimated values and yields 4.56 (5.37) for αHF = 25% (αHF = 14%). The CBO electronic transitions started to appear at much lower energy (0.75 eV) as a peak in the εimag for GGA-PBE due to its band gap underestimation as can be seen in Fig. 15(b). The εimag peaks are shifted to higher energies of 4.61 eV, 5.66 eV (αHF = 14%), and 6 eV (αHF = 25%) for GGA-PBE+U and HSE06 functionals as they increase the CBO band gap. The threshold energies beyond which the absorption α rapidly increases match with the estimated band gaps of 0.39 eV, 1.82, 2.86 eV, and 1.84 eV for each of the functionals as depicted in Fig. 15(c). The peaks in α appear at the zero crossing energies of the εreal. In the low energy limit, both GGA-PBE+U and HSE06 functionals result in low reflectivity R below 20% Fig. 15(d) indicating optical transparency due to the free carrier effects in CBO. The R is peaked near 16.93 eV, 17.74 eV, and 18.47 eV for GGA-PBE+U and HSE06 functionals which coincide with the optical loss L peaks in Fig. 15(e). They arise from the induced optical dipole oscillation from the core electrons in CBO and follow a Lorentzian shape. In the static limit, the GGA-PBE overestimates the refractive index η to 3.06 in Fig. 15(f). The GGA-PBE+U brings it down to 2.45 and the HSE06 reduces it close to the experimentally observed value of ∼2. The extinction coefficient K in Fig. 15(g) rises steeply beyond the estimated band gaps of the corresponding functionals and its peak positions merge with the zero crossing energies of εreal. The optical conductivity displayed conductivity threshold energies and peaks positions similar to those of εimag as anticipated in Fig. 15(h) because of the functional relation σ = ωεimag.