DOI:
10.1039/D2RA07910K
(Paper)
RSC Adv., 2023,
13, 5576-5589
Combined experimental and DFT approach to BiNbO4 polymorphs†
Received
11th December 2022
, Accepted 7th February 2023
First published on 14th February 2023
Abstract
Here we present a detailed ab initio study of two experimentally synthesized bismuth niobate BiNbO4 (BNO) polymorphs within the framework of density functional theory (DFT). We synthesized orthorhombic α-BNO and triclinic β-BNO using a solid-state reaction technique. The underlying Pnna and P![[1 with combining macron]](https://www.rsc.org/images/entities/char_0031_0304.gif) crystal symmetries along with their respective phase purity have been confirmed from Rietveld refinement of the powdered X-ray diffraction measurements in combination with generalized gradient approximation of Perdew–Burke–Ernzerhof (GGA-PBE) based DFT simulations. The scanning electron micrographs revealed average grain sizes to be 500 nm and 1 μm for α-BNO and β-BNO respectively. The energy-dispersive X-ray spectroscopy identified the Bi, Nb, and O with proper stoichiometry. The phase purity of the as-synthesized samples was further confirmed by comparing the local density approximation (LDA) norm-conserving pseudo-potential based DFT-simulated Raman peaks with that of experimentally measured ones. The relevant bond vibrations detected in Fourier transform infrared spectroscopy were matched with GGA-PBE derived phonon density of states simulation for both polymorphs. The structural stability and the charge dynamics of the polymorphs were verified from elastic stress and born charge tensor simulations respectively. The dynamical stability of the α-BNO was confirmed from phonon band structure simulation using density functional perturbation theory with Heyd–Scuseria–Ernzerhof (HSE06) hybrid functional. The electronic band gaps of 3.08 and 3.36 eV for α-BNO and β-BNO measured from UV-Vis diffuse reflectance measurements were matched with the sophisticated HSE06 band structure simulation by adjusting the Hartree–Fock exchange parameter. Both GGA-PBE and HSE06 functional were used to simulate complex dielectric function and its derivatives with the help of Fermi's golden rule to define the optical properties in the linear regime. All these may have provided a rigorous theoretical analysis for the experimentally synthesized α-BNO and β-BNO polymorphs.
crystal symmetries along with their respective phase purity have been confirmed from Rietveld refinement of the powdered X-ray diffraction measurements in combination with generalized gradient approximation of Perdew–Burke–Ernzerhof (GGA-PBE) based DFT simulations. The scanning electron micrographs revealed average grain sizes to be 500 nm and 1 μm for α-BNO and β-BNO respectively. The energy-dispersive X-ray spectroscopy identified the Bi, Nb, and O with proper stoichiometry. The phase purity of the as-synthesized samples was further confirmed by comparing the local density approximation (LDA) norm-conserving pseudo-potential based DFT-simulated Raman peaks with that of experimentally measured ones. The relevant bond vibrations detected in Fourier transform infrared spectroscopy were matched with GGA-PBE derived phonon density of states simulation for both polymorphs. The structural stability and the charge dynamics of the polymorphs were verified from elastic stress and born charge tensor simulations respectively. The dynamical stability of the α-BNO was confirmed from phonon band structure simulation using density functional perturbation theory with Heyd–Scuseria–Ernzerhof (HSE06) hybrid functional. The electronic band gaps of 3.08 and 3.36 eV for α-BNO and β-BNO measured from UV-Vis diffuse reflectance measurements were matched with the sophisticated HSE06 band structure simulation by adjusting the Hartree–Fock exchange parameter. Both GGA-PBE and HSE06 functional were used to simulate complex dielectric function and its derivatives with the help of Fermi's golden rule to define the optical properties in the linear regime. All these may have provided a rigorous theoretical analysis for the experimentally synthesized α-BNO and β-BNO polymorphs.
1 Introduction
Bismuth (Bi) based semiconductor oxides are perhaps the most extensively studied materials for maximizing the energy harvest from the abundant and perennial solar energy through photocatalytic means to mitigate the daunting environmental challenges.1–6 Among the different possible oxidation states, Bi3+ turned out to be more stable than Bi5+.1 The presence of distorted Bi-ions with lone pair 6s electron promotes facile stereochemical activity.7 The sp coupling resulting from the mixing of O-2p and Bi-6s lone-pair orbitals facilitates the optically generated charge carrier mobility enhancement and hole effective mass reduction, thereby improving photocatalytic performance.8 Moreover, Bi being a heavier element (Z = 83) tends to induce strong spin–orbit coupling and large dynamic Born charges in materials.9,10 In the case of the Nb5+, the possibility of 4d orbital reduction aids the solar absorption capabilities.11 Hence when both of these aforementioned elements are combined to form BiNbO4, fascinating and unique electrical, mechanical and optical properties emerge in the form of piezoelectricity, pyroelectricity, ferroelectricity, anti-ferroelectricity, enhanced dielectric properties, and photocatalytic activity.12–16,16–22
There are four different polymorphs of BNO exist depending on the temperature of the thermal annealing and the pressure during the synthesis process: (i) the Pnna symmetry defined orthorhombic α-BNO (∼1070 °C), (ii) the space group P![[1 with combining macron]](https://www.rsc.org/images/entities/char_0031_0304.gif) derived triclinic β-BNO (∼1150 °C), (iii) the Cmc2 group symmetry defined orthorhombic γ-BNO (∼1055 °C) and (iv) the high pressure (HP) cubic HP-BNO with the symmetry group Fd
derived triclinic β-BNO (∼1150 °C), (iii) the Cmc2 group symmetry defined orthorhombic γ-BNO (∼1055 °C) and (iv) the high pressure (HP) cubic HP-BNO with the symmetry group Fd![[3 with combining macron]](https://www.rsc.org/images/entities/char_0033_0304.gif) m (∼800 °C).23–27 The occurrence and the evolution of phase transition among these BNO polymorphs are intimately linked with experimentally controllable parameters such as temperature, pressure, pH level, and extrinsic defects.23,26,26,28–31 Moreover, the electronic and optical properties of these different polymorphs of BNO vary, making its detailed study a topic of great scientific interest. The common crystallographic building blocks of all these BNO polymorphs are the BiO6 and NbO6 octahedra, but the difference in their orchestration germinates the observed variation in physical properties.23 For example, both α-BNO and β-BNO consist of corner-sharing niobate octahedral sheet stack separated by Bi3+ ions, with the difference being the latter having corrugation in the stacking layer.28 This affects the relevant orbital energies of Bi-6s and O-2p orbitals relevant to the valence band (VB) of the BNO, making the electronic band gap of α-BNO smaller than that of β-BNO.11,23,32 The corrugation also yields higher crystallographic density in β-BNO compared to that of α-BNO. Moreover, the BNO crystal structure contains corner-shared NbO6 groups which support large polarization deformation resulting in excellent microwave dielectric properties.15 Also, the charge transfer transition in NbO6 octahedra in combination with Bi3+ spin–orbit coupling originate blue luminescence in β-BNO under UV and X-ray illumination.33
m (∼800 °C).23–27 The occurrence and the evolution of phase transition among these BNO polymorphs are intimately linked with experimentally controllable parameters such as temperature, pressure, pH level, and extrinsic defects.23,26,26,28–31 Moreover, the electronic and optical properties of these different polymorphs of BNO vary, making its detailed study a topic of great scientific interest. The common crystallographic building blocks of all these BNO polymorphs are the BiO6 and NbO6 octahedra, but the difference in their orchestration germinates the observed variation in physical properties.23 For example, both α-BNO and β-BNO consist of corner-sharing niobate octahedral sheet stack separated by Bi3+ ions, with the difference being the latter having corrugation in the stacking layer.28 This affects the relevant orbital energies of Bi-6s and O-2p orbitals relevant to the valence band (VB) of the BNO, making the electronic band gap of α-BNO smaller than that of β-BNO.11,23,32 The corrugation also yields higher crystallographic density in β-BNO compared to that of α-BNO. Moreover, the BNO crystal structure contains corner-shared NbO6 groups which support large polarization deformation resulting in excellent microwave dielectric properties.15 Also, the charge transfer transition in NbO6 octahedra in combination with Bi3+ spin–orbit coupling originate blue luminescence in β-BNO under UV and X-ray illumination.33
Several synthesis methods for BNO are reported in the existing literature. For example, the planetary ball milled α-BNO phase formation was reported at 700 °C through mechanical activation.34,35 The co-precipitation methods yield both pure α-BNO and mixed phases at ∼700 °C.36–38 By varying the calcination temperature from 600 to ∼800 °C in the hydrothermal process, mixed, α-BNO and β-BNO phases were synthesized.36,39 The sol–gel methods produced similar phases of BNO as the calcination temperature was varied across ∼600 °C (β-BNO), ∼700–900 °C (mixed α–β-BNO) and ∼900–1020 °C (α-BNO).21,21,24,25,29,40,41 The most widely used solid-state reaction technique stabilized the α-BNO and β-BNO at ∼1020 °C and ∼1040 °C respectively.16,25,41
The optical absorption and electronic energy band gap of BNO are convoluted with synthesis methods that define the surface morphology and the particle size. The solid-state reaction and sol–gel derived α-BNO displayed 2.6–2.8 eV and 3.4 eV electronic energy band gap (Eg) respectively.36,42,43 In the case of the β-BNO, the Eg varies depending on the synthesis processes like solid state reaction (3.4 eV), sol–gel (2.79–3.35 eV) and hydrothermal (3.31 eV). To probe the interesting functional behaviors of BNO, density functional theory (DFT) based first principles calculation can be used as an invaluable tool.44 The DFT-based precise calculation of electronic and optical properties helps to attain a deeper understanding of the behavior of BNO in different applications. The generalized gradient approximations (GGA) with Perdew–Burke–Ernzerhof (PBE) functional yield an Eg of 2.55 eV from the density of states simulation of α-BNO and no band structure (BS) was performed which is essential for finding the direct or indirect nature of band gap.45 A more comprehensive GGA-PBE based calculation for α-BNO revealed the indirect nature of the Eg = 2.87 eV from the BS simulation.46 A combined local density approximation (LDA) and modified Becke-Johnson approximation (mBJ) functional based DFT simulation for both α-BNO and β-BNO were reported in ref. 32. The LDA (mBJ) functional provides the Eg to be indirect 3.73 eV (direct 3.84 eV) in case of α-BNO; whereas for β-BNO, indirect 2.62 eV (direct 3.15 eV) band gap was revealed. This showed the band gap overestimation as compared to that of the experimental values. The sophisticated Heyd–Scuseria–Ernzerhof (HSE06) hybrid functional based simulations resulted in indirect 3.29 eV (direct 2.537 eV) for α-BNO (β-BNO).47 The band gap underestimation was evident there when compared to the experimentally measured values to be found elsewhere. The DFT simulation was combined with experiments in the case of α-BNO to show the slight Eg underestimation of GGA-PBE functional.48 Recently, experimental observed structural and vibrational phonon modes for both α-BNO and β-BNO were combined with LDA-based DFT simulations.28 To the best of our knowledge, a comprehensive study of the different functional properties of both α-BNO and β-BNO with combined experimental and DFT simulation approaches are hard to find in the existing literature.
Here, we synthesized both α-BNO and β-BNO using solid-state reaction techniques. The phase purity and the crystallographic parameters of both polymorphs were extracted from Rietveld refinement of the X-ray diffraction (XRD) and benchmarked against the GGA-PBE simulations. The surface morphology, grain size, and chemical compositions of the synthesized samples were measured from scanning electron microscopy (SEM) and energy dispersive X-ray spectroscopy (EDX). The experimentally measured room temperature (RT) Raman spectra were compared to that of DFT-derived results. We identified the Fourier-transform infrared (FTIR) peaks in terms of different bond vibrations in the as-synthesized α-BNO and β-BNO samples and compared them with the GGA-PBE based phonon density of states simulation. The structural and dynamic stability were analyzed in terms of DFT-based elastic stress tensor and phonon DOS and BS structure simulations. The optical absorption and band gap were measured from diffuse reflectance measurements and compared with GGA-PBE and HSE06-based simulations. We estimated the organic dye methylene blue (MB) decomposition capabilities of both polymorphs under simulated solar irradiation. Overall, our combined DFT and experimental results provide a detailed understating of the functional properties of α-BNO and β-BNO.
2 Methodology
2.1 Computational details
The first principles Density Functional Theory (DFT) derived spin-polarized simulations based on projector augmented wave (PAW) framework have been obtained using the Vienna Ab Initio Simulation Package (VASP) and QUANTUM-ESPRESSO (QE).49–52 The simulations presented here used orthorhombic α-BNO and triclinic β-BNO unit cells, each of which contains 24 atoms (number) comprised of Bi (4), Nb (4) and O (16).28,47 The PAW requires the total number of electrons to be divided into valence and core configurations. To facilitate PAW, 32 electrons comprised of Bi (5d106s26p3), Nb (4p64d45s1), and O (2s22p4) are considered as valence class and the rest are subjected to frozen core approximation. We sampled the Brillouin zone (BZ) with Monkhorst–Pack 7 × 6 × 3 (α-BNO) and 6 × 4 × 4 (β-BNO) grid k-points mesh for structural relaxation and optimization with Hellmann–Feynman force threshold of 10−4 eV Å−1, self-consistent total electronic energy convergence of 10−8 eV and 500 eV as plane wave energy cutoff.
The accuracy of DFT simulations is intimately linked with the type of functional used to encode the electron–electron interaction.44,53 The exchange–correlation term representing the tricky electron interaction is modeled with different functionals.49 The first one is the Perdew–Burke–Ernzerhof (PBE) semi-local generalized gradient approximation (GGA).54 For the Raman active vibrational phonon mode calculation using QE, we considered local density approximation (LDA) norm-conserving pseudo-potential.55–58 The third one is the sophisticated Heyd–Scuseria–Ernzerhof (HSE06) hybrid functional that keeps the electron correlation part unchanged and splits the GGA-PBE exchange into short and long-range parts.59–61 The HSE06 is prominent for proving reliable and accurate modeling of localized d and f orbitals in different materials.62–65 Although the use of 25% Hartree–Fock exchange is widespread,66,67 here we systematically tune Hartree–Fock exchange parameter αHF with fixed long-range Coulomb potential screening parameter μ = 0.2−1 to match the experimental results.66–68 For band structure simulations, we rely on WANNIER90 tool to keep the computational load manageable.69–71 The vibrational phonon DOS and BS were obtained using density functional perturbation theory (DFPT).72,73 The Raman tensors were derived from the derivatives of the dielectric tensor using the finite difference method considering unpolarized optical excitation in a back-scattered geometry.28 The resultant Raman peaks are averaged over the different crystalline planes.74 For the linear optical properties simulation, Fermi's golden rules along with standard Kramer–Kronig relations were used with both GGA-PBE and HSE06 functionals.
2.2 Sample preparation
The proper stoichiometric mixture of Bi2O3 (Merck Germany, 99+% pure) and Nb2O5 (Merck Germany, 99.9% pure) was used to synthesize the BiNbO4 following the conventional solid-state reaction technique.75–77 The homogeneous solid solutions were obtained by milling the mixture in a mortar and pestle. The powder mixtures were transformed into a circular disk-shaped pellet by adding polyvinyl alcohol and using 20 kN uniaxial force in a hydraulic press. The pallets were sintered at 800 °C for 4 h. These pre-sintered pellets were smashed to fine powder form and sintered subsequently at elevated temperatures. After a number of trials for determining the optimum sintering temperature, the α-BNO and β-BNO phases were stabilized at 1000 °C and 1070 °C respectively.16,24,26,28,29,29,31,40,78–83
2.3 Characterization techniques
The samples were sintered in a programmable Nabertherm Muffle Furnace LT 5/14 & Kejia M1700. The powdered X-ray Diffraction (XRD) measurements are performed in a Rigaku SmartLab SE multipurpose XRD system with Cu Kα radiation (λ = 0.15418 nm) from 10° to 80° at 35 kV accelerating voltage with an emission current of 20 mA. The AVO 18 Research Scanning Electron Microscope from ZEISS is used to perform Scanning Electron Microscopy (SEM) and Energy-dispersive X-ray spectroscopy (EDX) for sample morphology and chemical species identification. The MonoVista Confocal Raman Microscope CRS+ with a laser excitation wavelength of 532.090 nm was used to record the RT Raman spectra. The RT Fourier Transform Infrared (FTIR) spectra were obtained from a PerkinElmer Spectrum spectrometer. The UV-Vis diffuse reflectance measurements were performed using a Shimadzu UV-2600i UV-Vis-NIR spectrometer. The UV-Vis absorption spectra were used to determine the photocatalytic efficiency of our samples in deteriorating the MB dye exposed under solar radiation simulated by a Hg–Xe lamp.84 We prepared 100 mL solution containing 50 ppm MB. For both α-BNO and β-BNO polymorphs, the sample densities were taken to be 1 g L−1 with a solution pH value of 4.5. We used a Hg–Xe lamp to simulate solar irradiation. Constant magnetic stirring was used to avoid the detrimental effect arising from the emergence of MB concentration gradient near the sample in the solution.
3 Results and discussion
3.1 X-ray diffraction analysis
To perform the crystallographic structure, phase, and purity analysis of the as-synthesized samples, the powdered XRD patterns were obtained for both α-BNO and β-BNO as displayed in Fig. 1 and 2 respectively within a diffraction angle 2θ range of 10° to 80°. The FullProf software-based Rietveld refinement revealed the goodness of fitting parameter χ2 to be ∼3.75 and ∼3.91 in cases of α-BNO and β-BNO respectively. The sharp and intense peaks located at 2θ of 24.97, 28.30, 29.07, 30.54, 36.09, 46.54 and 54.37° corresponding to planes (111), (121), (031), (040), (002), (060) and (232) according to JCPDS no. 82-0348 corroborates the desired orthorhombic structure under the space group Pnna (52) as depicted in Fig. 1.13–15,17,23,27–29,38,40,48,80,85–89 Similarly, the XRD peaks at diffraction angles 23.94, 27.93, 28.24, 28.70, 29.62, 32.35, 36.98, 48.83 and 51.02° originating from (020), (10![[2 with combining macron]](https://www.rsc.org/images/entities/char_0032_0304.gif) ), (1
), (1![[2 with combining macron]](https://www.rsc.org/images/entities/char_0032_0304.gif) 0), (11
0), (11![[2 with combining macron]](https://www.rsc.org/images/entities/char_0032_0304.gif) ), (120), (200), (022), (2
), (120), (200), (022), (2![[2 with combining macron]](https://www.rsc.org/images/entities/char_0032_0304.gif)
![[2 with combining macron]](https://www.rsc.org/images/entities/char_0032_0304.gif) ) and (1
) and (1![[4 with combining macron]](https://www.rsc.org/images/entities/char_0034_0304.gif) 0) as per the JCPDS no. 71-1518 conform with the triclinic structure of β-BNO with the space group P
0) as per the JCPDS no. 71-1518 conform with the triclinic structure of β-BNO with the space group P![[1 with combining macron]](https://www.rsc.org/images/entities/char_0031_0304.gif) (2).15,25,27–29,31,48,87,90 The relevant crystallographic parameters and bond lengths for both α-BNO and β-BNO were extracted from the Rietveld refinement and are displayed in Table 1. The estimated parameters for α-BNO (β-BNO) are a = 5.683 Å, b = 11.717 Å and c = 4.986 Å (a = 7.619 Å, b = 5.540 Å and c = 7.933 Å) are in excellent agreement with that of standard values to be found in ref. 26, 28 and 89 and confirms the phase purity of the as-synthesized samples. In the case of α-BNO, the Nb–O bond lengths dNb–O in the corner sharing distorted NbO6 octahedra vary from 1.879 to 2.206 Å, whereas the Bi–O bond lengths dBi–O in the four-pyramidal structure reside within the range of 2.164 to 2.295 Å.28 For β-BNO, the distorted NbO6 octahedra are corrugated in which the dNb–O stays within 1.797 to 2.296 Å. The Bi atoms form both trigonal and four-pyramidal geometry with the O atom resulting in dBi–O in the range 2.124 to 2.644 Å.26
(2).15,25,27–29,31,48,87,90 The relevant crystallographic parameters and bond lengths for both α-BNO and β-BNO were extracted from the Rietveld refinement and are displayed in Table 1. The estimated parameters for α-BNO (β-BNO) are a = 5.683 Å, b = 11.717 Å and c = 4.986 Å (a = 7.619 Å, b = 5.540 Å and c = 7.933 Å) are in excellent agreement with that of standard values to be found in ref. 26, 28 and 89 and confirms the phase purity of the as-synthesized samples. In the case of α-BNO, the Nb–O bond lengths dNb–O in the corner sharing distorted NbO6 octahedra vary from 1.879 to 2.206 Å, whereas the Bi–O bond lengths dBi–O in the four-pyramidal structure reside within the range of 2.164 to 2.295 Å.28 For β-BNO, the distorted NbO6 octahedra are corrugated in which the dNb–O stays within 1.797 to 2.296 Å. The Bi atoms form both trigonal and four-pyramidal geometry with the O atom resulting in dBi–O in the range 2.124 to 2.644 Å.26
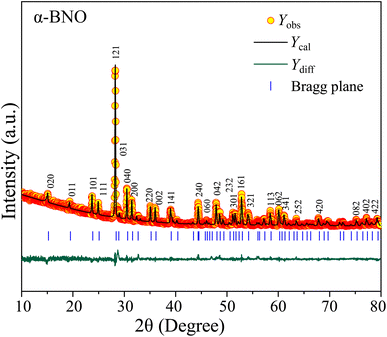 |
| | Fig. 1 Rietveld refined XRD patterns on top of experimentally observed data for α-BNO. The yellow circles are the experimental data points (Yobs), the black solid line represents the calculated refined pattern Ycal, the bottom green curve Ydiff shows the difference between the experimental Yobs and calculated Ycal values. | |
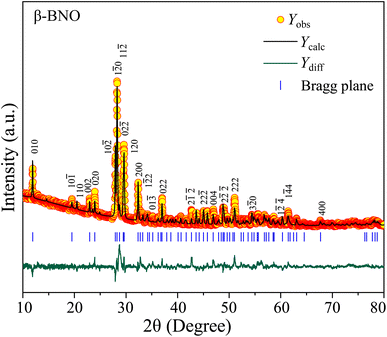 |
| | Fig. 2 Rietveld refined XRD patterns on top of experimentally observed data for β-BNO. The yellow circles are the experimental data points (Yobs), the black solid line represents the calculated refined pattern Ycal, the bottom green curve Ydiff shows the difference between the experimental Yobs and calculated Ycal values. | |
Table 1 Crystallographic parameters, bond angles, and bond lengths measured from experiments (Exp.) and DFT simulations using GGA-PBE functional for α-BNO and β-BNO
| Crystallographic parameters, bond lengths and bond angles |
| Sample |
Symmetry |
|
a (Å) |
b (Å) |
c (Å) |
α (°) |
β (°) |
γ (°) |
V (Å3) |
dBi–O (Å) |
dNb–O (Å) |
| α-BNO |
Pnna |
Exp. |
5.683 |
11.717 |
4.986 |
90 |
90 |
90 |
332.028 |
2.164, 2.647, 2.295 |
1.879–2.206 |
| DFT |
5.832 |
11.793 |
5.108 |
90 |
90 |
90 |
351.213 |
2.338, 2.172 |
1.856–2.248 |
| β-BNO |
P![[1 with combining macron]](https://www.rsc.org/images/entities/char_0031_0304.gif) |
Exp. |
7.619 |
5.540 |
7.933 |
90.155 |
77.488 |
87.206 |
326.514 |
2.124–2.644 |
1.797–2.296 |
| DFT |
7.745 |
5.576 |
8.011 |
101.723 |
90.147 |
92.768 |
338.297 |
2.219–2.594 |
1.846–2.238 |
For comparative analysis, we estimated the lattice parameters of both α-BNO and β-BNO from the relaxed structure of the DFT simulations using the GGA-PBE functional as can be seen from Table 1. It is well established that the GGA-PBE underbinds the atoms in the unit cell and produces an overestimate of the lattice parameters.71,91–93 This fact is evident from ∼5.4% and ∼3.4% volume overestimation of GGA-PBE with respect to the experimental observations for both α-BNO and β-BNO respectively. Moreover, our DFT simulated lattice parameters of both α-BNO and β-BNO are consistent with that of ref. 32, 45–47 and 94.
3.2 Morphology and EDX analysis
We obtained SEM micrographs of both α-BNO and β-BNO to analyze the surface morphology and microstructure. The standard histogram analysis of SEM micrographs was used to estimate the average grain size of the as-synthesized samples, see Fig. 3. In the case of 1000 °C sintered α-BNO, the average grain size turned out to be ∼500 nm as shown in Fig. 3(a). The elevated sintering temperature of 1070 °C in the case of β-BNO may have promoted the grain growth to an average grain size of ∼1 μm, see Fig. 3(b). The chemical species identification and concentration analysis were performed for both α-BNO and β-BNO using EDX measurements. The atomic at% and weight wt% percentages of identified chemical species are displayed in Table S1 of ESI.† The theoretical at% (wt%) of Bi, Nb and O in both α-BNO and β-BNO are ∼16.67 (∼57.12%), ∼16.67 (∼25.39%) and ∼66.67% (∼17.48%). The Bi at% & wt% for both α-BNO (16.47% & 51.65%) and β-BNO (15.74% & 51.66%) are in good agreement with that of the aforementioned theoretical values. Similar good agreement for Nb and O at% & wt% can be seen for both α-BNO and β-BNO.
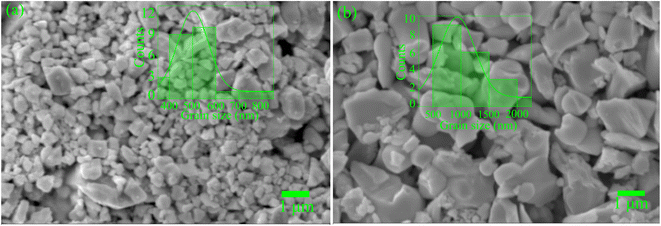 |
| | Fig. 3 SEM micrographs of (a) α-BNO and (b) β-BNO and with grain size histograms superimposed. | |
3.3 Raman analysis
The vibrational spectra of the phonon modes are captured in RT Raman spectroscopy for both α-BNO and β-BNO in Fig. 4 and 5 respectively. The experimental observations along with the corresponding DFT simulations based on LDA norm-conserving pseudo-potential for the Raman active phonon modes are summarized in Table 2. The DFT simulated Raman peaks are in excellent accord with the experimental observation. The D2h6 symmetry in Pnna space group of α-BNO are characterized by optical modes labeled as Γoptical = 8Ag + 8Au + 9B1g + 8B1u + 10B2g + 9B2u + 9B3g + 8B3u. Among these modes, only the gerade modes are Raman active, and are characterized by ΓRaman = 8Ag + 9B1g + 10B2g + 9B3g.23,29,40,95 The internal NbO6 octahedral stretching originates the Raman peaks near 530 and 625 cm−1. The peaks near 280 and 200 cm−1 mark the bending vibrations of BiO6. The peaks located around 367, 385 and 430 cm−1 stem from the combined stretching and bending vibrations of BiO6 octahedron. The peak at 850 cm−1 may describe the symmetric stretching of Nb–O bonds. The band near 890 cm−1 can be ascribed to the Bi3+ stretching vibration in the distorted BiO6 octahedron. The increased structural complexity of β-BNO lowers its symmetry as compared to α-BNO; hence extra Raman peaks are observed at 101, 459, and 697 cm−1 which are consistent with the findings in ref. 29 and 36.
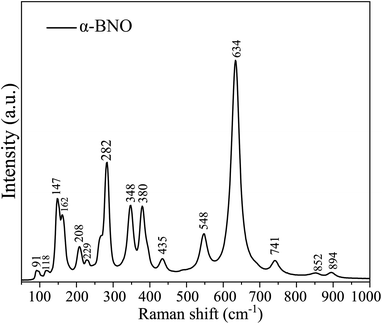 |
| | Fig. 4 Room temperature Raman spectra of α-BNO. | |
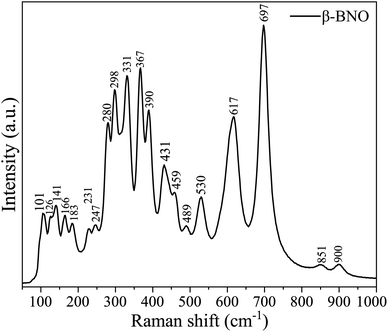 |
| | Fig. 5 Room temperature Raman spectra of β-BNO. | |
Table 2 RT experimental (Exp.) and DFT (LDA norm-conserving pseudo-potential) based Raman peaks of both α-BNO and β-BNO
| Raman peak analysis |
| α-BNO |
β-BNO |
| Exp. (cm−1) |
DFT (cm−1) |
Symm. |
Exp. (cm−1) |
DFT (cm−1) |
Symm. |
| 91 |
89 |
B1g |
— |
— |
— |
| — |
— |
— |
101 |
102 |
B1g |
| 118 |
118 |
B2g |
126 |
129 |
B2g |
| 147 |
147 |
Ag |
141 |
150 |
Ag |
| 162 |
164 |
Ag |
166 |
165 |
Ag |
| — |
|
|
183 |
184 |
Ag |
| 208 |
207 |
B3g |
— |
— |
— |
| 229 |
228 |
B1g |
231 |
214 |
B1g |
| — |
— |
— |
247 |
246 |
Ag |
| 282 |
290 |
B1g |
280 |
280 |
B1g |
| — |
— |
— |
298 |
301 |
B1g |
| — |
— |
— |
331 |
334 |
B3g |
| 348 |
346 |
B2g |
— |
— |
— |
| — |
— |
— |
367 |
369 |
Ag |
| 380 |
397 |
B1g |
390 |
392 |
B1g |
| 435 |
438 |
B1g |
431 |
433 |
B1g |
| — |
— |
— |
459 |
462 |
B1g |
| — |
— |
— |
489 |
494 |
B1g |
| 548 |
543 |
B2g |
530 |
530 |
B2g |
| 634 |
629 |
B2g |
617 |
618 |
B2g |
| — |
— |
— |
697 |
700 |
— |
| 741 |
762 |
Ag |
— |
— |
— |
| 852 |
848 |
Ag |
851 |
852 |
Ag |
| 894 |
— |
B3g |
900 |
908 |
B3g |
3.4 Fourier transform infrared spectroscopy
To detect the FTIR absorption bands, we measured the transmittance T of both α-BNO and β-BNO from 400 to 1400 cm−1 as shown in Fig. 6.40 The observed FTIR absorption bands were identified along with their bond vibrations and compared against GGA-PBE based phonon density of states simulation as shown in Table S2 (ESI†). The observed minute differences in the FTIR absorbance among these two phases are due to the slight difference in the way the [Bi2O2] layers are formed in these two polymorphs.36 Since both polymorphs are made up of stacking layers of alternating [Bi2O2] and [NbO4] units, the bond vibrations have their origins in NbO6 octahedra, Nb–O–Nb, Nb–O, Bi–O, and Bi–O–Bi. The stretching vibrations in Bi–O bonds are detected near 400 to 500 cm−1.26,28 The NbO6 octahedral stretching appeared at 550 cm−1. The symmetrical Bi–O–Bi stretching is IR active near 850 to 890 cm−1. The BiO6 octahedral stretching vibrations are detected near 1000 cm−1 band. The dominant absorption at 846 cm−1 is characteristic to β-BNO while the one near 440 cm−1 resembles the α-BNO phase. The Nb–O stretching vibrations result in IR absorption near 1250 cm−1. The FTIR peak at 1394 cm−1 is representative of the stretching and bending of –OH in water adsorbed by α-BNO sample.
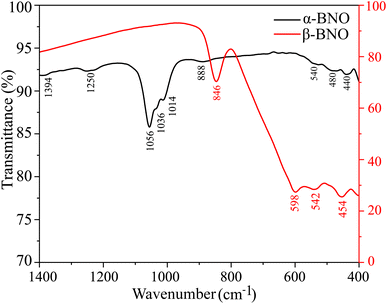 |
| | Fig. 6 Room temperature FTIR spectra of both α-BNO and β-BNO. | |
3.5 UV-Vis spectroscopy
We used the Kubelka–Munk function F(R∞) to obtain the absorption spectra from the measured diffuse reflectance data as depicted in Fig. 7(a). The primary absorptions occur within the wavelength range of 300 to 400 nm. Many different parameters, such as electronic structure, grain shape and size, and the presence of different vacancies, interstitials, and defects convolve together to define the effective optical absorption of any materials.76 A red shift in fundamental absorption edge is expected when grain size increment is considered alone.96 The observed red shift in the absorption edge of β-BNO may have the increased grain size as one of the contributing factors. The F(R∞) is related to incident photon energy hν and the electronic energy band gap Eg (γ = 1/2 for direct and γ = 2 in case of indirect electronic transition) of the material as| | |
[F(R∞)hν]1/γ = A(hν − Eg)
| (1) |
where A is a constant of proportionality. We obtained the Tauc plots using eqn (1) as shown in Fig. 7(b). The steep edge of the linear absorption can be extrapolated (shown as dotted lines) to the hν axis for the reliable estimation of the Eg. Our HSE06 DFT simulations presented in Section 3.9 revealed the indirect and direct nature of the band gap of α-BNO and β-BNO respectively. Based on this observation, we estimate an Eg of indirect 3.08 eV (direct 3.36 eV) for our as-synthesized α-BNO (β-BNO) sample. These Eg estimations are consistent with that of ref. 12, 29 and 48.
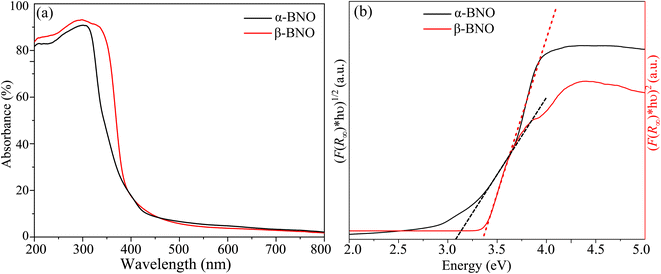 |
| | Fig. 7 (a) UV-Vis diffuse absorption spectra. (b) Band gap estimation from Tauc plots for α-BNO and β-BNO. | |
3.6 Elastic properties simulation
To test the structural stability, we simulate the elastic properties (E.P.) of both α-BNO and β-BNO in terms of elastic tensor Cij. The Cij tensor was estimated by perturbing the underlying lattice with forces applied in different directions.97,98 The energy cutoff for the plane wave expansion was set to 620 eV to ensure convergence of the stress tensor. In case of the orthorhombic α-BNO, 6 independent non-trivial elastic constants C11, C12, C13, C22, C23, C33, C44, C55 and C66 exist. It is evident from Table 3 that the required Born rule for mechanical stability in case of the orthorhombic α-BNO are fulfilled by the following conditions99| | |
C11 > 0, C44 > 0, C55 > 0, C11C22 > C122
| (2) |
| | |
C11C22C33 + 2C12C13C23 − C11C232 − C22C132 − C33C122 > 0.
| (3) |
Table 3 Elastic constants (Cij), bulk modulus (BV, BR and BH), shear modulus (GV, GR, GH), Young's modulus (EV, ER, EH), Poisson ratio (νV, νR, νH) and Pugh's ratio (kV, kR, kH) in Voigt–Reuss–Hill framework for α-BNO and β-BNO using GGA-PBE functional. The λi's are the eigenvalues of tensor Cij for β-BNO
| Elastic properties of α-BNO and β-BNO |
| α-BNO |
β-BNO |
| E.P. |
GGA-PBE |
E.P. |
GGA-PBE |
E.P. |
GGA-PBE |
| C11 (GPa) |
116.131 |
C11 (GPa) |
177.986 |
GR (GPa) |
41.574 |
| C12 (GPa) |
39.992 |
C12 (GPa) |
48.605 |
GH (GPa) |
44.645 |
| C13 (GPa) |
49.999 |
C13 (GPa) |
54.542 |
EV (GPa) |
119.442 |
| C14 (GPa) |
0.000 |
C14 (GPa) |
13.120 |
ER (GPa) |
105.401 |
| C22 (GPa) |
129.092 |
C15 (GPa) |
7.454 |
EH (GPa) |
112.444 |
| C23 (GPa) |
31.173 |
C16 (GPa) |
17.423 |
νV |
0.253 |
| C33 (GPa) |
129.824 |
C22 (GPa) |
145.480 |
νR |
0.268 |
| C44 (GPa) |
34.278 |
C23 (GPa) |
44.577 |
νH |
0.259 |
| C55 (GPa) |
26.992 |
C24 (GPa) |
−7.744 |
kV |
1.682 |
| C66 (GPa) |
2.812 |
C25 (GPa) |
−3.642 |
kR |
1.818 |
| BV (GPa) |
68.601 |
C26 (GPa) |
−0.431 |
kH |
1.744 |
| BR (GPa) |
68.532 |
C33 (GPa) |
102.284 |
λ1 (GPa) |
28.397 |
| BH (GPa) |
68.564 |
C34 (GPa) |
−3.708 |
λ2 (GPa) |
47.859 |
| GV (GPa) |
29.741 |
C35 (GPa) |
5.681 |
λ3 (GPa) |
58.352 |
| GR (GPa) |
10.624 |
C36 (GPa) |
−3.754 |
λ4 (GPa) |
73.288 |
| GH (GPa) |
20.183 |
C44 (GPa) |
36.904 |
λ5 (GPa) |
115.807 |
| EV (GPa) |
77.961 |
C45 (GPa) |
−1.028 |
λ6 (GPa) |
247.950 |
| ER (GPa) |
30.306 |
C46 (GPa) |
−5.382 |
|
| EH (GPa) |
55.138 |
C55 (GPa) |
60.930 |
|
| νV |
0.31 |
C56 (GPa) |
−4.175 |
|
| νR |
0.426 |
C66 (GPa) |
2.812 |
|
| νH |
0.366 |
BV (GPa) |
80.131 |
|
| kV |
2.310 |
BR (GPa) |
75.595 |
|
| kR |
6.451 |
BH (GPa) |
77.864 |
|
| kH |
3.397 |
GV (GPa) |
47.72 |
|
The triclinic β-BNO with lower symmetry is defined by 21 independent elastic constants as displayed in Table 3. The mechanical stability of β-BNO is guaranteed from all eigenvalues λis of the stress tensor C11 being positive as per the ref. 99. We estimated relevant elastic properties such as bulk-modulus (B), shear modulus (G), Young's modulus (E), Poisson's ratio (ν) and Pugh's ratio (k) using three different frameworks Reuss (BR, GR, ER and νR, kR), Voigt (BV, GV, EV, νV and kV) and Hill (BH, GH, EH, νH and kH).100–102 The bulk-moduli (BV = 80.131, BR = 75.595 and BH = 77.864), shear moduli (GV = 42.72, GR = 41.574 and GH = 44.645) and Young's moduli (EV = 190.442, ER = 105.401 and EH = 112.444) of β-BNO turned out to be larger than those of α-BNO (BV = 68.601, BR = 68.564 and BH = 68.564; GV = 29.741, GR = 10.624 and GH = 20.183; EV = 77.961, ER = 30.306 and EH = 55.138), indicating the former to have higher compressibility, resistance to plastic deformation and stiffness than the latter. The estimated Poisson ratios of β-BNO (νV = 0.253, νR = 0.268 and νH = 0.259) are below the threshold value of 0.33 which indicate its brittle nature. The Pugh's ratios of β-BNO (kV = 1.682, kR = 1.818 and kH = 1.744) stayed close to the critical value 1.75.103 In the case of α-BNO, the Pugh's ratios (kV = 2.310, kR = 6.451 and kH = 3.397) are well above the brittle/ductile threshold value of 1.75.
3.7 Vibrational properties simulations
The dispersion in phonon vibration embodies the dynamical stability of materials. To probe the dynamical stability, we performed computationally intense DFPT based phonon DOS and BS simulation on top of sophisticated HSE06 functional for the α-BNO phase depicted in Fig. 8. The 3 low energy acoustic modes are linear and degenerate at the Γ-point. The stability of the α-BNO is evident from the absence of imaginary phonon modes residing in the BZ. The Bi, Nb and O possess heavy, moderate and light atomic masses respectively. The vibrational contributions of atoms go inversely with the wave number range due to increasing atomic masses. This is evident in the right column of Fig. 8, e.g. the heaviest Bi provides a dominant contribution to low 100 cm−1 range.
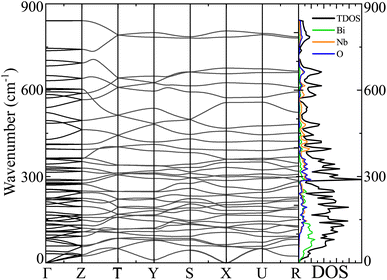 |
| | Fig. 8 Phonon band structure, the total density of states TDOS and partial density of states PDOS for Bi, Nb and O atoms (in right column) of α-BNO (αHF = 2%) using the DFPT for HSE06 functional. The phonon dispersion curves in the band structure are plotted along the high symmetry k-points Γ, R, S, T, U, Y, and Z in the Brillouin zone. | |
3.8 Born charge analysis
The Born effective charge (BEC) characterizes the dynamical state of electric charge with atomic position alteration.104–106 The BEC encodes screening of the long-range Coulomb potential among nuclei that defines the phonon vibrational modes arising from the underlying lattice dynamics.107,108 We simulated the BEC tensor using GGA-PBE as shown in Table 4. The nominal ionic charges of Bi, Nb, and O are +3, +5, and −2 considering close shell configuration. The diagonal charges averaged to +4.43 (+4.72), +6.96 (+6.83) and +2.853 (+2.76) for Bi, Nb and O in cases of α-BNO (β-BNO) respectively. The deviation from the nominal charge states in cases of Bi and Nb can be related to the orbital hybridization, between O-2p and Bi-6s near the top of the VB, and among Bi-6p, Nb-4d and O-2p at the bottom part of the CB. The hybridization promotes electronic charge delocalization favoring the covalent nature of the bonding that superimposes dynamical contributions on the nominal ionic charges.109,110
Table 4 Born effective charge tensor of α-BNO and β-BNO using GGA-PBE functional
| |
ZB |
Position |
xx |
xy |
xz |
yx |
yy |
yz |
zx |
zy |
zz |
| α-BNO |
Bi |
4c |
3.870 |
0 |
0 |
0 |
4.444 |
−0.085 |
0 |
−0.626 |
4.975 |
| Nb |
4d |
7.567 |
0 |
−0.279 |
0 |
6.146 |
0 |
0.521 |
0 |
7.172 |
| O1 |
8e |
−2.181 |
0.320 |
−1.375 |
0.792 |
−2.433 |
−0.473 |
−1.505 |
−0.708 |
−3.945 |
| O2 |
8e |
−3.537 |
1.984 |
−0.967 |
1.763 |
−2.862 |
0.412 |
−0.826 |
0.269 |
−2.128 |
| β-BNO |
Bi1 |
2i |
5.371 |
0.325 |
−0.200 |
0.398 |
4.282 |
−0.719 |
0.286 |
0.039 |
4.510 |
| Bi2 |
2i |
5.059 |
0.338 |
0.381 |
0.329 |
4.160 |
0.001 |
−0.248 |
0.197 |
4.758 |
| Nb1 |
2i |
7.705 |
−0.345 |
−0.049 |
−0.026 |
8.056 |
0.472 |
−0.538 |
−0.362 |
6.573 |
| Nb2 |
2i |
7.051 |
0.273 |
0.069 |
−0.259 |
6.975 |
0.789 |
0.753 |
0.227 |
6.464 |
| O1 |
2i |
−3.149 |
0.344 |
1.039 |
0.350 |
−2.924 |
−0.027 |
0.501 |
−0.134 |
−2.193 |
| O2 |
2i |
−3.878 |
2.037 |
0.884 |
1.854 |
−4.310 |
−0.106 |
0.679 |
−0.031 |
−1.417 |
| O3 |
2i |
−2.031 |
0.416 |
0.727 |
0.467 |
−1.302 |
−0.278 |
0.574 |
−0.054 |
−5.120 |
| O4 |
2i |
−3.582 |
0.602 |
0.348 |
0.875 |
−3.150 |
0.118 |
−0.282 |
0.061 |
−2.318 |
| O5 |
2i |
−3.919 |
−2.381 |
−0.721 |
−2.332 |
−4.124 |
−0.337 |
−0.466 |
−0.241 |
−1.244 |
| O6 |
2i |
−2.969 |
0.338 |
−0.951 |
0.405 |
−4.034 |
0.308 |
−0.658 |
0.484 |
−1.872 |
| O7 |
2i |
−3.739 |
−1.453 |
−0.191 |
−1.446 |
−2.184 |
0.323 |
0.003 |
0.258 |
−2.886 |
| O8 |
2i |
−1.919 |
−0.494 |
−0.639 |
−0.616 |
−1.444 |
−0.544 |
−0.600 |
−0.444 |
−5.255 |
3.9 Electronic properties simulations
The GGA-PBE spin-polarized total density of states (TDOS) and its projection onto the different constituent atomic orbitals as a function of energy E within a range of 14 eV window containing the Fermi level (EF) in the middle for both α-BNO and β-BNO are shown in Fig. 9. For both polymorphs, the states near the valence band maxima (VBM) result from mixing between Bi-6s lone pair with dominant O-2p orbital. The (Nb-4d, O-2p) as well as (Bi-6p, O-2p) orbitals get hybridized to form the bonding states 1.5 eV below the EF indicating the covalent nature of both Nb–O and Bi–O bonds. The mixing strength of (Nb-4d, O-2p) is stronger than that of (Bi-6p, O-2p) resulting in stronger covalency in the Nb-0 bonding. The states near the conduction band minima (CBm) stem from the hybridization of anti-bonding (Nb-4d, O-2p) and (Bi-6p, O-2p) levels. The GGA-PBE functional produced a 2.77 and 2.57 eV energy gap between the highest occupied molecular orbital (HOMO) and lowest unoccupied molecular orbital (LUMO) for α-BNO and β-BNO respectively as can be seen from Fig. 9(a) and (b). The standard 25% Hartree–Fock exchange αHF yields 4 and 3.65 eV, which are clearly overestimated energy gaps between HOMO and LUMO in cases of α-BNO and β-BNO respectively as shown in Fig. S2.† We vary the αHF parameter (see Fig. S3†) to obtain best fit for our experimentally observed Eg = 3.08 eV (3.36 eV) of α-BNO (β-BNO). We tune the αHF to 2% (20%) to reduce the energy gap to 2.87 eV (3.28 eV) for α-BNO (β-BNO) as depicted in Fig. 10. The GGA-PBE simulated electronic band structure along the relevant high symmetry points Γ, X, S, Y, Z, U, R, and T in the BZ for α-BNO is shown in Fig. 11(a). We estimated an indirect band gap of 3 eV between the VBM at the Γ point and the CBm occurring in Y → S. This is in excellent agreement with our experimental observation of the 3.08 eV indirect band gap in the case of α-BNO. We extend the BS simulation with the optimum αHF of 2% for HSE06 to produce an Eg of 3.14 eV in Fig. 12(a) which is a slight overestimate of that of the experimentally observed one. In the case of the β-BNO, both the VBM and the CBm occur at the Γ point resulting in a direct band gap of 2.71 eV in Fig. 11(b) which is an underestimation to that of the experimentally measured value of 3.36 eV. The HSE06 with an αHF of 20% corrects the band gap to 3.46 eV as can be seen from Fig. 12(b).
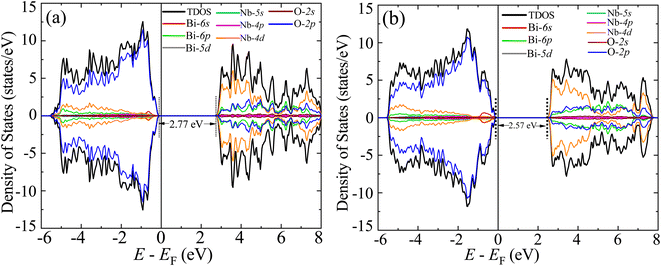 |
| | Fig. 9 Spin polarized total density of states (TDOS) and its projection onto different orbitals in Bi, Nb, and O in (a) α-BNO and (b) β-BNO using GGA-PBE functional. | |
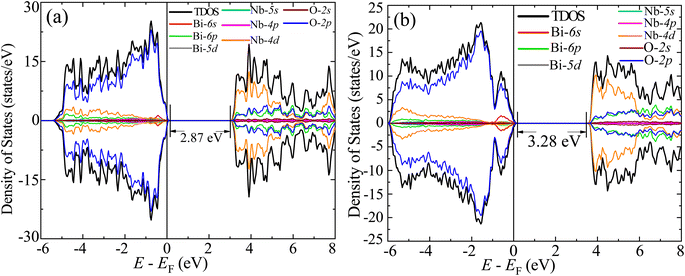 |
| | Fig. 10 TDOS and its projection onto different orbitals in Bi, Nb, and O for (a) α-BNO (αHF = 2%) and (b) β-BNO (αHF = 20%) using HSE06 functional. | |
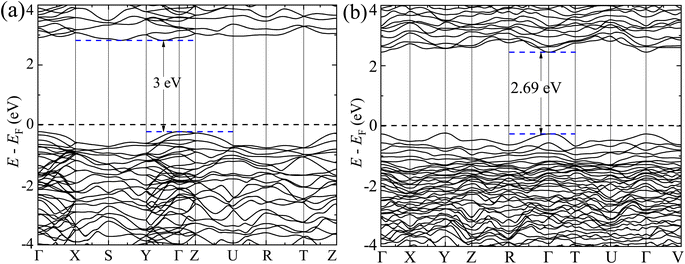 |
| | Fig. 11 Electronic band structure along high symmetry k-points Γ, Y, Z, S, X, Z, U, R, T and V for (a) α-BNO and (b) β-BNO using GGA-PBE functional. | |
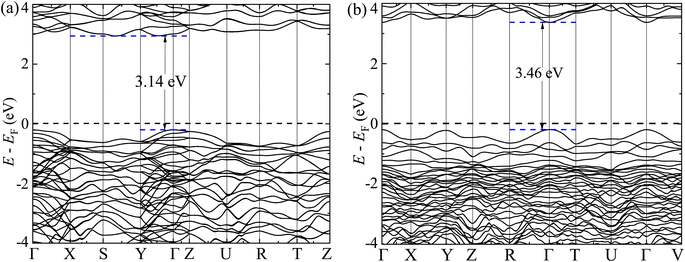 |
| | Fig. 12 Electronic band structure along high symmetry k-points Γ, Y, Z, S, X, Z, U, R, T and V for (a) α-BNO (αHF = 2%) and (b) β-BNO (αHF = 20%) using HSE06 functional. | |
3.10 Optical properties simulations
The optical properties are revealed through the complex dielectric constant ε(ω) = εreal(ω) + iεimag(ω) ( , ω = angular frequency of the optical excitation). The dipole transition matrix elements were derived from BS simulation for both GGA-PBE and HSE06 functionals in cases of α-BNO and β-BNO to calculate the εimag. The standard Kramer–Kronig relations were used to estimate εreal from εimag.71,109,111,112 The optical response is characterized by parameters like absorption coefficient α, reflectivity R, energy loss function L, refractive index η, extinction coefficient K, and optical conductivity σ derived from ε(ω).113 All aforementioned quantities are averaged over three orthogonal polarization directions Ex, Ey and Ez along spatial x, y, and z coordinates. In the ω → 0 limit, the GGA-PBE based εreal in Fig. 13(a) attained 6.21 (6.65) in case of α-BNO (β-BNO) which are clear overestimation of the experimentally measured value of 4.4 in ref. 114. The HSE06 corrects this overestimation by providing 5.6 (α-BNO) and 4.82 (β-BNO) with αHH of 2% and 20% respectively. The εimag embodies the electronic transitions in response to optical excitation. The dominant peaks below 8 eV mark the electronic transition from O-2p in VB to Nb-4d in CB. The energy cut-off Ecut below which εimag vanishes in Fig. 13(b) are consistent with the estimated Eg measured from GGG-PBE and HSE06 functionals. Moreover, HSE06 shifts significantly the peaks εimag to higher energy (6 eV) as it corrects the GGA-PBE (4.8 eV) underestimated Eg. The HSE06 functional, as it tunes the Eg, shifts the energy threshold beyond which absorption steeply shoots up as shown in Fig. 13(c). The GGA-PBE derived refractive index η turned out to be 2.5 (α-BNO) and 2.6 (β-BNO) as depicted in Fig. 13(d). The HSE06 results in an η of 2.4 and 2.2 as compared to that of experimentally measured values of 2.5 and 2.2 in ref. 114 and 115. The optical losses L due to fast charge carrier movement116 emerging beyond the Ecut as expected, see Fig. S4(a).† The extinction coefficient K increases from zero near the Ecut where the peaks near 4.5 and 6.5 eV mark the emergence of plasmonic resonance as shown in Fig. S4(b).† Both polymorphs are relatively transparent in the static limit with reflectance below 20% as shown in Fig. S4(c).† The broad summit peaks near 4.5 and 6.5 eV coincide with optical resonances in the sample. The optical conductivity σ defined by σ = ωεimag in Fig. S4(d)† shares similar features like conductivity threshold and peak positions in energy to those of εimag as expected.
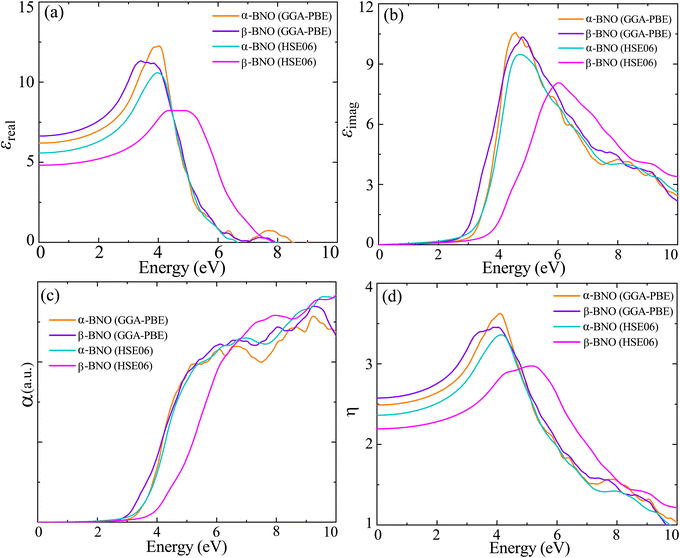 |
| | Fig. 13 Optical properties. (a) Real part of dielectric constant εreal, (b) imaginary part of the dielectric constant εimag, (c) absorption coefficient α, (d) refractive index η a function photon energy E calculated from GGA-PBE and HSE06 averaged over three different polarization Ex, Ey and Ez in case of α-BNO (αHF = 2%) and β-BNO (αHF = 20%) functional. | |
3.11 Photocatalytic measurements
We measured the MB dye degradation capabilities of both α-BNO and β-BNO samples as photo-catalyst under the influence of simulated solar irradiation. The measured exposure time-dependent UV-Vis absorption spectra of the MB dye during the photocatalytic degradation are shown in Fig. 14(a) and (b). The observed intensity reduction of the MB characteristic intensity peak at 665 nm as a function of irradiation time corroborates the annihilation of its chromophoric structure. We estimated the photodegradation efficiency for α-BNO (β-BNO) to be 52.15% (58.88%) after 3 h of simulated solar radiation exposure (see ESI†). The reaction rate k turned out to be 0.00387 min−1 (0.0455 min−1) for α-BNO (β-BNO) as measured from the linear fitting of the photodegradation kinematics (see Fig. S5(b)†).
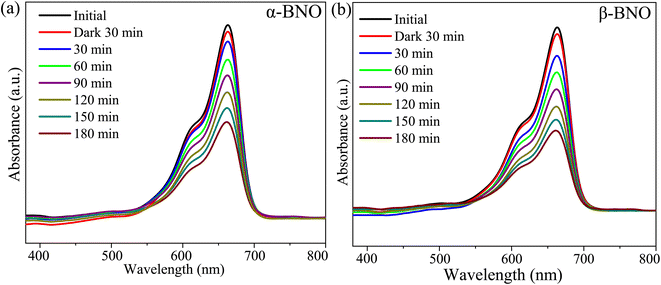 |
| | Fig. 14 The UV-Vis absorption spectra during the photodegradation of MB dye as a function of exposure time for (a) α-BNO and (b) β-BNO. | |
4 Conclusion
We performed rigorous first principles simulations within the framework of DFT to support experimentally synthesized phase pure α-BNO and β-BNO samples. The phase purity of the as-synthesized samples was demonstrated with reliable Rietveld refined powdered XRD measurements, and relevant crystal parameters were benchmarked against the GGA-PBE based DFT simulations. The surface morphology, microstructure, and chemical purity of the samples were investigated with standard SEM and EDX measurements. The experimental RT Raman spectra for both α-BNO and β-BNO polymorphs were identified with that of LDA norm-conserving pseudo-potential based DFT simulation to further ensure the phase purity of the samples. The relevant chemical bond vibrations in both polymorphs were probed with FTIR measurements and resultant absorption bands were compared with the DFT-simulated phonon DOS. The structural stability for both α-BNO and β-BNO were demonstrated with Born stability criteria in elastic stress tensor simulations. The dynamical stability of the α-BNO is established from DFPT based phonon BS simulation with HSE06 functional. The Born effective charge tensor simulations were done for both polymorphs. We tuned the Hartree–Fock exchange term αHF to 2% and 20% to match the experimental electronic energy band gap of α-BNO and β-BNO respectively. The linear optical behavior of both polymorphs was studied in detail using both GGA-PBE and HSE06 functionals. We estimated the photocatalytic properties of both polymorphs in degrading the MB dye. Overall, this work may have seamlessly integrated the DFT simulations with the experimental observations for α-BNO and β-BNO polymorphs.
Data availability
The data that support the findings of this study are available from the corresponding author upon reasonable request.
Author contributions
I. A. planned, managed, and supervised the entire project, and wrote the original article. M. Z. H. synthesized the samples with the help of T. H. and Q. S. H. M. N. I. K. helped with XRD, FTIR, and Raman measurements. I. M. S. and S. H. provided sample synthesis support. SEM and EDX measurements were performed by M. S. B. K. S. H. helped with optical measurements. M. Z. H. and Q. S. H. performed the photo-catalytic measurements. S. S. N, Q. S. H., S. A., T. H., I. M. S., M. M. K., A. K. M. S. H. F., and I. A. performed the DFT simulations. M. Z. H. and A. K. M. S. H. F., S. H., and I. A. performed the data curation with support from other authors.
Conflicts of interest
The authors declare no competing interests.
Acknowledgements
I. A. gratefully acknowledges financial support from the University Grants Commission (UGC) of Bangladesh Research Fund 2021–2022 for the University of Dhaka. All simulations were performed in the high-performance computing facility provided by Bangladesh Research and Education Network (BdREN). We acknowledge excellent computational resource support from BdREN. I. A. also thankfully acknowledges MD. Mominul Islam, Department of Chemistry, University of Dhaka for the fruitful discussion regarding the photocatalytic measurements. K. S. H. acknowledges the support from International Science Program (ISP), Uppsala University, Sweden.
Notes and references
- P. Chen, H. Liu, W. Cui, S. C. Lee, L. Wang and F. Dong, EcoMat, 2020, 2, e12047 CrossRef CAS.
- W. Fang and W. Shangguan, Int. J. Hydrogen Energy, 2019, 44, 895 CrossRef CAS.
- R. He, D. Xu, B. Cheng, J. Yu and W. Ho, Nanoscale Horiz., 2018, 3, 464 RSC.
- X. Liu, J. Xiao, S. Ma, C. Shi, L. Pan and J.-J. Zou, ChemNanoMat, 2021, 7, 684 CrossRef CAS.
- S. Wang, L. Wang and W. Huang, J. Mater. Chem. A, 2020, 8, 24307 RSC.
- X. Wu, C. Y. Toe, C. Su, Y. H. Ng, R. Amal and J. Scott, J. Mater. Chem. A, 2020, 8, 15302 RSC.
- R. Yu, A. Fan, M. Yuan, T. Li and J. Wang, Phys. Chem. Chem. Phys., 2016, 18, 23702 RSC.
- Q. Sun, J. Wang, W.-J. Yin and Y. Yan, Adv. Mater., 2018, 30, 1705901 CrossRef PubMed.
- D. Tiwari, D. Alibhai, D. Cherns and D. J. Fermin, Chem. Mater., 2020, 32, 1235 CrossRef CAS.
- A. M. Ganose, C. N. Savory and D. O. Scanlon, Chem. Commun., 2017, 53, 20 RSC.
- M. Arunachalam, K.-S. Ahn and S. H. Kang, Phys. Chem. Chem. Phys., 2020, 22, 14042 RSC.
- C. Balamurugan, D.-W. Lee, A. Maheswari and M. Parmar, RSC Adv., 2014, 4, 54625 RSC.
- Y.-C. Liou, W.-C. Tsai and H.-M. Chen, Ceram. Int., 2009, 35, 2119 CrossRef CAS.
- H.-C. Ling, M. Yan and W. Rhodes, J. Mater. Res., 1990, 5, 1752 CrossRef CAS.
- E. S. Kim and W. Choi, J. Eur. Ceram. Soc., 2006, 26, 1761 CrossRef CAS.
- S. S. Dunkle and K. S. Suslick, J. Phys. Chem. C, 2009, 113, 10341 CrossRef CAS.
- B. Muktha, J. Darriet, G. Madras and T. G. Row, J. Solid State Chem., 2006, 179, 3919 CrossRef CAS.
- W. Choi, K.-Y. Kim, M.-R. Moon and K.-S. Bae, J. Mater. Res., 1998, 13, 2945 CrossRef CAS.
- W.-C. Tzou, C.-F. Yang, Y.-C. Chen and P.-S. Cheng, J. Eur. Ceram. Soc., 2000, 20, 991 CrossRef CAS.
- D. Shihua, Y. Xi and Y. Yong, Ceram. Int., 2004, 30, 1195 CrossRef.
- O. A. Shlyakhtin and Y.-J. Oh, Int. J. Appl. Ceram. Technol., 2009, 6, 312 CrossRef CAS.
- S. Chattopadhyay, P. Ayyub, R. Pinto and M. Multani, J. Mater. Res., 1998, 13, 1113 CrossRef CAS.
- X. Dong, Z. Huangfu, S. Feng, Y. Liang, H. Zhang, X. Zhu, K. Yang, Z. Wang, X. Cheng and L. Su, Phys. Chem. Chem. Phys., 2022, 24, 20546 RSC.
- M. Subramanian and J. Calabrese, Mater. Res. Bull., 1993, 28, 523 CrossRef CAS.
- E. Keve and A. Skapski, J. Solid State Chem., 1973, 8, 159 CrossRef CAS.
- N. A. Zhuk, M. G. Krzhizhanovskaya, V. A. Belyy and B. A. Makeev, Inorg. Chem., 2019, 58, 1518 CrossRef CAS.
- C. Xu, D. He, C. Liu, H. Wang, L. Zhang, P. Wang and S. Yin, Solid State Commun., 2013, 156, 21 CrossRef CAS.
- C. Yu, G. Viola, D. Zhang, Z. Stroscio, Z. Hu, V. R. Eskilla, S. Grasso, R. M. Wilson, K. Zhou and N. Bonini, et al., Inorg. Chem., 2021, 60, 8507 CrossRef CAS.
- H.-F. Zhai, X. Qian, J.-Z. Kong, A.-D. Li, Y.-P. Gong, H. Li and D. Wu, J. Alloys Compd., 2011, 509, 10230 CrossRef CAS.
- N. Zhuk, V. Belyy, V. Lutoev, B. Makeev, S. Nekipelov, M. Yermolina and L. Feltsinger, J. Alloys Compd., 2019, 778, 418 CrossRef CAS.
- M. Bakiro, S. Hussein Ahmed and A. Alzamly, Chemistry, 2019, 1, 89 CrossRef.
- F. Litimein, R. Khenata, S. K. Gupta, G. Murtaza, A. Reshak, A. Bouhemadou, S. Bin Omran, M. Yousaf and P. K. Jha, et al., J. Mater. Sci., 2014, 49, 7809 CrossRef CAS.
- J. Yu and A. Kudo, Adv. Funct. Mater., 2006, 16, 2163 CrossRef CAS.
- A. Castro and D. Palem, J. Mater. Chem., 2002, 12, 2774 RSC.
- D. Zhou, H. Wang, X. Yao, L.-X. Pang and H.-F. Zhou, J. Am. Ceram. Soc., 2008, 91, 139 CAS.
- M. L. Alcântara, J. S. da Silva, R. O. Soares, H. M. Andrade, L. A. da Silva and A. J. Mascarenhas, Mater. Res. Bull., 2018, 103, 166 CrossRef.
- A. Gaikwad, S. Navale, V. Samuel, A. Murugan and V. Ravi, Mater. Res. Bull., 2006, 41, 347 CrossRef CAS.
- R. Radha, U. Gupta, V. Samuel, H. Muthurajan, H. Kumar and V. Ravi, Ceram. Int., 2008, 34, 1565 CrossRef CAS.
- Y. Min, F.-J. Zhang, W. Zhao, F. Zheng, Y. Chen and Y. Zhang, Chem. Eng. J., 2012, 209, 215 CrossRef CAS.
- K. S. Rao and S. Buddhudu, Ferroelectr. Lett., 2010, 37, 101 CrossRef CAS.
- A. Sleight and G. Jones, Acta Crystallogr., Sect. B: Struct. Crystallogr. Cryst. Chem., 1975, 31, 2748 CrossRef.
- Z. Zou, J. Ye, K. Sayama and H. Arakawa, Chem. Phys. Lett., 2001, 343, 303 CrossRef CAS.
- H.-F. Zhai, A.-D. Li, J.-Z. Kong, X.-F. Li, J. Zhao, B.-L. Guo, J. Yin, Z.-S. Li and D. Wu, J. Solid State Chem., 2013, 202, 6 CrossRef CAS.
- R. O. Jones, Rev. Mod. Phys., 2015, 87, 897 CrossRef.
- J. Nisar, B. Wang, B. Pathak, T. Kang and R. Ahuja, Appl. Phys. Lett., 2011, 99, 051909 CrossRef.
- K. Lai, Y. Zhu, Y. Dai and B. Huang, J. Appl. Phys., 2012, 112, 043706 CrossRef.
- R.-B. Luo, W. Zeng, Y.-D. Wu, W.-L. Jiang, B. Tang, M. Zhong and Q.-J. Liu, Mater. Sci. Semicond. Process., 2022, 140, 106391 CrossRef CAS.
- B. Wang, J. Nisar, C. G. Almeida, A. J. S. Mascarenhas, L. A. Silva, D. G. F. David, P. Bargiela, C. M. Araujo, R. Ahuja and A. Ferreira da Silva, Phys. Status Solidi B, 2014, 251, 1034 CrossRef CAS.
- W. Kohn and L. J. Sham, Phys. Rev., 1965, 140, A1133 CrossRef.
- G. Kresse and J. Furthmüller, Phys. Rev. B, 1996, 54, 11169 CrossRef CAS PubMed.
- G. Kresse and D. Joubert, Phys. Rev. B: Condens. Matter Mater. Phys., 1999, 59, 1758 CrossRef CAS.
- P. Giannozzi, S. Baroni, N. Bonini, M. Calandra, R. Car, C. Cavazzoni, D. Ceresoli, G. L. Chiarotti, M. Cococcioni and I. Dabo, et al., J. Phys.: Condens. Matter, 2009, 21, 395502 CrossRef PubMed.
- A. Jain, Y. Shin and K. A. Persson, Nat. Rev. Mater., 2016, 1, 1 Search PubMed.
- J. P. Perdew, K. Burke and M. Ernzerhof, Phys. Rev. Lett., 1996, 77, 3865 CrossRef CAS PubMed.
- D. M. Ceperley and B. J. Alder, Phys. Rev. Lett., 1980, 45, 566 CrossRef CAS.
- G. B. Bachelet, D. R. Hamann and M. Schlüter, Phys. Rev. B: Condens. Matter Mater. Phys., 1982, 26, 4199 CrossRef CAS.
- M. Bettega, L. Ferreira and M. Lima, Phys. Rev. A, 1993, 47, 1111 CrossRef CAS PubMed.
- G. Kresse and J. Hafner, J. Condens. Matter Phys., 1994, 6, 8245 CrossRef CAS.
- J. Heyd, G. E. Scuseria and M. Ernzerhof, J. Chem. Phys., 2003, 118, 8207 CrossRef CAS.
- A. V. Krukau, O. A. Vydrov, A. F. Izmaylov and G. E. Scuseria, J. Chem. Phys., 2006, 125, 224106 CrossRef PubMed.
- J. Paier, M. Marsman, K. Hummer, G. Kresse, I. C. Gerber and J. G. Ángyán, J. Chem. Phys., 2006, 124, 154709 CrossRef CAS PubMed.
- B. G. Janesko, T. M. Henderson and G. E. Scuseria, Phys. Chem. Chem. Phys., 2009, 11, 443 RSC.
- A. Stroppa and G. Kresse, Phys. Rev. B: Condens. Matter Mater. Phys., 2009, 79, 201201 CrossRef.
- M. Marsman, J. Paier, A. Stroppa and G. Kresse, J. Phys.: Condens. Matter, 2008, 20, 064201 CrossRef CAS PubMed.
- A. Stroppa and S. Picozzi, Phys. Chem. Chem. Phys., 2010, 12, 5405 RSC.
- J. P. Perdew, M. Ernzerhof and K. Burke, J. Chem. Phys., 1996, 105, 9982 CrossRef CAS.
- A. D. Becke, J. Chem. Phys., 1993, 98, 1372 CrossRef CAS.
- J. Paier, M. Marsman and G. Kresse, Phys. Rev. B: Condens. Matter Mater. Phys., 2008, 78, 121201 CrossRef.
- A. A. Mostofi, J. R. Yates, Y.-S. Lee, I. Souza, D. Vanderbilt and N. Marzari, Comput. Phys. Commun., 2008, 178, 685 CrossRef CAS.
- Y. Hou, S. Ardo and R. Wu, Phys. Rev. Mater., 2021, 5, 065801 CrossRef CAS.
- S. Ahmed, S. S. Nishat, A. Kabir, A. S. H. Faysal, T. Hasan, S. Chakraborty and I. Ahmed, Phys. B, 2021, 615, 413061 CrossRef CAS.
- S. Baroni, S. De Gironcoli, A. Dal Corso and P. Giannozzi, Rev. Mod. Phys., 2001, 73, 515 CrossRef CAS.
- F. Giustino, Rev. Mod. Phys., 2017, 89, 015003 CrossRef.
- S. Prosandeev, U. Waghmare, I. Levin and J. Maslar, Phys. Rev. B: Condens. Matter Mater. Phys., 2005, 71, 214307 CrossRef.
- T. Hasan, A. Saha, M. Khan, R. Rashid, M. Basith, M. S. Bashar and I. Ahmed, AIP Adv., 2022, 12, 095003 CrossRef CAS.
- J. Fardush Tanha, S. Farhad, U. Honey, N. Tanvir, T. Hasan, S. Shahriyar Nishat, A. Kabir, S. Ahmed, M. Hakim and M. Khan, et al., J. Appl. Phys., 2021, 130, 235107 CrossRef CAS.
- S. Ahmed, A. S. H. Faysal, M. Khan, M. Basith, M. S. Bashar, H. Das, T. Hasan and I. Ahmed, Results Phys., 2021, 31, 104940 CrossRef.
- B. Aurivillius, Ark. Kemi., 1951, 3, 153 CAS.
- R. Diehl, G. Brandt and E. Salje, Acta Crystallogr., 1978, 34, 1105 CrossRef.
- D. Zhou, H. Wang, X. Yao, X. Wei, F. Xiang and L. Pang, Appl. Phys. Lett., 2007, 90, 172910 CrossRef.
- H. Xu, H. Li, C. Wu, J. Chu, Y. Yan and H. Shu, Mater. Sci. Eng., B, 2008, 147, 52 CrossRef CAS.
- D. Zhou, C. Xu, D.-W. He, M.-S. Fu, J. Guo, H.-F. Zhou, L.-X. Pang and X. Yao, Scr. Mater., 2014, 81, 40 CrossRef CAS.
- Y. Liu, C. Xu, D. He, J. Zhang, Q. Hu and L. Qi, Solid State Commun., 2017, 265, 15 CrossRef CAS.
- M. Noor, F. Sharmin, M. Al Mamun, S. Hasan, M. Hakim and M. Basith, J. Alloys Compd., 2022, 895, 162639 CrossRef CAS.
- N. Wang, M.-Y. Zhao, Z.-W. Yin and W. Li, Mater. Lett., 2003, 57, 4009 CrossRef CAS.
- S. Devesa, M. Graça and L. Costa, Mater. Res. Bull., 2016, 78, 128 CrossRef CAS.
- A. Sales, P. Oliveira, J. Almeida, M. Costa, H. Rodrigues and A. Sombra, J. Alloys Compd., 2012, 542, 264 CrossRef CAS.
- R. Ullah, H. M. Ang, M. O. Tadé and S. Wang, J. Chem. Eng., 2012, 185, 328 CrossRef.
- H. Zhai, J. Kong, A. Wang, H. Li, T. Zhang, A. Li and D. Wu, Nanoscale Res. Lett., 2015, 10, 1 CrossRef CAS PubMed.
- G. Tang, H. Zhu, H. Yu, X. Cheng, R. Zheng, T. Liu, J. Zhang, M. Shui and J. Shu, J. Electroanal. Chem., 2018, 823, 245 CrossRef CAS.
- J. P. Perdew and M. Levy, Phys. Rev. Lett., 1983, 51, 1884 CrossRef CAS.
- L. J. Sham and M. Schlüter, Phys. Rev. Lett., 1983, 51, 1888 CrossRef.
- H. Xiao, J. Tahir-Kheli and W. A. Goddard III, J. Phys. Chem. Lett., 2011, 2, 212 CrossRef CAS.
- B. Wang, J. Nisar, B. Pathak, T. Kang and R. Ahuja, Appl. Phys. Lett., 2012, 100, 182102 CrossRef.
- F. D. Hardcastle and I. E. Wachs, Solid State Ionics, 1991, 45, 201 CrossRef CAS.
- C. Ramana, R. Smith and O. Hussain, Phys. Status Solidi A, 2003, 199, R4 CrossRef CAS.
- X. Wu, D. Vanderbilt and D. Hamann, Phys. Rev. B: Condens. Matter Mater. Phys., 2005, 72, 035105 CrossRef.
- S. Shang, Y. Wang and Z.-K. Liu, Appl. Phys. Lett., 2007, 90, 101909 CrossRef.
- F. Mouhat and F.-X. Coudert, Phys. Rev. B: Condens. Matter Mater. Phys., 2014, 90, 224104 CrossRef.
- R. Hill, Proc. Phys. Soc., London, Sect. A, 1952, 65, 349 CrossRef.
- H. Dong, C. Chen, S. Wang, W. Duan and J. Li, Appl. Phys. Lett., 2013, 102, 182905 CrossRef.
- M. Yaakob, M. Taib, M. Deni, A. Chandra, L. Lu and M. Yahya, Ceram. Int., 2013, 39, S283 CrossRef CAS.
- S. Pugh and Lond. Edinb, London, Edinburgh Dublin Philos. Mag. J. Sci., 1954, 45, 823 CrossRef CAS.
- L. Xie and J. Zhu, J. Am. Ceram. Soc., 2012, 95, 3597 CrossRef CAS.
- P. Ghosez, J.-P. Michenaud and X. Gonze, Phys. Rev. B: Condens. Matter Mater. Phys., 1998, 58, 6224 CrossRef CAS.
- P. Ghosez, X. Gonze, P. Lambin and J.-P. Michenaud, Phys. Rev. B: Condens. Matter Mater. Phys., 1995, 51, 6765 CrossRef CAS PubMed.
- S.-G. Ma, T. Gao, S.-C. Li, X.-J. Ma, Y.-H. Shen and T.-C. Lu, Fusion Eng. Des., 2016, 113, 324 CrossRef CAS.
- W. Zhong, R. King-Smith and D. Vanderbilt, Phys. Rev. Lett., 1994, 72, 3618 CrossRef CAS PubMed.
- S. Ahmed, T. Hasan, A. S. H. Faysal, S. S. Nishat, M. Khan, A. Kabir and I. Ahmed, Comput. Mater. Sci., 2022, 214, 111743 CrossRef CAS.
- W. A. Harrison, Electronic structure and the properties of solids: the physics of the chemical bond, Courier Corporation, 2012 Search PubMed.
- I. Merad Boudia, A. Reshak, T. Ouahrani and Z. Bentalha, J. Appl. Phys., 2013, 113, 083505 CrossRef.
- T. Ouahrani, A. H. Reshak, A. O. de La Roza, M. Mebrouki, V. Luaña, R. Khenata and B. Amrani, Eur. Phys. J. B, 2009, 72, 361 CrossRef CAS.
- M. Dresselhaus, G. Dresselhaus, S. B. Cronin, and A. G. Souza Filho, Solid State Properties, Springer, 2018 Search PubMed.
- V. Popolitov, A. Lobachev and V. Peskin, Ferroelectrics, 1982, 40, 9 CrossRef CAS.
- Y. Tsujimi, M. Jang, Y. Yu and T. Yagi, Ferroelectr., Lett. Sect., 1994, 17, 33 CrossRef CAS.
- K. M. Wong, Results Phys., 2017, 7, 1308 CrossRef.
Footnote |
| † Electronic supplementary information (ESI) available: EDX analysis, and DFT benchmarked FTIR peak assignments for both α-BNO and β-BNO. It also contains electronic density of states and band structure simulations of α-BNO and β-BNO polymorphs using HSE06 functional. Moreover, some of the HSE06 derived optical properties of both polymorphs are also presented in it. The photocatalytic degradation efficiency and reaction rate analysis are also presented near the end. See DOI: https://doi.org/10.1039/d2ra07910k |
|
| This journal is © The Royal Society of Chemistry 2023 |
Click here to see how this site uses Cookies. View our privacy policy here.  Open Access Article
 a,
Sadiq Shahriyar Nishat
 b,
Shahran Ahmed
 a,
Quazi Shafayat Hossain
 a,
M. N. I. Khan
 c,
Tarique Hasan
 d,
Muhammad Shahriar Bashar
 e,
A. K. M. Sarwar Hossain Faysal
 a,
Ishtiaque M. Syed
 fgh,
Khandker Saadat Hossain
 i,
Sakhawat Hussain
 a,
Md. Mosaddek Khan
 j and
Imtiaz Ahmed
 *a
*a
![[1 with combining macron]](https://www.rsc.org/images/entities/char_0031_0304.gif) crystal symmetries along with their respective phase purity have been confirmed from Rietveld refinement of the powdered X-ray diffraction measurements in combination with generalized gradient approximation of Perdew–Burke–Ernzerhof (GGA-PBE) based DFT simulations. The scanning electron micrographs revealed average grain sizes to be 500 nm and 1 μm for α-BNO and β-BNO respectively. The energy-dispersive X-ray spectroscopy identified the Bi, Nb, and O with proper stoichiometry. The phase purity of the as-synthesized samples was further confirmed by comparing the local density approximation (LDA) norm-conserving pseudo-potential based DFT-simulated Raman peaks with that of experimentally measured ones. The relevant bond vibrations detected in Fourier transform infrared spectroscopy were matched with GGA-PBE derived phonon density of states simulation for both polymorphs. The structural stability and the charge dynamics of the polymorphs were verified from elastic stress and born charge tensor simulations respectively. The dynamical stability of the α-BNO was confirmed from phonon band structure simulation using density functional perturbation theory with Heyd–Scuseria–Ernzerhof (HSE06) hybrid functional. The electronic band gaps of 3.08 and 3.36 eV for α-BNO and β-BNO measured from UV-Vis diffuse reflectance measurements were matched with the sophisticated HSE06 band structure simulation by adjusting the Hartree–Fock exchange parameter. Both GGA-PBE and HSE06 functional were used to simulate complex dielectric function and its derivatives with the help of Fermi's golden rule to define the optical properties in the linear regime. All these may have provided a rigorous theoretical analysis for the experimentally synthesized α-BNO and β-BNO polymorphs.
crystal symmetries along with their respective phase purity have been confirmed from Rietveld refinement of the powdered X-ray diffraction measurements in combination with generalized gradient approximation of Perdew–Burke–Ernzerhof (GGA-PBE) based DFT simulations. The scanning electron micrographs revealed average grain sizes to be 500 nm and 1 μm for α-BNO and β-BNO respectively. The energy-dispersive X-ray spectroscopy identified the Bi, Nb, and O with proper stoichiometry. The phase purity of the as-synthesized samples was further confirmed by comparing the local density approximation (LDA) norm-conserving pseudo-potential based DFT-simulated Raman peaks with that of experimentally measured ones. The relevant bond vibrations detected in Fourier transform infrared spectroscopy were matched with GGA-PBE derived phonon density of states simulation for both polymorphs. The structural stability and the charge dynamics of the polymorphs were verified from elastic stress and born charge tensor simulations respectively. The dynamical stability of the α-BNO was confirmed from phonon band structure simulation using density functional perturbation theory with Heyd–Scuseria–Ernzerhof (HSE06) hybrid functional. The electronic band gaps of 3.08 and 3.36 eV for α-BNO and β-BNO measured from UV-Vis diffuse reflectance measurements were matched with the sophisticated HSE06 band structure simulation by adjusting the Hartree–Fock exchange parameter. Both GGA-PBE and HSE06 functional were used to simulate complex dielectric function and its derivatives with the help of Fermi's golden rule to define the optical properties in the linear regime. All these may have provided a rigorous theoretical analysis for the experimentally synthesized α-BNO and β-BNO polymorphs.![[1 with combining macron]](https://www.rsc.org/images/entities/char_0031_0304.gif) derived triclinic β-BNO (∼1150 °C), (iii) the Cmc2 group symmetry defined orthorhombic γ-BNO (∼1055 °C) and (iv) the high pressure (HP) cubic HP-BNO with the symmetry group Fd
derived triclinic β-BNO (∼1150 °C), (iii) the Cmc2 group symmetry defined orthorhombic γ-BNO (∼1055 °C) and (iv) the high pressure (HP) cubic HP-BNO with the symmetry group Fd![[3 with combining macron]](https://www.rsc.org/images/entities/char_0033_0304.gif) m (∼800 °C).23–27 The occurrence and the evolution of phase transition among these BNO polymorphs are intimately linked with experimentally controllable parameters such as temperature, pressure, pH level, and extrinsic defects.23,26,26,28–31 Moreover, the electronic and optical properties of these different polymorphs of BNO vary, making its detailed study a topic of great scientific interest. The common crystallographic building blocks of all these BNO polymorphs are the BiO6 and NbO6 octahedra, but the difference in their orchestration germinates the observed variation in physical properties.23 For example, both α-BNO and β-BNO consist of corner-sharing niobate octahedral sheet stack separated by Bi3+ ions, with the difference being the latter having corrugation in the stacking layer.28 This affects the relevant orbital energies of Bi-6s and O-2p orbitals relevant to the valence band (VB) of the BNO, making the electronic band gap of α-BNO smaller than that of β-BNO.11,23,32 The corrugation also yields higher crystallographic density in β-BNO compared to that of α-BNO. Moreover, the BNO crystal structure contains corner-shared NbO6 groups which support large polarization deformation resulting in excellent microwave dielectric properties.15 Also, the charge transfer transition in NbO6 octahedra in combination with Bi3+ spin–orbit coupling originate blue luminescence in β-BNO under UV and X-ray illumination.33
m (∼800 °C).23–27 The occurrence and the evolution of phase transition among these BNO polymorphs are intimately linked with experimentally controllable parameters such as temperature, pressure, pH level, and extrinsic defects.23,26,26,28–31 Moreover, the electronic and optical properties of these different polymorphs of BNO vary, making its detailed study a topic of great scientific interest. The common crystallographic building blocks of all these BNO polymorphs are the BiO6 and NbO6 octahedra, but the difference in their orchestration germinates the observed variation in physical properties.23 For example, both α-BNO and β-BNO consist of corner-sharing niobate octahedral sheet stack separated by Bi3+ ions, with the difference being the latter having corrugation in the stacking layer.28 This affects the relevant orbital energies of Bi-6s and O-2p orbitals relevant to the valence band (VB) of the BNO, making the electronic band gap of α-BNO smaller than that of β-BNO.11,23,32 The corrugation also yields higher crystallographic density in β-BNO compared to that of α-BNO. Moreover, the BNO crystal structure contains corner-shared NbO6 groups which support large polarization deformation resulting in excellent microwave dielectric properties.15 Also, the charge transfer transition in NbO6 octahedra in combination with Bi3+ spin–orbit coupling originate blue luminescence in β-BNO under UV and X-ray illumination.33![[2 with combining macron]](https://www.rsc.org/images/entities/char_0032_0304.gif) ), (1
), (1![[2 with combining macron]](https://www.rsc.org/images/entities/char_0032_0304.gif) 0), (11
0), (11![[2 with combining macron]](https://www.rsc.org/images/entities/char_0032_0304.gif) ), (120), (200), (022), (2
), (120), (200), (022), (2![[2 with combining macron]](https://www.rsc.org/images/entities/char_0032_0304.gif)
![[2 with combining macron]](https://www.rsc.org/images/entities/char_0032_0304.gif) ) and (1
) and (1![[4 with combining macron]](https://www.rsc.org/images/entities/char_0034_0304.gif) 0) as per the JCPDS no. 71-1518 conform with the triclinic structure of β-BNO with the space group P
0) as per the JCPDS no. 71-1518 conform with the triclinic structure of β-BNO with the space group P![[1 with combining macron]](https://www.rsc.org/images/entities/char_0031_0304.gif) (2).15,25,27–29,31,48,87,90 The relevant crystallographic parameters and bond lengths for both α-BNO and β-BNO were extracted from the Rietveld refinement and are displayed in Table 1. The estimated parameters for α-BNO (β-BNO) are a = 5.683 Å, b = 11.717 Å and c = 4.986 Å (a = 7.619 Å, b = 5.540 Å and c = 7.933 Å) are in excellent agreement with that of standard values to be found in ref. 26, 28 and 89 and confirms the phase purity of the as-synthesized samples. In the case of α-BNO, the Nb–O bond lengths dNb–O in the corner sharing distorted NbO6 octahedra vary from 1.879 to 2.206 Å, whereas the Bi–O bond lengths dBi–O in the four-pyramidal structure reside within the range of 2.164 to 2.295 Å.28 For β-BNO, the distorted NbO6 octahedra are corrugated in which the dNb–O stays within 1.797 to 2.296 Å. The Bi atoms form both trigonal and four-pyramidal geometry with the O atom resulting in dBi–O in the range 2.124 to 2.644 Å.26
(2).15,25,27–29,31,48,87,90 The relevant crystallographic parameters and bond lengths for both α-BNO and β-BNO were extracted from the Rietveld refinement and are displayed in Table 1. The estimated parameters for α-BNO (β-BNO) are a = 5.683 Å, b = 11.717 Å and c = 4.986 Å (a = 7.619 Å, b = 5.540 Å and c = 7.933 Å) are in excellent agreement with that of standard values to be found in ref. 26, 28 and 89 and confirms the phase purity of the as-synthesized samples. In the case of α-BNO, the Nb–O bond lengths dNb–O in the corner sharing distorted NbO6 octahedra vary from 1.879 to 2.206 Å, whereas the Bi–O bond lengths dBi–O in the four-pyramidal structure reside within the range of 2.164 to 2.295 Å.28 For β-BNO, the distorted NbO6 octahedra are corrugated in which the dNb–O stays within 1.797 to 2.296 Å. The Bi atoms form both trigonal and four-pyramidal geometry with the O atom resulting in dBi–O in the range 2.124 to 2.644 Å.26
![[1 with combining macron]](https://www.rsc.org/images/entities/char_0031_0304.gif)


 , ω = angular frequency of the optical excitation). The dipole transition matrix elements were derived from BS simulation for both GGA-PBE and HSE06 functionals in cases of α-BNO and β-BNO to calculate the εimag. The standard Kramer–Kronig relations were used to estimate εreal from εimag.71,109,111,112 The optical response is characterized by parameters like absorption coefficient α, reflectivity R, energy loss function L, refractive index η, extinction coefficient K, and optical conductivity σ derived from ε(ω).113 All aforementioned quantities are averaged over three orthogonal polarization directions Ex, Ey and Ez along spatial x, y, and z coordinates. In the ω → 0 limit, the GGA-PBE based εreal in Fig. 13(a) attained 6.21 (6.65) in case of α-BNO (β-BNO) which are clear overestimation of the experimentally measured value of 4.4 in ref. 114. The HSE06 corrects this overestimation by providing 5.6 (α-BNO) and 4.82 (β-BNO) with αHH of 2% and 20% respectively. The εimag embodies the electronic transitions in response to optical excitation. The dominant peaks below 8 eV mark the electronic transition from O-2p in VB to Nb-4d in CB. The energy cut-off Ecut below which εimag vanishes in Fig. 13(b) are consistent with the estimated Eg measured from GGG-PBE and HSE06 functionals. Moreover, HSE06 shifts significantly the peaks εimag to higher energy (6 eV) as it corrects the GGA-PBE (4.8 eV) underestimated Eg. The HSE06 functional, as it tunes the Eg, shifts the energy threshold beyond which absorption steeply shoots up as shown in Fig. 13(c). The GGA-PBE derived refractive index η turned out to be 2.5 (α-BNO) and 2.6 (β-BNO) as depicted in Fig. 13(d). The HSE06 results in an η of 2.4 and 2.2 as compared to that of experimentally measured values of 2.5 and 2.2 in ref. 114 and 115. The optical losses L due to fast charge carrier movement116 emerging beyond the Ecut as expected, see Fig. S4(a).† The extinction coefficient K increases from zero near the Ecut where the peaks near 4.5 and 6.5 eV mark the emergence of plasmonic resonance as shown in Fig. S4(b).† Both polymorphs are relatively transparent in the static limit with reflectance below 20% as shown in Fig. S4(c).† The broad summit peaks near 4.5 and 6.5 eV coincide with optical resonances in the sample. The optical conductivity σ defined by σ = ωεimag in Fig. S4(d)† shares similar features like conductivity threshold and peak positions in energy to those of εimag as expected.


