 Open Access Article
A highly efficient metal oxide incorporated metal organic framework [Nd2O3-MIL(Fe)-88A] for the electrochemical detection of dichlorvos†
Mariyammal Narayanana,
Narendra Pal Singh Chauhan b and
Panneerselvam Perumal
 *a
*a
aDepartment of Chemistry, SRM Institute of Science and Technology, Kattankulathur, 603 203, Tamil Nadu, India. E-mail: panneerp1@srmist.edu.in; panneerchem82@gmail.com; Tel: +91 9688538842
bDepartment of Chemistry, Faculty of Science, Bhupal Nobles University, Udaipur, 313002, Rajasthan, India
First published on 14th February 2023
Abstract
In this study, a Nd2O3@MIL(Fe)-88A composite was prepared through a hydrothermal method and used to detect dichlorvos. The XRD result demonstrated that the prepared sensor is highly crystalline in nature. The affinity of metal oxide and MIL(Fe)-88A could be utilised to overcome low stability and sensitivity owing to their synergistic and electronic effects. Differential pulse voltammetry (DPV) exhibits the electrocatalytic behaviour of Nd2O3@MIL(Fe)-88A; it functions at a lower potential at −0.5 to 0.8 V and has a wide linear range of 1–250 nM. It shows a very low detection limit of 0.92 nM with good sensitivity (4.42 mA nM−1) and selectivity. The developed Nd2O3@MIL(Fe)-88A sensor was successfully applied to detect dichlorvos in real analysis. The recovery range calculated for cabbage and orange extracts was 96–97% and 99.5–103.4%, respectively, and RSD% calculated for cabbage and orange extracts was from 1.40 to 3.39% and from 0.64 to 2.26%, respectively.
1. Introduction
Organophosphorus (OP) pesticides are extremely hazardous substances that are widely utilized in agriculture due to their potent insecticidal effects and quick environment mineralization.1 Dichlorvos (DDVP; 2,2-dichlorovinyl dimethyl phosphate) is an industrial pesticide with an organophosphate dominating structure used in pulverization and food processing sectors to control domestic insects. It operates on acetylcholinesterase, a protein connected to the insect's nervous system and efficiently damages its neurological framework.2 As a result, it is frequently used to eradicate pests including cockroaches, aphids, mosquitoes, caterpillars, and mushroom flies.3 It has several negative effects on the human body, including cyanosis, paralysis, ataxia, convulsions, headaches, thorax constriction, dyspnoea, poor eyesight, ocular as well as dermal rawness, nasal congestion, queasiness, and diarrhoea.4,5 Moreover, research reports have shown that children are affected with attention deficit hyperactivity disorder by organophosphate metabolites.6,7 As a result, the World Health Organization (WHO) has classed DDVP as very dangerous and is declared illegal in the European Union (EU).8,9 Currently, numerous instrumental and spectroscopic methods have been discovered for DDVP detection, including fluorescence, enhanced-functionality liquid chromatography, spectrophotometry, mass spectrometry, and other approaches.10–12 However, these methods still have several drawbacks, including being time consuming as well as high-cost issues. In addition, they include elaborate operational procedures that need highly qualified staff.13–19 Nevertheless, researchers are focusing their attention on improving good detection methods that are expedient, inexpensive, faster, reliable, and more selective. Due to its advantages over the methods mentioned above, the electrochemical sensor has recently attracted the attention of numerous researchers for studying the detection of DDVP. Low limit of detection, relative simplicity, reproducibility, quick analysis, competitive prices, accessibility, and high sensitivity are all features of the sensor.20–22 Furthermore, DPV based electrochemical sensors are extremely sensitive in the determination of very trace amount of pollutants.23,24In the past ten years, researchers have been interested in metal–organic frameworks, which are porous crystalline solids made up of secondary building unit (SBU) metal-containing nodes, and bridging ligands. Due to the variety of their functional groups on the frameworks, metal organic frameworks (MOFs) exhibit higher chemical tailorability as compared to other porous materials including zeolites, active carbon, and mesoporous silica. To be more precise, the final material's structure and characteristics are directly impacted by the choice of both elements.25,26 Various factors in the synthesis process may be changed to achieve the required qualities in addition to having the capacity to carefully choose and substitute the primary building blocks from among a huge range of metal ions and organic ligands. Due to their distinctive adjustable characteristics, MOFs have the potential to be used in a variety of processes, including hydrogen storage, gas separation, catalysis, molecular identification, biological applications, etc.26–28 The MIL family of MOFs developed by S. Chevalier and co-workers,29 which is composed of trivalent metal centers and carboxylate bridging ligands, has drawn a lot of interest due to its improved stability, tremendous porosity, and extremely large pores. The MIL(Fe)-88A nanostructure is made up of biocompatible components. As a result, MIL(Fe)-88A is a very promising material for biological and environmental fields.30 Its three-dimensional system of interconnected pores and cages is based on oxo-centered trimers of iron(III) octahedra coupled by the fumarate linker.31,32
The metal oxide nanoparticles exhibit several unique qualities, such as the capacity to adsorb biomolecules in solution while being hard, inert, and having a large electrocatalytic surface area.33,34 All of these attributes may contribute to synergistic electron transport between biomolecules and the electrode with a decrease in overpotential. The series of rare earth metal oxides includes neodymium oxide (Nd2O3), an essential, abundantly reactive element that occurs naturally. It has a variety of uses in magnetic devices, catalysts, and dielectrics. The electrical characteristics of materials have been improved by the introduction of conductive fillers and dopants like Nd2O3.35 A synergistic electron transfer from the aforementioned biomolecules and vice versa can occur when neodymium oxide (Nd2O3) is dissolved in a solution and has an excellent adsorption property. The combinations of two different metal oxides can be utilized to overcome low sensitivity, and poor stability due to the synergistic effect and the electronic effect. The electrical characteristics of materials have been improved by the combination of metals oxides.36 Due to the advantages of both materials, we selected MIL(Fe)-88A and Nd2O3 as combined together to prepare the sensing material.
In this work, a simple electrochemical strategy was proposed with an electrode modified by a Nd2O3@MIL(Fe)-88A composite. The MOF and the metal oxide were successfully merged and used for the electrochemical detection of DDVP. The composite material has large surface area, which can be able to adsorb DDVP easily. The Nd2O3@MIL(Fe)-88A composite coated GC electrode shows a high sensitivity, low detection limit, wide linear range, excellent repeatability, stability, and high precision towards DDVP. The composite material (Nd2O3@MIL(Fe)-88A) contains abundant active surface area compared to Nd2O3 and MIL(Fe)-88A for DDVP adsorption and demonstrates excellent detection performance. In addition, the repeatability and anti-interference ability of modified electrodes for DDVP detection were investigated and they were used to detect DDVP in actual real samples of orange and purple cabbage extracts. The findings indicate that the Nd2O3 @MIL(Fe)-88A nanostructure sensor shows significant promise for electrochemical DDVP detection in food samples.
2. Experimental Details
2.1. Chemicals & reagents
Fumaric acid (99%), ferric chloride (99%), neodymium nitrate hexahydrate (99.9%), ethanol (EtOH, AR), sodium phosphate dibasic (AR), sodium phosphate monobasic (AR), and potassium ferricyanide (AR) were purchased from Sigma-Aldrich. Double distilled water (DDW) was used throughout the whole study. All additional chemicals and solvents were of analytical grade, readily available on the market, and used without further purification.2.2. Instruments
Cyclic Voltammetry (CV) and Differential Pulse Voltammetry (DPV) experiments were carried out using a Biologic electrochemical workstation (SP-300). A three-electrode setup was utilized. These electrodes are traditional. In fact, a modified glassy carbon electrode functioned as the working electrode (GCE, 3 mm in diameter), and the reference and auxiliary electrodes were Ag/AgCl and platinum, respectively. In all the experiments, the distance between the electrodes was kept at 0.5 cm. X-ray photoelectron spectroscopy (XPS) (Physical Electronics: PerkinElmer Phi 1600 ESCA) with magnesium as the source of radiation was used to detect the composition and elemental state of Nd2O3@MIL(Fe)-88A. X-Ray diffraction data were collected on a BRUKER USA D8 Advance Davinci diffractometer with Cu Kα radiation between 5 and 90°. A high-resolution scanning electron microscope (Thermo Scientific Apreo S) was used to study the morphological appearance of Nd2O3@MIL(Fe)-88A at 20 kV, and a high resolution-transmission electron microscope (make: JEOL Japan, JEM-2100 Plus) was utilized to examine the internal morphological characteristics. The energy-dispersive X-ray spectroscopy (EDXS) system of ISIS300 was used to identify the profile of elements such as neodymium, iron, carbon, and oxygen on the Nd2O3@MIL(Fe)-88A surface. The stretching frequency of functional groups was observed using Fourier Transform-Infrared (FT-IR) spectroscopy with an operating range of 400–4000 cm−1(SHIMADZU, IRTRACER 100).2.3. Synthesis of Nd2O3 nanoparticles
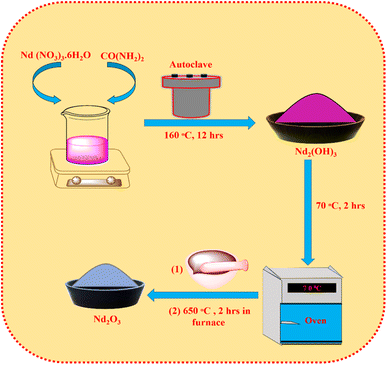
To synthesise Nd2O3 nanoparticles (NPs), 4.5 g of CO(NH2)2 and 0.5 g of Nd (NO3)3·6H2O are dissolved in 120 mL deionized water. Then the mixture was transferred into a Teflon-lined autoclave made of stainless steel and the solution was heated up to 160 °C for 12 hours. At the end of the hydrothermal reaction, the solution was allowed to cool naturally. The centrifuge was spun to separate the precipitates at 6000 rpm. The precipitates were gradually rinsed in ethanol and deionized water. The hydrothermally produced product Nd2(OH)3 was then dried for 2 hours at 70 °C in an oven. The recovered sample was first crushed into powder using an agate mortar, and then the mixture was annealed at 650 °C for 2 hours in a muffle furnace to create whitish-brown Nd2O3 NPs (Scheme 1).2.4. Synthesis of Nd2O3@MIL(Fe)-88A
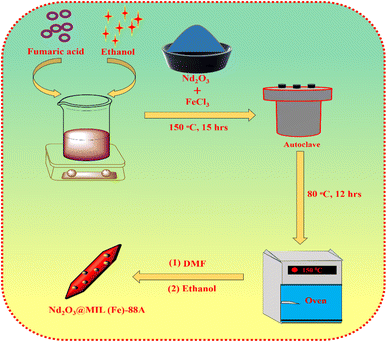
The metal oxide @ MOF (Nd2O3@MIL(Fe)-88A) is successfully synthesised via the hydrothermal method (Scheme 2). Firstly, the Nd2O3 NPs were sonicated in 10 mL of DMF (solution A). In another beaker, 4.5 mL of ethanol was added to 1.949 g of fumaric acid (solution B). Following that, solution A was poured into the beaker containing solution B. The resulting solution was gradually added with 4.544 g of ferric chloride and stirred in a magnetic stirrer for 1 hour. Then the hydrothermal step was carried out in a Teflon-lined autoclave (50 mL) at 150 °C for 15 hours. A product was formed and washed with DMF and ethanol, and then dried for at least 12 hours at 80 °C to get pure Nd2O3@MIL(Fe)-88A powder. Finally, the neodymium oxide was successfully deposited on the surface of MIL(Fe)-88A to form the Nd2O3@MIL(Fe)-88A composite. In this synthesis process 10% Nd2O3 was merged with MIL(Fe)-88A to synthesise Nd2O3@MIL(Fe)-88A.2.5. Fabrication of the Nd2O3@MIL(Fe)-88A modified electrode
Before electrochemical testing, the glassy carbon electrode (GCE) was carefully polished with alumina powder and then sonicated with ethyl alcohol and distilled water. Afterward, 8 μL of pre-prepared ethanol dispersed 0.2 mg of Nd2O3@MIL(Fe)-88A composite material was directly coated on the surface of the GCE. Then, the GCE was dried in a hot air oven. As a result, a consistent layer-coated electrode (Nd2O3@MIL(Fe)-88A/GCE) was formed. The prepared material fabricated GCE is the sensing probe and it was used as a working electrode for the following studies (Scheme 3a). The electrocatalytic performance toward DDVP sensing towards real samples is shown in Scheme 3b.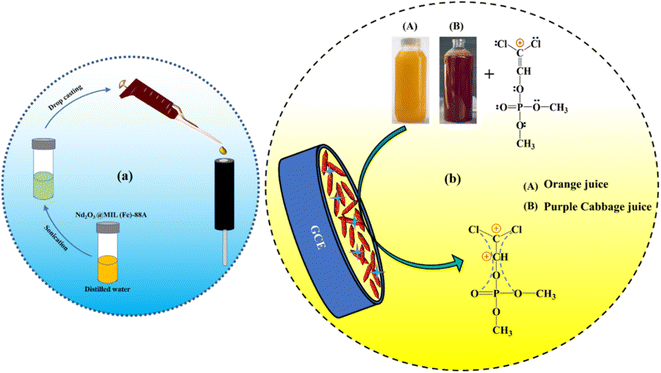 | ||
| Scheme 3 (a) Fabrication of Nd2O3@MIL(Fe)-88A and (b) the electrocatalytic performance toward DDVP sensing in real samples. | ||
3. Results and Discussion
3.1. Characterization of Nd2O3@MIL(Fe)-88A
We evaluated the crystallinity of the hybrid Nd2O3@MIL(Fe)-88A nanostructure using XRD and FT-IR (Fig. 1a and b). Fig. 1a shows the XRD spectra of Nd2O3, MIL(Fe)-88A, and Nd2O3@MIL(Fe)-88A and the existence of sharp diffraction peaks confirms the crystalline properties of the obtained products. The diffraction peak of pure hexagonal phase of Nd2O3 appears at 2θ = 26.9°, 29.7°, 30.7°, 39.5°, 47.5°, 52.4°, 57.5° and 61.8° (JCPDS No. 01-072-8425) shown in Fig. 1a(I).37 MIL(Fe)-88A has strong diffraction peaks at 2θ = 7.0°, 8.7°, 10.4°,11° and 12.9° shown in Fig. 1a(II).38 However, with the introduction of Nd2O3, the intensity of diffraction peaks of MIL(Fe)-88A changes. It can be inferred that the introduction of Nd2O3 has a certain function in controlling the crystal orientation of MIL(Fe)-88A. It shows that doping Nd2O3 may change the dominant crystal plane exposed by the material. Therefore, the hexagonal phase of Nd2O3 was well indexed to MIL(Fe)-88A nanocrystals with highly crystalline nature appearing at 2θ = 7.0°, 8.7°, 10.4°,11°,12.9°, 26.9°, 29.7°, 30.7°, 39.5°, 47.5°, 52.4°, 57.5°, and 61.8° shown in Fig. 1a(III).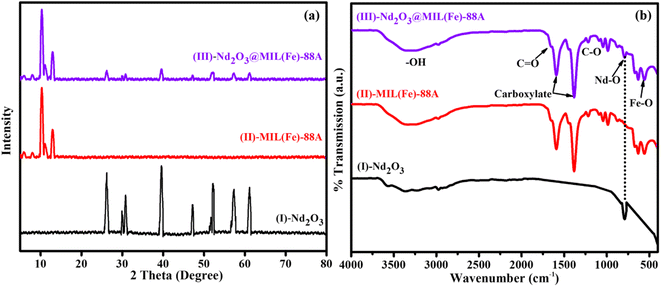 | ||
| Fig. 1 (a) XRD patterns of Nd2O3-(I), MIL(Fe)-88A-(II), and Nd2O3@MIL(Fe)-88A-(III) and (b) FTIR spectra of Nd2O3-(I), MIL(Fe)-88A-(II), and Nd2O3@MIL(Fe)-88A-(III). | ||
The FTIR spectra of Nd2O3@MIL(Fe)-88A show the prominent peaks appearing at 3461 cm−1, 1680 cm−1, 1600 cm−1, 1380 cm−1, 1218 cm−1, 749 cm−1 and 561 cm−1 shown in Fig. 1b(III). The FTIR spectra of MIL(Fe)-88A are shown in Fig. 1b(II). The carboxyl group of fumarates served as the bridging ligand of the MOF, producing the absorption peaks at about 1380 and 1600 cm−1 in symmetric and asymmetric vibration modes, respectively.39,40 The two peaks at 1218 and 1680 cm−1 indicate the presence of stretching of C–O mode and C![[double bond, length as m-dash]](https://www.rsc.org/images/entities/char_e001.gif) O mode linkages of carboxylic acids, respectively.41 The maximum intensity peak that appeared at 3461 cm−1 corresponds to the –OH stretching frequency, which is typical, whether existing in the molecular structure or due to water adsorption41 and 561 cm−1 (Fe–O) is due to the stretching frequency of the metal–oxygen bond.42 The FTIR spectra of Nd2O3 are shown in Fig. 1b(I). The peak appearing at 749 cm−1 corresponds to the Nd–O bond stretching frequency and 3461 cm−1 corresponds to traces of O–H present in the sample due to atmospheric water molecules.43
O mode linkages of carboxylic acids, respectively.41 The maximum intensity peak that appeared at 3461 cm−1 corresponds to the –OH stretching frequency, which is typical, whether existing in the molecular structure or due to water adsorption41 and 561 cm−1 (Fe–O) is due to the stretching frequency of the metal–oxygen bond.42 The FTIR spectra of Nd2O3 are shown in Fig. 1b(I). The peak appearing at 749 cm−1 corresponds to the Nd–O bond stretching frequency and 3461 cm−1 corresponds to traces of O–H present in the sample due to atmospheric water molecules.43
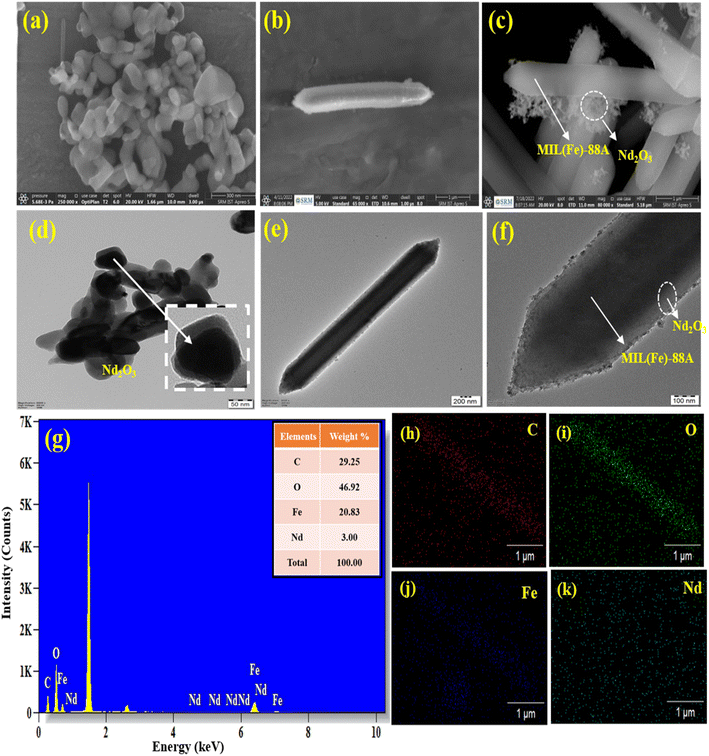
The outer surface morphology of Nd2O3@MIL(Fe)-88A was investigated by using HR-SEM as shown in Fig. 2. The Fig. 2a shows that the Nd2O3 NPs is in the form of clusters and aggregated state. The outer surface morphology of MIL(Fe)-88A in the shape of a hexagonal rod is shown in Fig. 2b. The Nd2O3 NPs were well settled on the hexagonal rod surface of the MIL(Fe)-88A as shown in Fig. 2c. According to the SEM images of Nd2O3 and MIL(Fe)-88A, the particle size was calculated. The average particle size of Nd2O3, and MIL(Fe)-88A was 11.8 and 50.6 nm, respectively. Further the inner morphology of Nd2O3, MIL(Fe)-88A, and Nd2O3@MIL(Fe)-88A was investigated by using HR-TEM. In the HR-TEM images, the Nd2O3 nanoparticles are in a cluster form at the magnification of 50 nm (Fig. 2d). Fig. 2e shows the internal morphology of MIL(Fe)-88A at the magnification of 200 nm. Fig. 2f shows an internal view of Nd2O3@MIL(Fe)-88A at the magnification of 100 nm. This image shows that Nd2O3 NPs were well settled on the MIL(Fe)-88A with highly crystalline nature. Furthermore, the EDX spectra of Nd2O3@MIL (Fe)-88A with weight percentage are shown in Fig. 2g, which confirms the existence of Nd, Fe, O, and C in the Nd2O3@MIL(Fe)-88A structure. Besides, the mapping of elements also approves the distribution of the elements Nd, Fe, O, and C present in Nd2O3@MIL (Fe)-88A, as shown in Fig. 2(h–k). Finally, we conclude that the Nd2O3 NPs are successfully deposited on the MIL(Fe)-88A structure.
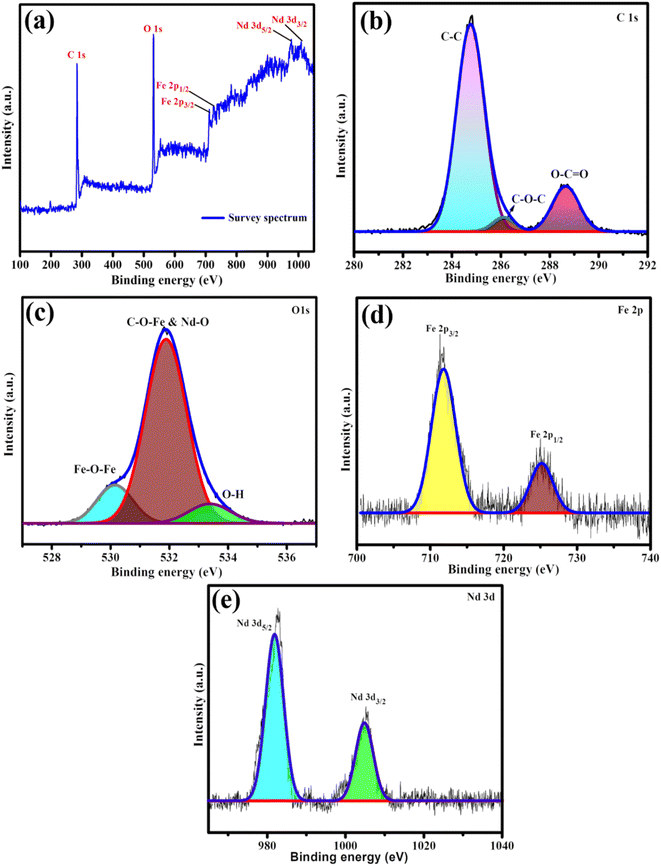
The electronic structure of the Nd2O3@MIL(Fe)-88A was characterized by using XPS as shown in Fig. 3. The survey spectrum (Fig. 3a) of Nd2O3@MIL(Fe)-88A obviously reveals the existence of C, O, Fe, and Nd elements. There are no contaminants or extra elements in the survey spectrum, suggesting that the sample is pure. The high-resolution carbon (1s) spectra (Fig. 3b) were deconvoluted into three peaks at 288.5, 286.1 and 284.6 eV, corresponding to O–C![[double bond, length as m-dash]](https://www.rsc.org/images/entities/char_e001.gif) O, C–O–C and C–C, respectively.40,44 The O 1s displayed in Fig. 3c at 533.4, 531.9 and 530.1 eV corresponds to O–H, C–O–Fe & Nd–O and Fe–O–Fe, respectively.44,45 The Fe 2p core-level spectra of Nd2O3@MIL (Fe)-88A are depicted in Fig. 3d, and they reveal two distinct peaks at 725.3 and 712.0 eV, which stand for the binding energies of Fe 2p1/2 and Fe 2p3/2, respectively.44,46 The spin–orbit peaks for Nd 3d5/2 and Nd 3d3/2 are oriented at 982.5 and 1004.1 eV, respectively45 (Fig. 3e).
O, C–O–C and C–C, respectively.40,44 The O 1s displayed in Fig. 3c at 533.4, 531.9 and 530.1 eV corresponds to O–H, C–O–Fe & Nd–O and Fe–O–Fe, respectively.44,45 The Fe 2p core-level spectra of Nd2O3@MIL (Fe)-88A are depicted in Fig. 3d, and they reveal two distinct peaks at 725.3 and 712.0 eV, which stand for the binding energies of Fe 2p1/2 and Fe 2p3/2, respectively.44,46 The spin–orbit peaks for Nd 3d5/2 and Nd 3d3/2 are oriented at 982.5 and 1004.1 eV, respectively45 (Fig. 3e).
3.2. Electrochemical activity of Nd2O3@MIL(Fe)-88A
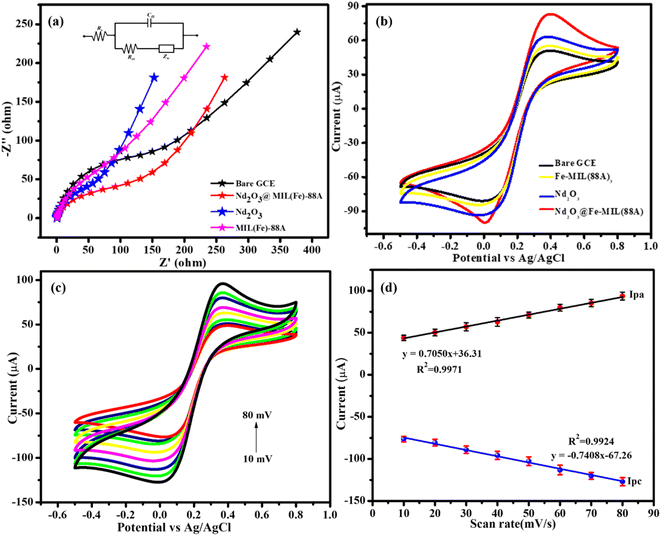
To find out the electrocatalytic properties of DDVP, the electrochemical properties of unmodified GCE, Nd2O3, MIL(Fe)-88A, and Nd2O3@MIL(Fe)-88A modified electrodes must be investigated. Electrochemical Impedance Spectroscopy (EIS) was used to assess the electrode–electrolyte interfaces and charge transfer resistance of unmodified and modified electrodes.47,48 Fig. 4a shows the EIS spectra of the bare GCE, MIL(Fe)-88A/GCE, Nd2O3/GCE and Nd2O3@MIL(Fe)-88A/GCE in KCl (0.1 M) with [Fe(CN)6]3−/4−(0.01 M) mixture, with the frequency range applied from 0.1 Hz to 100 kHz and fixed AC applied potential to be 10 mV. The equivalent semicircle was fitted by a Nyquist plot. From Fig. 4a, Rct values detected for the bare GCE, MIL(Fe)-88A/GCE, Nd2O3/GCE, and Nd2O3@MIL(Fe)-88A/GCE are about 131.7, 105.2, 98.6 and 95.7 Ω, respectively. When compared to the above mentioned other modified electrodes, the bare GCE displays a huge semicircle with a very high resistance value of 131.7 Ω because of its poor electron transport behaviour. The charge transfer resistance value of the Nd2O3@MIL(Fe)-88A composite was 95.7 Ω, which was significantly lower than that of the other modified electrodes and bare GCE, demonstrating that the material had superior electron transfer behaviour. Utilizing both modified and bare electrodes, CV was employed to support the electron transit action and active surface area.The Randles–Sevcik equation was used to determine the active surface area of the Nd2O3@MIL(Fe)-88A composite electrode.
| Ip = (2.69 × 10⁵) n3/2ACD1/2ν1/2 | (1) |
Ip is the peak current response, n is the number of electrons engaged in the electron transfer, A is the active surface area, C is the concentration, D is the diffusion coefficient of the electrolyte system, and ν1/2 is the sweep rate. By using eqn (1), the active surface area was calculated to be 0.045, 0.077, 0.128 and 0.166 cm2 for the bare GCE, MIL(Fe)-88A, Nd2O3 and Nd2O3@MIL(Fe)-88A, respectively. The above findings show that the Nd2O3@MIL(Fe)-88A composite exhibited good electrochemical properties and a larger electroactive surface area. So, it was a suitable option for an electrochemical study.
3.3. CV investigation of the Nd2O3@MIL(Fe)-88A modified electrode
Electrochemical investigations are carried out using a three-electrode system, where Nd2O3@MIL(Fe)-88A/GCE acts as the working electrode, Pt acts as the counter electrode and saturated Ag/AgCl acts as the reference electrode in an aqueous solution of 0.1 M phosphate buffer (PB) solution being employed as the electrolyte. The stock of PB solution was prepared from the mixture of sodium phosphate dibasic, sodium phosphate monobasic and water. Electrochemical characteristics of MIL(Fe)-88A/GCE, Nd2O3/GCE and Nd2O3@MIL(Fe)-88A/GCE modified electrodes were investigated under CV analysis and similarly, the bare GCE electrode was analysed before modification on electrodes for comparison with modified electrodes. Fig. 4b shows the cyclic voltammograms of the bare GCE, MIL(Fe)-88A/GCE, Nd2O3/GC, and Nd2O3@MIL(Fe)-88A/GCE electrodes in 0.1 M PB (pH = 7.0) solution in the presence of 0.01 M DDVP scanned between within the potential range of −0.5 V and 0.8 V at a fixed sweep scan rate of 50 mV s−1. It can be observed from Fig. 4b that the bare GCE shows a redox peak with low intensity. On the contrary after modification with MIL(Fe)-88A/GCE, Nd2O3/GCE and Nd2O3@MIL(Fe)-88A/GCE a prominent peak appears, where an oxidation peak corresponding to DDVP oxidation is observed at 0.41 V and the reduction peak associated with the reduction of iron appears at −0.01 V. These results indicate that Fe present in the composite exhibits a reduction property. The peak current of the Nd2O3@MIL(Fe)-88A/GCE showed a sharp increase after Nd2O3 decoration, demonstrating the significant synergistic development of the Nd2O3 to MIL(Fe)-88A peak signal. In Nd2O3@MIL(Fe)-88A/GCE, MIL(Fe)-88A can provide a significant amount of active carboxyl groups in the terminal, a compact matrix for the covalent bonding of Nd2O3; thus, the surface area would permit Nd2O3 deposition. By doing this, the surface modification effect of Nd2O3@MIL(Fe)-88A/GCE was improved, whereas the electron conductivity of the prepared material was increased. These results clearly show that the Nd2O3@MIL(Fe)-88A/GCE electrode possesses higher electrocatalytic activity towards DDVP oxidation.3.4. Different scan rates
CV was used to examine the impact of the scan rate (mV s−1) on the peak current of Nd2O3@MIL(Fe)-88A/GCE in order to study the dynamics of the electron carrier system of the electrode; Nd2O3@MIL(Fe)-88A/GCE displayed a few redox waves, as seen in Fig. 4c. When the scan rate was increased from 10 to 80 mVs−1, both the anodic peak currents (Ipa) and the cathodic peak currents (Ipc) enhanced linearly, indicating the stability of the modified electrode. When graphing the peak current and scan rate, a linear response was determined, as illustrated in Fig. 4d. From Fig. 4d, the regression equation for the redox reaction of DDVP is y (Ipa) = 0.7050x + 36.31 and y (Ipc) = −0.7408x − 67.26, with coefficient (R2) values of 0.9971 and 0.9924, respectively, which indicates that it is an adsorption-controlled mechanism.3.5. Effect of pH
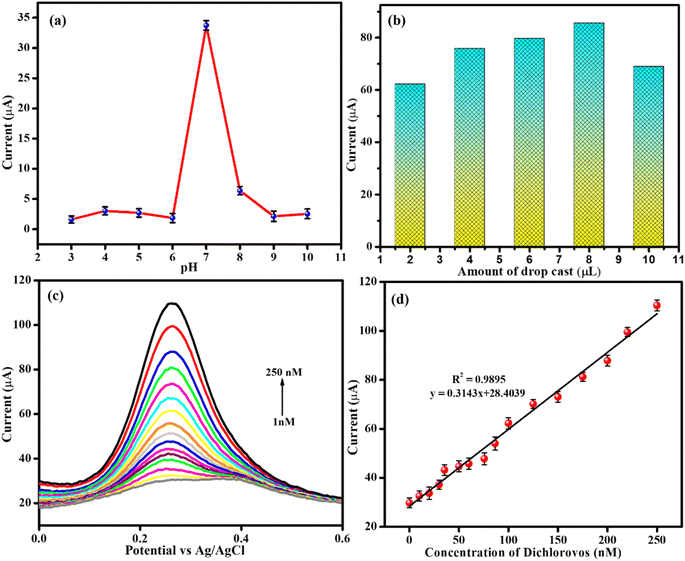
When using electrochemical sensing, pH has a significant impact on the electron exchange phenomenon. Therefore, CV was performed on the analyte in different pH ranges (3 to 10) using a Nd2O3@MIL(Fe)-88A nanostructure coated glassy carbon electrode (Fig. 5a). From Fig. 5a, the anodic peak current enhanced to a maximum at pH 7 and then gradually decreased above pH 7. This visibly displays that pH 7 was effective for the detection of DDVP. Thus, pH 7 was selected as the best pH for detection of DDVP.3.6. Effect of modifier amount
The amount of modifier on the GCE plays a vital role in the current intensity of the DDVP sensor; various amounts of modifier were studied by CV to monitor their effects on the DDVP detection. As shown in Fig. 5b, 8.0 μL is good for DDVP detection with the highest current intensity. When the modifier material amount was larger than 8.0 μL, the larger coating and film constrained the mass transport and electronic conductivity of DDVP current. When the modifier volume was less than 8.0 μL, the Nd2O3@MIL(Fe)-88A partially covered the surface of the GCE. Hence, the suitable volume of the coating Nd2O3@MIL(Fe)-88A material was selected to be 8.0 μL.3.7. Differential pulse voltammetry analysis of DDVP
DPV is a highly sensitive detection method and is regularly used to examine the detection of various biomolecules and pesticides. Fig. 5c demonstrates the DPV response of Nd2O3@MIL(Fe)-88A in the existence of 0.1 M PB solution at different concentrations of analyte (pH 7.0). As shown in Fig. 5c, the peak current increases with the increase of DDVP concentration. For the anodic peak current value and varied concentrations of DDVP, a good linear plot was achieved, shown in Fig. 5d. Ipa = 0.3143x + 28.4039 and R2 = 0.9895 were the linear regression equation and coefficient derived, respectively. The LOD was found to be 0.92 nM by using the formula LOD = 3σ/S, where “S” – slope from the calibration plot, and “σ”- standard deviation value found from the three-blank signal. Also, as shown in Table S1,† the LOD of the Nd2O3@MIL(Fe)-88A sensor for DDVP detection was compared to previously reported articles. The sensitivity of the Nd2O3@MIL(Fe)-88A composite electrode to DDVP is high (4.42 mA nM−1). The LOD and linear range of the proposed Nd2O3@MIL(Fe)-88A sensor are lesser and broader than those of previously described sensing materials, as can be observed.3.8. Effect of interferences
The selectivity of Nd2O3@MIL(Fe)-88A/GCE toward DDVP was examined by DPV in the presence of 15 nM DDVP with a 5-fold higher concentration of interferent molecules such as methyl-parathion, amitrole (chemical herbicide), deltamethrin (pyrethroid), and triazolone (triazole fungicide). The Nd2O3@MIL(Fe)-88A sensor has strong anti-interference nature for the selective determination of DDVP in the presence of other interferent molecules, as shown in Fig. S1(a).† The bar diagram of peak current response variations in the presence of various co-existing compounds is shown in Fig. S1(b).† Finally, this study confirmed that the selectivity of the Nd2O3@MIL(Fe)-88A modified electrode was not affected by the other co-existing molecules.3.9. Repeatability and stability
The repeatability test was carried out by taking three measurements with 100 nM DDVP in 0.1 M PB solution at the same Nd2O3@MIL(Fe)-88A/GCE, which retained excellent sensor response (Fig. S2a†). The RSD was calculated at ≤2.5%, showing a high repeatability nature of the developed sensor system. The bar diagram of the repeatability test is shown in Fig. S2b.† Furthermore, the storage stability of Nd2O3@MIL(Fe)-88A electrodes was tested from 0 to 5 days using a developed sensor modified electrode in response to DDVP (100 nM) (Fig. S2c†). For storage stability experiments the electrode was stored in a refrigerator at 5 °C. It demonstrates the excellent stability of the Nd2O3@MIL(Fe)-88A sensor.3.10. Pre-treatment of real samples
By measuring DDVP concentrations in real samples, the applicability of the Nd2O3@MIL(Fe)-88A/GCE sensor was evaluated. To prepare the juice extracts, the vegetable (cabbage) was initially soaked in water and afterward air-desiccated. Then, 100 g of chopped cabbage was mixed with 100 mL of PB solution (0.1 M, pH 7) at room temperature in a homogenizer. After centrifuging the cabbage homogenate at 8000 rpm for 15 minutes, the supernatant solution was collected.A fine mesh sieve was used to filter the orange juice before measurement. The orange juice was then centrifuged for 15 minutes at 8000 rpm, and the supernatants were collected and stored at 4 °C for later use. After pre-treatment, three known concentrations of DDVP (Table S2†) were spiked into the juice samples. The average recovery range was between 96–97% and 99.5–103.4% for purple cabbage and orange extracts, respectively. These recovery values show that the Nd2O3@MIL(Fe)-88A/GCE sensor can be well applied for real-sample analysis.
DDVP was detected in purple cabbage and orange extracts using the developed Nd2O3@MIL(Fe)-88A sensor. PB solution was used to dilute the samples before varying concentrations of DDVP were added (pH 7.0). DDVP displays a distinct oxidation peak at 0.26 V on the suggested Nd2O3@MIL(Fe)-88A modified electrode. DDVP was detected in purple cabbage and orange extracts at considerable levels. As indicated in Table S2,† positive recoveries are obtained, demonstrating the suggested sensor's suitability for real sample analysis.
3.11. The possible electrochemical mechanism for DDVP detection
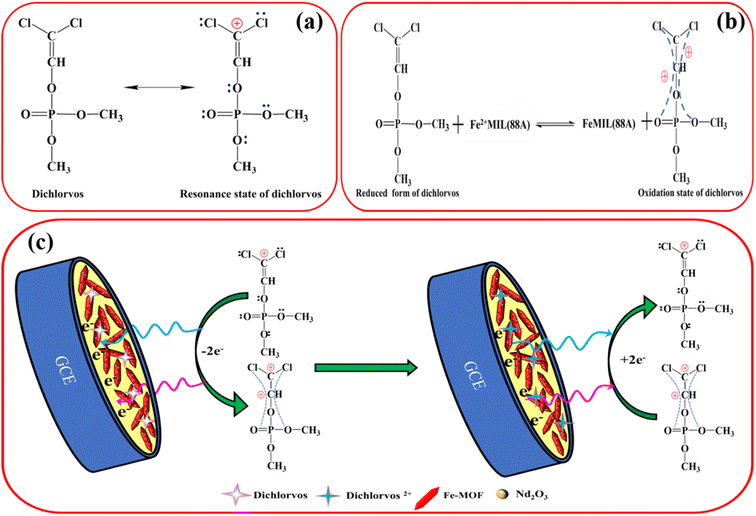
The electrochemical as well as spectral investigations outlined above may help us fully understand the mechanism underlying the DDVP detection procedure. Due to the presence of an electron withdrawing group from phosphate ester and a Cl− atom on its molecules, DDVP has a partly positive charge and has turned into an electron acceptor (Fig. 6a). Numerous π–π electrons present in Nd2O3@MIL(Fe)-88A composites may be utilized as electron donors to electrostatically receive DDVP molecules. Due to electrostatic attraction, DDVP was able to be absorbed into the surface of MIL(Fe)-88A during the initial electrode reaction, where it carried out the redox response with MIL(Fe)-88A as seen in Fig. 6b. The redox response on the electrode surface altered the redox signal, which changed the electrochemical behaviour of MIL(Fe)-88A. Nd2O3@MIL(Fe)-88A/GCE would grow enriched in DDVP as a consequence of innovative processes like hydrogen binding and electrostatic deposition. These reactions, in contrast with generating an extremely responsive action to DDVP, enhanced impedance, inhibited the electron transport between the electrode and Nd2O3@MIL(Fe)-88A, and thus yielded a sensitive response toward DDVP. Based on the study above, the reaction mechanism model between Nd2O3@MIL(Fe)-88A/GCE and DDVP is displayed in Fig. 6c.Nd2O3@MIL(Fe)-88A produced a significantly higher oxidation peak in the potential window between −0.5 and 0.8 V. This is due to the effective two electron transfer with the help of the Nd2O3@MIL(Fe)-88A composite as a good mediator, which increased the electrochemical activity. When dichlorvos is introduced into the detection system, the coordination between the composite (Nd2O3@MIL(Fe)-88A) and the phosphorus group in the dichlorvos through π-conjugation results in the formation of a Nd2O3@MIL(Fe)-88A-dichlorvos complex, which results in the easy oxidation of dichlorvos into dichlorvos2+. Thus, it produces a high intensity peak at a lower potential.
4. Conclusion
In this study, an excellent Nd2O3@MIL(Fe)-88A sensor was synthesised through the hydrothermal method to detect the DDVP pesticide. The proposed Nd2O3@MIL(Fe)-88A sensor's electrical conductivity results from the synergetic effect of Nd2O3 and MIL(Fe)-88A. The EIS spectra exhibit a very low Rct value of 95.7 Ω for Nd2O3@MIL(Fe)-88A/GCE in the applied frequency range from 0.1 Hz to 100 kHz. The active surface area of the Nd2O3@MIL(Fe)-88A sensor was found to be high, 0.166 cm2, compared to other modified sensors. The Nd2O3@MIL(Fe)-88A modified electrochemical sensor for detecting DDVP exhibited a wide linear range between 1 and 250 nM and a low detection limit of 0.92 nM with an excellent sensitivity of 4.42 mA nM−1 by the DPV technique, which is among the best values described in the literature. The relative standard deviation was calculated at ≤2.5%, showing high repeatability nature of the developed sensor system, and also the proposed DDVP sensor was successfully utilised to examine the DDVP in real samples.Conflicts of interest
The authors declare that they have no known competing financial interests or personal relationships that could have appeared to influence the work reported in this paper.Acknowledgements
The authors acknowledge the Department of Chemistry, SRM Institute of Science and Technology, Tamil Nadu – 603 203, India, for providing the necessary facilities to complete the research work.References
- W. A. Jury, A. M. Winer, W. F. Spencer and D. D. Focht, Rev. Environ. Contam. Toxicol., 1987, 119–164 CAS.
- H. U. Okoroiwu and I. A. Iwara, Interdiscip. Toxicol., 2018, 11, 129–137 CrossRef PubMed.
- R. Gandhi and S. M. Snedeker, Comments Toxicol., 2002, 8, 85–123 CrossRef CAS.
- A. Moretto, Pesticide Toxicology and International Regulation, vol. 431, 2004 Search PubMed.
- H. Karimi-Maleh, A. Ayati, S. Ghanbari, Y. Orooji, B. Tanhaei, F. Karimi, M. Alizadeh, J. Rouhi, L. Fu and M. Sillanpaa, J. Mol. Liq., 2021, 329, 115062 CrossRef CAS.
- M. A. El Salam, A. A. Hegazy, M. Elhady, G. E. Ibrahim and R. Hussein, J. Environ. Anal. Toxicol., 2017, 7, 1–5 Search PubMed.
- M. Miraki, H. Karimi-Maleh, M. A. Taher, S. Cheraghi, F. Karimi, S. Agarwal and V. K. Gupta, J. Mol. Liq., 2019, 278, 672–676 CrossRef CAS.
- F. Tahernejad-Javazmi, M. Shabani-Nooshabadi and H. Karimi-Maleh, Composites, Part B, 2019, 172, 666–670 CrossRef CAS.
- G. Zhao, B. Zhou, X. Wang, J. Shen and B. Zhao, Food Chem., 2021, 354, 129511 CrossRef CAS PubMed.
- J. Rouhi, S. Mahmud, S. D. Hutagalung and S. Kakooei, Micro Nano Lett., 2012, 7, 325 CrossRef.
- D. Du, M. Wang, J. Cai and A. Zhang, Sens. Actuators, B, 2010, 146, 337–341 CrossRef CAS.
- F. F. Donato, N. M. G. Bandeira, G. C. Dos Santos, O. D. Prestes, M. B. Adaime and R. Zanella, J. Chromatogr. A, 2017, 1516, 54–63 CrossRef CAS PubMed.
- E. Luan, Z. Zheng, X. Li, H. Gu and S. Liu, Anal. Chim. Acta, 2016, 916, 77–83 CrossRef CAS PubMed.
- G. Bolat, S. Abaci, T. Vural, B. Bozdogan and E. B. Denkbas, J. Electroanal. Chem., 2018, 809, 88–95 CrossRef CAS.
- Q. Lu, T. Zhou, Y. Wang, L. Gong and J. Liu, Biosens. Bioelectron., 2018, 99, 274–280 CrossRef CAS PubMed.
- M. P. N. Bui and A. Abbas, Sens. Actuators, B, 2015, 207, 370–374 CrossRef CAS.
- B. M. Hryniewicz, E. S. Orth and M. Vidotti, Sens. Actuators, B, 2018, 257, 570–578 CrossRef CAS.
- P. Salazar, M. Martín, J. L. González-Mora and A. R. Gonzalez-Elipe, Talanta, 2016, 146, 410–416 CrossRef CAS PubMed.
- B. Thirumalraj, A. Krishnapandi, S. M. Chen, S. M S P and H. Choe, ACS Sustainable Chem. Eng., 2020, 8, 17882–17892 CrossRef CAS.
- S. Li and F. Huo, Nanoscale, 2015, 7, 7482–7501 RSC.
- Y. S. Li, H. Bux, A. Feldhoff, G. L. Li, W. S. Yang and J. Caro, Adv. Mater., 2010, 22, 3322–3326 CrossRef CAS PubMed.
- M. Gimenez-Marques, T. Hidalgo, C. Serre and P. Horcajada, Coord. Chem. Rev., 2016, 307, 342–360 CrossRef CAS.
- A. V. Munde, B. B. Mulik, R. P. Dighole, S. C. Dhawale, L. S. Sable, A. T. Avhale and B. R. Sathe, Electrochim. Acta, 2021, 394, 139111 CrossRef CAS.
- A. Schneemann, V. Bon, I. Schwedler, I. Senkovska, S. Kaskel and R. A. Fischer, Chem. Soc. Rev., 2014, 43, 6062–6096 RSC.
- J. Wang, J. Wan, Y. Ma, Y. Wang, M. Pu and Z. Guan, RSC Adv., 2016, 6, 112502–112511 RSC.
- T. Chalati, P. Horcajada, R. Gref, P. Couvreur and C. Serre, J. Mater. Chem., 2011, 21, 2220–2227 RSC.
- F. Longobardi, M. Solfrizzo, D. Compagnone, M. Del Carlo and A. Visconti, J. Agric. Food Chem., 2005, 53, 9389–9394 CrossRef CAS PubMed.
- A. C. McKinlay, J. F. Eubank, S. Wuttke, B. Xiao, P. S. Wheatley, P. Bazin, J. C. Lavalley, M. Daturi, A. Vimont, G. De Weireld, P. Horcajada, C. Serre and R. E. Morris, Chem. Mater., 2013, 25, 1592–1599 CrossRef CAS.
- S. Chevalier, G. Bonnet and J. P. Larpin, Appl. Surf. Sci., 2000, 167, 125–133 CrossRef CAS.
- W. Yang, Y. Qi, Y. Ma, X. Li, X. Guo, J. Gao and M. Chen, Mater. Chem. Phys., 2004, 84, 52–57 CrossRef CAS.
- H. Yang, L. Zhao, X. Yang, L. Shen, L. Yu, W. Sun, Y. Yan, W. Wang and S. Feng, J. Magn. Magn. Mater., 2004, 271, 230–236 CrossRef CAS.
- S. Shylesh, T. Radhika, K. S. Rani and S. Sugunan, J. Mol. Catal. A: Chem., 2005, 236, 253–259 CrossRef CAS.
- S. Biswas, H. Naskar, S. Pradhan, Y. Wang, R. Bandyopadhyay and P. Pramanik, Talanta, 2020, 206, 120176 CrossRef CAS PubMed.
- B. B. Mulik, A. V Munde, R. P. Dighole and B. R. Sathe, J. Ind. Eng. Chem., 2021, 93, 259–266 CrossRef CAS.
- S. M. Pourmortazavi, M. Rahimi-Nasrabadi, M. Aghazadeh, M. R. Ganjali, M. S. Karimi and P. Norouzi, J. Mol. Struct., 2017, 1150, 411–418 CrossRef CAS.
- R. P. Dighole, A. V Munde, B. B. Mulik and B. R. Sathe, Front. Chem., 2020, 8, 325 CrossRef CAS PubMed.
- K. T. Kubra, R. Sharif, B. Patil, A. Javaid, S. Shahzadi, A. Salman, S. Siddique and G. Ali, J. Alloys Compd., 2020, 815, 152104 CrossRef CAS.
- R. El Asmar, A. Baalbaki, Z. Abou Khalil, S. Naim, A. Bejjani and A. Ghauch, Chem. Eng. J., 2021, 405, 126701 CrossRef CAS.
- E. Bagherzadeh, S. M. Zebarjad, H. R. Madaah Hosseini and P. Chagnon, CrystEngComm, 2019, 21, 544–553 RSC.
- X. Liao, F. Wang, F. Wang, Y. Cai, Y. Yao, B. T. Teng, Q. Hao and L. Shuxiang, Appl. Catal., B, 2019, 259, 118064 CrossRef CAS.
- E. Bagherzadeh, S. M. Zebarjad and H. R. M. Hosseini, Eur. J. Inorg. Chem., 2018, 2018, 1909–1915 CrossRef CAS.
- D. Yu, L. Li, M. Wu and J. C. Crittenden, Appl. Catal., B, 2019, 251, 66–75 CrossRef CAS.
- B. Shahmoradi, K. Soga, S. Ananda, R. Somashekar and K. Byrappa, Nanoscale, 2010, 2, 1160 RSC.
- M. Fu, B. Chai, J. Yan, C. Wang, G. Fan, G. Song and F. Xu, Appl. Phys. A, 2021, 127, 1 CrossRef.
- A. Wahid, A. M. Asiri and M. M. Rahman, Appl. Surf. Sci., 2019, 487, 1253–1261 CrossRef CAS.
- X. Li, Y. Pi, L. Wu, Q. Xia, J. Wu, Z. Li and J. Xiao, Appl. Catal., B, 2017, 202, 653–663 CrossRef CAS.
- G. Ren, K. Zhao and L. Zhao, RSC Adv., 2020, 10, 39973–39980 RSC.
- R. P. Dighole, A. V Munde, B. B. Mulik, S. S. Zade and B. R. Sathe, New J. Chem., 2022, 46, 17272–17281 RSC.
Footnote |
| † Electronic supplementary information (ESI) available. See DOI: https://doi.org/10.1039/d2ra07877e |
| This journal is © The Royal Society of Chemistry 2023 |

